an assessment of the construct validity …hauser/springer_hauser_pwb_ms...1 an assessment of the...
TRANSCRIPT
1
AN ASSESSMENT OF THE CONSTRUCT VALIDITY OF RYFF’S SCALES OF
PSYCHOLOGICAL WELL-BEING: METHOD, MODE AND MEASUREMENT EFFECTS
Kristen W. Springer Robert M. Hauser
INSTITUTIONAL AFFILIATION: University of Wisconsin-Madison Department of Sociology and Center for Demography of Health and Aging *The research reported herein was supported by the National Institute on Aging (R01 AG-9775 and P01-AG21079), by the William Vilas Estate Trust, and by the Graduate School of the University of Wisconsin-Madison. Computation was carried out using facilities of the Center for Demography and Ecology at the University of Wisconsin-Madison, which are supported by Center Grants from the National Institute of Child Health and Human Development and the National Institute on Aging. We thank Corey Keyes for reading an early draft, sharing data and code from Ryff and Keyes (1995), and most of all for his collaborative spirit. We thank Carol Ryff for offering useful information about the construction of well-being measures at an early stage of this project. We thank Dirk van Dierendonck for sharing the factor correlations from his 2004 Personality and Individual Differences paper, Nora Cate Schaeffer for discussions of mode effects, Tetyana Pudrovska for her keen editing of Table 2b, and Joe Savard for technical assistance. We also appreciate the constructive comments of two anonymous SSR reviewers. An earlier version of the paper was presented at the annual meetings of the Population Association of America, 2003. The opinions expressed herein are those of the authors. The WLS, MIDUS, and NSFH II data used in these analyses are publicly available at the following websites: http://www.ssc.wisc.edu/wlsresearch/ (WLS) and http://www.icpsr.umich.edu/access/index.html (MIDUS and NSFH). Address correspondence to: Kristen W. Springer University of Wisconsin-Madison 8128 Social Science 1180 Observatory Drive Madison, Wisconsin 53706 e-mail: [email protected] 608-262-5831 (work) 608-265-5389 (fax)
2
AN ASSESSMENT OF THE CONSTRUCT VALIDITY OF RYFF’S SCALES OF PSYCHOLOGICAL WELL-BEING:
METHOD, MODE AND MEASUREMENT EFFECTS ABSTRACT
This study assesses the measurement properties of Ryff's Scales of Psychological
Well-Being (RPWB) – a widely-used instrument designed to measure six dimensions of
psychological well-being. Analyses of self-administered RPWB data from three major
surveys – Midlife in the United States (MIDUS), National Survey of Families and
Households II (NSFH), and the Wisconsin Longitudinal Study (WLS) – yielded very
high overlap among the dimensions. These large correlations persisted even after
eliminating several methodological sources of confounding, including question wording,
question order, and negative item wording. However, in MIDUS pretest and WLS
telephone administrations, correlations among the dimensions were much lower. Past
research demons trates that self-administered instruments provide more valid
psychological measurements than telephone surveys, and we therefore place more weight
on the consistent results from the self-administered items. In sum, there is strong
evidence that RPWB does not have as many as six distinct dimensions, and researchers
should be cautious in interpreting its subscales.
KEY WORDS: psychological well-being, well-being, measurement, survey design,
polychoric correlations, factor analysis
3
AN ASSESSMENT OF THE CONSTRUCT VALIDITY OF RYFF’S SCALES OF PSYCHOLOGICAL WELL-BEING:
METHOD, MODE AND MEASUREMENT EFFECTS
Health researchers have long moved past looking at mortality as the only health-
related measure to examine a range of outcomes including morbidity, disability, quality
of life, and psychological well-being (PWB). Mental health research has often focused
on negative health—for example on depression and anxiety. However, there is an
increasing desire to examine positive as well as negative aspects of mental health. Much
of this research has drawn from the rich well of psychological literature on well-being.
Well-being has been studied extensively by social psychologists (Campbell 1981;
Ryan and Deci 2001). While the distinct dimensions of well-being have been debated,
the general quality of well-being refers to optimal psychological functioning and
experience. Two broad psychological traditions have historically been employed to
explore well-being. The hedonic view equates well-being with happiness and is often
operationalized as the balance between positive and negative affect (Ryan and Deci 2001;
Ryff 1989b). The eudaimonic perspective, on the other hand, assesses how well people
are living in relation to their true selves (Waterman 1993).
There is not a standard or widely accepted measure of either hedonic or
eudaimonic well-being, although commonly used instruments include Bradburn’s Affect
Balance (1969), Neugarten’s Life Satisfaction Index (1961), Rosenberg’s self-esteem
scale (1965), and a variety of depression instruments (Bradburn and Noll 1969;
Neugarten, Havinghurst, and Tobin 1961; Rosenberg 1965). In addition, some scholars
have pointed to the multidimensionality of well-being and believe that instruments should
4
encompass both hedonic and eudaimonic well-being (Compton, Smith, Cornish, and
Qualls 1996; McGregor and Little 1998; Ryan and Deci 2001).
CONCEPTUALIZING A MULTIDIMENSIONAL MODEL OF WELL-BEING
Carol Ryff has argued in several publications that previous perspectives on
operationalizing well-being are atheoretical and decentralized (Ryff 1989a; Ryff 1989b).
To address this shortcoming, she developed a new measure of psychological well-being
that consolidated previous conceptualizations of eudaimonic well-being into a more
parsimonious summary. The exact methods used to develop this measure and the specific
theoretical foundations underlying each dimension have been thoroughly discussed
elsewhere (Ryff 1989a; Ryff 1989b). Briefly, Ryff’s scales of psychological well-being
(RPWB) include the following six components of psychological functioning: a positive
attitude toward oneself and one’s past life (self-acceptance), high quality, satisfying
relationships with others (positive relations with others), a sense of self-determination,
independence, and freedom from norms (autonomy), having life goals and a belief that
one’s life is meaningful (purpose in life), the ability to manage life and one’s
surroundings (environmental mastery), and being open to new experiences as well as
having continued personal growth (personal growth).1
RPWB was originally validated on a sample of 321 well-educated, socially-
connected, financially-comfortable and physically healthy men and women (Ryff 1989b).
In this study a 20- item scale was used for each of the six constructs, with approximately
equal numbers of positively and negatively worded items. The internal consistency
coefficients were quite high (between 0.86 and 0.93) and the test-retest reliability
5
coefficients for a subsample of the participants over a six week period were also high
(0.81-0.88).
Examining the intercorrelations of RPWB subscales provides a cursory test of the
multidimensionality of RPWP. In Ryff’s (1989b) article, the subscale intercorrelations
ranged from 0.32 to 0.76. The largest correlations were between self-acceptance and
environment mastery (0.76), self-acceptance and purpose in life (0.72), purpose in life
and personal growth (0.72), and purpose in life and environmental mastery (0.66).2 As
noted in the paper, these high correlations can indicate a problem because: “as the
coefficients become stronger, they raise the potential problem of the criteria not being
empirically distinct from one another” (Ryff, 1989b p. 1074). However, the authors point
to differential subscale age variations as evidence that the dimensions are distinct – an
issue that we are investigating elsewhere (Pudrovska, Hauser, and Springer 2005).
More rigorous tests of the theoretically-proposed multidimensional model of
RPWB require analytic techniques beyond scale intercorrelations. Ryff and Keyes
(1995) addressed this issue using Midlife in the United States (MIDUS) pretest data—a
national probability sample of 1108 men and women. Rather than testing the full scale,
the authors selected 3 of the original 20 items in each subscale “to maximize the
conceptual breadth of the shortened scales.” They report that “the shortened scales
correlated from 0.70 to 0.89 with 20- item parent scales. Each scale included both
positively and negatively phrased items” (p. 720). Respondents were interviewed by
telephone, and RPWB items were administered using an unfolding technique—where
respondents were first asked if they agreed or disagreed with the statement and then were
asked whether their (dis)agreement was strong, moderate, or slight. Ryff and Keyes
6
(1995) estimated confirmatory factor models by weighted least squares estimation in
LISREL based on variance/covariance matrices produced by PRELIS to account for the
non-normality of the data (Jöreskog, Sörbom, and SPSS Inc 1988). However, the authors
did not use polychoric correlation matrices; that is, they analyzed all variables as if they
were continuous, not ordinal. They estimated several models including a single-factor
model, a six-factor model (with factors corresponding to the proposed dimensions) and a
second-order factor model with the six sub-dimensional well-being factors loading onto a
general well-being factor. In addition, Ryff and Keyes (1995) assessed the effect of
negative item wording and positive item wording on general well-being, though not in the
six-factor or second-order six-factor model. Although none of their models yielded a
satisfactory fit by conventional measures, the Bayesian Information Criterion (BIC) was
consistently a large negative number, indicating satisfactory model fit (Raftery 1995).
The authors concluded that a second-order factor model is the best fitting model (Ryff
and Keyes 1995). However there are some large correlations between their latent
variables, indicating conceptual overlap among the subscales. The largest correlation,
0.85, is between environmental mastery and self-acceptance, suggesting that these factors
are largely measuring the same concept. The correlation of 0.85 means that 85 percent of
the variance in these two constructs is in common (Jensen 1971).
In defense, the authors note that these two concepts have different age profiles,
thus indicating that they may be distinct at different stages of the life course. However,
that life-course interpretation was not actually tested because the age variation occurred
in a cross-section sample, not in repeated observations. Ryff and Keyes’ (1995)
7
estimates of correlations among the six latent dimensions of RPWB are reproduced in
Table 1.
--Table 1 About Here—
In addition to Ryff and Keyes (1995), other scholars have also explored the
measurement properties of RPWB in diverse samples. For example, a study by Clarke et
al. (2001) used the Canadian Study of Health and Aging to examine the structure of
RPWB in an older sample (average age was 76) (Clarke, Marshall, Ryff, and Wheaton
2001). The authors used the same 18 items as Ryff and Keyes (1995), but the items were
administered orally in the home using a cue card and analyzed using EQS with maximum
likelihood estimation (personal communication with Liz Sykes, 03/24/03). They began
with a single-factor model, adding factors in a consistent manner while assessing the
model fit at each stage. The authors found that a six-factor model fit better than models
with fewer factors, but the best fitting model was a modified six-factor model that
allowed four items (one each from four dimensions) to load on their specified dimension
and on another dimension. The factor correlations in the pure six-factor model ranged (in
absolute value) from small to quite substantial (0.03 to 0.67). The authors conclude that
their analyses “support the multidimensional structure of the Ryff measure” (p. 86). The
authors also note that results from their modified six-factor model suggest areas for
improvement in the 18 item model.
Not all structural analyses provide support for the multidimensionality of RPWB
(Hillson 1997; Kafka and Kozma 2002; van Dierendonck 2004). For example, Kafka and
8
Kozma (2002) examined RPWB, the Satisfaction with Life Scale (SWLS), and the
Memorial University of Newfoundland Scale of Happiness (MUNSH) in a sample of 277
participants ranging from 18-48 years old. Their version of RPWB contained the full set
of items (20 per subscale) and was administered to university students in a self-report
questionnaire. The authors used principal-components analysis with varimax rotation.
When the number of factors was not specified, 15 factors were extracted. However,
when the authors limited the scale to six factors the factors did not correspond to the six
dimensions of RPWB. In an additional test the authors examined a factor model with
SWLS, MUNSH and each dimension of RPWB. They extracted three factors with
eigenvalues greater than 1. The first factor had loadings above 0.60 for four RPWB
scales (environmental mastery, self-acceptance, purpose in life, personal growth) and
accounted for almost one-half the variance. The second factor was primarily the
MUNSH and SWLS, though environmental mastery and self-acceptance also had
loadings above 0.40 on this dimension. The final factor had a loading of over 0.80 for
autonomy and personal relations. The authors conclude by saying “it would appear that
the structure of RPWB3 is limited to face validity” (p. 186).
Van Dierendonck (2004) examined the factorial structure of a self-administered
version of RPWB in two Dutch samples—a group of 233 college students with a mean
age of 22 years old and a group of 420 community members with a mean age of 36 years
old. Van Dierendonck compared model fit and factorial structure of 3, 9 and 14- item
subscales of RPWB using LISREL 8.5 with covariance matrices and maximum
likelihood estimation. The author found that across both samples, for all subscale sizes,
the best fitting model was a six-factor model with a single second-order factor. However
9
for the three- item scale in one of the samples, a second-order five-factor model (with
environmental mastery and self-acceptance together) did not fit significantly worse than
the second-order six-factor model. Only the version with three items per subscale, which
had relatively low internal consistency, fit reasonably well. Even there, modification
indices suggested allowing some items to load on two dimensions. According to Van
Dierendonck, “the conclusions from the reliability analyses and the confirmatory factor
analyses are ambiguous. To reach an acceptable internal consistency, scales should be
longer, whereas an (somewhat) acceptable factorial validity requires the scales to be
short” (p. 636). Van Dierendonck found very high factor correlations among self-
acceptance, purpose in life, environmental mastery and personal growth, indicating
substantial overlap among these dimensions (personal communication with Dirk van
Dierendonck, 7/26/04).
RPWB has been administered in major studies, for example, the National Survey
of Families and Households II (NSFH II), the National Survey of Midlife in the United
States (MIDUS), the Wisconsin Longitudinal Study (WLS), and the Canadian Study of
Health and Aging (CSHA). In addition, the paper in which RPWB was developed (Ryff
1989b) has been cited in more than 400 research papers. While many studies focus on
the composite scale of RPWB, previous studies have modeled sub-dimensions of positive
mental health operationalized as the separate subscales of RPWB — as if they are
distinct, independent concepts (Marks 1996; Marks 1998). Given the substantive
importance and wide-spread use of RPWB, as well as the fact that some studies treat
RPWB subscales as distinct, it is important to understand the measurement properties of
RPWB. There is mixed evidence about the dimensionality of RPWB, so it is surprising
10
that the factorial structure of RPWB has not been examined systematically in any of the
large, widely-used U.S. surveys. Finally, the key study of the measurement of RPWB
was conducted on items administered by telephone (Ryff and Keyes 1995), whereas most
large-scale studies using this measure have been self-administered using paper and
pencil.
The present project explores the measurement properties of RPWB in self-
administered mail surveys of the WLS, MIDUS, and NSFH II and telephone data from
the WLS. We start by examining the measurement properties of RPWB using the WLS
mail data. The WLS is a particularly useful sample in which to explore RPWB because:
(a) the sample is large, and 6282 graduates answered all of the mail questions in 1992-
1993, (b) almost all of the graduates were born in 1939, so we have a unique opportunity
to look at how RPWB works for individuals at midlife, and (c) the WLS administered
RPWB items both by telephone and mail, thus allowing us to explore mode effects.
In order to test the validity of our results and examine possible confounders, we
employ a variety of tests. First, using the WLS mail data, we explore whether
measurement artifacts (negative wording and question ordering) could be driving our
findings. We then turn to NSFH II and MIDUS to explore the generality of the WLS
findings and to test whether the WLS results are artifacts of age truncation, educational
truncation, a primarily white sample, item selection, or something geographically distinct
about Wisconsin. Finally, we assess mode effects by analyzing the WLS telephone data.
11
DATA
Items from RPWB were included in the WLS mail and telephone instruments,
MIDUS mail, and NSFH II mail instruments. Before going into each study in detail, an
overview is warranted. It is important to point out the differences and similarities in
order to fully assess the why the measurement properties of RPWB may vary across
samples. Table 2 shows which items were asked on each survey, how they were worded,
how they were introduced, the order in which they were asked, and what response
categories were used. NSFH II and MIDUS contain the same 18 items—with some slight
wording differences, and those same items were administered by telephone in the
MIDUS pretest that was used by Ryff and Keyes (1995). The WLS mail instrument
contains 6 of the 18 NSFH/MIDUS items in addition to 36 other items. The WLS
telephone instrument contains the remaining 12 of the 18 NSFH/MIDUS items. Also,
note that the response categories are not identical across the surveys. The variability of
RPWB across these studies, in terms of question wording, number of items, item
selection, and item ordering provides an ideal situation to explore the structure of RPWB.
If consistent results are found across these several survey designs, we can be more
confident that our findings are due to a property of the scale, rather than something
unique about a specific sample or mode of administration.
--Table 2 About Here--
12
WLS
The WLS has followed a random sample of 10,317 men and women who
graduated in 1957 from Wisconsin high schools (Sewell, Hauser, Springer, and Hauser
2004). Respondents were surveyed in 1957 and then again in 1975. In 1977 the study
design was expanded to collect information similar to the 1975 survey for a highly
stratified, random subsample of approximately 2000 siblings of the graduates. Between
1992 and 1994 another major wave of data collection was undertaken. This included
follow-up interviews with living graduates and with an expanded sample of siblings.
Briefly, the WLS now has active samples of 8500 WLS graduates out of 9750 survivors
and 5300 of their siblings. We report analyses for WLS graduates in this paper, but
analyses of the sibling data yielded essentially the same findings. WLS participants
mirror the racial composition of the population of Wisconsin high school graduates in
1957 and as such are almost all white and non-Hispanic.
Items from RPWB were included in the 1992-1993 telephone interview and mail
survey. The mail survey contained seven items for each subscale, yielding a total of 42
items (see Table 2b). In the mail survey all six constructs of RPWB included items with
reversed scales. The order of the items in the mail survey generally follow the pattern of
asking one item from each of the constructs in the following order: autonomy (aut),
environmental mastery (env), personal growth (grow), positive relations (rel), purpose in
life (purp), and self-acceptance (acc). Six sets of sequential questions ask items in this
order. These six sets are split up by items from the remaining seventh set. For example
questions 1-21 covered the following constructs: aut, env, grow, rel, purp, acc, aut, aut,
env, grow, rel, purp, acc, env, aut, env, grow, rel, purp, acc, grow, etc. where the
13
italicized items are those in between the set of six constructs. Note that these “splitter”
items are in the same order as the six groups of constructs. Therefore, two items from the
autonomy construct and two items from the self-acceptance construct are adjacent in the
mail survey. Participants in the mail survey were given a six point scale ranging from
strongly agree to strongly disagree.
Responses to all of the items are highly skewed. A variety of transformations
were attempted to help create a normal distribution; however, the significant skew
warranted more extensive treatment which will be described in the methods section. To
explore the possibility of artificial answers (outliers) we checked for cases where people
answered all questions with a six or all questions with a one. Given that many of the
items are reverse coded, this seems implausible and would be highly suspicious. We did
not find any cases where this occurred. There were 6875 respondents who responded to
at least some of the RPWB items, and a total of 6282 respondents have complete data for
all mail items.
The WLS telephone instrument contains 2 items from each scale for a total of 12
RPWB items. These items are different from those asked in the mail questionnaire. The
two positive relations items were both negatively worded, and the two self-acceptance
items were both positively worded. The four other subscales contained one positively
and one negatively worded item. The items were ordered randomly (see Table 2b). An
unfolding technique (Groves 1989) was used during the telephone interview. As in the
MIDUS pretest, participants were first asked whether they agreed or disagreed with the
statement and then asked about the intensity of this belief (strong, moderate, or slight).
There were 6038 respondents with complete data on RPWB telephone items, which were
14
administered in a random 80 percent of the WLS interviews. As with WLS mail items
we checked to see if anyone answered all ones or all sevens, but found that no one had
done so. Interestingly, the distribution of the responses was bimodal and skewed, likely
reflecting the use of the unfolding technique.
MIDUS
MIDUS is a multistage probability sample of more than 3000 non-
institutionalized adults between the ages of 25 and 74 years old. Participants were
selected based on random-digit dialing and were administered a telephone interview as
well as two mail-back questionnaires. Data were collected during 1994 and 1995.
RPWB was included in one of the mail questionnaires and contained 18 items in what
appears to be a random order (see Table 2b). Response choices ranged from 1 to 7 (agree
strongly, agree somewhat, agree a little, don’t know, disagree a little, disagree somewhat,
and disagree strongly). As with the WLS, we looked for outliers and found that one
person chose answer “1” for all items. This individual was removed from the analyses.
For the current project the mid-point “don’t know” category was recoded as missing data
and the remaining categories were recoded from 1 to 6. There were 2731 cases with
complete RPWB data. The majority of the items were unimodal and all were skewed to
the left—that is most responses were positive.
NSFH II
The NSFH began in 1987-1988 with a national sample of more than 10,000
households. In each household, a randomly selected adult was interviewed. The five
15
year follow-up was conducted in 1992 to 1994 and included data collection from 10,000
respondents, 5600 interviews with spouses/partners, 2400 interviews with children, and
3300 interviews with parents. The focus of this project is on the main respondents.
RPWB was included in the self-administered health module completed during an in home
interview. RPWB contained the same 18 items as MIDUS arranged in a seemingly
random order, though in a different order than MIDUS (see Table 2b). As with the WLS,
we checked for outliers in the data and found that 12 people answered either all sixes or
all ones. These people were removed from the analyses leaving 9240 NSHF II cases with
complete data. The majority of the items were unimodal and all were skewed to the
left—that is most responses were positive.
METHODS
Our strategy for exploring the structure of RPWB was to begin with the WLS
mail data, systematically assessing the model fit and correlations of factors for a series of
models starting with the single-factor model. Then, in order to test possible confounders
and explanations for our findings, we ran a series of validity checks including tests for
methodological artifacts, age truncation, instrumentation issues, item selection problems,
and cultural variation using WLS, NSFH II, and MIDUS mail data as well as WLS
graduate telephone data.
In order to explore the structural relationship of the items with their conceptual
dimensions we estimated confirmatory factor models using LISREL (Jöreskog, Sörbom,
and SPSS Inc 1996a).4 However, LISREL may produce biased estimates if the variables
are ordinal or non-normal. In this case it is necessary to provide LISREL with polychoric
16
correlation matrices and asymptotic variance/covariance matrices rather than simple
covariance or correlation matrices. In order to calculate polychoric correlations, PRELIS
(Jöreskog, Sörbom, and SPSS Inc 1996b) treats each ordinal or non-normal variable as a
crude measurement of an underlying, unobservable, continuous variable. In the case of
ordinal data, these unobservable variables have a multivariate normal distribution and
polychoric correlations are estimates of the correlations among the hypothetical, normally
distributed, underlying variables. We used PRELIS to estimate the polychoric
correlations for all models. After obtaining the polychoric correlations and the
asymptotic variance/covariance matrix, we used weighted least squares estimation in
LISREL to obtain parameter estimates and model fit statistics. In addition to examining
minimum fit chi-square statistics, we used BIC to assess model fit (Raftery 1995). BIC
statistics are a commonly used model fit statistic, which account for sample size and
allow comparison of non-nested models. Smaller values of BIC represent better fitting
models—with negative values preferred. Specifically, when comparing models, a BIC
difference of ten or more provides very strong support for selecting the model with the
smallest BIC value (Raftery 1995).
FINDINGS
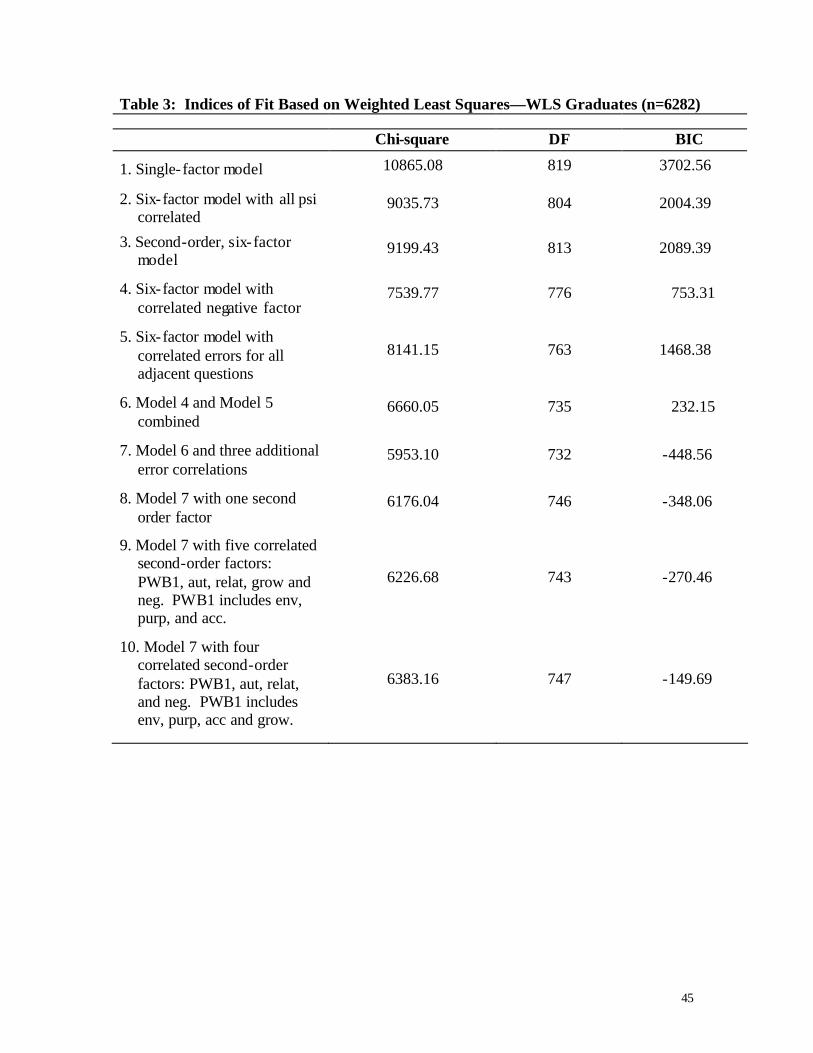
WLS Graduate Mail Items
In order to have a baseline we started out by running a single-factor model—a
model with all indicators loading on one common factor. As shown in Table 3, the fit for
Model 3-1 is very poor both by chi-square and BIC standards. We next ran a six-factor
model (with factors corresponding to the proposed dimensions) allowing the latent
17
variables to correlate (Model 3-2). This model fits very well compared to the single-
factor model; chi-square is 9036 with 804 degrees of freedom. We next ran the second-
order factor model (Model 3-3); here, the six well-being sub-factors load on a general
PWB factor, and their disturbances are uncorrelated. This second-order factor model
(Model 3-3) does not fit as well as the six-factor model without a second-order factor
(Model 3-2).
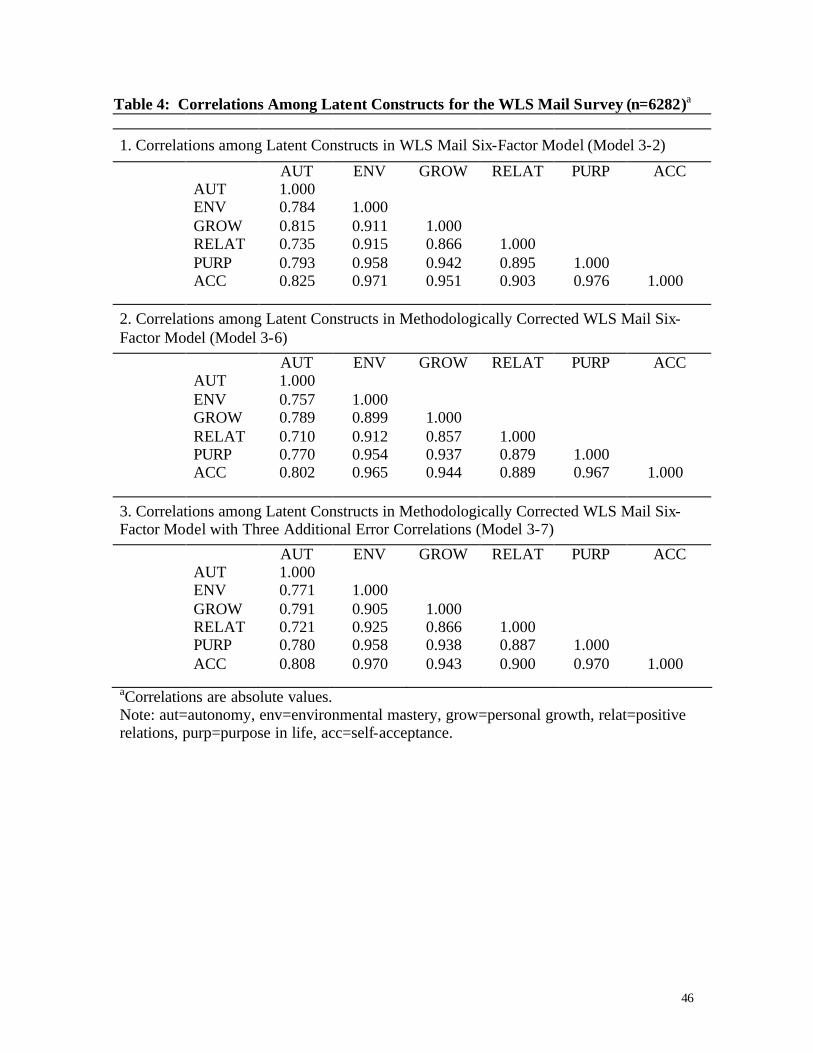
In panel 1 of Table 4 we present the correlations among latent variables in the six-
factor model (Model 3-2). There are very high correlations (in absolute value) among
latent variables—particularly between self-acceptance & purpose in life (0.976), self-
acceptance & environmental mastery (0.971), and environmental mastery & purpose in
life (0.958). Personal growth also correlated highly with self-acceptance (0.951), purpose
in life (0.958) and environmental mastery (0.908).5
--Table 3 About Here--
Testing for methodological effects
We used the best fitting model, the six-factor model (Model 3-2), as the baseline
to explore several possible methodological artifacts. First we introduced a latent variable
for negatively worded items (Model 3-4). A negatively worded item is one to which
someone must answer “strongly disagree” to indicate positive well-being. One example
from the autonomy subscale is: “I tend to worry about what other people think of me.”
To report a high degree of autonomy one would have to report strongly disagree. By
including a factor for negative wording we test whether people answer items differently
18
simply because they are worded negatively. Indeed, some researchers have found that
people provide inconsistent answers to negatively and positively worded items (Chapman
and Tunmer 1995; Marsh 1986; Melnick and Gable 1990; Pilotte and Gable 1990). To
carry out this test, we allowed all 22 negatively worded items to load on this factor as
well as on their corresponding well-being dimensions. As Model 3-4 shows, including
negative items vastly improves model fit—resulting in a reduction of 1500 chi-square and
a BIC of 753 compared to 2004 for the six-factor model. Clearly, this is the best fitting
model yet.
A second methodological artifact is correlated measurement error between
adjacent items. As explained in the data section, the RPWB items were interspersed in a
systematic manner—but probably one invisible to the participant. Nonetheless, we
hypothesized that a response to a particular question might affect responses to the
following, adjacent question. To test this, we introduced correlated errors of
measurement between all adjacent questions. The results of these analyses (Model 3-5)
indicate a substantial improvement in fit over the six-factor model.
Model 3-6 combines the two methodological effects tested in Model 3-4 and
Model 3-5. As Table 3 indicates, this model fits better than all previous models with a
chi-square of 6660 and 735 degrees of freedom, resulting in a BIC of 232. There were
three very large modification indices suggesting that the model would be substantially
improved if a few changes were made. Specifically, the model suggested correlating the
measurement error of three pairs of items. Before deciding whether or not to allow the
pairs to correlate, it was essential to determine whether there were plausible reasons for
this. We believe there are for the following reasons. First, each pair is in the same
19
RPWB subscale, suggesting we might have some items within RPWB dimensions that
overlap greatly. Second, the manifest content of the paired items is similar. The two
environment mastery questions are: “I am good at juggling my time so that I can fit
everything in that needs to get done” and “I am quite good at managing the many
responsibilities of my daily life.” The two personal relations items are: “People would
describe me as a giving person, willing to share my time with others” and “Most people
see me as loving and affectionate.” The personal growth items are: “I don’t want to try
new ways of doing things—my life is fine the way it is” and “I do not enjoy being in new
situations that require me to change my old familiar way of doing things.”
--Figure 1 about here--
After allowing these items to correlate we lost three degrees of freedom but had a
reduction of 700 chi-square—a substantial improvement in fit (see Model 3-7). This
model yields a good fit as indicated by a negative BIC (-449). This model is shown in
Figure 1. It is important to look at the correlations among latent variables in the
methodologically corrected models. Do the methodological corrections account for the
high overlap among RPWB subscales? Panels 2 and 3 in Table 4 show the latent variable
correlations for models 3-6 and 3-7 respectively. Correlations for both models are
included to enhance comparability with NSFH II and MIDUS results (presented later)
and to assess the impact of adding the three additional error correlations. As shown in
both panel 2 and panel 3 of Table 4, we still find very high factor correlations. For
example, in panel 3 of table 4 the absolute value of the correlation between purpose in
20
life & self-acceptance is (0.970), self-acceptance & environmental mastery (0.970), and
purpose in life & environmental mastery (0.958). We can therefore rule out the
possibility that three methodological artifacts – negative wording, adjacency effects, and
item redundancy – are responsible for the high correlations among the factors for these
three latent subscales.
--Table 4 about here—
Further Constraints
Using the best fitting methodologically-corrected model (Model 3-7) we also tried
several constraints to see if a simpler model would better fit the data. First we added a
second-order factor to Model 3-7 and allowed all first-order factors (including the
negative- item artifact factor) to load onto this second-order factor.6 This second-order
methodologically-corrected factor model (Model 3-8) does not fit as well as the
methodologically-corrected model where all first-order factors are allowed to correlate
freely (Model 3-7), although Model 3-8 still fits well by BIC standards (-348).
Models 3-9 and 3-10 add further constraints to Model 3-7. Given the large
correlations between environmental mastery, purpose in life, and self-acceptance we
wanted to test a model where these three sub-scales were constrained to reflect only one
factor. In Model 3-9 we constrained the disturbance variances of environmental mastery,
purpose in life, and self-acceptance to zero and allowed them all to load onto one second-
order factor. The other first-order factors (autonomy, personal relations, personal growth,
and negative item artifact) were each loaded onto their own corresponding second-order
21
factor. Model 3-9 therefore contains a total of five second-order factors which were
allowed to correlate freely—again, disturbances of the first-order factors were not
correlated. This model allowed us to test whether we can consider environmental
mastery, purpose in life and self-acceptance collectively as one dimension of RPWB after
accounting for methodological effects. Although Model 3-9 fits well as indicated by BIC
(-270), it does not fit as well as the methodologically-corrected unconstrained model
(Model 3-7). Consistent with the high latent variable correlations found in previous
models, personal growth is highly correlated (-0.947) with the second-order factor which
contains environmental mastery, purpose in life and self-acceptance in Model 3-9. For
this reason, we estimated Model 3-10, which adds personal growth into the combined
second-order factor, resulting in four freely correlated second-order factors. Model 3-10
fits the poorest of the constrained models with a BIC of -146.69.
Additional Validity Checks: MIDUS and NSFH II
There are several other possible sources of the high latent variable
intercorrelations that we estimated in the WLS mail survey. Item selection is one
possibility. Specifically, it is possible that the items included in the WLS mail survey
had more conceptual overlap than other items—for example those used by Ryff and
Keyes (1995). As explained above, NSFH II and MIDUS contain the same 18 items, and
these are also the items used by Ryff and Keyes (1995). The WLS mail instrument, on
the other hand, contains only six of these items—one per dimension. Analyzing MIDUS
and NSFH II allows us to test whether the specific choice of items in the WLS accounts
for the high latent variable correlations. Analyzing MIDUS and NSFH II also allows us
22
to explore the possibility that age truncation, education truncation, limited racial
diversity, or something else that is distinctive about the Wisconsin data are driving our
results. That is, both of these national surveys cover adults of all ages, all levels of
completed schooling, and all race-ethnic groups.
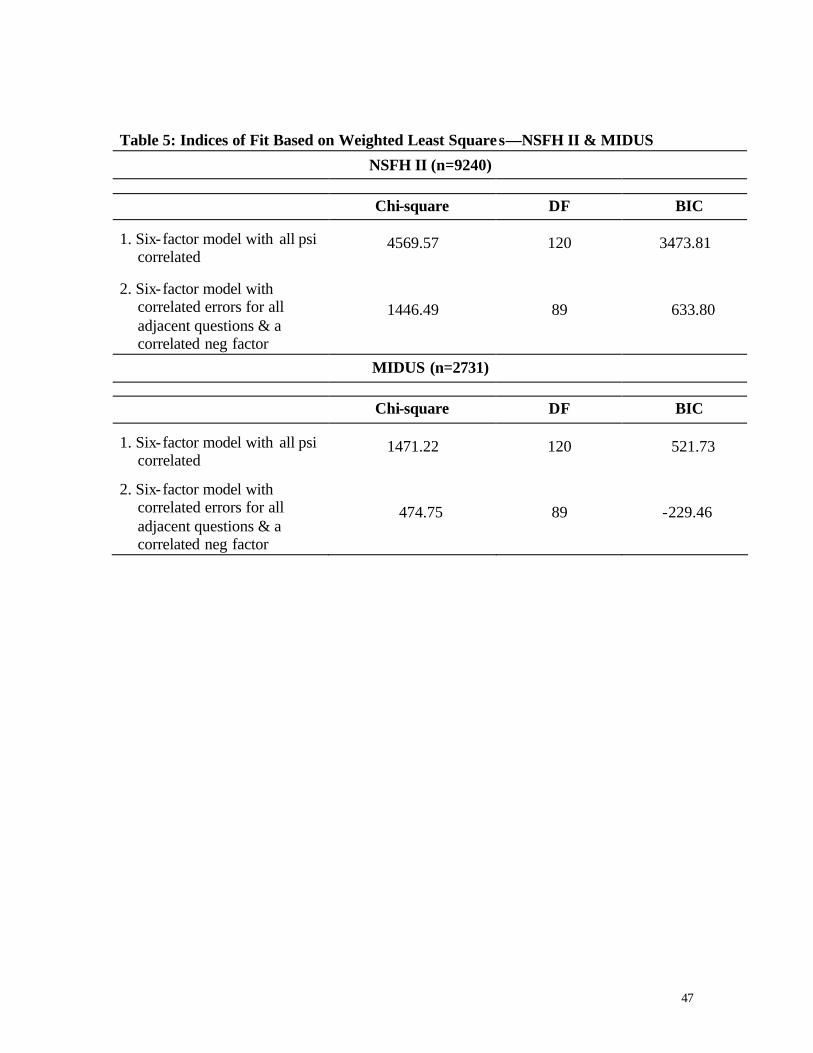
--Table 5 about here--
In order to compare NSFH II and MIDUS factor correlations with the WLS, we
first ran standard six-factor models, and then we ran models that accounted for negative
item wording and correlated adjacent- item measurement error. Table 5 contains fit
statistics for these models, which are comparable to WLS Models 3-2 and 3-6,
respectively. 7 As with the WLS, the methods corrections substantially improved the
model fit for both NSFH II and MIDUS.
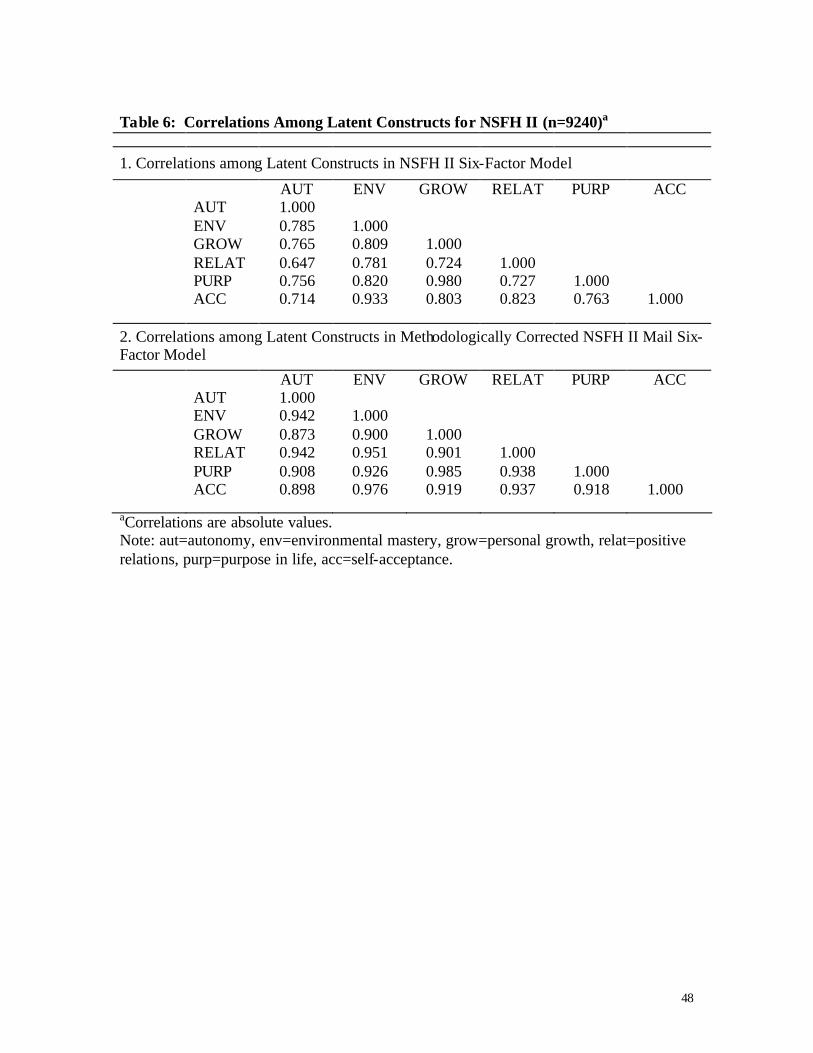
--Tables 6 and 7 about here—
Table 6 contains the latent variable correlations fo r NSFH II, and Table 7 contains
the latent variable correlations for MIDUS. As panel 1 in Table 6 shows, there are
universally large latent variable correlations using the NSFH II data with the absolute
value of the correlation between personal growth and purpose in life at 0.980 and that
between self-acceptance and environmental mastery at 0.933. In addition, after
accounting for methodological effects (see panel 2 in Table 6), the correlations among the
23
NSFH II latent variables are even larger. Specifically, all but two correlations are larger
than 0.900 in absolute value.
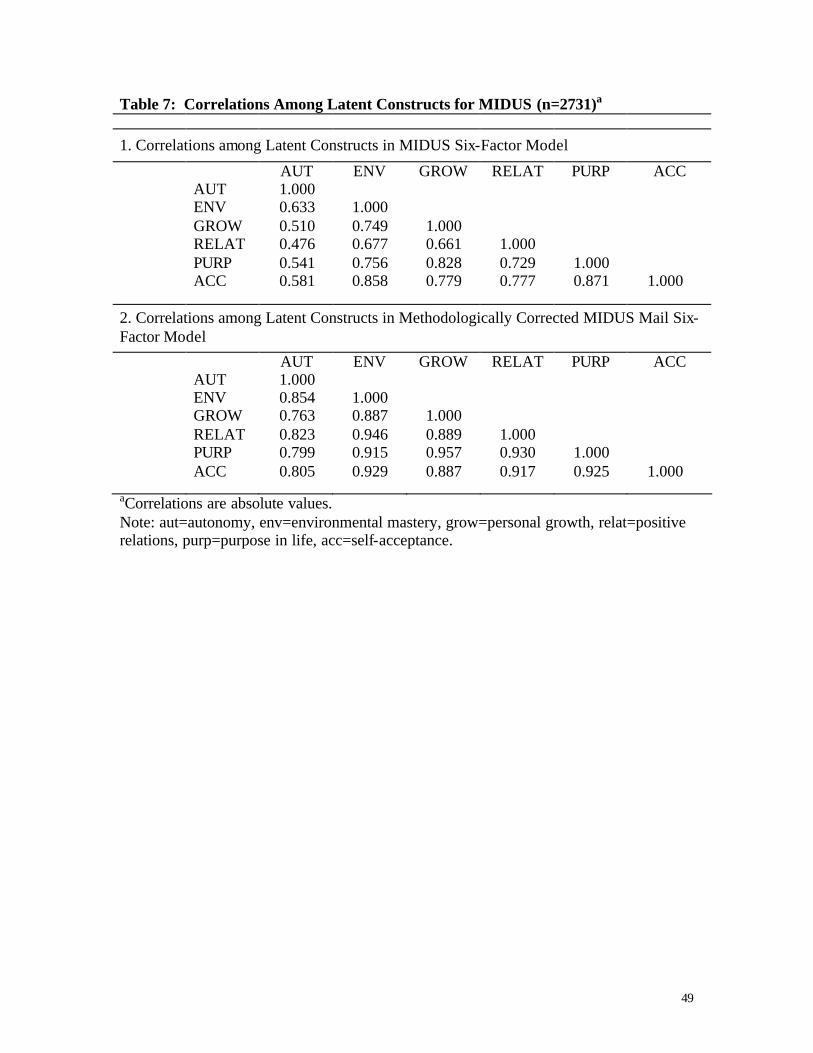
Panel 1 in table 7 show that the MIDUS factor correlations in the six-factor model
without methodological corrections are more modest, though not small. The highest
correlations (in absolute value) are between purpose in life and self-acceptance (0.871),
and self-acceptance and environmental mastery (0.858). As with NSFH II, accounting
for methodological-effects (see panel 2 in Table 7) increases the absolute value of the
correlation between factors; all but two correlations are above 0.800. We see from the
NSFH II and MIDUS correlations that there are several very high correlations, and
generally the largest correlations across all three mail surveys are among four factors
(purpose in life, self-acceptance, environmental mastery and personal growth). In
addition, these high correlations can not be accounted for by methodological artifacts in
any of the surveys analyzed here.
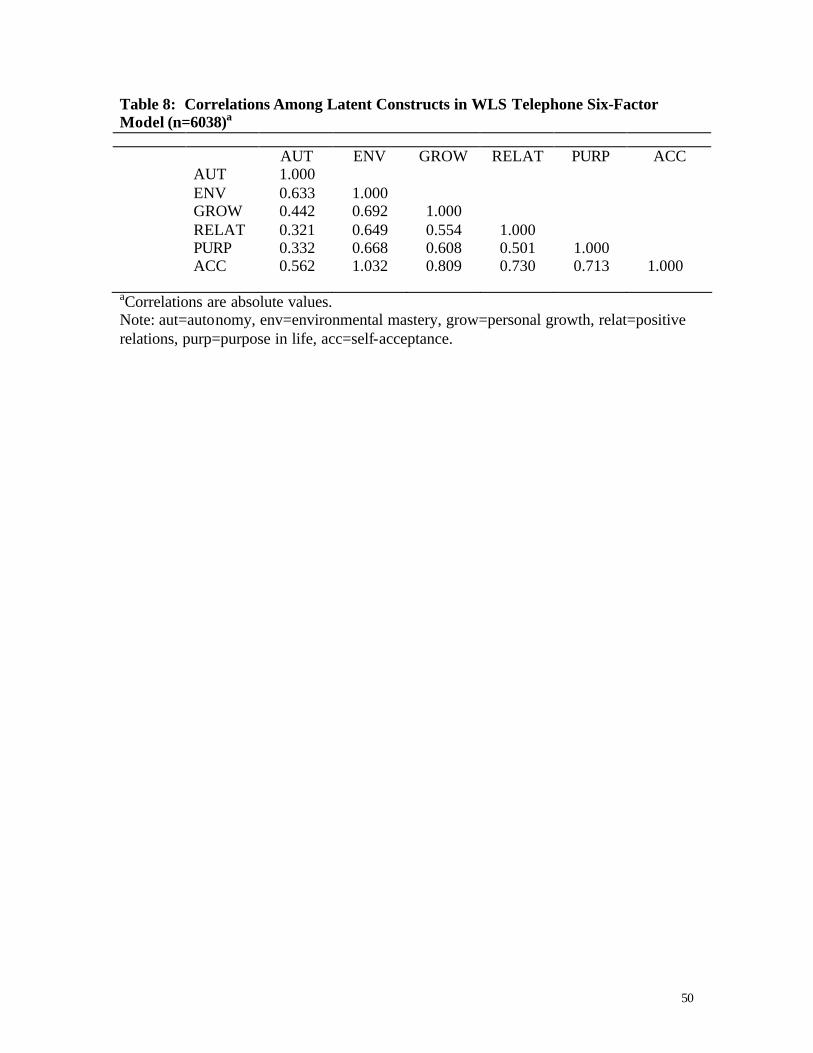
--Table 8 about here--
Mode of Administration: WLS telephone interview
One final possible cause of the high latent variables correlations that we have
estimated is the method of item administration. In addition to 42 RPWB items on the
mail survey, the WLS also contains 12 telephone items. These 12 items are among the 18
items included in the NSFH II and MIDUS. In the six-factor model, the chi-square is
smaller than for the WLS mail items (chi-square = 579, BIC = 231). Table 8 contains the
factor correlations for the WLS telephone items. In general, the absolute values of the
24
factor correlations are much more modest; the lowest is only 0.321. However, the largest
correlation is greater than one for environmental mastery and self-acceptance, and the
correlation for self-acceptance and personal growth is greater than 0.80. The correlation
greater than one is troubling at first look. However, when the correlation is constrained
to be equal to one, the chi-square change is not significant for one degree of freedom,
indicating that the estimated correlation is not significantly greater than one.
DISCUSSION
The purpose of the present paper was to explore the measurement properties of
RPWB in several widely-used large data sets under a variety of conditions. While it is
important to understand the measurement characteristics of any scale, there may be a
greater urgency to do so with RPWB because it is widely cited and used. Ryff and Keyes
(1995) provide empirical support for the multidimensionality of RPWB, with the
exception of environmental mastery and purpose in life. Clarke et al. (2001) also find
some evidence for the multidimensionality of RPWB using a sample of older Canadians.
However, in this sample they also find substantial overlap of environmental mastery with
self-acceptance and of purpose in life with personal growth. Finally, some studies using
smaller sample sizes and exploratory factor analyses do not find evidence of the
multidimensionality of RPWB (Hillson 1997; Kafka and Kozma 2002). Our study is the
first that we know of to explore the measurement properties RPWB in the WLS, MIDUS,
or NSFH II. It is also the first measurement analysis of RPWB to use polychoric
correlations and weighted least squares estimation. Weighted least squares estimation
with polychorics is becoming recognized as one of the best ways to model ordinal, non-
25
normal data—such as the highly skewed responses to the ordinal items in all three
surveys analyzed here (Jöreskog et al. 1996a). Using these preferred methods for
analyzing three large U.S. self-administered samples, we find very little support for the
theoretically proposed multidimensionality of RPWB.
Comparing our WLS telephone estimates and estimates reported by Ryff and
Keyes (1995) in the MIDUS pretest to the findings from self-administered items helps
explain the seemingly discrepant findings in the literature. We found consistently high
factor correlations across all self-administered instruments, even when we accounted for
methodological factors such as negative wording, item placement, and item redundancy.
In addition, examination of NSFH II and MIDUS provides strong evidence that the high
factor correlations found in the WLS are not a result of educational truncation, age
truncation, item selection, or some other distinctive characteristic of the Wisconsin
population.
It is worth noting that the NSFH II and MIDUS correlations in the non-
methodologically corrected six-factor models, though very high, are not as high as those
estimated using the WLS. However, the reverse is the case in the methodologically-
corrected models. Specifically, the factor correlations in MIDUS and NSFH II were
generally higher than in the WLS after accounting for correlated measurement error of
adjacent items and negative item wording. Given that the 18 items in MIDUS and NSFH
II are the most commonly used, it is essential to underscore that there is almost complete
overlap between the subscales after taking into account methodological confounders.
In addition, the highest latent variable correlations across all samples were
consistently those among purpose in life, self-acceptance, environmental mastery and
26
personal growth. These four dimensions are those identified previously in the literature
as having conceptual overlap. Kafka and Kozma (2002) found these four dimensions
largely clustered in one factor, Hillson (1999) found that one factor contained primarily
self-acceptance, environmental mastery, and purpose in life subscales, and Van
Dierendonck (2004) found high correlations among these subscales (personal
communication with Van Dierendonck, 7/26/04).
Because the factor correlations for the self-administered items we analyzed do not
support a multidimensional model of RPWB, we were originally surprised that our model
fit statistics for the WLS seemed to suggest otherwise. Specifically, given the extremely
high factor correlations, we expected that models constraining self-acceptance, purpose in
life, and environmental mastery to reflect only a single factor would fit better than the
unconstrained models. However, on closer reflection this is not too surprising and does
not necessarily indicate that the six dimensions are distinct. First, it is important to
remember that our sample size is very large, with over six thousand cases. With a sample
this large, almost any deviation will produce a statistically significant difference in chi-
square, whether or not the difference is substantially meaningful. One of the reasons we
presented BIC statistics in addition to chi-square was because BIC helps control for
sample size. However, Weakliem (1999) suggests that BIC might not sufficiently adjust
for exceptionally large sample sizes such as those we analyzed.
Second, the way that the RPWB subscales were originally created may make it
impossible to find that the scales/constructs are identical statistically, even if the
substantive differences between them are truly negligible. The reason for this is that
“items that correlated more highly with a scale other than their own or that showed low
27
correlations with their total scale were [not included in RPWB]” (Ryff 1989b, p. 1072)
Therefore, it is possible that statistically distinct subscales were created, that by design
cannot be identical even if the substantive dimensions of RPWB they are designed to
measure are equivalent. In other words, it is possible that the design of the RPWB model
capitalized on incidental, but persistent differences among items.
Although we found consistent evidence of high factor correlations using the WLS
mail data, NSFH II and MIDUS, we also found evidence of a mode difference.
Specifically, the telephone items in the WLS perform much more like the telephone-
administered items analyzed by Ryff and Keyes (1995) rather than like the self-
administered items from the WLS, NSFH II, and MIDUS. In addition, the Clarke et al.
(2001) study of the Canadian elderly was conducted in person, producing findings more
similar to those obtained by telephone. What accounts for the consistent differences
between self-administered, paper and pencil assessments and those conducted in person
or by telephone?
Extensive research has been conducted on mode effects and in general,
researchers find that people are less prone to social desirability bias on mail surveys than
in telephone or in-person interviews (Dillman 1991; Krysan, Schuman, Scott, and Beatty
1994; Moum 1998; Pruchno and Hayden 2000; Schwartz, Strack, Hippler, and Bishop
1991). In addition, studies have found that items like those in RPWB, which ascertain
psychological characteristics, are especially prone to social desirability bias (Moum
1998; Pruchno and Hayden 2000). Three subscales of RPWB (purpose in life, self-
acceptance and personal growth) have been explored using self-administered, telephone,
and in person instruments (Pruchno and Hayden 2000). For all three scales, there were
28
significantly more negative reports on the self-administered instrument compared to the
telephone or in person. The authors conclude: “these trends tempt the conjecture that
persons participating in the self-administered survey experienced greater privacy and had
more time to consider their responses than persons responding to interviewer-assisted
modes; therefore, their responses were more accurate. Verification of these speculations
awaits further study” (p. 21).
Verification, of course, requires a gold standard such as medical reports or some
other non-self-report data. While RPWB has not yet been tested in this way, it is
informative to look at other survey-based measures of psychological health. Fournier and
Kovess (1993) compared mail and telephone mental health instruments and found, as
others have, that the mail instrument demonstrated higher rates of mental illness. As a
validation check, Fournier and Kovess (1993) sub-sampled a group of respondents for an
in-depth interview in order to obtain enough information to make a DSM-III diagnosis.
The sample size was small, and therefore it was difficult to find significant effects for
specific psychiatric disorders, but they did find that that the kappa of the mail method for
“any of these diagnoses” was significantly higher than for the telephone method.
The mode effects that we have reviewed pertain to univariate distributions. Could
mode effects also account for the differences in factor structure between self-
administration and telephone or in-person administration? It may be that mode simply
shifts marginal distributions, but not the associations among variables. Alternatively,
shifts in marginal distributions and other mode effects may alter the structure of joint
distributions (De Leeuw, Mellenbergh, and Hox 1996). De Leeuw et al. (1996) provide
relevant evidence by examining a causal model of loneliness and a confirmatory factor
29
model of subjective well-being. The factor model of subjective well-being is of greatest
interest to the current project because of the model and content—though RPWB was not
used. The authors find strong support for the second hypothesis—that univariate mode
differences are magnified in multivariate analyses. They find that the substantive
interpretation of the results depends on the mode of administration.
One more issue warrants comment—specifically, we must assess the
methodological differences between our study and previous work (for example Ryff and
Keyes 1995). Though we believe it is more accurate to treat the data as ordinal and
employ weighted least squares estimation with polychoric correlations, it is important to
determine how much these methodological differences affect our results and conclusions.
As explained in the literature review, Ryff and Keyes (1995) used PRELIS to obtain
variance/covariance matrices and an asymptotic covariance matrix defining the variables
as continuous; they did not estimate polychoric correlations. Employing their model
specifications, we reran their models and were able to reproduce their results.8 When we
analyzed the Ryff and Keyes (1995) data using polychorics and weighted least squares
estimation, we obtained similar results but, as expected, many of the factor correlations
were larger, as was the chi-square. Likewise when we reran the six-factor models on the
WLS mail and phone data using the same specifications as Ryff and Keyes (1995), we
found somewhat smaller factor correlations and substantially reduced chi-square statistics
compared to the findings presented in this paper. For example in the six-factor model
using the mail data from the WLS, the factor correlations were slightly reduced but many
were still over 0.900; the largest was 0.954 between purpose in life and self-acceptance.9
The factor correlations for the phone items were also smaller than when using
30
polychorics with weighted least squares estimation. In short, our conclusions about mode
effects and the non-dimensionality of RPWB hold even when we don’t employ
polychoric correlations with weighted least squares estimation. The other important
difference between the two methods is that the chi-square statistic using polychorics and
weighted least squares estimation is much larger than when polychoric correlations are
not used—for example the chi-square for the six-factor WLS mail model is 9036,
compared to 6580 if the same model is estimated as in Ryff and Keyes (1995).
Extensive research indicates that items such as, and specifically including RPWB,
are more accurately measured using mail instruments rather than telephone items.
Research also suggests that structural models of well-being using different modes can
produce substantially different findings. Thus, the consistent results from self-
administered scales in WLS, NSFH II, and MIDUS are more credible to us than findings
from the WLS or MIDUS-pretest telephone surveys. This also helps explain the
seemingly discrepant findings in the literature. Studies finding lower factor correlations
(Clarke et al. 2001; Ryff and Keyes 1995) use telephone or in-person interviews whereas
studies finding less support for the multidimensionality of RPWB used self-administered
instruments (Kafka and Kozma 2002; van Dierendonck 2004).
Given the consistently high latent variable correlations estimated from mail items
in the WLS, MIDUS, and NSFH II, combined with extensive research indicating the
greater validity of psychological measures on self-administered surveys, we think that
RPWB does not measure as many as six distinct dimensions of psychological well-being.
In this paper, we have not pursued external validation techniques such as looking at age,
gender or socioeconomic differences in the subscales for several reasons. First, as we
31
discussed, it is possible that procedures used to choose the subsets of items in MIDUS
and NSFH may make it very difficult to establish that these dimensions are not
statistically distinct. Second, the findings of our study are not entirely novel, but add to a
growing body of research indicating that RPWB is not six-dimensional. Third, because
WLS, NSFH II and MIDUS samples have all been followed up, we are conducting
external validity checks in these longitudinal data as they become available (Pudrovska,
Hauser, and Springer 2005). We believe that these are the first large-scale analyses of
RPWB using longitudinal data.
In preliminary analyses of data ascertained from WLS graduates in 2003-05, we
cross-validated the very high cross-sectional factor correlations reported here and also
found very high correlations across each RPWB dimension between 1993 and 2005 --
approximately 0.85. There are small mean differences in the subscales of well-being as
the WLS cohort has aged -- and generally similar and small changes between NSFH II
and NSFH III. These small differences are consistent with the findings reported here. We
did not find complete overlap among subscales, so there is room for modest independent
variation in them. In addition, we are still exploring the possibility that the mean
differences may result from methods effects. In any case, none of our external validity
checks suggest that there are strong age-related trajectories or large differences between
subscales in change over time. In sum, these external validity checks confirm our main
finding, that Ryff's subscales do not represent six empirically distinct dimensions of
psychological well-being.
We applaud the attempt to develop multidimensional models of health—both
psychological and physical. As students of physical health have begun to move from life
32
expectancy to quality adjusted life expectancy and other multidimensional concepts, so
too should students of mental health. RPWB is one such attempt, and we can only
applaud this line of research. However, our study adds to a growing body of evidence
that RPWB does not measure six distinct dimensions of psychological well-being. While
RPWB certainly captures some aspects of positive mental health, we strongly caution
against analyses that treat the scale components as if they measured six distinct
dimensions of psychological well-being.
33
NOTES:
1 When referring directly to Ryff’s scales of psychological well-being we use the
acronym RPWB and for the general concept of psychological well-being we use the
acronym PWB.
2 The other correlations were positive relations & self-acceptance (0.52), autonomy &
self-acceptance (0.52), personal growth & self-acceptance (0.48), autonomy & positive
relations (0.32), environmental mastery & positive relations (0.45), purpose in life &
positive relations (0.55), personal growth & positive relations (0.57), environmental
mastery & autonomy (0.53), purpose in life & autonomy (0.46), personal growth &
autonomy (0.39), and personal growth & environmental mastery (0.46).
3 In the text the authors actually wrote SPWB for Ryff’s Scales of Psychological Well-
Being.
4 We used Lisrel versions 8.53-8.72 depending on the stage of analyses. The results do
no vary across these versions.
5 Some of the factor correlations are negative, however we have reported the absolute
value of all factor correlations.
6 We also examined a model with the six sub-dimensions loading onto one second-order
factor and the negative item factor loading onto its own second-order factor, with the two
34
second-order disturbances allowed to correlate. As expected, the model fit is identical to
the second-order factor model (Model 3-8)
7 We used WLS Model 3-6 rather than Model 3-7 as the comparison because, as
discussed previously, RPWB items are not equivalent across surveys. Therefore, we
believe that accounting for correlated measurement errors of adjacent items and including
a negative item artifact variable across all three surveys is the most comparable strategy.
8 We thank Corey Keyes for providing us with their data and code. We reproduced their
factor correlations exactly except we obtain a correlation of 0.38 for purpose in life and
autonomy whereas they reported a correlation of 0.39.
9 The full correlation table is available in Appendix A.
35
Reference List
Bradburn, Norman M. and C. E. Noll. 1969. The Structure of Psychological Well-Being.
Chicago : Aldine Pub. Co.
Campbell, Angus. 1981. The Sense of Well-Being in America: Recent Patterns and
Trends. New York : McGraw-Hill.
Chapman, James W. and William E. Tunmer. 1995. "Development of Young Children's
Reading Self-Concepts : an Examination of Emerging Subcomponents and Their
Relationship With Reading Achievement." Journal of Educational Psychology
87(1):154-67.
Clarke, Philipa J., Vic tor M. Marshall, Carol D. Ryff, and Blair Wheaton. 2001.
"Measuring Psychological Well-Being in the Canadadian Study of Health and
Aging ." International Psychogeriatrics 13(1):79-90.
Compton, William C., Maggie L. Smith, Kim A. Cornish, and Donald L. Qualls. 1996.
"Factor Structure of Mental Health Measures." Journal of Personality and Social
Psychology 71406-13.
De Leeuw, Edith D., Gideon J. Mellenbergh, and Joop J. Hox. 1996. "The Influence of
Data Collection Method on Structural Models : a Comparison of a Mail, a
Telephone, and a Face-to-Face Survey." Sociological Methods and Research
24(4):442-72.
36
Dillman, Don A. 1991. "The Design and Administration of Mail Surveys." Annual
Review of Sociology 17225-49.
Fournier, Louise and Vivianne Kovess. 1993. "A Comparison of Mail and Telephone
Interview Strategies of Mental Health Surveys." The Canadian Journal of
Psychiatry 38(8):525-33.
Groves, Robert M. 1989. Survey Errors and Survey Costs. New York, N.Y. : Wiley.
Hillson, Joan M. 1997. An Investigation of Positive Individualism and Positive Relations
With Others : Dimensions of Positive Personality . Ontario: University of Western
Ontario.
Jensen, Arthur R. 1971. "Note on Why Genetic Correlations Are Not Squared."
Psychological Bulletin 75(3):223-24.
Jöreskog, K. G., Dag Sörbom, and SPSS Inc. 1988. LISREL 7 a Guide to the Program
and Applications. Chicago, Ill: SPSS.
———. 1996a. LISREL 8 User's Reference Guide. 2nd ed ed. Chicago, IL : Scientific
Software International.
———. 1996b. PRELIS 2 User's Reference Guide : a Program for Multivariate Data
Screening and Data Summarization : a Preprocessor for LISREL. 3rd ed ed.
37
Chicago, IL : Scientific Software International.
Kafka, Garrett J. and Albert Kozma. 2002. "The Construct Validity of Ryff's Scales of
Psychological Well-Being (SPWB) and Their Relationship to Measures of
Subjective Well-Being ." Social Indicators Research 57 171-90.
Krysan, Maria H., Howard Schuman, Lesli J. Scott , and Paul Beatty. 1994. "Response
Rates and Response Content in Mail Versus Face-to-Face Surveys." Public
Opinion Quarterly 58(3):381.
Marks, Nadine F. 1996. "Flying Solo at Midlife: Marital Status, and Psychological Well-
Being." Journal of Marriage and the Family 58(4):917-32.
———. 1998. "Does It Hurt to Care? Caregiving, Work-Family Conflict, and Midlife
Well-Being." Journal of Marriage and the Family 60(4):951-66.
Marsh, Herbert. 1986. "Negative Item Bias in Ratings Scales for Preadolescent Children :
a Cognitive-Development Phenomenon." Developmental Psychology 22(1):37-49.
McGregor, Ian and Brian R. Little. 1998. "Personal Projects, Happiness, and Meaning :
on Doing Well and Being Yourself." Journal of Personality and Social
Psychology 74494-512.
Melnick, S. A. and R. K. Gable. 1990. "The Use of Negative Item Stems : a Cautionary
38
Note." Educational Research Quarterly 14(3):31-36.
Moum, Torbjorn. 1998. "Mode of Administration and Interviewer Effects in Self-
Reported Symptoms of Anxiety and Depression." Social Indicators Research
45279-318.
Neugarten, B. L., R. Havinghurst, and S. Tobin. 1961. "The Measurement of Life
Satisfaction." Journal of Gerontology 16134-43.
Pilotte, William J. and Robert K. Gable. 1990. "The Impact of Positive and Negative
Item Stems on the Validity of Computer Anxiety Scale." Educational and
Psychological Measurement 50(3):603-310.
Pruchno, Rachel A. and Jason M. Hayden. 2000. "Inteview Modality : Effects on Costs
and Data Quality in a Sample of Older Women." Journal of Health and Aging
12(1):3-24.
Pudrovska, Tetanya, Robert M. Hauser, and Kristen W. Springer. 2005. “Dimensions of
Change in Psychological Well-Being across the Life Course. Presented at the
2005 meetings of the American Sociological Association, Philadelphia,
Pennsylvania.
Raftery, Adrian E. 1995. "Bayesian Model Selection in Social Research." Pp. 111-63 in
Sociological Methodology 1995, Editor Peter V. Marsden. Cambridge: Basil
39
Blackwell.
Rosenberg, Morris. 1965. Society and the Adolescent Self-Image. Princeton, N.J. :
Princeton University Press.
Ryan, Ryan M. and Edward L. Deci. 2001. "On Happiness and Human Potential : a
Review of Research on Hedonic and Eudaimonic Well-Being." Annual Review of
Psychology 52141-66.
Ryff, C. D. 1989a. "Beyond Ponce De Leon and Life Satisfaction: New Directions in the
Quest of Successful Aging." International Journal of Development 12:35-55.
———. 1989b. "Happiness Is Everything, or Is It? Explorations on the Meaning of
Psychological Well-Being." Journal of Personality and Social Psychology
57(6):1069-81.
Ryff, C. D. and C. L. Keyes. 1995. "The Structure of Psychological Well-Being
Revisited." J Pers Soc Psychol 69(4):719-27.
Schwartz, Norbert, Fritz Strack, Hans-J. Hippler , and George Bishop. 1991. "The Impact
of Administration Model on Response Effects in Survey Measurement." Applied
Cognitive Psychology 5193-212.
Sewell, William H., Robert M. Hauser, Kristen W. Springer, and Taissa S. Hauser. 2004.
40
"As We Age: The Wisconsin Longitudinal Study, 1957-2001." Pp. 3-111 in
Research in Social Stratification and Mobility, vol. 20, edited by Kevin Leicht.
London: Elsevier.
van Dierendonck, Dirk. 2004. "The Construct Validity of Ryff's Scales of Psychological
Well-Being and Its Extension With Spiritual Well-Being." Personality and
Individual Differences 36(3):629-43.
Waterman, Alan S. 1993. "Two Conceptions of Happiness : Contrasts of Personal
Expressiveness (Eudaimonia) and Hedonic Enjoyment." Journal of Personality
and Social Psychology 64678-91.

41
Table 1: Correlations among Latent Constructs in 3-indicator, 6-factor model for a
nationally representative sample over 25 years old (Ryff and Keyes (1995) AUT ENV GROW RELAT PURP ACC
AUT 1.000 ENV 0.59 1.000
GROW 0.51 0.56 1.000 RELAT 0.24 0.65 0.31 1.000
PURP 0.39 0.38 0.64 0.30 1.000 ACC 0.53 0.85 0.53 0.65 0.55 1.000
Note: n=928, aut=autonomy, env=environmental mastery, grow=personal growth, relat=positive relations, purp=purpose in life, acc=self-acceptance
42
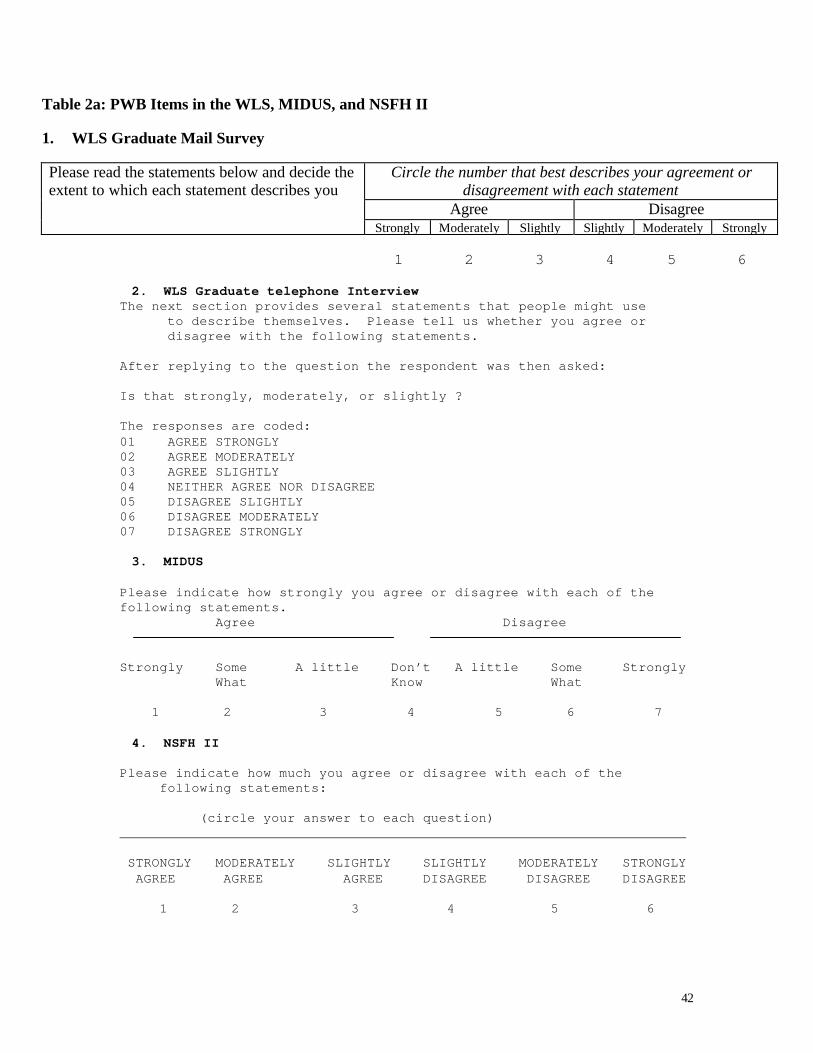
Table 2a: PWB Items in the WLS, MIDUS, and NSFH II
1. WLS Graduate Mail Survey
Circle the number that best describes your agreement or disagreement with each statement
Agree Disagree
Please read the statements below and decide the extent to which each statement describes you
Strongly Moderately Slightly Slightly Moderately Strongly 1 2 3 4 5 6 2. WLS Graduate telephone Interview
The next section provides several statements that people might use to describe themselves. Please tell us whether you agree or disagree with the following statements. After replying to the question the respondent was then asked: Is that strongly, moderately, or slightly ? The responses are coded: 01 AGREE STRONGLY 02 AGREE MODERATELY 03 AGREE SLIGHTLY 04 NEITHER AGREE NOR DISAGREE 05 DISAGREE SLIGHTLY 06 DISAGREE MODERATELY 07 DISAGREE STRONGLY 3. MIDUS
Please indicate how strongly you agree or disagree with each of the following statements. Agree Disagree Strongly Some A little Don’t A little Some Strongly What Know What 1 2 3 4 5 6 7 4. NSFH II
Please indicate how much you agree or disagree with each of the following statements: (circle your answer to each question) _______________________________________________________________________ STRONGLY MODERATELY SLIGHTLY SLIGHTLY MODERATELY STRONGLY AGREE AGREE AGREE DISAGREE DISAGREE DISAGREE 1 2 3 4 5 6
43
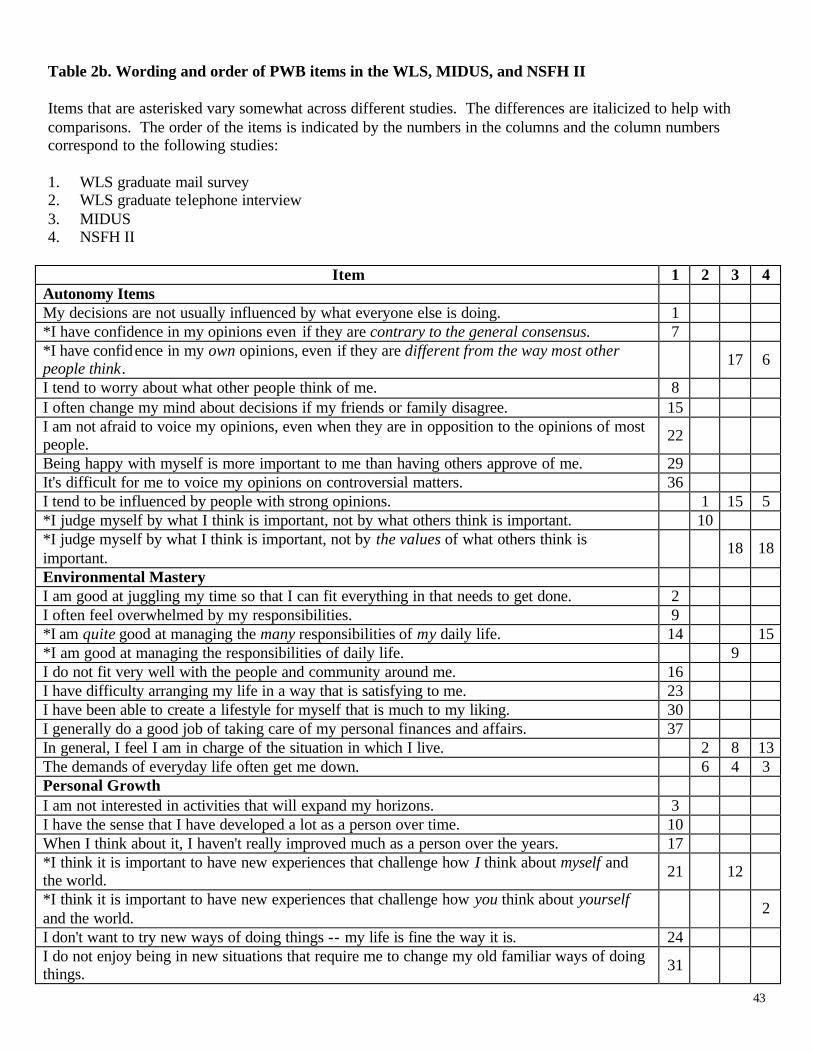
Table 2b. Wording and order of PWB items in the WLS, MIDUS, and NSFH II
Items that are asterisked vary somewhat across different studies. The differences are italicized to help with comparisons. The order of the items is indicated by the numbers in the columns and the column numbers correspond to the following studies: 1. WLS graduate mail survey 2. WLS graduate telephone interview 3. MIDUS 4. NSFH II
Item 1 2 3 4 Autonomy Items My decisions are not usually influenced by what everyone else is doing. 1 *I have confidence in my opinions even if they are contrary to the general consensus. 7 *I have confidence in my own opinions, even if they are different from the way most other people think. 17 6
I tend to worry about what other people think of me. 8 I often change my mind about decisions if my friends or family disagree. 15 I am not afraid to voice my opinions, even when they are in opposition to the opinions of most people. 22
Being happy with myself is more important to me than having others approve of me. 29 It's difficult for me to voice my opinions on controversial matters. 36 I tend to be influenced by people with strong opinions. 1 15 5 *I judge myself by what I think is important, not by what others think is important. 10 *I judge myself by what I think is important, not by the values of what others think is important.
18 18
Environmental Mastery I am good at juggling my time so that I can fit everything in that needs to get done. 2 I often feel overwhelmed by my responsibilities. 9 *I am quite good at managing the many responsibilities of my daily life. 14 15 *I am good at managing the responsibilities of daily life. 9 I do not fit very well with the people and community around me. 16 I have difficulty arranging my life in a way that is satisfying to me. 23 I have been able to create a lifestyle for myself that is much to my liking. 30 I generally do a good job of taking care of my personal finances and affairs. 37 In general, I feel I am in charge of the situation in which I live. 2 8 13 The demands of everyday life often get me down. 6 4 3 Personal Growth I am not interested in activities that will expand my horizons. 3 I have the sense that I have developed a lot as a person over time. 10 When I think about it, I haven't really improved much as a person over the years. 17 *I think it is important to have new experiences that challenge how I think about myself and the world. 21 12
*I think it is important to have new experiences that challenge how you think about yourself and the world.
2
I don't want to try new ways of doing things -- my life is fine the way it is. 24 I do not enjoy being in new situations that require me to change my old familiar ways of doing things. 31
44
There is truth to the saying you can't teach an old dog new tricks. 38 *For me, life has been a continuous process of learning, changing, and growing. 7 *For me, life has been a continuous process of learning, changing, and growth. 11 17 I gave up trying to make big improvements or changes in my life a long time ago. 11 14 12 Positive Relations I don't have many people who want to listen when I need to talk. 4 I enjoy personal and mutual conversations with family members and friends. 11 I often feel lonely because I have few close friends with whom to share my concerns. 18 It seems to me that most other people have more friends than I do. 25 People would describe me as a giving person, willing to share my time with others. 28 13 11 Most people see me as loving and affectionate. 32 I know I can trust my friends, and they know they can trust me. 39 Maintaining close relationships has been difficult and frustrating for me. 3 6 4 I have not experienced many warm and trusting relationships with others. 8 16 8 Purpose in Life I enjoy making plans for the future and working to make them a reality. 5 My daily activities often seem trivial and unimportant to me. 12 I am an active person in carrying out the plans I set for myself. 19 I tend to focus on the present, because the future nearly always brings me problems. 26 I don't have a good sense of what it is I'm trying to accomplish in life. 33 *I sometimes feel as if I have done all there is to do in life. 14 *I sometimes feel as if I've done all there is to do in life. 35 10 I used to set goals for myself, but that now seems like a waste of time. 40 Some people wander aimlessly through life but I am not one of them. 4 3 16 I live life one day at a time and don’t really think about the future. 9 7 7 Self-Acceptance I feel like many of the people I know have gotten more out of life than I have. 6 In general, I feel confident and positive about myself. 13 When I compare myself to friends and acquaintances, it makes me feel good about who I am. 20 My attitude about myself is probably not as positive as most people feel about themselves. 27 I made some mistakes in the past, but I feel that all in all everything has worked out for the best.
34
The past had its ups and downs, but in general, I wouldn't want to change it. 41 In many ways, I feel disappointed about my achievements in life. 42 5 10 *When I look at the story of my life, I am pleased with how things have turned out. 5 *When I look at the story of my life, I am pleased about how things have turned out. 9 *When I look at the story of my life, I am pleased with how things have turned out so far. 2 *I like most parts of my personality. 1 1 *I like most aspects of my personality. 12
45
Table 3: Indices of Fit Based on Weighted Least Squares—WLS Graduates (n=6282)
Chi-square DF BIC
1. Single-factor model 10865.08 819 3702.56
2. Six-factor model with all psi correlated
9035.73 804 2004.39
3. Second-order, six-factor model
9199.43 813 2089.39
4. Six-factor model with correlated negative factor
7539.77 776 753.31
5. Six-factor model with correlated errors for all adjacent questions
8141.15 763 1468.38
6. Model 4 and Model 5 combined
6660.05 735 232.15
7. Model 6 and three additional error correlations
5953.10 732 -448.56
8. Model 7 with one second order factor
6176.04 746 -348.06
9. Model 7 with five correlated second-order factors: PWB1, aut, relat, grow and neg. PWB1 includes env, purp, and acc.
6226.68 743 -270.46
10. Model 7 with four correlated second-order factors: PWB1, aut, relat, and neg. PWB1 includes env, purp, acc and grow.
6383.16 747 -149.69
46
Table 4: Correlations Among Latent Constructs for the WLS Mail Survey (n=6282)a
1. Correlations among Latent Constructs in WLS Mail Six-Factor Model (Model 3-2)
AUT ENV GROW RELAT PURP ACC AUT 1.000 ENV 0.784 1.000 GROW 0.815 0.911 1.000 RELAT 0.735 0.915 0.866 1.000 PURP 0.793 0.958 0.942 0.895 1.000 ACC 0.825 0.971 0.951 0.903 0.976 1.000
2. Correlations among Latent Constructs in Methodologically Corrected WLS Mail Six-Factor Model (Model 3-6)
AUT ENV GROW RELAT PURP ACC AUT 1.000 ENV 0.757 1.000 GROW 0.789 0.899 1.000 RELAT 0.710 0.912 0.857 1.000 PURP 0.770 0.954 0.937 0.879 1.000 ACC 0.802 0.965 0.944 0.889 0.967 1.000
3. Correlations among Latent Constructs in Methodologically Corrected WLS Mail Six-Factor Model with Three Additional Error Correlations (Model 3-7)
AUT ENV GROW RELAT PURP ACC AUT 1.000 ENV 0.771 1.000 GROW 0.791 0.905 1.000 RELAT 0.721 0.925 0.866 1.000 PURP 0.780 0.958 0.938 0.887 1.000 ACC 0.808 0.970 0.943 0.900 0.970 1.000 aCorrelations are absolute values.
Note: aut=autonomy, env=environmental mastery, grow=personal growth, relat=positive relations, purp=purpose in life, acc=self-acceptance.
47
Table 5: Indices of Fit Based on Weighted Least Squares—NSFH II & MIDUS
NSFH II (n=9240)
Chi-square DF BIC
1. Six-factor model with all psi correlated
4569.57 120 3473.81
2. Six-factor model with correlated errors for all adjacent questions & a correlated neg factor
1446.49 89 633.80
MIDUS (n=2731) Chi-square DF BIC
1. Six-factor model with all psi correlated
1471.22 120 521.73
2. Six-factor model with correlated errors for all adjacent questions & a correlated neg factor
474.75 89 -229.46
48
Table 6: Correlations Among Latent Constructs for NSFH II (n=9240)a
1. Correlations among Latent Constructs in NSFH II Six-Factor Model
AUT ENV GROW RELAT PURP ACC AUT 1.000 ENV 0.785 1.000 GROW 0.765 0.809 1.000 RELAT 0.647 0.781 0.724 1.000 PURP 0.756 0.820 0.980 0.727 1.000 ACC 0.714 0.933 0.803 0.823 0.763 1.000
2. Correlations among Latent Constructs in Methodologically Corrected NSFH II Mail Six- Factor Model
AUT ENV GROW RELAT PURP ACC AUT 1.000 ENV 0.942 1.000 GROW 0.873 0.900 1.000 RELAT 0.942 0.951 0.901 1.000 PURP 0.908 0.926 0.985 0.938 1.000 ACC 0.898 0.976 0.919 0.937 0.918 1.000 aCorrelations are absolute values. Note: aut=autonomy, env=environmental mastery, grow=personal growth, relat=positive relations, purp=purpose in life, acc=self-acceptance.
49
Table 7: Correlations Among Latent Constructs for MIDUS (n=2731)a
1. Correlations among Latent Constructs in MIDUS Six-Factor Model
AUT ENV GROW RELAT PURP ACC AUT 1.000 ENV 0.633 1.000 GROW 0.510 0.749 1.000 RELAT 0.476 0.677 0.661 1.000 PURP 0.541 0.756 0.828 0.729 1.000 ACC 0.581 0.858 0.779 0.777 0.871 1.000
2. Correlations among Latent Constructs in Methodologically Corrected MIDUS Mail Six- Factor Model
AUT ENV GROW RELAT PURP ACC AUT 1.000 ENV 0.854 1.000 GROW 0.763 0.887 1.000 RELAT 0.823 0.946 0.889 1.000 PURP 0.799 0.915 0.957 0.930 1.000 ACC 0.805 0.929 0.887 0.917 0.925 1.000 aCorrelations are absolute values. Note: aut=autonomy, env=environmental mastery, grow=personal growth, relat=positive relations, purp=purpose in life, acc=self-acceptance.
50
Table 8: Correlations Among Latent Constructs in WLS Telephone Six-Factor Model (n=6038)a AUT ENV GROW RELAT PURP ACC AUT 1.000 ENV 0.633 1.000 GROW 0.442 0.692 1.000 RELAT 0.321 0.649 0.554 1.000 PURP 0.332 0.668 0.608 0.501 1.000 ACC 0.562 1.032 0.809 0.730 0.713 1.000 aCorrelations are absolute values. Note: aut=autonomy, env=environmental mastery, grow=personal growth, relat=positive relations, purp=purpose in life, acc=self-acceptance.
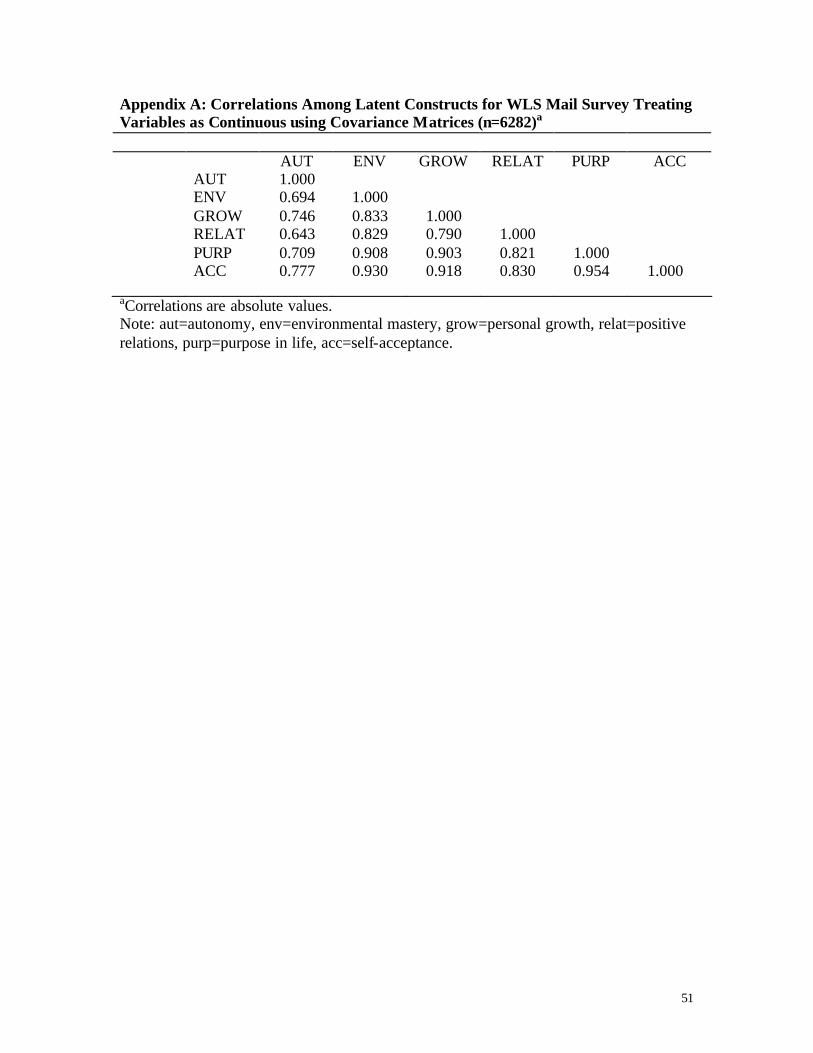
51
Appendix A: Correlations Among Latent Constructs for WLS Mail Survey Treating Variables as Continuous using Covariance Matrices (n=6282)a AUT ENV GROW RELAT PURP ACC AUT 1.000 ENV 0.694 1.000 GROW 0.746 0.833 1.000 RELAT 0.643 0.829 0.790 1.000 PURP 0.709 0.908 0.903 0.821 1.000 ACC 0.777 0.930 0.918 0.830 0.954 1.000 aCorrelations are absolute values. Note: aut=autonomy, env=environmental mastery, grow=personal growth, relat=positive relations, purp=purpose in life, acc=self-acceptance.
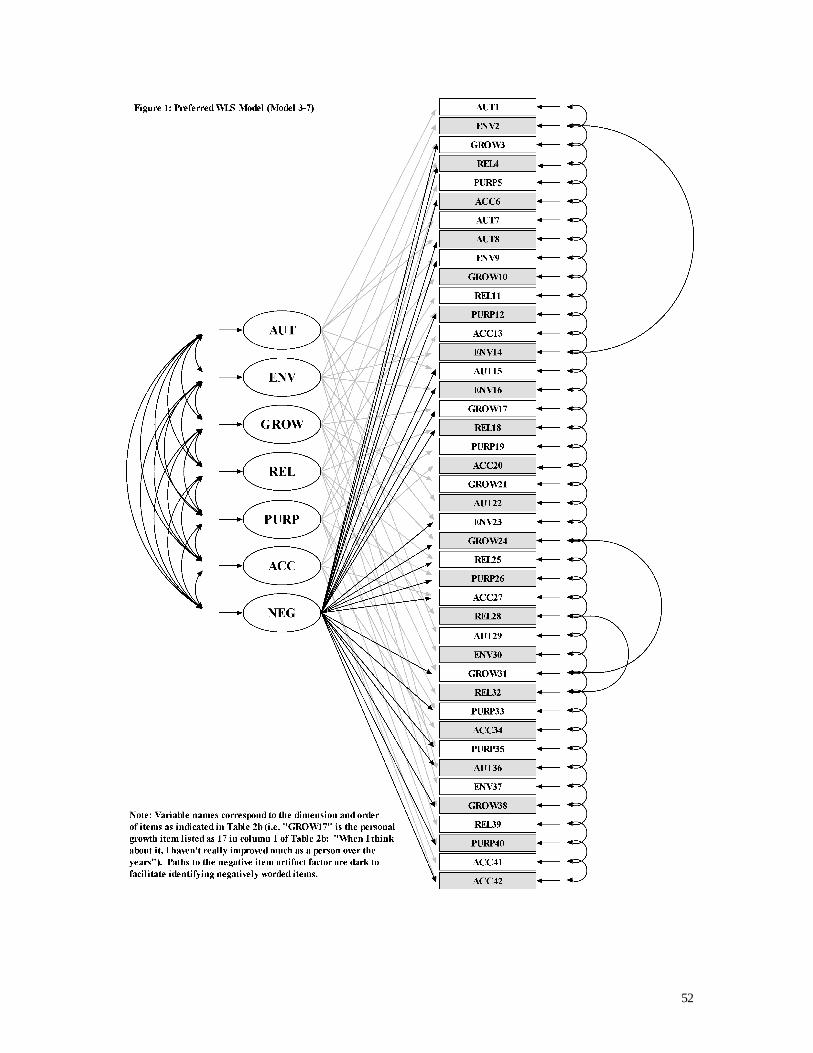
52