an assessment of teachers’ turnover and its impact … · an assessment of teachers’ turnover...
TRANSCRIPT

AN ASSESSMENT OF TEACHERS’ TURNOVER AND ITS IMPACT ON
ACADEMIC PERFORMANCE IN GOVERNMENT SECONDARY
SCHOOLS IN MBOZI DISTRICT, TANZANIA
ESTHER J.K. JESTON
A DISSERTATION SUBMITTED IN PARTIAL FULFILMENT OF THE
REQUIREMENTS FOR THE DEGREE OF MASTER OF EDUCATION
ADMINISTRATION, PLANNING AND POLICY STUDIES OF THE OPEN
UNIVERSITY OF TANZANIA
2013

i
AN ASSESSMENT OF TEACHERS
’ TURNOVER AND ITS IMPACT ON ACADEMIC PERFORMANCE IN
GOVERNMENT SECONDARY SCHOOLS IN MBOZI DISTRICT,
TANZANIA
ESTHER J.K. JESTON
A DISSERTATION SUBMITTED IN PARTIAL FULFILMENT OF THE
REQUIREMENTS FOR THE DEGREE OF MASTER OF EDUCATION
ADMINISTRATION, PLANNING AND POLICY STUDIES OF THE OPEN
UNIVERSITY OF TANZANIA

ii
2013
CERTIFICATION
I, the undersigned, certify that I have read and hereby recommends for acceptance by
the Open University of Tanzania, a dissertation titled: “An Assessment of Teachers’
Turnover and its Impact on Academic Performance in Government Secondary
Schools in Mbozi District, Tanzania”, in partial fulfilment of the requirements for the
degree of Master of Education Administration, Planning and Policy Studies of the
Open University of Tanzania.
………………………………
Dr. M.W. Ng’umbi
(Supervisor)
…………………….…………….
Date

iii
COPYRIGHT
No part of this dissertation may be reproduced, stored in any retrieval system, or
transmitted in any form by any means, electronic, mechanical, photocopying,
recording or otherwise without prior written permission of the author or the Open
University of Tanzania in that behalf.

iv
DECLARATION
I, Esther J.K. Jeston hereby declare that this dissertation is my own original work and
that it has not been and will not be presented to any other University for similar or
any other degree award.
……………………………
Signature
………………………………….
Date

v
DEDICATION
The work is dedicated to my husband Edson Mtawa and my four sons for their
material and moral support. May almighty God bless them!

vi
ACKNOWLEDGEMENTS
I wish to extend my sincere thanks to those who contributed in one way or another to
my study success. Special thanks are due to my supervisor Dr. Michael W. Ng’umbi
whom I am really indebted for his guidance throughout the period of preparing this
dissertation; although he had many academic and administrative responsibilities but
he was able to provide suggestions and good criticisms which shaped this
dissertation. Other special thanks go to the entire staff of the Open University of
Tanzania who ran various courses in proposal and dissertation writing. Thanks also
go to my colleagues 2010/2012 for MED (Education Administration, Planning and
Policy Studies) programme for their maximum cooperation, advice and
encouragement they rendered me throughout the programme.
My heartfelt thanks go to Mbeya Regional Administrative Secretary, Mbozi District
Administrative Secretary and all leaders who assisted me towards authorizing my
investigation permit. Great thanks go to the District Secondary Education Officer,
Teachers’ Trade Union Secretary, Teachers’ Service Department Secretary, Heads of
secondary schools and all secondary school teachers for their moral and material
support. My appreciation will be incomplete without mentioning Mr. Msokwe for his
guidance, encouragement and contribution to this dissertation by spending a lot of his
valuable time in giving me suggestions and comments.

vii
ABSTRACT
This study investigated the attitude of teachers towards teaching profession, the
existence and causes of teachers’ turnover and the impact of teachers’ turnover on
academic performance in government secondary schools in Tanzania particularly
Mbozi District. Stratified and simple random sampling techniques were used.
Stratified was used to select schools from rural and urban areas while simple random
sampling was used to select 200 respondents. Data collection methods were;
documentary search, questionnaires and interviews. Data analysis was based on
quantitative and qualitative techniques. Statistical Package for the Social Sciences
and Microsoft excel were used to arrive at percentages and frequencies, tables, charts
and graphs as well as chi square test. The findings indicated that there were different
reasons for becoming a teacher, perception of teaching profession, satisfaction and
choice for further career. Teachers were interested in teaching profession at a larger
proportion whereas few opted for teaching profession due to lack of other jobs and
others became teachers just temporarily. Different perceptions were also observed;
some teachers reported that their job meant a lot more than just money. Job
satisfaction had increased because of flexibility and in case of further choice career,
it was found that there was a likelihood of choosing the same career again. The study
found the existence of teachers’ turnover in the study area which was caused by
socio-economic and political factors. Teachers’ turnover was found to be one of the
contributing factors for the decline of academic performance. The researcher
recommends that, the government should provide decent accommodation and
overtime payments for extra duties to teachers and also policies should be supportive.
viii
TABLE OF CONTENTS
CERTIFICATION ..................................................................................................... ii
COPYRIGHT ............................................................................................................ iii
DECLARATION ....................................................................................................... iv
DEDICATION ............................................................................................................ v
ACKNOWLEDGEMENTS ...................................................................................... vi
ABSTRACT .............................................................................................................. vii
LIST OF TABLES ................................................................................................... xii
LIST OF FIGURES ................................................................................................. xv
LIST OF APPENDICES ........................................................................................ xvi
LIST OF ABBREVIATIONS ............................................................................... xvii
CHAPTER ONE ........................................................................................................ 1
1.0 INTRODUCTION ............................................................................................... 1
1.1 Overview............................................................................................................. 1
1.2 Background to the Study .................................................................................... 1
1.3 Statement of the Problem.................................................................................... 4
1.4 General Objective ............................................................................................... 5
1.4.1 Specific Objectives ............................................................................................. 5
1.5 Research Questions ............................................................................................. 6
1.6 Conceptual Framework ....................................................................................... 6
1.7 Significance of the Study .................................................................................... 8
1.8 Delimitation of the Study.................................................................................... 9
1.9 Limitations of the Study ..................................................................................... 9

ix
1.10 Summary ......................................................................................................... 9
CHAPTER TWO ..................................................................................................... 10
2.0 LITERATURE REVIEW ................................................................................. 10
2.1 Overview........................................................................................................... 10
2.2 General Overview on Teachers’ Turnover ....................................................... 10
2.3 Demographic Factors ........................................................................................ 14
2.4 Attitudes of Teachers towards Teaching Profession ........................................ 15
2.5 Socio-economic Factors.................................................................................... 17
2.5.1 Salaries .............................................................................................................. 17
2.5.2 Fringe Benefits .................................................................................................. 19
2.6 Socio-political Factors ...................................................................................... 21
2.6.1 Accountability of Teachers ............................................................................... 21
2.6.2 Government Policies ......................................................................................... 22
2.6.3 Working Conditions .......................................................................................... 23
2.7 Academic Performance ..................................................................................... 25
2.8 Synthesis and the Research Gap ....................................................................... 25
2.9 Summary ........................................................................................................... 26
CHAPTER THREE ................................................................................................. 27
3.0 RESEARCH METHODOLOGY .................................................................... 27
3.1 Overview .......................................................................................................... 27
3.2 Description of the Study Area .......................................................................... 27
3.3 Research Approaches ....................................................................................... 28
3.4 Study Design .................................................................................................... 29
3.5 Type of the Research ........................................................................................ 29

x
3.6 Targeted Population .......................................................................................... 30
3.7 Computation of Sample Size ............................................................................ 30
3.8 Sampling Procedures ........................................................................................ 31
3.9 Research Methods ............................................................................................. 31
3.9.1 Primary Data Collection .................................................................................... 33
3.9.2 Secondary Data Collection ................................................................................ 33
3.10 Data Organisation and Analysis ....................................................................... 33
3.11 Ethical Issues in Data Collection ...................................................................... 33
3.12 Summary ........................................................................................................... 34
CHAPTER FOUR .................................................................................................... 35
4.0 RESEARCH FINDINGS AND DISCUSSION ............................................... 35
4.1 Overview........................................................................................................... 35
4.2 Demographic Characteristics of the Respondents ............................................ 35
4.2.1 Gender ............................................................................................................... 35
4.2.2 Age of the Respondents .................................................................................... 36
4.2.3 Education Level ................................................................................................ 37
4.2.4 Experience of the Respondents in Teaching ..................................................... 37
4.3 The Attitudes of Teachers towards Teaching Profession ................................. 38
4.3.1 Decision for Becoming a Teacher ..................................................................... 38
4.3.2 Perception on Teaching Profession ................................................................... 44
4.3.3 Satisfaction on Teaching Profession ................................................................ 50
4.3.4 Desire for Further Choice on Teaching Profession ........................................... 56
4.4 Prevalence of Teachers’ Turnover .................................................................... 62
4.4.1 Variation on the Prevalence of Teachers’ Turnover ......................................... 63

xi
4.5 The Causes of Teachers’ Turnover ................................................................... 66
4.5.1 Socio-economic Factors .................................................................................... 67
4.6 The Impact of Teachers’ Turnover on Academic Performance ....................... 99
4.6.1 The variations on the Impacts of Teachers’ Turnover on Academic
Performance .................................................................................................... 101
4.7 Summary ...................................................................................................... 105
CHAPTER FIVE .................................................................................................... 106
5.0 CONCLUSION AND RECOMMENDATIONS .......................................... 106
5.1 Overview ........................................................................................................ 106
5.2 Summary of the Main Findings ...................................................................... 106
5.2.1 The Attitude of Teachers toward Teaching Profession ................................... 106
5.2.2 Prevalence and Causes of Teachers’ Turnover .............................................. 107
5.2.3 Impact of Teachers’ Turnover ......................................................................... 108
5.3 Research Conclusion ...................................................................................... 109
5.4 Recommendations .......................................................................................... 109
5.4.1 Recommendations for Action ......................................................................... 109
5.4.2 Recommendations of Areas for Further Research .......................................... 110
REFERENCES ....................................................................................................... 111
APPENDICES ........................................................................................................ 115

xii
LIST OF TABLES
Table 3. 1: Sample Size ............................................................................................. 32
Table 4. 1: Gender of the Respondents ..................................................................... 35
Table 4. 2: Age of the Respondents .......................................................................... 36
Table 4. 3: Reasons for Becoming a Teacher and Age ............................................. 40
Table 4. 4: Reasons for Becoming a Teacher and Gender ........................................ 41
Table 4. 5: Reasons for Becoming a Teacher and Education Level ......................... 43
Table 4. 6: Reasons for Becoming a Teacher and Experience ................................. 44
Table 4. 7: Job Perception and Age .......................................................................... 47
Table 4. 8: Job Perception and Gender ..................................................................... 48
Table 4. 9: Job Perception and Education Level ...................................................... 49
Table 4. 10: Job Perception and Teaching Experience ............................................. 50
Table 4. 11: Satisfaction on Teaching Profession and Gender ................................. 52
Table 4. 12: Satisfaction on Teaching Profession and Age ...................................... 53
Table 4. 13: Satisfaction on Teaching Profession and Level of Education .............. 54
Table 4. 14: Satisfaction on Teaching Profession and Experience ........................... 55
Table 4. 15: Desire for making the same Choice of Teaching Profession ................ 57
Table 4. 16: Further Choice in Teaching Profession and Gender ............................. 58
Table 4. 17: Desire for Choice on Teaching Profession and Age ............................. 59
Table 4. 18: Desire for Choice on Teaching Profession and Education Level ......... 60
Table 4. 19: Desire for Choice on Teaching Profession and Experience.................. 61
Table 4. 20: Prevalence of Teachers’ Turnover and Gender .................................... 64
Table 4. 21: Existence of Teachers’ Turnover and Age ........................................... 65

xiii
Table 4. 22: Prevalence of Teachers’ Turnover and Experience .............................. 66
Table 4. 23: Salary Scale and Education Level ........................................................ 69
Table 4. 24: Salary Scale and Working Experience .................................................. 70
Table 4. 25: Fringe Benefits among Teachers .......................................................... 71
Table 4. 26: Fringe benefits and Education Level .................................................... 72
Table 4. 27: Fringe Benefits and Working Experience ............................................. 73
Table 4. 28: Non-monetary services and Education Level ....................................... 75
Table 4. 29: Non-monetary Services and Working Experience ................................ 75
Table 4. 30: Payments for leave ................................................................................ 76
Table 4. 31: Leave payments and Education Level .................................................. 77
Table 4. 32: Leave payments and Working Experience ........................................... 78
Table 4. 33: Rate of Promotion and Education Level ............................................... 80
Table 4. 34: Rate of Promotion by Working Experience .......................................... 81
Table 4. 35: Accountability and Age of the Respondents ......................................... 83
Table 4. 36: Accountability and Education Level ..................................................... 84
Table 4. 37: Government Policies and Working Experience .................................... 86
Table 4. 38: Government Policies and Gender ......................................................... 87
Table 4. 39: Working Conditions .............................................................................. 89
Table 4. 40: Working Conditions and Education Level ............................................ 89
Table 4. 41: Working Condition and Age ................................................................. 90
Table 4. 42: Presence of Accommodation and Gender ............................................. 92
Table 4. 43: Accommodation and Age of the Respondents ...................................... 93
Table 4. 44: The Living Standards and Education Level .......................................... 95
Table 4. 45: The living standards and work experience............................................ 96

xiv
Table 4. 46: Extra Duties among Teachers ............................................................... 97
Table 4. 47: Extra Duties and Education Level ........................................................ 98
Table 4. 48: Extra Duties and Working Experience ................................................. 98
Table 4. 49: Impact of Teachers’ Turnover on Academic Performance ................... 99
Table 4. 50: Impact of Teachers Turnover on Academic Performance and Experience
........................................................................................................... 101
Table 4. 51: Impact of Teachers’ Turnover on Academic performance and Levels of
Education ........................................................................................... 102
Table 4. 52: The Impacts of Teachers’ Turnover on Academic Performance and
Gender ................................................................................................ 103
Table 4. 53: The Impacts of Teachers’ Turnover on Academic Performance and Age
........................................................................................................... 104

xv
LIST OF FIGURES
Figure 1.1 Conceptual Framework .............................................................................. 8
Figure 4. 1: Education Levels of the Respondents .................................................... 36
Figure 4. 2: Teaching Experiences of the Respondents ............................................ 37
Figure 4. 3: Reasons for Becoming a Teacher .......................................................... 38
Figure 4. 4: Perception on Teaching Profession ....................................................... 45
Figure 4. 5: Satisfactions on Teaching Profession .................................................... 51
Figure 4. 6: Prevalence of Teachers’ Turnover ......................................................... 62
Figure 4. 7: Responses towards the Salary Scale of Secondary School Teachers .... 67
Figure 4. 8: Non-monetary Benefits.......................................................................... 74
Figure 4. 9: Rate of Promotion among Teachers ...................................................... 79
Figure 4. 10: Accountability in Teaching Profession................................................ 83
Figure 4. 11: Presence of Supportive Government policies ...................................... 85
Figure 4. 12: Presence of Accommodation ............................................................... 91
Figure 4. 13: The Living Standards of Teachers ....................................................... 94

xvi
LIST OF APPENDICES
Appendix I: Research Questionnaire ..................................................................... 115
Appendix II: Interview Guide Questions for Educational Officers ....................... 121
Appendix III: The Map Showing the Study Area (Mbozi District) ....................... 122

xvii
LIST OF ABBREVIATIONS
CGE Global campaign for Education
DSEO District Secondary Education Officer
EFA Education for All
HOS Head of School
IIEP International Institute for Education Planning
INSET In-service Training
LIDCs Low Income Developing Countries
MOEVT Ministry of Education and Vocational Training
OECD Organization for Economic Cooperation and Development
PEDP Primary Education Development Plan
TSD Teachers Service Department
TTU Tanzania Teachers’ Union
UPE Universal Primary Education
URT United Republic of Tanzania
USA United States of America
SEDP Secondary Education Development Plan
SPSS Statistical Package for the Social Science
VSO Voluntary Service Overseas

1
CHAPTER ONE
1.0 INTRODUCTION
1.1 Overview
This chapter explains briefly about the background (meaning, types, factors, the
attitude of teachers and the impact of teacher’s turnover on academic performance in
government secondary schools in Tanzania), statement of the problem, objectives,
research questions, conceptual framework, significance of the study, delimitation of
the study and limitation of the study.
1.2 Background to the Study
Secondary school teachers’ turn over as a part of labour turn over in general means
shifting of labour into and out of an organization. It is also defined as the movement
of teachers in and out of the schools. This movement is a handicap for schools
academic performance because it leads to the reduction in skill and efficiency in the
industry including schools (Saleemi, 1997). There are five main types of teacher
turnover.
These are departures of teachers at the school level, movement of teachers between
public and private schools, teacher upgrading, occupational attrition (teachers leaving
the profession to take up other jobs), and teachers’ turnover at international migration
(Acheampong, 2003). At international level there is a mounting concern about the
migration of teachers from Low Income Developing Countries to the United
Kingdom and other Organization for Economic Cooperation and Development
countries. This movement from one country to another is known as brain drain. It is

2
argued that the brain drain of teachers to the North is negatively affecting teacher
supply and retention in developing countries. The outcome of this movement is poor
performance among the students.
There is evidence which shows that the overall impact on teachers supply in most
Low Income Developing Country is likely to remain minimal for the foreseeable
future due to increased number of universities. The large majority of overseas
teachers (both on work permits and working holiday visas) are from the old
Commonwealth countries such as Australia and South Africa and to a lesser extent,
New Zealand and Canada. In many parts of Sub-Saharan Africa for example, the
projected demand for secondary school teachers exceeds the projected supply.
There are different factors contributing to teachers’ turnover at international level.
Some of them are high rates of teacher attrition, illness, and bottlenecks in teacher
preparation systems. In other areas teachers’ turnover is caused by low salary,
arbitrary teacher deployment systems, unattractive work locations, unprofessional
treatment of teachers, lack of professional development opportunities and insufficient
supportive supervision (World Bank, 2007). On the other hand there are factors that
affect teachers’ turnover at national and school level. Teachers’ turnover at the
school level is a combination of attrition through long-term illness and death,
resignation, retirement, dismissal and transfers including lateral promotion and study
leave. To some areas culture of discontinuity is found to influence teachers’ turnover.
The issue of culture is found to be dominant in rural areas (Acheampong, 2003).
Generally the main issue which cause teachers’ turnover in many countries is the
high rate of transfers and attrition per se. In case of attrition, it is more common

3
among secondary school teachers than primary school teachers. The reason is that
primary school teachers do not have the education and qualifications which are
marketable in private sector labour markets and international labour markets. In case
of school category, the occupational attrition among contractual and community
teachers is higher than private school teachers in some countries (Al-Samarrai &
Bennell, 2003).
There are different strategies towards alleviation of the teachers’ turnover in
Tanzania and other parts of the world such as increasing salaries. It is also advised to
make improvement in conditions of service in order to promote job satisfaction,
motivation and promoting the retention of teachers (Mingat, 2002). Further, there
should be better teaching and learning resources, supportive supervision and ongoing
in-service professional development. There should be impressing and working
policies which focus on improving the recruitment, retention, and retraining of
secondary teachers (Farrell & Oliveira, 1993).
In the process of solving the problem of teachers’ turnover few countries have
managed to set strong policies, strategies and programmes for recruiting secondary
school teachers. Tanzania is among those countries which have tried to retain
teachers in their profession and working stations. It uses various efforts such as
Mwalimu Nyerere foundation to recruit teachers from colleges and universities since
2000s’ to work in more challenging regions like Rukwa. The strategies are not
continuous in many countries. In Tanzania for example, the fiscal capacity of the
government to improve teachers’ compensation and conditions of service is
extremely limited. This is due to reallocation of public funds from the ministry of

4
education and vocational training to other sectors, financial inability of the
government to insure an adequate supply of qualified teachers (Bennell and
Acheampon, 2003).
There is negative perception on teaching profession. This has been evidenced by
observing the complaints of teachers. Many teachers are not well motivated to reach
the extent of satisfaction. There are indicators that show de-motivation of teachers.
Some of them include low output and productivity, frustration and unrest in the
workforce, deviant and violent behaviour of workers at or outside the workplace,
frequent confrontations with supervisors and managers, non-cooperation, strike,
abuse and violent demonstration. All these lead to an increasing rate of absenteeism
among workers and excessive turnover (Haldar, 2010).
Moreover teachers’ contribution is neither recognized nor rewarded. Teachers feel
that they are not important and that their work is not valued by the society. On one
way or another failure to solve this problem is an expense to the country itself. This
is because the long run of teachers’ turnover has resulted to an increase of
expenditure in teachers’ orientation and training, hiring part time teachers, loss of
production in time interval or chain between old and new teachers and decline of
school performance.
1.3 Statement of the Problem
The overall research problem addressed in this study is that, there are complaints
relating to high rate of teachers’ turnover in government secondary schools in
Tanzania. The Public Expenditure Tracking Survey (PETS) of the Ministry of
Education, 2010 shows that 13 percent of the government secondary school teachers
5
are getting salaries without working due to attrition which brings about a loss of 11.7
billion Tanzanian shillings per year (United Republic of Tanzania [URT], 2010).
Despite the efforts such as increasing the number of teachers’ training colleges and
universities to produce enough qualified teachers, increasing the opportunities for
recruitment of teachers, slightly improving salaries and decentralization of
supervision and management to local government taken by the government and non-
governmental organizations yet teachers’ turnover has not been resolved. Several
research studies have been conducted on teachers’ turnover but their reveal towards
its causes and impact was not enough to satisfy the government and other educational
stakeholders to take effective measures.
Therefore, it was the task of the researcher to conduct the study to explore much on
the scenario to comprehend the effort done by the government and non-governmental
organizations to fill the information gap on the impact of teachers’ turnover on
academic performance in government secondary schools.
1.4 General Objective
To make an assessment of teachers’ turnover and its impact on academic
performance in government secondary schools in Mbozi district.
1.4.1 Specific Objectives
(i) Assess the attitudes of teachers towards the teaching profession which are
associated with teachers’ turnover in government secondary schools in Mbozi
district

6
(ii) Identify the factors behind teachers’ turnover in government secondary schools
in Mbozi district
(iii) Investigate the effects of teachers’ turnover on academic performance in
government secondary schools in Mbozi district.
1.5 Research Questions
(i) What are the attitudes of teachers towards the teaching profession which are
associated with teachers’ turnover in government secondary schools?
(ii) What are the factors behind teachers’ turnover in government secondary schools
in Mbozi district?
(iii) What are the effects of teachers’ turnover on academic performance in
government secondary schools in Mbozi district?
1.6 Conceptual Framework
Although there is an increase in number of secondary school teachers in recent years
still the scarcity of teachers regardless of the increased number, continue to persist in
many areas. In rural areas, culture was found to influence teachers’ turnover
(Acheampong, 2003). Low salary, arbitrary teacher deployment systems, unattractive
work locations, unprofessional development opportunities and insufficient supportive
supervision were the factors for teachers’ turnover (World Bank, 2007).
Apart from what others did on teachers’ turnover, this situation could also be
associated with the attitudes of teachers towards teaching profession, demographic,
socio-economic and socio-political factors. Attitudes of teachers are the morale or
feelings of teachers towards the teaching profession. These are the mental states of

7
teachers which tend to act or respond or are ready to respond for or against the
situation with which their vested feelings, effects, interests, liking and desires are
directly or indirectly linked or associated. In this study, attitudes of teachers were
examined in terms of decision for becoming a teacher, perception, satisfaction and
career choices.
Demographic factors are personal background aspects that determine teachers’
morale or attitudes towards teaching profession; these include gender, age, education
background; and job experience among others. Teachers self-concepts and habits
exercise a significant influence towards teaching profession.
Likewise socio-economic and socio-political factors could exercise a significant
influence on teachers’ turnover. Socio-economic factors are the social and economic
experiences and realities that help to mould teachers’ personalities, attitudes and
lifestyles such as salaries, fringe and non-monetary benefits, promotion and leave
payments
Furthermore, socio-political factors are the social and political conditions that inhibit
teachers’ voice in working places such as working conditions, accountability,
government policies, living standards, accommodation and extra duties. In a long
run the scarcity of teachers due to teachers’ turnover will have an adverse effect on
academic performance in government secondary schools. These are summarized in
the conceptual framework Figure 1.1.

8
Figure 1.1 Conceptual Framework
Source: Author, (2012)
1.7 Significance of the Study
The study is considered useful to administrators and policy makers who may find the
findings useful for formulating some policies to curb the problem of teachers’
turnover in secondary schools. Doing so, it enables them to improve academic

9
performance and saving school funds and human resources by reviewing the
recommendation about the causes and outcomes of teachers’ turnover. Also the
findings of the study will help to form a basis for formulating new strategies to
complement the government efforts.
1.8 Delimitation of the Study
The study was conducted in government secondary schools in Mbozi district.
Content wise, it focused on the teachers’ turnover and its impact on academic
performance.
1.9 Limitations of the Study
There were many problems in conducting the study. These included limited time that
hindered the researcher from covering all secondary schools in Mbozi district. This
was solved by drawing a sample of only 200 classroom teachers and 25 head of
schools and three officials to represent the whole. Likewise, there were geographical
barriers such as hindering the mobility of the researcher. The problem was solved by
the use of cars as a means of transport which enabled a researcher to visit the
selected schools.
1.10 Summary
This chapter contains presentation and discussion of the background of the study,
statement of the problem, the objectives of the study, research questions, conceptual
framework, significance, delimitation and limitations of the study.

10
CHAPTER TWO
2.0 LITERATURE REVIEW
2.1 Overview
The detailed review of literature relating to factors influencing teachers’ turnover and
its impact on academic performance is presented in this chapter. These include
attitudes of teachers towards teaching profession, demographic, socio- economic and
socio- political factors.
2.2 General Overview on Teachers’ Turnover
There are many factors that hinder teachers’ job satisfaction and motivation in their
working stations. These factors result to teachers’ turnover. Some of them are
demographic, socio-economic and socio-political factors. Haldar (2010) stated that a
person to stay with an organization or leave, depends on the level of satisfaction
derives from the work place. Hughes, Robert, and Gordon (2008) quoted reasons
behind a person leaving an organization as limited recognition and praise,
compensation, limited authority or low rate of promotion and personality conflicts.
Also, achievement, possibility of growth, advancement, salary, interpersonal relation,
technical supervision, responsibilities, company policy and administration, working
conditions and work itself, factors in personal life, status and job security are other
factors for job satisfaction (Pestonjee, 1991). Spector (1994) identified nine facets of
job satisfaction, namely pay, promotion, supervision, fringe benefits, contingent
rewards, operating procedure, co-workers, nature of work and communication.
Herzberg, Mausner, Peterson, and Capwell (1957) listed ten intrinsic aspects of job

11
satisfaction. These are supervision, working conditions, wages, opportunity for
advancement, security, company and management, social aspects of the job,
communication and benefits in which Pestonjee, (1991) justified that there is a high
positive correlation between job satisfaction and performance.
On the other hand, Gupta (2010) explained that job satisfaction is a combination of
psychological, physiological and environmental circumstance that can cause a person
to be satisfied. The level of job satisfaction seems to have some relation with aspects
of work behaviour such as accident, absenteeism, turnover and low productivity. In
most cases less satisfied employees are more likely to quit the jobs than more
satisfied employees. Other researchers like Bhattacharyya (2009) have also found
that individuals have inherent psychological needs with respect to three key areas of
their working lives. These are autonomy, competence and relatedness. Autonomy is a
person’s drive to retain a sense of agency regarding her or his actions. Competence is
a desire to be good at what we value, and relatedness is the impulse to develop
meaningful connections with others.
People are strongly motivated to satisfy these needs. If they are not fulfilled, they are
likely therefore to become dissatisfied with their jobs and thus de-motivated, that
leads to the search of other opportunities. Motivation starts with a physiological or
psychological deficiency or need that activates behaviour. It is behavioural
syndrome, which develops when there is a perceived incongruence in employees’
needs and expectations (Bhattacharyya, 2009). Work motivation refers to the
psychological processes that influence individual behaviour with respect to the

12
attainment of workplace goals and tasks. However, measuring the determinants and
consequences of work motivation is complex because these psychological processes
are not directly observable and there are numerous organizational and environmental
obstacles that can affect goal attainment (Maslow, 1943).
Herzberg (1966) developed the motivation-hygiene theory. The theory is based on a
two-dimension paradigm of factors affecting people’s attitudes about work. Factors
such as interpersonal relations, working conditions and pay are hygiene factors
which affect the behaviour of teachers. On the other hand, Hertzberg (1966)
suggested five types of motivators which determine job satisfaction. These are
achievement, recognition, the work itself, responsibility and advancement.
Motivators are associated with long-term positive impacts on job performance while
hygiene factors only tend to produce short-term changes in job attitudes and
motivation, which quickly fall back to their previous level.
Locke (1976) argued that employee motivation and promotion are likely to be
enhanced if work goals are specific, challenging, formed through employee
participation and reinforced by feedback. These arguments raise important issues for
educational systems in developing countries, in which teachers are often left to guess
at what their professional goals should be, or have goals imposed on them without
consideration of their views. Even where goals have been specified, feedback to
teachers may be limited by infrequent contact with supervisors.
Spear, Gould and Lee (2000) highlighted the wide range of factors that influence
teacher job satisfaction and motivation in the United Kingdom. The main factor

13
found to contribute to job satisfaction of teachers is working with children whereas
job dissatisfaction was primarily attributed to work overload, poor pay, and
perceptions of how teachers are viewed by society.
There is a wide range of views about teacher motivation in Africa and South Asia.
Most of which are specific to a particular country. However, there appear to be
mounting concerns that unacceptably high proportions of teachers working in public
school systems in many low income developing countries (LIDCs) are poorly
motivated due to a combination of low morale and job satisfaction, poor incentives
and inadequate controls. For example, the 2000 Education for All (EFA) Country
Assessment for Pakistan noted that poor teacher motivation is a ‘colossal/huge
problem’, which is seriously compounded by political interference. The Voluntary
Service Overseas (VSO) report on valuing teachers concludes that a potential crisis
in the teaching profession threatens the ability of national government to reach
internationally agreed targets to expand and improve education.
In many developing countries, the teaching force is demoralized and fractured (VSO,
2002). This was reported from four case studies, Tanzania, Malawi, Zambia and
Papua New Guinea. The study focused on four factors which are conditions of
employment of teachers, their situation as educators, their relationship with the local
community and their voice in educational policy. Other problems included delayed
payment of salaries, housing shortages, insufficient upgrading opportunities, lack of
learning materials, a decline of inspectorate services and insufficient involvement of
teachers’ representatives in policy making. The report by the Global Campaign for

14
Education (GCE) explains that in five years since the Education for All goals were
restated at Dakar, improving teacher motivation has still not been sufficiently
prioritized as a major concern of national or international policy makers. As a result,
teacher motivation and morale remained in a chronic state of decline. The main
reasons for this decline are large class sizes, erosion in the quality of teacher training,
the employment of Para-teachers, and other cost cutting measures such as multiple
shifts and poor pay (GCE, 2005).
2.3 Demographic Factors
Demographic factors means personal factors including age, sex, level of education
and experience. Some research studies, including Gupta (2010) explained these
demographic variables. It is revealed that there is a positive correlation between age
and job satisfaction. Workers in the advanced age group tend to become more
satisfied probably because they have adjusted with their job conditions. However
there is a sharp decline after a point perhaps because an individual aspires for better
and prestigious jobs in the later years of his life and hence become dissatisfied with
the prior position.
In case of gender, women are less satisfied than men due to fewer job opportunities
for females. But female workers may be more satisfied due to their lower
occupational aspiration. On the other hand, more educated teachers tend to be less
satisfied with their jobs probably due to their higher job aspirations. Also, job
satisfaction increases with increasing years of experience. But it may decrease after
more than twenty years of experience particularly among people who have not
realized their job expectations.

15
2.4 Attitudes of Teachers towards Teaching Profession
The attitudes of teachers towards teaching profession can be explained in terms of
decision for becoming a teacher, perception on teaching profession, job satisfaction
and further career choice. There is negative perception on teaching profession. This
has been evidenced by observing the complaints of teachers. Many teachers are not
well motivated to reach the extent of satisfaction. Haldar (2010) suggested some
indicators that show de-motivation of employees which include, low output and
productivity, frustration and unrest in the workforce, deviant and violent behaviour
of workers at or outside the workplace, frequent confrontations with supervisors and
managers, non cooperation, strike, abuse and violent demonstration. All these lead to
an increasing rate of absenteeism among workers and excessive turnover.
Moreover teachers’ contribution is neither recognized nor rewarded. Teachers feel
that they are not important and that their work is not valued by the society. On one
way or another failure to solve that problem is an expense to the country itself. This
is because the long run of teachers’ turnover has resulted to an increase of
expenditure in teachers’ orientation and training, hiring part time teachers, loss of
production in time interval or chain between old and new teachers and decline of
school performance. The head teachers and head of schools as well as teachers
themselves believe that teachers at their schools have the necessary knowledge and
skills to perform their jobs well but most of them are unable to master the rural
environment as a result they go back to towns to seek for other jobs in other
institutions. The main implication of this finding is that teachers are not motivated in
their capacities as teachers. Nonetheless, the demand to upgrade qualifications and

16
attend in-service training courses is still high which lead many teachers to leave from
schools to colleges or universities (Mulkeen, 2005). Babyegeya (2002) argued that a
significant number of teachers in the developing countries have low level of
academic knowledge before they are recruited and trained to become teachers.
Some of secondary school teachers are Form Six leavers with minimum training or
without professional training thus, the possibility for them to move or to quit is
higher particularly when opportunities for higher education arise. Rural areas have
more under qualified teachers than urban areas. Those teachers do not approach the
level of mastery and accuracy needed to teach secondary school students effectively.
Also in some cases where the education and training level of headmasters and
headmistresses is hardly lower than that of their teaching staff, they face problems
when it comes to orienting the new staff or carrying out managerial duties, they
become less confident, suspicious to advice from the staff and act offensively.
Low and declining quality of the primary and secondary school teachers is identified
as a major factor contributing to low occupational status and poor motivation in
many findings. In most countries, vocational commitment and occupational status is
closely related to limited vocational commitment to teaching among the majority of
teachers. According to Babyegeya (2002) teachers’ status has declined substantially,
in developing countries. Low pay and subsequently low purchasing power is one of
the factors that reduce the status of teachers. The teaching profession is no longer
attractive and fewer qualified graduates, particularly male graduates in Tanzania, do
not want to enter the teaching profession. Some of those teachers join teaching

17
profession as a last resort. Teachers also complain that the emergence of the Para-
teacher in many countries has reduced the status of regular teachers. The shortening
of pre-service training in many African countries to just one year in colleges
followed by one year of supervised on the job training has also lowered the overall
standing of teaching in relation to other professions.
It has further been observed that the loss of teachers’ status is due to poor housing
and travel. Housing and travel are the two critical issues affecting teacher morale and
motivation in virtually every country. Finding decent accommodation in rural areas
is a major headache for most teachers. Travel to work tends to be a much bigger
problem for urban teachers. The high cost of travel contributes to teacher
absenteeism and lateness in urban schools.
2.5 Socio-economic Factors
There are different socio-economic factors that underpin teachers’ turnover. Some of
them have been explained hereunder:
2.5.1 Salaries
It is revealed that teachers are underpaid when comparing to other workers with the
same level of education. World Bank (2004) showed that, there is poor motivation
among teachers in Sub Saharan countries because of underpayment. Payment is the
key factor undermining teachers’ morale and motivation. The decline of morale and
motivation in Africa is a result of having dependants who cause them to search for
green pastures in private institutions. Recently, it has been shown by Chamberlin,

18
Wragg, Haynes and Wragg (2002) that despite some improvement in pay in recent
years in some countries, most primary and secondary school teachers, particularly in
relatively high-cost urban centres, are simply unable to meet their basic household
needs. As a result, many of them are forced to find other sources of income. Those
who cannot earn additional income slide into poverty.
Maslow’s (1943) basic needs theory postulates that there are certain minimum
requirements that are essential to a standard of living. These are known as
physiological needs. They include food, shelter, health and clothing. These are
primary needs that have to be catered for before other needs such as security and
safety, sense of belonging and affection, love, esteem and self-actualization
(Maslow, 1943). A key proposition is that if the lower level needs remain unmet, the
higher level needs cannot be fulfilled. This theory seems particularly relevant to
teachers in Less Developed Countries because due to the challenges of meeting the
basic survival needs especially food and shelter. These can seriously impair the
realization of higher level needs and without those needs; effective teacher
performance cannot be attained. For better understanding, teachers who are tired,
hungry and excessively preoccupied about meeting their household’s livelihood
needs, are unlikely to become strongly motivated by their involvement in
professional development activities. Although Maslow’s theory has received only
limited empirical support by Hoy and Miskel (1991), it is a useful theoretical
framework for this study. Low salaries often force teachers to seek additional work
including part time in other schools which reduce the effectiveness in their allocated
permanent stations.

19
Teachers’ salaries in low-income countries have declined in both absolute and
relative terms. In many countries the teaching force has been expanded, yet teachers’
salaries have been eroded. This decline in wages often affects the attendance,
motivation and performance of teachers which leads to poor quality of education.
Wages and salaries in the organization should be in line with wages and salaries for
comparable jobs in other organizations, otherwise the Ministry of Education and
Vocational Training will not be able to attract and retain competent personnel
(Gupta, 2010).
Teachers’ salaries as it is in other areas of the public sector are declining in real
terms. In Tanzania for example, teachers in 1987 had the purchasing power between
40 to 70 percent of the lowest paid teacher in 1977 (Babyegeya, 2002). This results
into ineffective teaching because of absenteeism of teachers from work, illicit,
practice moonlighting both during and after teaching hours and hence demoralized
teaching work force. In the urban areas, teachers open small businesses or become
causal taxi drivers while in the rural areas they spend more time in their farming
plots. As a result they do not prepare and mark students work well.
2.5.2 Fringe Benefits
Fringe benefits include, pension, gratuity, encashment of earned leave, houses, leave
travel concession, medical aid and interest free loans. Fringe benefits are
supplements to regular wages or salaries. Every organization provides some benefits
and services to its employees in order to attract and retain them, and to maintain
loyalty towards the enterprise (Saleemi, 1997). Fringe benefits improve employees’
performance to a large extent and help in recruiting and retaining potential

20
employees (Gupta, 2010). In fact in fields where there is a high demand for workers
such as teaching, some unusual fringe benefits may be offered to attract employees.
Since teachers’ salaries are relatively low, fringe benefits should be offered. Thus in
absence of these, there is a likelihood of turnover.
Also incentives can be given to employees to motivate them. Incentives are
performance-linked remuneration paid with a view to inspire employees to work hard
and do better (Gupta, 2010). Wage incentive plans should be designed to attract and
retain talent, to motivate and to improve productivity by better utilization of human
and material resources of the enterprise. The literature by International Institute for
Educational Planning (IIEP) (2004) on teacher motivation and incentives in
developed countries has many common or similar themes with very much more
limited literature on this subject in low-income developing countries.
In particular, it is widely contended that the status of teachers in most Organization
for Economic Cooperation and Development (OECD) countries has declined
appreciably during the last fifty years, teacher autonomy and creativity has been
curtailed by more control and regulation, and that teachers are being asked to do
more with less. Teachers also complain about lack of variety and role differentiation
in their careers, the limited incentives for them to improve their practice and develop
as professionals and the limited linkage between their performance, teacher
compensation and teacher development (IIEP, 2004).
With reference to specific incentives, Vroom’s (1964) ‘‘expectancy theory’’ is
relevant to this study especially in developing countries because of its recognition
that the links between effort and reward may be very tenuous. For example,

21
improved pay for senior posts may not motivate eligible teachers if they have no
confidence in the system of assessment and selection for such posts. Work
motivation has a collective, as well as an individual dimension which is explored by
equity theories (Wilson & Rosenfeld, 1990). Therefore when teachers are dissatisfied
and de-motivated they are likely to quit the job.
2.6 Socio-political Factors
Different literatures have explained the socio-political factors. These factors include;
accountability, government policies and working conditions.
2.6.1 Accountability of Teachers
The degree to which teachers are properly accountable to their children, the parents,
their heads of schools, the district and national level managers has a powerful
influence on teacher motivation levels. In many areas there is poor accountability
that leads to movement of teachers from the allocated centres. In South Asia, in
particular, the accountability culture is very weak. The politicization of the teaching
profession is perhaps the single most important reason for low teacher accountability
and it affects nearly all aspects of job motivation including recruitment, deployment,
promotion and management control.
The higher level of accountability of non-formal community schools to parents and
the host communities are key reasons for their success. Communities have a sense of
ownerships of their schools, which is largely lacking in government schools.
However, these schools account for only a small share of total enrolments (Bennell,
2006). Notwithstanding that, but also teachers’ accountability to school

22
managements and to parents and the community as a whole has not been increased.
This is particularly the case at government primary and secondary schools in
Tanzania and in most of South Asia where very limited teachers and schools
accountability seriously undermine the provision of quality basic education.
2.6.2 Government Policies
The policy environment for Universal Primary Education (UPE) is the single most
important education goal in nearly all low-income developing countries. However,
the pursuit of this goal has both positive and negative impacts towards teacher
motivation. Efforts to attain UPE goals are usually accompanied by much increase in
resource from the support of international donor partners. But in Sub-Saharan
countries, including Tanzania, teachers are demoralized, especially when teacher
recruitment does not keep pace with rapidly increasing enrolments. Workloads and
class sizes have increased appreciably in many countries as a direct result of the UPE
policy. Teachers and teacher unions complain that most of the additional resources
are being used to increase enrolment capacity and education quality without directly
addressing the professional needs of teachers thus it increases the teachers’ turnover
(IIEP, 2004). The weak correlation between school enrolments and the numbers of
teachers employed in each school is the most obvious indicator of poor deployment.
Variations in pupil-teacher ratios between schools are typically very large in most
countries. Many countries have resorted to employing non-qualified or under
qualified teachers. This approach raises serious problems, since in a long term
perspective this will be detrimental to the education system as a whole. Quality will
decline reducing teachers’ status and peoples’ belief in education system. In turn this

23
will drive away valuable candidates to the profession, leading them towards more
attractive sectors. In Tanzania, for example, both Primary Education Development
Plan (PEDP) and Secondary Education Development Plan (SEDP) have dramatically
increased enrolments. According to Babyegeya (2002) some schools have more than
enough qualified teachers while some have insufficient. Rural schools are resourced
poorly in comparison to urban schools. The difference in resourcing is also observed
in schools located in urban areas. Even in urban areas schools differ in locations and
working environments. Some of them are well equipped while others not.
Availability of social services attracts teachers to get in rather than getting out.
2.6.3 Working Conditions
The living condition of teachers is worsened by lack of appropriate accommodation
to live in and walking long distance which sometimes cause absenteeism, lateness
and turnover. These physical environments of schools are not attractive. Babyegeya
(2002) explained that class sizes in many countries are very large. Although the
average Pupil-Teacher Ratio (PTR) at secondary school level in Tanzania is 20:1.
The class sizes vary from school to school depending on the location of the school,
the sufficiency of classrooms and the number of teachers. Schools with enough
teachers especially in urban areas, have relatively low PTR and subsequently small
class sizes. In other schools because of few classrooms, several streams of the same
class are combined to form one class which is very large and results to ineffective
teaching and learning processes. Very large class sizes are the norm for most
teachers in all the case study countries. In countries such as India and Pakistan, rural
schools typically have just one or two teachers (Mulkeen, 2005).

24
Conflict and security, war, insurgency and insecurity have a major impact on teacher
motivation and commitment. In some countries such as Sierra Leone, Nepal and
Tanzania there are cross cutting conflicts which results to teachers’ instability in their
specific working stations. Lack of secure and safe school compounds is also a
widespread concern, especially in urban schools in Africa (Locke, 1976). Certain
stability in the job ensures future income and the employee is motivated by the
consideration of job security (Saleemi, 1997).
Haldar (2010) suggested that coercive type of supervision or control may give an
employee a feeling that he/she is not being trusted. When this feeling persists for a
long time it is quite likely to cause de motivation and erode his/her interest in the
work. If supervision is too coercive, the morale of the worker may be affected hence
mistrust crops up. Consideration supervision tends to improve job satisfaction of
workers. A considerate supervisor takes interest in his subordinates and allows them
to participate in the decision making process. However authoritarian people may be
more satisfied under the supervision of high status and strongly directive leaders
(Gupta, 2010). Employee satisfaction from supervisory behaviour depends upon the
influence which the supervisor exercises on his own superior. The indications of de
motivation at work place includes low output and productivity, frustration and unrest
in the work place, deviant and violent behaviour at or outside the work place,
frequent confrontations or arguments within supervisors and managers, non
cooperation, strike, abusive and violent demonstrations and finally increasing of
absenteeism among workers and excessive turnover (Haldar, 2010). Frustration is the
most common manifestation of de motivation. Whenever it develops a worker will

25
either seek a better job elsewhere if he/she can or will develop a sense of apathy
towards the organization and his /her work so that he/she would do as little as
possible.
2.7 Academic Performance
One of the challenges facing government secondary schools is to achieve academic
excellence. This academic performance is associated with many factors. However
teachers’ turnover has been considered as the main factor. A major perception of
developed countries on school effectiveness is that achieving better learning
outcomes depends fundamentally on improvements in teaching. Although there are
many other factors that affect learning outcomes, teaching is the main school-level
determinant of school performance.
Thus, ways to increase teacher motivation and capabilities are central to any
systematic attempt to improve learning outcomes. A considerable amount of research
has been conducted on what makes the ‘effective’ teacher. Yet, the focus on policy
reforms in most countries has been on improving learning outcomes through a better
allocation of resources, more accountability, curriculum reforms and refined
assessment systems, and better pre- and in-service teacher training. However, the
limited impact of many of these interventions has forced politicians and
policymakers to focus increasingly on the needs of teachers.
2.8 Synthesis and the Research Gap
Different studies, as explored in literature, have investigated on teachers’ turnover at
a very broader context which becomes difficult to provide in-depth information. In

26
Tanzania for example very few studies have been conducted by providing the general
knowledge. In case of time, as shown in the literature many studies were done before
2005. Thus the Ministry of Education and Vocational Training is lacking current data
which can enable and simplify policy reforms. The issue of poor performance is also
still a hypothetical situation since there are no clear specified causes. Therefore it is
the task of the study to disentangle this phenomenon and come up with evidences.
2.9 Summary
This chapter reveals the presentation of literary works of other people relating to the
attitudes of teachers towards teaching profession, demographic, socio-economic and
socio-political factors that influence teachers’ turnover and its impact on academic
performance in government secondary schools.

27
CHAPTER THREE
3.0 RESEARCH METHODOLOGY
3.1 Overview
Research methodology is a system of models, procedures and techniques used to find
the results of a research problem. It is a science of study on how research is done
scientifically. Research methodology is not only research methods but also it makes
consideration the logic behind the methods/techniques to be used. Thus research
methodology is the way how the research is conducted (Kothari, 2004). The research
methodology of the study elucidates the study area, the research design, sampling
procedures, data collection, analysis and interpretation.
3.2 Description of the Study Area
The study was conducted in Mbozi district whose headquarter is Vwawa. This was
due to the researcher being familiar with the district which will simplify accessibility
of information. In terms of location, Mbozi district is located in the South Western
corner of Mbeya Region, between latitudes 80 9’ 12” south of the equator and
longitudes 320 7' 30" and 330 2' 0" east of Greenwich meridian. It is bordered with
Malawi in the south, Zambia in the western part, Rukwa region in the Northwestern,
Chunya district in the North, Mbeya rural district in the east and Ileje district in
south-east. Mbozi district consists of dynamic population which increases time to
time. According to the 1988 Census, Mbozi district had a population of 330,282.
About 157,325 were males and 172,957 were females from 59,674 households.
Through 1978–1988 census report, the annual average population growth rate was
3.4 percent. Thus, Mbozi district still had the highest growth rate out of all districts

28
in the region. It had been observed that between 1967 - 1978 and 1978 - 1988, when
the country's population was growing at an average rate of 3.3 percent and 2.8
percent respectively, Mbozi district population grew at the rate of 4.3 percent and 3.4
percent respectively (URT, 2002). According to the 2002 census, Mbozi district had
a population of 513600 whereas 243948 were males and 269652 were females from
99674 household in which the growth rate was 3.1 percent (Mbozi district profile,
2002). Likewise, the main activities are agriculture, forestry, fishing, mining and
quarrying, trade and commerce, public administration and education. Agriculture
constitutes of 88.9 percent, forestry and fishing accounts for 3.5 percent, trade and
commerce comprises of 3.8 percent, public and economic sectors and other
categories consist of 1.9 percent each (URT, 2002). In terms of the number of
secondary schools, the district consists of fifty four Government secondary schools
with five hundred and fifty-nine teachers (Mbozi district TSD Office, 2011).
3.3 Research Approaches
The researcher used both quantitative and qualitative approaches. Quantitative
approach involves the generation of data in quantitative form which can be subjected
to rigorous quantitative analysis in a formal and rigid fashion while qualitative
approach is concerned with the subjective assessment of attitudes, opinions and
behaviour. Qualitative approach generates results either in non-quantitative form or
in the form which are not subjected to rigorous quantitative analysis (Kothari, 2004).
Quantitative data is hard, rigorous, credible and scientific while qualitative is
sensitive, nuanced, detailed and contextual (Chakraborty, 2009). Therefore, there
was a need for applying both techniques in order to get a comprehensive report.

29
3.4 Study Design
Study design is a plan in which data is collected and analyzed so as to obtain the
required information (Orodho, 2003). It is a detailed blue print used to guide a
research study towards achieving its objectives. A complete research design also
spells out the constraints anticipated in the execution of the research proposal. In the
study, the researcher applied both quantitative and qualitative approaches. The
researcher used cross-sectional survey design as one of the most important design in
applied social research. This design allowed useful information to be collected from
different categories of people at the same time.
Also it was used to assess the relationship which exists in two or more variables in
the selected title. More, the design was considered favourable because of time limit
and resources available for the data collection. First the researcher gathered
quantitative data through group administered questionnaires from teachers in the
selected schools and then qualitative data were collected through personal interviews
from heads of schools, Teachers Service Department (TSD) and Teachers Trade
Union (TTU) officers. Qualitative data were used to enrich quantitative data.
3.5 Type of the Research
This research is an applied research since it deals with the teachers’ turnover which
is a societal problem. The study brought about deeper insights and better
understanding of the problems facing teachers. Applied research has the explicit
purpose of improving a product such as academic performance among students by
solving the actual problems of teachers.

30
3.6 Targeted Population
Population is a group of individuals, objects or items from which the samples is
taken for measurement (Best and Kahn, 2006). The population of the study was all
teachers from government secondary schools in Mbozi district and members from the
Teachers Service Department, Teachers’ Trade Union and the DEOs office.
3.7 Computation of Sample Size
A sample is a small proportion of a population selected for observation and analysis
(Best and Kahn, 2006). It is a finite part of a statistical population whose properties
are studied to gain information about the whole. Sample size is the number of items
to be selected from the universe. The researcher computed the sample size of the
respondents by using the estimation of the sample proportions in which q = is used
as an estimate of ө, we can assert with (1-ά) 100% confidence that the error (ẹ) is less
than Zά∕2 times under root ө times (1- ө) or p over n, where n is a number of samples
that the researcher sampled, ά is a confidence interval, ө is a population proportions.
Its formula is given by
2
2
2
Z Pq
ne
. The researcher used =0.05, p=0.5, for
1q p consequently 1 0.5q = 0.5, e=0.065, 2
Z
=1.96 is a constant coefficient
associated with the confidence level that is being used; and hence =
227.3136095 ≈ 228 respondents.
The above computations enabled the researcher to get 228 respondents from which
200 were normal classroom teachers who responded to questionnaires. Apart from
that, 25 were heads of schools and other officials who participated through

31
interviews. From the category of other officials, there was a TSD member, DSEO
and TTU-member. The response rate of both questionnaires and interviews was 100
percent.
3.8 Sampling Procedures
Sampling is a procedure which a researcher uses to gather people, places or things to
study (Kombo & Tromp, 2006). It is a process of selecting a number of individuals
from a population which is a representative of a population. For this research,
Stratified and simple random sampling techniques were applied in selecting
secondary schools. Two strata were formed from 54 government secondary schools,
9 schools were in urban and 45 schools were in rural area. The researcher selected
twenty eight schools in which 5 out of 9 were from urban area and 23 out of 46 were
from rural area.
These schools were stratified purposely in order to avoid biasness and to involve
teachers working in different socio-cultural environments. In sampling the number of
teachers, the researcher applied the probability proportional to size (PPS) which is
given by PPS= х n; where x is a number of teachers for a particular selected school,
n is the sample size of teachers (200) and N is the total population (349).
3.9 Research Methods
The study involved different methods in the single study. They were a survey, focus
group discussion and interview. A questionnaire, which was used during survey,
usually consists of a number of questions printed or typed in a definite order on a
form or set of forms while interview data collection is the presentation of oral-verbal

32
stimuli and reply in terms of oral-verbal responses (Kothari, 2004). For the study, the
researcher administered the questionnaires and then personal interview in a form of
face-to-face contact.
Table 3.1: Sample Size
SCHOOL NUMBER OF TEACHERS Sample size
ISANGU 21 12
ILOLO 26 14
MLOWO 21 12
JM KIKWETE 16 9
MPAKANI 18 10
CHIKANAMLILO 10 5
HAMPANGALA 9 4
HEZYA 7 3
IDIMI 14 8
IGAMBA 15 9
IGANDUKA 8 4
IHANDA 26 14
IPUNGA 15 8
ISALALO 8 4
ISANDULA 13 7
ITAKA 12 6
ITUMPI 9 4
IVUNA 12 6
KAPELE 11 6
KILIMAMPIMBI 9 4
MOMBA 14 8
MSANGANO 16 9
MSANKWI 10 5
MSENSE 15 9
NAMBINZO 13 7
NAMOLE 7 3
SHAJI 10 5
UWANDA 10 5
Total 349 200
HOS 25 25
DSEO 1 1
TSD 1 1
TTU 1 1
Total 28 28
TOTAL 377 228
Source: DSEO –Office (July, 2012)

33
3.9.1 Primary Data Collection
Administered questionnaires were used to collect primary data from normal class
room teachers for each selected school while personal interview was employed to
heads of schools of those selected schools and educational officers. In order to search
for in-depth information, there was a need of Focus Group Discussion.
3.9.2 Secondary Data Collection
The researcher used secondary data which was obtained from a review of various
documents relevant to the study. These were Secondary Schools Statistical Forms
and National Examinations Records. Also the researcher used some references,
especially in a part of research proposal.
3.10 Data Organisation and Analysis
The data collected were sorted, coded and summarized before analysis. Analysis was
done by using the computer software known as Statistical Package for the Social
Sciences (SPSS) and manually. Descriptive statistics, tables, and graphs were used to
simplify the process of analysis. Cases which were difficult to be analyzed
quantitatively then qualitative method of analysis were applied. Likewise the data
from the field were subjected to some statistical analysis such as cross-tabulation and
chi-square in validating the similarities and variations of findings.
3.11 Ethical Issues in Data Collection
To motivate the respondents the researcher explained briefly the nature and
importance of the study and assuring them with confidentiality as research

34
autonomy. Permission to conduct the research was obtained from relevant
authorities.
3.12 Summary
In this study, quantitative and qualitative approaches were used to get a
comprehensive report on teachers’ turnover and its impact on academic performance
in government secondary schools. The study applied survey design to collect both
quantitative and qualitative data through questionnaires and interviews. The sample
involved 200 classroom teachers who responded to questionnaires, 25 heads of
schools and 3 officials who responded to interviews. Stratified and simple random
sampling was used to select number of schools. Probability proportional to size was
used to get a number of teachers for a particular selected school. Data collected were
sorted, coded, summarized and analyzed both quantitatively and qualitatively.

35
CHAPTER FOUR
4.0 RESEARCH FINDINGS AND DISCUSSION
4.1 Overview
This chapter constitutes of four sections. The first section presents the demographic
characteristics of the respondents. The second section examines the attitudes of
teachers towards teaching profession. The third section contains the analysis of the
factors of secondary school teachers’ turn over and the fourth section is on the effects
of teachers’ turnover on academic performance in government secondary schools.
4.2 Demographic Characteristics of the Respondents
This section describes the gender, age, education level and experience of the
respondents of the study area. It has been shown by Gupta (2010) that these
demographic factors play a great role in influencing teachers’ turnover in many
areas. Therefore, it was important for the study to explore those demographic
variables which influenced teachers’ turnover by identifying the similarities and
variations of the study findings. The findings are presented hereunder.
4.2.1 Gender
Gender is an important demographic variable that could determine teachers turn
over. Their frequency and percentage distributions are shown in Table 4.1.
Table 4.1: Gender of the Respondents
Gender Frequency Percentage
Female 70 35.0
Male 130 65.0
Total 200 100.0
Source: Field survey, 2012

36
From Table 4.1 a larger proportion of the respondents were males. Males constituted
65 percent of the total respondents. It was followed by females whom accounted for
a smaller proportion (35 percent). This distribution was enough for answering the
study objectives since it reflects Tanzanian teachers that there is a large number of
male than female teachers.
4.2.2 Age of the Respondents
The study constituted the respondents with different ages. Three age groups were
considered and presented in Figure 4.2.
Table 4.2: Age of the Respondents
Age Frequency Percentage
20-34 162 81.0
35-49 35 17.5
50+ 3 1.5
Total 200 100.0
Source: Field survey, 20
Figure 4.1: Education Levels of the Respondents
Source: Field survey, 2012

37
4.2.3 Education Level
The context of education level is a fundamental factor which influences teachers’
turn over. The study explored the respondents with different levels of education. The
results are presented in Figure 4.1.
The findings in Figure 4.1 show that 50 percent of the respondents were degree
holders, 49 percent were diploma holders and one percent had no formal education or
below diploma. Hence there is a slight difference between the diploma and degree
holders. These results reflect the current situation where most of the teachers are
degree holders.
4.2.4 Experience of the Respondents in Teaching
In teaching profession one’s experience can determine the turnover and academic
performance of a certain school. The interval of teaching differed among the
respondents. The distribution data of working experience are presented in Figure 4.2
Figure 4.2: Teaching Experiences of the Respondents
Source: Field Survey, 2012

38
From Figure 4.2 majority of the respondents had less than five years in their teaching
profession which was 59.5 percent. It was followed by the respondents who had
worked for five to ten years that accounted for 29.5 percent whereas 11 percent of
the respondents had an experience of more than ten years.
4.3 The Attitudes of Teachers towards Teaching Profession
The attitudes of teachers towards teaching profession were found to be the cause of
teachers’ turnover. The attitudes influence teachers’ turnover in four aspects. These
are decision, perception, satisfaction and career choice as explained below.
Figure 4.3: Reasons for Becoming a Teacher
Source: Field Survey, (2012)
4.3.1 Decision for Becoming a Teacher
Decision towards teaching profession is the aspects that enable the assessment of
teachers’ attitude. Al-Samarrai and Bennell (2003) explained that lack of alternative

39
employment opportunities keeps people to become teachers in most countries. The
study explored whether one had an interest in teaching profession or not. The
distributions of their responses towards teaching profession are presented in Figure
4.3.
From Figure 4.3 a larger proportion (66 percent) of the respondents were interested
in teaching whereas 28 percent of the respondents opted teaching profession because
of lack of other opportunities and 6 percent opted for teaching as a temporary
employment. From this distribution it can be concluded that many people are
interested in teaching from their prior decision to join the college because of socio-
economic issues. More, it was quoted from some key informants who were not
interested and those who became teachers just temporarily that:
In real situation the teaching profession has lost it’s direction. Teachers have low
morale and this leads to high rate of absenteeism, teachers’ turnover, excessive
complaints and grievances, frustration and friction among supervisors, antagonism
towards the school and its management, resistance to change and hence poor
academic performance (Source: Female head of school, July, 2012).
In the past teachers were respected. Teachers’ status started to decline during the
implementation of SEDP in 2004 because many community secondary schools were
built and opened, at least one for each ward without teachers. Due to the high
demand of teachers, the government decided to train Form Six leavers by crush
programme for one month and recruit them to curb the problem. That was the period
when most youth with low passes and with no interest started to join teaching

40
profession because it was the only profession which provides employment in a large
number and also it was a bridge to get admission and loan for further studies (Source:
Another female head of school, July 2012).
These findings concur with Cole’s (1995) report which explained that the different in
attitudes at workplace can cause considerable disruption to the nature, pace and
efficiency of work. Cross-tabulations on the reasons for becoming a teacher with
various demographic characteristics of the respondents revealed some interesting
variations and similarities. The characteristics considered were age, gender,
education levels and experience of the respondents.
(i) Reasons for Becoming a Teacher and Age of the Respondents
On age of the respondents, Spear et al. (2000) explained the wide range of attitude in
the context of one’s decision to become a teacher. Some of the teachers continue
with their career in order to have economic well-being in their livelihood. The study
findings have also shown that the reasons varied by age. Three main reasons were
common in the study. The findings are presented in Table 4.3.
Table 4.3: Reasons for Becoming a Teacher and Age
Decision for being a teacher Age
20-34
(n = 162)
35-49
(n = 35)
50 or above
(n = 3)
Total
(n = 200)
Interest in teaching (n = 132) 66.7% 62.9% 66.7% 66.0%
Lack of other opportunities (n = 57) 28.4% 31.4% 33.3% 28.5%
Temporary employment
(n = 11)
4.9% 5.7% 0.0% 5.5%
Total (n = 200) 100.0% 100.0% 100.0% 100.0%
46.532
, p-value = 0.254, degree of freedom = 4
Source: Field Survey, 2012

41
From Table 4.3 the cross tabulation about the decision for becoming a teacher by age
showed some variations and similarities. A large proportion (66.7 percent) of the
respondents with 20-34 years was interested in teaching. The data from key
informants revealed that teaching career advances one’s area of specialization
whereas a smaller proportion of 28.4 percent lacked other opportunities and 4.9
percent were just temporarily in teaching profession due to lack of other incentives.
Further, 62.9 percent of the respondents with 35-49 years were interested in teaching
and 31.4 percent lacked other opportunities whereas 5.7 percent of the respondents
opted teaching temporarily. On the other side, the respondents with age 50 or above,
66.7 percent were interested in teaching and 33.3 percent lacked other opportunities
due to the same reasons as stated in age group 20-34. These variations are not
statistically significant since the p-value is 0.254. Therefore, there is no direct
correlation between age and the reasons for becoming a teacher.
(ii) Reasons for Becoming a Teacher and Gender of the Respondents
There are variations and similarities in the decision for becoming a teacher and
gender. The study identified those similarities and differences. The results are
presented in Table 4.4.
Table 4.4: Reasons for Becoming a Teacher and Gender
Decision for being a teacher Gender
Male (n =
68)
Female
(n = 132)
Total (n =
200)
Interest in teaching (n=132) 64.7% 66.7% 66.0%
Lack of other employment opportunities (n=57) 32.4% 26.5% 28.5%
Temporary employment (n=11) 2.9% 6.8% 5.5%
Total (n=200) 100.0% 100.0% 100.0%
89.172
, p-value = 0.409, degree of freedom = 2
Source: Field Survey, 2012

42
The results presented in Table 4.4 show the reasons for becoming a teacher by
gender. Among male, about 64.7 percent were interested in teaching, 32.4 percent
became teachers because of lacking other employment opportunities and 2.9 percent
were teachers temporarily. The patterns of males’ findings are likely to be similar to
female. Majority (66.7 percent) of female respondents were interested in teaching,
26.5 percent did not get other employment opportunities and 6.8 percent decided to
start with teaching profession and later they shift to other jobs. The results indicated
that everyone has his/ her own perception in becoming a teacher. Some find the job
as more important in wealth accumulation whereas others do not find that they will
benefit from teaching rather than getting torture during working. These similarities
and variations are statistically insignificant as suggested by the chi-square test whose
p-value = 0.409.
(iii) Reasons for Becoming a Teacher and Education Level of the Respondents
Regards reasons for becoming a teacher and education level of the respondents it was
disclosed that education level is one of the demographic characteristic that
determines the attitude of teachers towards teaching profession. The reasons for
becoming a teacher were found to vary by levels of education. These variations are
presented in Table 4.5.
The results in Table 4.5 show that 50 percent of the respondents below diploma level
of education were interested in teaching and 50 percent join teaching profession as a
temporary job. On the other hand, majority (60.2 percent) of the respondents with
diploma were interested in teaching whereas 34.7 percent lacked other employment

43
opportunities and 5.1 percent became teachers temporarily. Among the bachelor
holders, 72 percent of them were interested in teaching, 23 percent lacked other jobs
and 5 percent were temporary teaching while searching for green pastures elsewhere.
These variations are statistically significant since the p-value is 0.023 hence there is a
strong association between decision for becoming a teacher and levels of education.
Table 4.5: Reasons for Becoming a Teacher and Education Level
Reasons for being a teacher Education level
Untrained
(n = 2)
Diploma
(n = 98)
Bachelor
(n = 100)
Total
(n = 200)
Interest in teaching
(n = 132)
50.0% 60.2% 72.0% 66.0%
Lack of other employment
opportunities (n = 57)
0.0% 34.7% 23.0% 28.5%
Temporary employment (n =
11)
50.0% 5.1% 5.0% 5.5%
Total (n = 200) 100.0% 100.0% 100.0% 100.0%
47.1132
, p-value = 0.023, degree of freedom = 4
Source: Field Survey, 2012
(iv) Reasons for Becoming a Teacher and Experience of the Respondents
On reasons for becoming a teacher and experience of the respondents, the responses
towards decisions for becoming a teacher vary with one’s experience. The study
identified these variations. The outcomes are presented in Table 4.6.
Table 4.6 shows the extent to which experience determines the decision for
becoming a teacher. About 68.1 percent of the teachers with an experience less than
five years were interested in teaching whereas 26.1 percent lacked other
opportunities and 5.9 percent were there temporarily so that they continue seeking
for other jobs. Teachers who had been teaching for five to ten years had also

44
different responses. More than half (62.7 percent) were interested in teaching where
as 30.5 percent lacked other opportunities and 6.8 percent became teachers
temporarily. Moreover, the variations among teachers with more than ten years were
found. It was found that 63.6 percent were interested in teaching career and 36.4
percent lacked other employment opportunities and no one was there temporarily.
These variations were statistically insignificant since P-value = 0.659.
Table 4.6: Reasons for Becoming a Teacher and Experience
Reasons for being a
teacher
Experience
<5 years (n
= 119)
5 to 10 years
(n = 59)
>10 years
(n = 22)
Total
(n = 200)
Interest in teaching
(n = 132)
68.1% 62.7% 63.6% 66.0%
Lack of other
employment
opportunities (n = 57)
26.1% 30.5% 36.4% 28.5%
Temporary employment
(n = 11)
5.9% 6.8% 0.0% 5.5%
Total (n = 200) 100.0% 100.0% 100.0% 100.0%
21.242
, p-value = 0.659, degree of freedom = 4
Source: Field Survey, (2012)
4.3.2 Perception on Teaching Profession
There are negative and positive perceptions in teaching profession. Some teachers
have negative perception due to low productivity of the profession, thus most of
them are likely to quit the job (Gupta, 2010). The respondents were asked whether or
not their job means a lot more than just money. Figure 4.4 shows the responses.
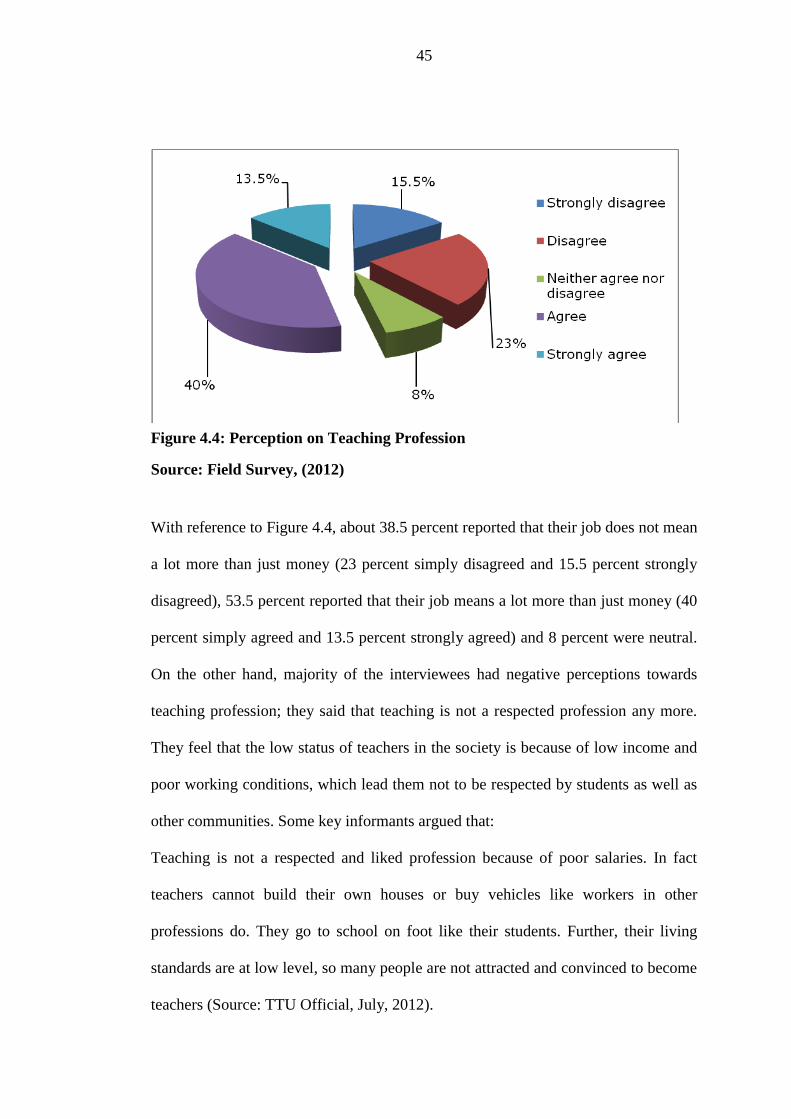
45
Figure 4.4: Perception on Teaching Profession
Source: Field Survey, (2012)
With reference to Figure 4.4, about 38.5 percent reported that their job does not mean
a lot more than just money (23 percent simply disagreed and 15.5 percent strongly
disagreed), 53.5 percent reported that their job means a lot more than just money (40
percent simply agreed and 13.5 percent strongly agreed) and 8 percent were neutral.
On the other hand, majority of the interviewees had negative perceptions towards
teaching profession; they said that teaching is not a respected profession any more.
They feel that the low status of teachers in the society is because of low income and
poor working conditions, which lead them not to be respected by students as well as
other communities. Some key informants argued that:
Teaching is not a respected and liked profession because of poor salaries. In fact
teachers cannot build their own houses or buy vehicles like workers in other
professions do. They go to school on foot like their students. Further, their living
standards are at low level, so many people are not attracted and convinced to become
teachers (Source: TTU Official, July, 2012).

46
Teachers are not respected by any one. Even our students respect us as long as we are
at the school compound. Once we are outside the school, there is no respect. I have
tried to convince and encourage my students even my children to opt for teaching
profession, they all laugh at me. When looking at their eyes and faces I see them as if
they are saying “We do not want to be like you”. Students and our children see the
conditions in which we live and the kind of life we have, so they do not want to
become like us (Source: Male head of school, July, 2012).
Students who get the lowest principals in their Form Six examinations are the ones
who become teachers. I wonder what kind of teaching they will make. This leads to
the decline of teachers’ status. There is no respect for teachers both among students
we teach and the community at large. They say teaching is a profession for failures
(Source: Female head of school, July, 2012).
(i) Variation in Perception on Teaching Profession
Cross-tabulations about the perception in teaching profession with various
demographic characteristics of the respondents revealed some variations and
similarities. The characteristics considered were age, gender, education levels and
experience.
(a) Variation in Job Perception and Age of the Respondents
The perception on job was analyzed by the age of the respondents. The results are
indicated in Table 4.7.

47
Table 4.7: Job Perception and Age
Job means more than just money Age (years)
20-34
(n = 162)
35-49
(n = 35)
50+
(n = 3)
Total
(n = 200)
Strongly disagree (n = 31) 13.0% 25.7% 33.4% 15.5%
Disagree (n = 46) 21.0% 31.4% 33.3% 23.0%
Neither agree nor disagree (n =
16)
8.6% 5.7% 0.0% 8.0%
Agree (n = 80) 43.8% 22.9% 33.3% 40.0%
Strongly agree (n = 27) 13.6% 14.3% 0.0% 13.5%
Total (n = 200) 100.0% 100.0% 100.0% 100.0%
21.932
, p-value = 0.316, degree of freedom = 8
Source: Field Survey, (2012)
From Table 4.7, 13 percent of respondents with age 20 to 34 simply strongly
disagreed, 21 percent disagreed and 8.6 percent neither agreed nor disagreed. About
44 percent simply agreed and 13.6 percent strongly agreed that their job is more than
just money. On the other side, the respondents within age group 35-49 about 31.4
percent simply disagreed, 25.7 percent strongly disagreed, 22.9 percent simply
agreed 14.3 percent strongly agreed and 5.7 percent neither agreed nor disagreed on
the same. Further, 33.4 percent of the respondents with age 50 years and above
strongly disagreed, 33.3 percent of the respondents simply disagreed and agreed on
the same and none strongly agreed and also neither agreed nor disagreed. The results
were statistically not significant as suggested by the p-value = 0.316.
(b) Variations in Job Perception and Gender of the Respondents
The perception of teaching profession varies with the gender of teachers. This study
investigated on these variations. The results are identified in Table 4.8.

48
Table 4.8: Job Perception and Gender
Job means more than money Gender (n = 200)
Male Female Total
Strongly disagree (n = 31) 14.7% 15.9% 15.5%
Disagree (n = 46) 16.2% 26.5% 23.0%
Neither agree nor disagree (n = 16) 11.8% 6.1% 8.0%
Agree (n = 80) 45.6% 37.1% 40.0%
Strongly agree (n = 27) 11.8% 14.4% 13.5%
Total (n = 200) 100.0% 100.0% 100.0%
87.492
, degree of freedom = 4, p-value = 0.289
Source: Field Survey, (2012)
From Table 4.8 majority (45.6 percent) of male agreed that their job means a lot
more than just money whereas 16.2 percent simply disagreed, 14.7 percent strongly
disagreed and similar proportion (11.8 percent) neither agreed nor disagreed and
strongly agreed on the same. The patterns of males’ responses are likely to be similar
from those of female. About 37.1 percent simply agreed and 26.5 percent disagreed.
Moreover, 15.9 percent of female strongly disagreed and 14.4 percent strongly
agreed whereas 6.1 percent were neutral on the same. The variations are statistically
insignificant since p-value = 0.289.
(c) Variation in Job Perception and Education Level of the Respondents
On the variations in job perception and education level of the respondents, the
research findings revealed similarities and variations among the respondents with
different levels of education.

49
Table 4.9: Job Perception and Education Level
Job means more than money Education level
Untrained
(n = 2)
Diploma
(n = 98)
Bachelor
(n = 100)
Total
(n = 200)
Strongly disagree (n = 31) 0.0% 14.3% 17.0% 15.5%
Disagree (n = 46) 50.0% 21.4% 24.0% 23.0%
Neither agree nor disagree (n =
16)
0.0% 8.2% 8.0% 8.0%
Agree (n = 80) 50.0% 42.9% 37.0% 40.0%
Strongly agree (n = 27) 0.0% 13.3% 14.0% 13.5%
Total (n = 200) 100.0% 100.0% 100.0% 100.0%
62.222
, degree of freedom = 8, p-value = 0.972
Source: Field Survey, 2012
With reference to Table 4.9, about 50 percent of the respondents simply disagreed,
whereas the remaining proportion simply agreed that their job is more than just
money. Among the diploma holders, 42.9 percent agreed, 21.4 percent simply
disagreed, 14.3 percent strongly disagreed, whereas 13.3 percent strongly agreed and
8.2 percent were neutral on the same. The responses from bachelor holders show that
37 percent simply agreed and 24 percent simply disagreed, on other side, 17 percent
strongly disagree and 14 percent strongly agree whereas 8 percent were neutral on
the same. Statistically the results are not significant (p-value = 0.972).
(d) Variation in Job Perception and Experience of the Respondents
Similarly the experience of teachers and job perception was analyzed in order to
assess the attitude of teachers toward teaching. The findings revealed some variations
and similarities. Their distributions are shown in Table 4.10.
The results in Table 4.10 indicate that 39.5 percent of the respondents who had
worked for less than five years simply agreed that their job means more than just

50
money. Despite that, 27.7 percent simply disagreed, 13.5 percent strongly disagreed,
10.1 percent strongly agreed and 9.2 percent neither agreed nor disagreed on the
same. Moreover, 39.0 percent of the respondents with 5-10 years working experience
simply agreed, 22.0 percent strongly disagreed, 16.9 percent simply disagreed 13.6
percent strongly agreed and 8.5 percent were neutral on the same. Those who had
worked for more than ten years their data distribution show that 45.5 percent simply
agreed and 31.8 percent strongly agreed whereas 13.6 percent simply disagreed, 9.1
percent strongly disagreed and no one neither agreed nor disagreed on the same. The
variations have no statistical correlation since chi-square test whose p-value = 0.080
suggested the same.
Table 4.10: Job Perception and Teaching Experience
Job means more than
money Experience (years)
< 5
(n = 119)
5-10 (n =
59)
>10 (n =
22)
Total
(n = 200)
Strongly disagree (n = 31) 13.5% 22.0% 9.1% 15.5%
Disagree (n = 46) 27.7% 16.9% 13.6% 23.0%
Neither agree nor
disagree (n = 16)
9.2% 8.5% 0.0% 8.0%
Agree (n = 80) 39.5% 39.0% 45.5% 40.0%
Strongly agree
(n = 27)
10.1% 13.6% 31.8% 13.5%
Total (n = 200) 100.0% 100.0% 100.0% 100.0%
076.142
, degree of freedom = 8, p-value = 0.080
Source: Field Survey, (2012)
4.3.3 Satisfaction on Teaching Profession
Different literatures have investigated the satisfaction on teaching profession in order
to study teachers’ attitude. Spector (1994) for example identified nine facets of job
satisfaction, namely pay, promotion, supervision, fringe benefits, contingent rewards,

51
operating procedure, co-workers, nature of work and communication. Similarly to
this study the respondents were asked on their level of job satisfaction as compared
to the last three years. The results varied from one respondent to another. The general
outlook is presented in Figure 4.5.
Figure 4. 5: Satisfactions on Teaching Profession
Source: Field Survey, (2012)
The findings in Figure 4.5 indicate that 43 percent of the respondents reported that
job satisfaction has increased, 27 percent said it has remained the same, 20.5 percent
said it has declined whereas 6.5 percent said it has declined significantly and 3
percent said the satisfaction has increased significantly.
(i) Variation in Job Satisfaction on Teaching Profession
Cross-tabulation on the job satisfaction in teaching profession with various
demographic characteristics of the respondents revealed some variations and
similarities. The characteristics considered were gender, age, education levels and
experience of the respondents.

52
(a) Variation in Satisfaction on Teaching Profession and Gender of the
Respondents
In any profession there is a likelihood of an increase or decrease of job satisfaction
which may differ by gender. The study explored the trend of job satisfaction among
teachers as compared to the past. The results are presented in Table 4.11
Table 4.11: Satisfaction on Teaching Profession and Gender
Levels of Job Satisfaction Gender
Male (n = 68) Female(n = 132) Total
(n = 200)
Decline significantly (n = 13) 4.5% 7.6% 6.5%
Decline (n = 41) 19.1% 21.2% 20.5%
Remained the same (n = 54) 27.9% 26.5% 27.0%
Increased (n = 86) 48.5% 40.2% 43.0%
Increased significantly (n = 6) 0.0% 4.5% 3.0%
Total (n = 200) 100.0% 100.0% 100.0%
45.462
, degree of freedom = 4, p-value = 0.326
Source: Field Survey, 2012
From Table 4.11, a larger proportion (48.5 percent) of males reported that job
satisfaction has increased. It was followed by those who said it has remained the
same. This accounted to 27.9 percent of male respondents. About 19 percent and 4.5
percent of males reported that job satisfaction has declined and declined significantly
respectively. Similarly among females, a larger proportion (40.2 percent) reported
that the job satisfaction has increased, 26.5 percent said it has remained the same,
21.2 percent of females said it has declined whereas 7.6 percent argued that it has
declined significantly and 4.5 percent said it has increased significantly. Although
the statistical distribution is insignificant (p-value = 0.326) but majority of the
respondents showed that there was an increase of job satisfaction because it was their
preference choice from the beginning of their recruitment.

53
(b) Variation in Job Satisfaction on Teaching Profession and Age of the
Respondents
Different literatures have explained the similarities and variations of job satisfaction
by age. In this study the variations and similarities are shown by the statistical data in
Table 4.12.
Table 4.12: Satisfaction on Teaching Profession and Age
Levels of job satisfaction Age (years)
20-34
(n = 162)
35-49
(n = 35)
50+
(n = 3)
Total
(n = 200)
Decline significantly (n = 13) 6.2% 8.6% 0.0% 6.5%
Decline (n = 41) 19.1% 28.5% 0.0% 20.5%
Remained the same (n = 54) 26.5% 28.6% 33.4% 27.0%
Increased (n = 86) 45.1% 34.3% 33.3% 43.0%
Increased significantly (n = 6) 3.1% 0.0% 33.3% 3.0%
Total (n = 200) 100.0% 100.0% 100.0% 100.0%
515.132
, degree of freedom = 8, p-value = 0.095
Source: Field Survey, (2012)
From Table 4.12, three age groups are presented with various statistical distributions
in regard to job satisfaction. The nearest half (45.1 percent) of the respondents in age
20-34 reported that job satisfaction has increased if compared to the past whereby
26.5 percent said it has remained the same, 19.1 percent reported that it has declined
while 6.2 percent said it has declined significantly and 3.1 percent said it has
increased significantly. Within 35-49 years, 34.3 percent reported that the
satisfaction has increased, 28.6 percent said it remained the same whereas 28.5
percent said it has declined and 8.6 percent said it has declined significantly. On the
other side, the respondents with 50 years or above, 33.4 percent reported that it
remained the same and those who reported that it increased and increased

54
significantly were accounted to 33.3 percent each. These variations and similarities
are statistically insignificant as suggested by p-value = 0.095.
(c) Variation in Satisfaction on Teaching Profession and Education Level of the
Respondents
The levels of education have shown some interesting variations and similarities in
job satisfaction in many studies. The study also explored the context of job
satisfaction and education levels. The results are presented in Table 4.13.
Table 4.13: Satisfaction on Teaching Profession and Level of Education
Levels of job
Satisfaction
Education level
No formal
(n = 2)
Diploma
(n = 98)
Bachelor
(n = 100)
Total
(n = 200)
Decline significantly
(n = 13)
0.0% 2.0% 11.0% 6.5%
Decline (n = 41) 0.0% 23.5% 18.0% 20.5%
Remained the same
(n = 54)
0.0% 26.5% 28.0% 27.0%
Increased (n = 86) 100.0% 43.9% 41.0% 43.0%
Increased significantly
(n = 6)
0.0% 4.1% 2.0% 3.0%
Total (n = 200) 100.0% 100.0% 100.0% 100.0%
Source: Field Survey,( 2012)
The presented data in Table 4.13 shows that respondents with no formal education
almost all (100 percent) of them said the satisfaction has increased. Among diploma
holders about 43.9 percent reported that job satisfaction has increased, 26.5 percent
said it has remained the same, 23.5 percent reported that it has declined, 4.1 percent
argued that it has increased significantly and 2 percent said it has declined
significantly. More the bachelor holders also revealed some variations. About 41
percent of bachelor holders reported that it has increased, 28 percent said it has

55
remained the same. Likewise, 18 percent of the respondents within bachelor holders
said it has declined whereas 11 percent reported that it has declined significantly
while 2 percent said it has increased significantly. These variations and similarities
are statistically not significant as suggested by chi-square test = 10.362, p-value =
0.241 and degree of freedom = 8.
(d) Variation in Satisfaction on Teaching Profession and Experience
In the study, experience of teachers was one of the determinants of job satisfaction.
The pattern shows the similarities in almost all categories of experiences. The results
are therefore presented in Table 4.14.
Table 4.14: Satisfaction on Teaching Profession and Experience
Job satisfaction Experience
< 5
(n = 119)
5-10
(n = 59)
>10
(n = 22)
Total
(n = 200)
Decline significantly (n = 13) 5.0% 10.2% 4.5% 6.5%
Decline (n = 41) 21.0% 18.6% 22.7% 20.5%
Remained the same (n = 54) 30.3% 20.3% 27.3% 27.0%
Increased (n = 86) 40.3% 47.5% 45.5% 43.0%
Increased significantly (n = 6) 3.4% 3.4% 0.0% 3.0%
Total (n = 200) 100.0% 100.0% 100.0% 100.0%
Source: Field Survey, (2012)
The findings in Table 4.14 show that respondents with less than five years reported
differently in the context of job satisfaction. About 40.3 percent of them reported that
there is an increase in job satisfaction compared to the past whereas 30.3 percent
reported that it has remained the same. On the other side, 21 percent of the
respondents with less than five years said the satisfaction has declined whereas 5
percent said it has declined significantly and 3.4 percent reported that it has increased
significantly.

56
On the second category of 5-10 years, 47.5 percent said it has increased, 20.3 percent
argued that it has remained the same, 18.6 percent said it has declined, 10.2 percent
said it has declined significantly and 3.4 percent said it has increased significantly.
Finally those who had worked for more than ten years, 45.5 percent reported that job
satisfaction has increased whereas 27.3 percent said it has remained the same. In the
same category 22.7 percent reported that the satisfaction has declined whereas 4.5
percent said it has declined significantly. The results show that there is no statistical
correlation between job satisfaction and one’s experience (Chi-square test = 4.586, p-
value = 0.801 and degree of freedom = 8).
Generally the results about job satisfaction and other demographic characteristics
reveal that the satisfaction has increased due to salary increment. The report from
different interviews shows that lack of satisfaction for some teachers is because of an
increase cost in all aspects of life, thus an increase of salary does not enable teachers
to fulfil their needs. Other reasons for lack of job satisfaction in teaching profession
were found to be poor and harsh environment in teaching profession as compared to
other jobs and lack of regularly incentives. These results are in line with Hertzberg’s
(1966) findings that absence of hygiene factors can create job dissatisfaction.
4.3.4 Desire for Further Choice on Teaching Profession
The magnitude towards the teachers’ attitudes was studied in the context of further
choice. The respondents were asked whether they would like to choose teaching
profession again or not. The outcomes are presented in Table 4.15.

57
Table 4.15: Desire for making the same Choice of Teaching Profession
Responses Frequency Percent
Yes 125 62.5
No 75 37.5
Total 200 100.0
Source: Field Survey, (2012)
Majority (62.5 percent) of the respondents as shown in Table 4.15 were able to make
a further choice for teaching profession, while 37.5 percent were not able to make a
further choice; rather they were interested in other professions. Similar to the
findings, Spear et al. (2000) highlighted the causes for one’s decision towards
satisfaction and further choice of teaching profession. Some of the determinants were
the nature of the workload, poor pay and negative perceptions of teachers among the
society. The same reasons were found in the study area.
(i) Variation in The Desire for Making the Same Choice of Teaching Profession
Cross-tabulations on the desire for making the same choice in teaching profession
with various demographic characteristics of the respondents indicated some
similarities and variations. The characteristics considered were gender, age,
education levels and experience of the respondents.
(a) Desire for Further Choice on Teaching Profession and Gender of the
Respondents
The choice of the respondents on teaching profession was analyzed by gender of the
respondents in order to study teachers’ attitude and its impact on teachers’ turnover
and performance. The results are presented in Table 4.16.

58
Table 4.16: Further Choice in Teaching Profession and Gender
Responses Gender
Male (n = 68) Female (n = 132) Total (n = 200)
Yes (n = 125) 64.7% 61.4% 62.5%
No (n = 75) 35.3% 38.6% 37.5%
Total (n = 200) 100.0% 100.0% 100.0%
214.02
, degree of freedom = 1, p-value = 0.644
Source: Field Survey, (2012)
The results from Table 4.16 show that, majority (64.7 percent) of the male
respondents was likely to be interested in teaching since they were willing to make
further choice in the profession. In the other side, 35.3 percent of males which is the
smaller proportion did not prefer teaching in the further choices. The same pattern
has found among females respondents. More than half (61.4 percent) were able to
make choice in the same occupation and few (38.6 percent) were not. Although the
variations are not statistically significant (p-value = 0.644) the pattern shown by the
data enabled the researcher to conclude that majority of teachers’ are interested in
teaching profession.
(b) Desire for Further Choice on Teaching Profession and Age
The desire for further choice in teaching career depends on the age of a person. In
this study the respondents with different ages were asked whether they will be
interested in teaching career again or not. Their responses are shown in Table 4.17.

59
Table 4.17: Desire for Choice on Teaching Profession and Age
Responses Age
20-34
(n = 162)
35-49
(n = 35)
50+ (n = 3) Total (n = 200)
Yes (n = 125) 64.8% 51.4% 66.7% 62.5%
No (n = 75) 35.2% 48.6% 33.3% 37.5%
Total (n = 200) 100.0% 100.0% 100.0% 100.0%
223.22
, degree of freedom = 2, p-value = 0.329
Source: Field Survey, (2012)
From Table 4.17, about 64.8 percent of the respondents in age group 20-34 were
willing to make further choice in the same career whereas 35.2 percent were not.
Among those with age 35-49 years 51.4 percent were willing to choose teaching
profession while 48.6 percent were not willing and those with 50 years or above 66.7
percent were interested to make a further choice in teaching career whereas 33.3
percent were not willing. Generally majority of teachers in all age groups were
interested in teaching. These variations are statistically insignificant since p-value =
0.329.
(c) Desire for Further Choice on Teaching Profession and Education Level
The level of education is found to be an instrumental factor towards further choice in
teaching career. In most cases the one who had already acquired a diploma or degree
in teaching profession has a likelihood of selecting the same career or other courses.
The results of responses are presented in Table 4.1.

60
Table 4. 18: Desire for Choice on Teaching Profession and Education Level
Responses Education Level
No formal
(n = 2)
Diploma
(n = 98)
Bachelor
(n = 100)
Total
(n = 200)
Yes (n = 125) 50.0% 60.2% 65.0% 62.5%
No (n = 75) 50.0% 39.8% 35.0% 37.5%
Total (n = 200) 100.0% 100.0% 100.0% 100.0%
620.02
, degree of freedom = 2, p-value = 0.733
Source: Field Survey, (2012)
With reference to Table 4.18, the data from the respondents with no formal education
did not reveal some interesting variations since 50 percent of them reported yes and
the remaining reported no, meaning that the proportion of those who were willing to
make a further choice were equal to those who were not willing. A large difference
was observed among the teachers with diploma and bachelor holders. The
distributions show that 60.2 percent of the diploma holders were interested to make
further choice in teaching career whereas 39.8 percent were not interested. Moreover,
a total of 65 percent of teacher with bachelor were interested in making further
choice of the same profession and 35 percent were not. These data are not
statistically significant (p-value = 0.733). Generally, the results enabled the
researcher to justify that teaching profession is preferred by almost more than half of
all the respondents.
(d) Desire for Further Choice on Teaching Profession and Experience
Experience is reported to be one of the factors that affect one’s desire to make a
further choice or not. The variations and similarities of the outcomes are presented
in Table 4.19.

61
Table 4.19: Desire for Choice on Teaching Profession and Experience
Responses Experience
< 5 (n = 119) 5-10 (n = 59) >10 (n = 22) Total
(n = 200)
Yes (n = 125) 61.3% 57.6% 81.8% 62.5%
No (n = 75) 38.7% 42.4% 18.2% 37.5%
Total (n = 200) 100.0% 100.0% 100.0% 100.0%
169.42
, degree of freedom = 2, p-value = 0.124
Source: Field Survey, (2012)
The results presented in Table 4.19 show that 61.3 percent of the respondents who
had worked for less than five years were ready to make the same choice, whereas
38.7 percent were not. It was also found that the respondents who had worked for
five to ten years, 57.6 percent of them were willing to make further choice in
teaching profession while 42.4 percent were not. Among the respondents with more
than ten years experienced, 81.8 percent of them were interested to choose the same
profession for the further studies while 18.2 percent were not. These variations are
statistically insignificant (p-value = 0.124). Hence it can be concluded that there is
no correlation between experience and the decision for further choice.
Generally the data indicate that the decision towards further choice cannot affect
teachers’ turnover and performance since most of teachers prefer to choose teaching
profession again rather than other careers. According to the interview conducted, this
preference is due to the fact that teaching has many aspects that bring satisfaction.
These results concur with Hertzberg et al. (1957) who have explained ten intrinsic
aspects of job satisfaction; among them are supervision, working conditions and
wages opportunity for advancement, security, company and management, social
aspects of the job, communication and economic benefits.

62
4.4 Prevalence of Teachers’ Turnover
Prior to the causes of teachers’ turnover, the respondents were asked to state whether
or not there is teachers’ turnover in secondary schools. The results are indicated in
Figure 4.6.
Figure 4.6: Prevalence of Teachers’ Turnover
Source: Field Survey, (2012)
From Figure 4.6 about 65 percent of the respondents reported that there is teachers’
turnover. On the other hand, 24 percent reported that there is no teachers’ turnover
whereas 11 percent were not sure on the prevalence of teachers’ turnover. There is a
likelihood of teachers’ turnover in Tanzania since the proportion of those who
reported the prevalence of teachers’ turnover is larger than other responses (i.e. ‘no’
and ‘not sure’). Also from the interview it was found that there is teachers’ turnover
due to stressful nature of the job as reported by one of the key informant hereunder.
Teaching is a stressful job. In my school most of the teachers leave the field within
the first five years of their recruitment, especially teachers who teach science

63
subjects and mathematics. Some opted for further studies and after completion they
exit the field with the reason of low payment as compared to other jobs with the
same qualifications and lack of decent accommodation (Source: Male head of school,
July 2012).
Teachers’ turnover is there, because teachers are getting in and out of schools
regularly due to many reasons including leaving the profession to search for more
payable jobs and others join the profession due to lack of other opportunities
(Source: TSD-Official, July, 2012).
Teachers’ turnover is dominant in every school. According to official statistics the
average attrition rate of teachers due to different reasons is 12.7 percent. Getting in is
about 28 percent per year (Source: Educational Official, July, 2012)
4.4.1 Variation on the Prevalence of Teachers’ Turnover
Different literatures like Chamberlin et al. (2002) revealed the prevalence of
teachers’ turnover among teachers. The study also revealed that there were some
similarities and variations on the respondents about the presence of teachers’
turnover. To show these variations and similarities, cross tabulation was done by
considering gender, age and experience of the respondents.
(i) Variation on the Prevalence of Teachers’ Turnover and Gender of the
Respondents
Various literatures have shown the presence of teachers’ turnover in difference
regions. This prevalence of teachers’ turnover varies with gender. In the study the

64
responses were collected from both male and female. The results are presented in
Table 4.20.
Table 4.20: Prevalence of Teachers’ Turnover and Gender
Responses Gender
Male (n = 68) Female (n = 132) Total (n = 200)
Yes (n = 130) 64.7% 65.2% 65.0%
No (n = 48) 27.9% 22.0% 24.0%
Not sure (n = 22 7.4% 12.9% 11.0%
Total (n = 200) 100.0% 100.0% 100.0%
914.12
, degree of freedom = 2, p-value = 0.384
Source: Field Survey, (2012)
With reference to Table 4.20, the pattern is slightly the same between male and
female. About 64.7 percent of male reported that teachers’ turnover exist. On the
other side 27.9 percent reported that teachers’ turnover do not exist and 7.4 percent
were not sure. Apart from that, 65.2 percent of female reported the existence of
teachers’ turnover, 34.9 percent reported that there is no teachers’ turnover and 12.9
percent were not sure. This distribution validates that there is teachers’ turnover in
Tanzania. These variations are not statistically significant as suggested by the chi-
square test with p-value = 0.384.
(ii) Variation on the Prevalence of Teachers’ Turnover and Age of the
Respondents
The age of the respondents is one of the determining variables towards teachers’
turnover. The study investigated the respondents with different age categories on the
prevalence of teachers’ turnover. The results are indicated in Table 4.21.

65
Table 4. 21: Existence of Teachers’ Turnover and Age
Responses Age
20-34 (n = 162) 35-49 (n = 35) 50+ (n = 3) Total (n = 200)
Yes (n = 130) 63.0% 71.4% 100.0% 65.0%
No (n = 48) 25.3% 20.0% 0.0% 24.0%
Not sure (n =
22)
11.7% 8.6% 0.0% 11.0%
Total (n =
200)
100.0% 100.0% 100.0% 100.0%
556.22
, degree of freedom = 4, p-value = 0.635
Source: Field Survey, (2012)
As presented in Table 4.21, large proportion (63 percent) of the respondents within
20 to 34 years said that teachers’ turnover prevail. It was followed by those whose
responses were no and not sure which accounted for 25.3 percent and 11.7 percent
respectively. In the second age group (35-49), 71.4 percent of the respondents
reported that teachers’ turnover exists while 20 percent said no and 8.6 percent were
not sure on the prevalence of teachers’ turnover. Among the respondents with age 50
and above 100 percent reported that there is teachers’ turnover. Although these
variations are not statistical significant (p-value = 0.635) but in general the pattern in
all age groups indicates the high prevalence of teachers’ turnover.
(iii) Variation on the Prevalence of Teachers’ Turnover and Experience of The
Respondents
Since turnover is not a short term incidence, one’s experience was found to be a
suitable variable in the existence of teachers’ turnover. The results show some
similarities and variations (Table 4.22).

66
Table 4.22: Prevalence of Teachers’ Turnover and Experience
Responses Experience (years)
<5 years
(n = 119)
5 to 10 years
(n = 59)
>10 years (n
= 22)
Total
(n = 200)
Yes (n = 130) 66.4% 62.7% 63.6% 65.0%
No (n = 48) 21.8% 27.1% 27.3% 24.0%
Not sure (n = 22) 11.8% 10.2% 9.1% 11.0%
Total (n = 200) 100.0% 100.0% 100.0% 100.0%
829.02
, degree of freedom = 4, p-value = 0.935
Source: Field Survey, (2012)
In the context of teachers’ turnover and experience, Table 4.22 shows that 66.4
percent of the respondents who had worked for less than five years reported that
there is teachers’ turnover whereas 21.8 percent said there is no and 11.8 percent
were not sure on the prevalence of teachers’ turnover. On other hand, 62.7 percent of
the respondents with five to ten years working experience reported the prevalence of
teachers’ turnover whereas 27.1 percent disagreed on existence of teachers’ turnover
and 10.2 percent were not sure. Among the respondents who had worked for more
than ten years, 63.6 percent said there is teachers’ turnover whereas 27.3 percent
disagreed and 9.1 percent were not sure on the same thing. All in all the data
distribution show the existence of teachers’ turnover but their variations are
statistically insignificant (p-value = 0.935).
4.5 The Causes of Teachers’ Turnover
The causes of teachers’ turnover are presented in this section. These causes of
teachers’ turnover were in two categories. These are socio-economic and socio-
political factors. Their in-depth explanations are provided below:

67
4.5.1 Socio-economic Factors
This study found different socio-economic factors. These are salary scale, fringe
benefits, rate of promotion, non-monetary benefits and leave payments.
(i) Salary Scale
Gupta (2010) explained the levels of productivity in teaching profession. He justifies
that low income status is due to poor salary scales. Also the study explored the issue
of salary scale among the respondents and similar results were obtained. The
outcomes were ranged from very good to very poor. Their distributions are presented
in Figure 4.7.
Figure 4.7: Responses towards the Salary Scale of Secondary School Teachers
Source: Field Survey, (2012)
From Figure 4.7 about 55 percent of the total respondents reported that there is very
poor salaries. It was followed by those who reported poor which accounted for 32.5
percent. On the other side, 9.5 percent said the salary scale is good and 3 percent said
it is very good. This pattern enabled the researcher to justify that the salary scale
68
among secondary school teachers is not satisfactory. This was also justified by one
the interviewee as quoted below.
The teaching professional is respectable, but the salary that teachers get makes many
people despise teaching. If you are a committed teacher you do not have to engage in
any other activity. For example, once you finish teaching you are supposed to mark
students’ work. Then you prepare for the next day. As teachers spend a lot of time on
their work thus the salary that they are paid should reflect what they do. They should
at least be paid a salary that makes them live comfortably (Source: TSD Official,
July 2012).
Teachers recommended that the salaries being paid are lower than in other
professions. For example one of the key informants reported that:
The biggest problem for teachers is the salary that they get. The basic salary between
teachers and other professions might be the same, the gap emerges from allowances
whereby other professions have many allowances compared to teachers. Hence,
teachers are a disadvantaged group (Source: Female Head of school, July 2012).
Cross tabulation on the responses towards salary scale and demographic
characteristics showed some variations and similarities. The demographic
characteristics considered were education level and the working experience of
teachers.
(a) Salary Scale and Education Level
Decline in performance is a result of poor payments (GCE, 2005). This study
explored the aspect of salary that varies with education level of teachers. In this

69
context salary scale is an appropriate variable to measure whether or not it causes
teachers’ turnover. The findings have been presented in Table 4.23.
The findings in Table 4.23 show that, 100 percent of the respondents below diploma
level reported that the salary scale is very poor. Among respondents with diploma
level, 54.1 percent reported very poor, 32.7 percent reported that the salary scale is
simply poor, 11.2 percent said it is good and 2 percent reported very good. Finally,
the respondents with bachelor level of education had different opinions. About 55
percent reported that the salary scale is very poor whereas 33 percent reported simply
poor and 8 percent reported that the salary scale is good whereas 4 percent said it is
very good. Generally the findings show that the salaries are not adquate although the
variation is not statistically significant as suggested by the chi square test whose p-
value is 0.829.
Table 4.23: Salary Scale and Education Level
Education level Salary Scale
Very good
(n = 6)
Good
(n = 19)
Poor
(n = 65)
Very poor
(n = 110)
Total
(n = 200)
Below diploma
(n = 2)
0.0% 0.0% 0.0% 100.0% 100.0%
Diploma (n = 98) 2.0% 11.2% 32.7% 54.1% 100.0%
Bachelor (n = 100) 4.0% 8.0% 33.0% 55.0% 100.0%
Total (n = 200) 3.0% 9.5% 32.5% 55.0% 100.0%
837.22
, degree of freedom = 6, p-value = 0.829
Source: Field Survey, (2012)
(b) Salary Scale and Working Experience
Working experience is a demographic variable that enabled the researcher to
investigate whether the salary scale is satisfactory. The findings have shown different
responses. Their distributions is presented in Table 4.24.

70
Table 4.24: Salary Scale and Working Experience
Working
experience (years)
Salary Scale
Very good
(n = 6)
Good
(n = 19)
Poor
(n = 65)
Very poor (n
= 110)
Total
(n = 200)
< 5 (n = 119) 5.0% 15.1% 26.9% 52.9% 100.0%
5-10 (n = 59) 0.0% 1.7% 33.9% 64.4% 100.0%
>10 (n = 22) 0.0% 0.0% 59.1% 40.9% 100.0%
Total 3.0% 9.5% 32.5% 55.0% 100.0%
731.212
, degree of freedom = 6, p-value = 0.001
Source: Field Survey, 2012
With reference from Table 4.24, 52.9 percent of the respondents with less than five
years working experience reported that the salary scale is very poor, 26.9 percent
said that the salary scale is simply poor whereas 15.1 percent and 5 percent reported
that the salary scale is good and very good respectively. On the other hand, those
with five to ten years working experience, 64.4 percent argued that the salary scale is
very poor whereas 33.9 percent simply reported poor and 1.7 percent said that the
salary scale is good. No one with more than ten years working experience reported
that the salary scale is good or very good since 59.1 percent reported poor and 40.9
percent simply reported very poor. In most cases the pattern is likely to influence
teachers’ turnover. These variations are statistically significant since p-value = 0.001.
(ii) Fringe Benefits
The issue of fringe benefits is an influencing factor towards working performance
(Herzberg et al., 1957). This study explored whether or not teaching profession has
good or poor fringe benefits. The distributions of the results are shown in Table 4.25.

71
Table 4.25: Fringe Benefits among Teachers
Rate of fringe benefits Frequency Percentage
Very good 6 3.0
Good 77 38.5
Poor 74 37.0
very poor 43 21.5
Total 200 100.0
Source: Field Survey, (2012)
The results in Table 4.25 show that, 38.5 percent of the respondents reported that
there are good fringe benefits, 37 percent reported poor and 21.5 percent reported
very poor whereas 3 percent reported that the fringe benefits are very good.
Although there was no enough provision of fringe benefits which are excogitated to
be the determining factor for teachers’ turnover, the provision varied with the levels
of education and working experience. Therefore, the section below presents these
variations and similarities.
(a) Fringe Benefits and Education Level
Saleemi (1997) argued that every organisation provides some benefits and services to
its employees in order to attract and retain them, and to maintain loyalty towards the
enterprise. The study explored the extent to which the fringe benefits are provided by
the levels of education among the respondents. The responses towards the provision
of these fringe benefits varied with the levels of education. The outcomes are
reported in Table 4.26.

72
Table 4.26: Fringe Benefits and Education Level
Education Level Proportion of fringe benefits
Very good (n
= 6)
Good
(n = 77)
Poor
(n = 74)
Very
poor
(n = 43)
Total
(n = 200)
Below diploma
(n = 2)
0.0% 50.0% 50.0% 0.0% 100.0%
Diploma (n = 98) 2.0% 29.6% 43.9% 24.5% 100.0%
Bachelor (n =
100)
4.0% 47.0% 30.0% 19.0% 100.0%
Total (n = 200) 3.0% 38.5% 37.0% 21.5% 100.0%
456.82
, degree of freedom = 6, p-value = 0.207
Source: Field Survey, (2012)
The respondents below diploma level of education, 50 percent reported poor and the
remaining proportion reported that there are good fringe benefits. On the other hand,
43.9 percent of the respondents with diploma reported that there are poor fringe
benefits, 29.6 percent reported that there are good fringe benefits, 24.5 percent said
there are very poor fringe benefits and only 2 percent said there are very good fringe
benefits. Among the respondents with bachelor level of education, 47 percent
reported that the fringe benefits are good whereas, 30 percent reported that there are
poor, 19 percent said there are very poor whereas 4 percent reported that there are
very good fringe benefits. Though the data showed that some are satisfied with fringe
benefits but others are not, these variations are not statistically significant since p-
value = 0.207.
(b) Fringe Benefits and Working Experience
Fringe benefits varied with the working experience of the teacher. This study has
shown these variations. The results are indicated in Table 4.27.

73
Table 4.27: Fringe Benefits and Working Experience
Working
experience (years)
Proportion of fringe benefits
Very good
(n = 6)
Good
(n = 77)
Poor
(n = 74)
Very
poor
(n = 43)
Total
(n = 200)
< 5 (n = 119) 2.5% 43.7% 31.1% 22.7% 100.0%
5-10 (n = 59) 5.1% 33.9% 42.4% 18.6% 100.0%
>10 (n = 22) 0.0% 22.7% 54.5% 22.8% 100.0%
Total (n = 200) 3.0% 38.5% 37.0% 21.5% 100.0%
918.72
, degree of freedom = 6, p-value = 0.244
Source: Field Survey, (2012)
It was found that majority (43.7 percent) of the respondents with less than five years
working experience reported that there are good fringe benefits. It was followed by
those who reported that the fringe benefits are poor, very poor and very good which
accounted for 31.percent, 22.7 percent and 2.5 percent respectively.
On the other hand respondents with five to ten years showed the differences in their
responses towards fringe benefits. About 42.4 percent said there are poor provision
of fringe benefits, 33.9 percent said they are good, 18.6 percent reported very poor
and 5.1 percent reported that there are very good provision of fringe benefits.
Likewise, respondents with an experience of more than ten years varied in terms of
their responses. About 54.5 percent of the respondents reported that there are poor
provision of fringe benefits and 22.8 percent reported very poor whereas 22.7 percent
reported that there is good provision of fringe benefits. Generally the distributions of
data are not statistically significant as suggested by the p-value = 0.244.

74
Figure 4.8: Non-monetary Benefits
Source: Field Survey, 2012
(iii) Presence of Non-Monetary Benefits
Social services including accommodation, health services and means of
transportation are very important in teaching profession because they can determine
the performance of a teacher. The study explored if there is a supply of those
services. The results obtained are presented in Figure 4.8.
From Figure 4.8 about 87.5 percent of the total respondents reported that there is no
provision of non-monetary services and 12.5 percent reported that there are some
non-monetary services. Some of the respondents reported the presence of non-
monetary benefits while the majority reported no non-monetary benefits, their results
varied according to demographic characteristics. Some of these demographic factors
are education level and working experience.
(a) Non-Monetary Benefits and Education Level
The responses towards non-monetary benefits varied with levels of education. The
study has attested those differences. The results are shown in Table 4.28.

75
Table 4.28: Non-monetary Services and Education Level
Education level Provision of non-monetary benefits
Yes (n = 25) No (n = 175) Total (n = 200)
Below diploma (n = 2) 0.0% 100.0% 100.0%
Diploma (n = 98) 6.1% 93.9% 100.0%
Bachelor (n = 100) 19.0% 81.0% 100.0%
Total (n = 200) 12.5% 87.5% 100.0%
793.72
, degree of freedom = 2, p-value = 0.020
Source: Field Survey, 2012
From Table 4.28, 100 percent of the respondents below diploma reported that there
are no non-monetary benefits whereas 93.9 percent of the respondents with diploma
said there are no non-monetary benefits and only 6.1 percent said there is. On the
other hand, 81 percent of respondents with bachelor reported that there are no non-
monetary services and 19 percent reported that there are. The findings are
statistically significant as suggested by the chi-square test whose p-value is 0.020.
(b) Non-Monetary Benefits and Work Experience
Non-monetary benefits are determined by the length of time one had been working.
It was found that the responses about the provision of non-monetary services differed
with the working experience. Therefore the results are presented in Table 4.29.
Table 4.29: Non-monetary Services and Working Experience
Working experience (years) Provision of non-monetary benefits
Yes (n = 25) No (n = 175) Total (n = 200)
< 5 (n = 119) 10.9% 89.1% 100.0%
5-10 (n = 59) 15.3% 84.7% 100.0%
>10 (n = 22) 13.6% 86.4% 100.0%
Total (n = 200) 12.5% 87.5% 100.0%
705.02
, degree of freedom = 2, p-value = 0.703
Source: Field Survey, (2012)

76
From Table 4.29, larger proportion (89.1 percent) of the respondents with five years
working experience reported that there are no any provision of non-monetary
services such as accommodation, electricity and health services while 10.9 percent
reported that there are non-monetary services. On the other hand 84.7 percent of the
respondents with five to ten years working experience reported that there are no non-
monetary services while 15.3 percent reported that there are. Amidst, 86.4 percent of
the respondents who worked for more than ten years said that there are no any non-
monetary services in their schools and only 13.6 percent reported the presence of
those services. The variations are statistically not significant since the p-value=0.703.
(iv) Payments for Leave
In the long run, teachers have been breaking for their working progress in order to
have a rest. The study investigated whether or not there are payments of those leaves.
The findings are indicated in Table 4.30.
Table 4.30: Payments for leave
Payments for Leave Frequency Percentage
Never 160 80.0
Once 27 13.5
More than one 13 6.5
Total 200 100.0
Source: Field Survey, 2012
In the payments for working leave, teachers had different responses. About 80
percent reported that they had never been paid, 13.5 percent had been paid once and
6.5 percent more than once. These statistical distributions of data are not enough to

77
justify the presence of leave payments. There were different opinions on the presence
of leave payments. These differences were determined by the socio-economic and
demographic variables. Some of these variables are education level and working
experience.
(a) Payments for Leave and Levels of Education
With regard to education level, the outcomes were found to be different. Some
respondents responded that they had been given once, more than once and others said
they had never. Table 4.30 shows those differences and similarities.
Table 4.31: Leave payments and Education Level
Education level Number of payment for leave
Never
(n = 160)
Once
(n = 27)
More than one
(n = 13)
Total
(n = 200)
Below diploma (n = 2) 50.0% 50.0% 0.0% 100.0%
Diploma (n = 98) 81.6% 9.2% 9.2% 100.0%
Bachelor (n = 100) 79.0% 17.0% 4.0% 100.0%
Total (n = 200) 80.0% 13.5% 6.5% 100.0%
681.62
, degree of freedom = 4, p-value = 0.154
Source: Field Survey, 2012
Respondents below diploma level, about 50 percent had never been given those leave
payments and the remaining proportion (50 percent) had given once. On the other
side, 81.6 percent of those with diploma reported that they had never been given
leave payments whereas those who reported that they had been given once or more
than once accounted for 9.2 percent each which is the smaller proportion for one to
continue with teaching profession. The same pattern is observed among respondents

78
with bachelor education level. About 79 percent had never been given, 17 percent
had been given once and 4 percent more than once. These differences and similarities
are not statistically significant since the p-value = 0.154.
(b) Payments for Leaves and Work Experience
The findings about leave payments and working experiences have shown some
variations. The distributions are presented in Table 4.32.
Table 4.32: Leave payments and Working Experience
Working experience
(years)
Number of payment for leave
Never
(n = 160)
Once (n =
27)
More than
one (n = 13)
Total (n =
200)
< 5 (n = 119) 84.9% 9.2% 5.9% 100.0%
5-10 (n = 59) 79.7% 16.9% 3.4% 100.0%
>10 (n = 22) 54.5% 27.3% 18.2% 100.0%
Total (n = 200) 80.0% 13.5% 6.5% 100.0%
911.122
, degree of freedom = 4, p-value = 0.012
Source: Field Survey, 2012
With reference from Table 4.32, about 84.9 percent of the respondents with less than
five years working experience had never been given leave payments, 9.2 percent had
been given once and 5.9 percent had been given more than once. Among those who
had worked for five to ten years, 79.7 percent said had never been given those
payments, 16.9 percent had been given once and 3.4 percent more than once. On the
other hand, 54.5 percent of teachers who had worked for more than ten years
reported that they had never been given, 27.3 percent had been given once and 6.5
percent had been given more than once. The in-depth investigation from the key

79
informants showed that many teachers are not given their rights due to less priority
of the occupation as compared to other occupations. These variations are statistically
significant as suggested by the p-value = 0.012.
(v) Rate of Promotion among Secondary School Teachers
The rate of promotion is another determinant of teachers’ turnover. It is explained by
Locke (1976) that employees’ motivation and promotion are likely to be enhanced if
work goals are specific, challenging, formed through employee participation and
reinforced by feedback from their employers. This study explored the extent to which
the rate of promotion leads to teachers’ turnover. The findings are presented in
Figure 4.9.
S
Figure 4.9: Rate of Promotion among Teachers
Source: Field Survey, (2012)
From Figure 4.9 majority (67 percent) of teachers reported that there is low rate of
promotion whereas 26 percent reported that there is no any promotion and only 7
percent said there is high rate of promotion among teachers. The information from

80
the key informants reported that apart from causing turnover, this also leads to
conflicts between teachers and their bosses because if one had been working for long
time usually expects some promotion in both monetary and non-monetary services.
The rate of promotion varies with the variation of demographic characteristics. The
responses also varied according to these characteristics. Some of the characteristics
considered were education levels and working experiences.
(a) Rate of Promotion by Education Level
The context of education level is the best aspect to analyze the rate of promotion
among secondary school teachers. It was found that teachers with different education
levels provided different opinions about the presence of promotion among them.
Therefore, the data are presented in Table 4.33.
Table 4.33: Rate of Promotion and Education Level
Education level Rate of Promotion
No (n = 52) Low (n =
134)
High
(n = 14)
Total
(n = 200)
Below diploma (n = 2) 50.0% 50.0% 0.0% 100.0%
Diploma (n = 98) 28.6% 65.3% 6.1% 100.0%
Bachelor (n = 100) 23.0% 69.0% 8.0% 100.0%
Total (n = 200) 26.0% 67.0% 7.0% 100.0%
617.12
, degree of freedom = 4, p-value = 0.806
Source: Field Survey, (2012)
The results in Table 4.33 show the variations of responses. About 50 percent of the
respondents below diploma reported that there is no promotion and the remaining

81
proportion reported that there is low promotion. About 65.3 percent of the
respondents with diploma reported that there is low rate of promotion, 28.6 percent
said there is no promotion and 6.1 percent said there is high rate of promotion.
Similarly 69 percent of teachers with bachelor reported that there is low rate of
promotion, 23 percent said that there is no promotion and the remaining 8 percent
reported that there is high rate of promotion. These variations reveal that there is no
statistical significant since the p-value = 0.806.
(b) Rate of Promotion by Working Experience
The rate of promotion was further analyzed by the working experience that a teacher
had. The responses revealed some interesting variations. The distribution of their
responses is presented in Table 4.34.
Table 4.34: Rate of Promotion by Working Experience
Working experience
(years)
Presence of teachers promotion
No (n = 52) Low
(n = 134)
High
(n = 14)
Total
(n = 200)
< 5 (n = 119) 28.6% 62.2% 9.2% 100.0%
5-10 (n = 59) 27.1% 69.5% 3.4% 100.0%
>10 (n = 22) 9.1% 86.4% 4.5% 100.0%
Total (n = 200) 26.0% 67.0% 7.0% 100.0%
592.62
, degree of freedom = 4, p-value = 0.159
Source: Field Survey, 2012
The findings presented in Table 4.33 reveals some differences. It was found that 62.2
percent of the respondents with less than five years working experience said there is

82
low rate of promotion, 28.6 percent argued that there is no promotion and 9.2 percent
reported that the rate of promotion is high. Respondents with five to ten years
working experience showed different responses. 69.5 percent reported that there is
low rate of promotion, 27.6 percent said there is no promotion and 3.4 percent
reported that there is high rate of promotion among teachers. Whereas 86.4 percent
of teachers with ten and above years reported that the rate of promotion is low, 9.1
percent said there is no promotion and 4.5 percent showed that there is high rate of
promotion. These variations are not statistically significant as supported by the chi-
square test whose p-value = 0.159.
4.5.2 Socio-Political Factors
Teachers’ turnover is also determined by some socio-political factors. This study
attested these factors. Some of them are accountability, government policies,
working conditions, accommodation, living standards and extra duties.
(i) Accountability
Accountability is one of the socio-political factors that influence teachers’ turnover at
large extent. The study explored whether accountability exists or not. The outcomes
are presented in Figure 4.10.
There is a slight difference between those who agreed and disagreed. About 44
percent disagreed on the presence of accountability whereas 40.5 percent agreed. On
the other side, 9 percent strongly agreed and 6.5 percent strongly disagreed on the
same. These findings concur with Bennell (2006) who suggested that in public
schools there is poor accountability as compared to private schools.

83
Figure 4.10: Accountability in Teaching Profession
Source: Field survey, (2012)
(a) Accountability and Age of the Respondents
The study explored the issue of accountability by the age of the respondents. The
results have shown some variations and similarities. These patterns are presented in
Table 4.35.
Table 4. 35: Accountability and Age of the Respondents
Age (years) Accountability creates undesirable atmosphere
Strongly
agree
(n = 18)
Agree
(n = 81)
Disagree
(n = 88)
Strongly
disagree
(n = 13)
Total
(n = 200)
20-34 (n =
162)
7.4% 42.0% 43.2% 7.4% 100.0%
35-49 (n = 35) 14.3% 37.1% 45.7% 2.9% 100.0%
50+ (n = 3) 33.3% 0.0% 66.7% 0.0% 100.0%
Total (n = 200) 9.0% 40.5% 44.0% 6.5% 100.0%
428.62
, degree of freedom = 6, p-value = 0.377
Source: Field Survey, (2012)
Respondents with age 20-34 showed a slight difference and similarity. Larger
proportion disagreed and agreed on the presence of accountability. This accounted

84
for 43.2 percent and 42 percent respectively. It was followed by the respondents who
strongly agreed and disagreed, their proportions accounted for 7.4 percent each. The
respondents in age 35-49 showed the similar pattern. It was found that 45.7 percent
disagreed, 37.1 percent agreed, 14.3 percent strongly agreed and 2.9 percent strongly
disagreed on the same. On the other hand respondents with 50 years and above, 66.7
percent simply disagreed and 33.3 percent strongly agreed on the same. Generally
these findings are statistically insignificant (p-value = 0.377).
(b) Accountability and Education Level
In order to understand accountability, the in-depth analysis of accountability and
education level was done. The findings are shown in Table 4.36.
Table 4.36: Accountability and Education Level
Education level Accountability creates undesirable atmosphere
Strongly
agree
(n = 18)
Agree
(n = 81)
Disagree
(n = 88)
Strongly
disagree
(n = 13)
Total
(n = 200)
Below diploma
(n = 2)
0.0% 50.0% 50.0% 0.0% 100.0%
Diploma (n = 98) 11.2% 34.7% 46.9% 7.2% 100.0%
Bachelor
(n = 100)
7.0% 46.0% 41.0% 6.0% 100.0%
Total (n = 200) 9.0% 40.5% 44.0% 6.5% 100.0%
415.32
, degree of freedom = 6, p-value = 0.755
Source: Field Survey, (2012)
Below diploma education level, about 50 percent agreed and 50 percent disagreed
that the accountability creates undesirable atmosphere. On the other side, 46.9

85
percent disagreed that accountability creates undesirable atmosphere, 34.7 percent
agreed, 11.2 percent strongly agreed and 7.2 percent strongly disagreed on the same.
Those with bachelor level, about 46 percent agreed, 41 percent disagreed, 7 percent
strongly agreed and 6 percent strongly disagreed that accountability creates
undesirable atmosphere. Actually these results are not statistically significant since
the p-value=0.755.
(ii) Government Policies
However, the issues of government policies were found to be not friendly to teaching
profession. Many respondents (92 percent) argued that the policies are not supporting
teaching profession while 8 percent agreed that the policies are supporting teaching
profession (see Figure 4.11).
Figure 4. 11: Presence of Supportive Government policies
Source: Field survey, (2012)
The key informants reported that there are policies, which are only documented
without implementation and sometimes they are not involved in decision making.

86
The findings are in-line with VSO (2002) who argued that teachers’ voices in
educational policy are not heard by the government; hence teachers’ turnover
increases. One of the key informants said:
I feel that the government should have a good policy for in-service training of
teachers. For example, the government has introduced a paradigm shift in teaching
basing on competence for which no one of the teacher has been trained. How can
teachers teach without having the knowledge of that new methodology? For this
case, some teachers who are not really committed decide to quit or to go for further
studies. Before introducing anything new, teachers need to be trained or provided
with the required knowledge (Source: Male Head of school, July, 2012).
(a) Government Policies and Working Experience
The responses towards the presence of supportive government policies differed by
the time that a teacher had worked. The results are presented in Table 4.37.
Table 4.37: Government Policies and Working Experience
Work experience
(years)
Are the government policies supporting teaching
professional effectively?
Yes (n = 16) No (n = 184) Total (n = 200)
< 5 (n = 119) 10.1% 89.9% 100.0%
5-10 (n = 59) 5.1% 94.9% 100.0%
>10 (n = 22) 4.5% 95.5% 100.0%
Total (n = 200) 8.0% 92.0% 100.0%
740.12
, degree of freedom = 2, p-value = 0.419
Source: Field survey, (2012)
From Table 4.37 more than half (89.9 percent) of the respondents with less than five
years working experience reported that there are no supportive government policies

87
in teaching profession and only 10.1 percent reported the presence of supportive
government policies. More, among those with five to ten working experience, 94.9
percent reported the absence of supportive government policies and a smaller
proportion (5.1 percent) reported the presence of supportive government policies. On
the other hand, about 95.5 percent of more than 10 years said that there are no
government policies that support teaching profession whereas 4.5 percent said there
are government policies that support teaching profession. The suggested ideas from
the key respondents were majority of them said that the situations is very poor in
spite of the good unimplemented written documents. The variations are not
statistically significant since the p-value=0.419.
(b) Government Policies and Gender
The responses on the government policies were analyzed by the gender of the
respondents which also revealed some variations and similarities. The distribution is
presented in Table 4.38.
Table 4.38: Government Policies and Gender
Gender Are the government policies supporting teaching
professional effectively?
Yes (n = 16) No (n = 184) Total (n = 200)
Female (n = 68) 14.7% 85.3% 100.0%
Male (n = 132) 4.5% 95.5% 100.0%
Total (n = 200) 8.0% 92.0% 100.0%
295.62
, degree of freedom = 1, p-value = 0.012
Source: Field survey, 2012
With reference to Table 4.38 the responses about government policies by gender
have shown some differences and similarities. Within females’ respondents, 85.3

88
percent of them reported that there are no government policies that support teaching
profession whereas 14.7 percent reported that the policies are supportive. Likewise,
males have shown the similar responses as females reported. About 95.5 percent said
that there are no supportive policies and 4.5 percent reported that there are supportive
policies that lead to good atmosphere in teaching. These variations are statistically
significant as chi-square test with p-value = 0.012 suggests. The key informants
reported this by considering the policy of building teachers’ houses in every school
yet the policy has not been implemented. Likewise, the issue of teacher-student ratio
is not equivalent to the required ratio. The number of students is still large per one
teacher hence leads to the burden that affect the academic performance of students.
(iii) Working Conditions
Babyegeya (2002) explained the working conditions by considering the size and ratio
of students and teachers. The class sizes in many countries are very large while the
average Pupil-Teacher Ratio (PTR) at secondary school level in Tanzania is 29:1
instead of 20:1. Thus teachers’ working condition is not impressing. Teachers are
working under very harsh environments if you compare with other professions. The
study also attested these conditions. Majority (40 percent) of the respondents
reported that the working condition is poor. It was followed by those who reported
that the working condition is just ok; this constituted 25.5 percent of the total
respondents. About 20 percent said there are good working conditions whereas 9
percent reported very poor and 5.5 percent very good. As it was reported by the key
informants, these differences of responses are equal to unevenly distribution of
service

89
Table 4.39: Working Conditions
Working condition Frequency Percentage
Very good 11 5.5
Good 40 20.0
Just Ok 51 25.5
Poor 80 40.0
Very poor 18 9.0
Total 200 100.0
Source: Field Survey, (2012)
(a) Working Conditions and Education Level
There were different responses with working conditions and education levels. The
variations and similarities are presented in Table 4.40.
Table 4.40: Working Conditions and Education Level
Education
level
Working conditions
Very good
(n = 11)
Good
(n = 40)
Just Ok
(n = 51)
Poor
(n = 80)
Very poor
(n = 18)
Total
(n = 200)
Below
diploma (n=2)
0.0% 100.0% 0.0% 0.0% 0.0% 100.0%
Diploma
(n=98)
6.1% 18.4% 24.5% 38.8% 12.2% 100.0%
Bachelor
(n=100)
5.0% 20.0% 27.0% 42.0% 6.0% 100.0%
Total (n=200) 5.5% 20.0% 25.5% 40.0% 9.0% 100.0%
656.102
, degree of freedom = 8, p-value = 0.222
Source: Field Survey, 2012
From Table 4.40, 100 percent of teachers below diploma reported that there are good
working conditions, while 38.8 percent with diploma said the working conditions are
poor, 24.5 percent said just 0k, 18.4 percent said good, 12.2 percent and 6.1 percent

90
reported very poor and very good respectively. 42 percent of those teachers with
bachelor said the working conditions are poor, 27 percent said just Ok, 20 percent
said good, 6 percent said very poor and 5 percent said very good. These variations
are not statistically significant since p- value = 0.222.
(b) Working Conditions and Age
There were differences and similarities in the responses about working conditions
and age. The distribution is presented in Table 4.41.
Table 4.41: Working Condition and Age
Age
(years) Working condition
Very good
(n = 11)
Good
(n = 40)
Just Ok (n
= 51)
Poor
(n = 80)
Very poor
(n = 18)
Total
(n = 200)
20-34
(n = 162)
5.6% 22.2% 24.7% 41.4% 6.2% 100.0%
35-49
(n = 35)
5.7% 8.6% 28.6% 37.1% 20.0% 100.0%
50+
(n = 3)
0.0% 33.3% 33.3% 0.0% 33.3% 100.0%
Total
(n = 200)
5.5% 20.0% 25.5% 40.0% 9.0% 100.0%
829.122
, degree of freedom = 8, p-value = 0.118
Source: Field Survey, (2012)
From Table 4.41, 41.4 percent of the respondents with 20 to 34 years reported that
the working conditions are poor, 24.7 percent said there are just ok, 22.2 percent
reported that the working conditions are good, whereas 5.6 percent and 6.2 percent
reported that the working conditions are very good and very poor respectively. On
the other hand, 37.1 percent of the respondents with age 35 to 49 years reported that
there are poor, 28.6 percent said they are just ok, 20 percent reported very poor
whereas 8.6 percent said there are good and 5.7 percent reported that there are very

91
good working conditions. On the other side, respondents with 50 years and above
some reported that there are good and just ok whereas others reported that there are
very poor working conditions. These accounted for 33.3 percent each. The variations
are statistically insignificant as chi- square suggested (p-value = 0.118).
(iv) Accommodation
In fact, accommodation is an aspect that determines teachers’ work performance. As
it is explained by Mulkeen, (2005), teachers of the developing countries live in far
distance due lack and scarcity of accommodation in their stations which make them
shift to other sectors or schools with such services. The study investigated whether or
not there is a presence of accommodation. The findings are indicated in Figure 4.12.
Figure 4.12: Presence of Accommodation
Source: Field Survey, (2012)
From Figure 4.12 about 91 percent reported that there is no accommodation and 9
percent reported the presence of accommodation. Actually it was also reported from
the interview that lack of accommodation make teachers not comfortable because of
long walking distance and insecurity and hence leads to teachers’ turnover.

92
The location of the school creates a lot of problems. There are no teachers’ houses at
the school. The school is isolated and insecure. We spend between one to two hours
walking to school. Many teachers are late in the morning. Similarly students also
come late to school. This becomes worse during rainy season (Source: Male Head of
school, July 2012).
(a) Accommodation and Gender
With gender the data has shown some variations whether there is accommodation or
not. The results are presented in Table 4.42
Table 4.42: Presence of Accommodation and Gender
Gender Presence of accommodation
Yes (n = 18) No (n = 182) Total (n = 200)
Female (n = 68) 2.9% 97.1% 100.0%
Male (n = 132) 12.1% 87.9% 100.0%
Total (n = 200) 9.0% 91.0% 100.0%
618.42
, degree of freedom = 1, p-value = 0.032
Source: Field survey, 2012
The data in Table 4.42 indicates that 97.1 percent of females reported that there is no
accommodation and 2.9 percent said there is accommodation. On the other hand,
87.9 percent of males said there is no accommodation and 12.1 percent said there is
accommodation. These variations are statistically significant since p-value = 0.032.

93
(b) Accommodation and Age
Further, the presence or absence of accommodation was analyzed by the age of the
respondents. In Table 4.43, the pattern of data shows that majority in all age
categories reported that there is no accommodation and a smaller proportion reported
that there is accommodation. Though the variations are not statistically significant
(p-value=0.271) but the respondents justified the absence of accommodation by
saying that many teachers are coming from the villages far from schools where they
rented the rooms in case of rural secondary schools whereas others are coming from
town for every morning.
Table 4.43: Accommodation and Age of the Respondents
Age (years)
Do you have decent accommodation at your school?
Yes (n = 18) No (n = 182) Total (n = 200)
20-34 (n = 162) 8.0% 92.0% 100.0%
35-49 (n = 35) 11.4% 88.6% 100.0%
50+ (n = 3) 33.3% 66.7% 100.0%
Total (n = 200) 9.0% 91.0% 100.0%
609.22
, degree of freedom = 2, p-value = 0.271
Source: Field Survey, (2012)
Table 4.43 revealed that 92 percent of teachers with 20-34 years said no
accommodation, 8 percent said there is accommodation, 88.8 percent of teachers
with 35-49 years reported that accommodation is not available, 11.4 percent said
there is accommodation. On the other hand 66.7 percent of teachers with 50 years
and above reported that there is no accommodation and 33.3 percent said there is
accommodation.

94
(i) Living Standards
At the same time, it has been explained that the living conditions are statistic and
dynamic in some areas. The study identified these changes. Their distributions are
therefore presented in an exploded pie chart (Figure 4.13).
Figure 4.13: The Living Standards of Teachers
Source: Field survey, (2012)
From Figure 4.13, about 36.5 percent of the respondents reported that the living
standards have increased. One of the reasons provided by the key informants is due
to increase of salary. Different from that, 33 percent said living standards remained
the same, 21.5 percent said their living standards have declined whereas 6.5 percent
and 2.5 percent reported that their living standards have declined and increase
significantly.
(a) Living Standards and Education Level
With living standards and education levels, the question of whether there is an
increase in living standards or not revealed similar pattern in almost all levels of

95
education. Larger proportion of the respondents in all levels of education show that
the living standards have remained the same while others said there is an increase.
On the other hand, the smaller proportions reported that they have significantly
decline and increase. Also others simply said there is a decline in living standards
(see Table 4.44).
Table 4.44: The Living Standards and Education Level
Levels of living
standard
Education level
Below diploma
(n = 2)
Diploma
(n = 98)
Bachelor
(n = 100)
Total
(n = 200)
Decline significantly (n =
13)
0.0% 8.0% 5.1% 6.5%
Declined (n = 43) 0.0% 24.0% 19.4% 21.5%
Remained the same
(n = 66)
50.0% 34.0% 31.6% 33.0%
Increased (n = 73) 50.0% 30.0% 42.9% 36.5%
Increased significantly (n
= 5)
0.0% 4.0% 1.0% 2.5%
Total (n = 200) 100.0% 100.0% 100.0% 100.0%
106.62
, degree of freedom = 8, p-value = 0.635
Source: Field Survey, (2012)
Table 4.44 shows that 50 percent of the respondents below diploma reported that
living standards remained the same while other 50 percent said living standards have
increased. Respondents with diploma had different views, 8 percent said living
standards have declined significantly, 24 percent said declined, 34 percent reported
remained the same, 30 percent said increased and 4 percent reported increased
significantly. Whereas 5.1 percent of the respondents with bachelor reported that
living standards have declined significantly, 19.4 percent said declined, 31.6 percent
said remained the same, 42.9 percent felt that living standards increased and the

96
remaining 1 percent said increased significantly. The variations of these results are
statistically not significant (p- value = 0.635).
(b) Living Standards and Work Experience
Among the interviewed secondary school teachers, the variations between living
standards and work experience were observed. The findings are therefore presented
in Table 4.45.
Table 4.45: The living standards and work experience
Living standards Work Experience
< 5
(n = 119)
5-10 (n =
59)
>10
(n = 22)
Total
(n = 200)
Decline significantly (n = 13) 5.0% 8.5% 9.1% 6.5%
Declined (n = 43) 21.8% 22.0% 18.2% 21.5%
Remained the same (n = 66) 31.1% 32.2% 45.5% 33.0%
Increased (n = 73) 39.5% 35.6% 22.7% 36.5%
Increased significantly (n = 5) 2.5% 1.7% 4.5% 2.5%
Total (n=200) 100.0% 100.0% 100.0% 100.0%
245.42
, degree of freedom = 8, p-value = 0.834
Source: Field Survey, (2012)
Table 4.45 shows that 5 percent of the respondents with experience less than five
years felt that living standards have declined significantly, 21.8 percent said
declined, 31.1 percent said remained the same, 39.5 percent felt that living standards
have increased and 2.5 percent said increased significantly. 8.5 percent of the
teachers with working experience of five to ten years reported that living standards
has declined significantly, 22 percent said declined, 32.2 percent felt that living
standards remained the same, 35.6 percent reported that living standards increased

97
and 1.7 percent said increased significantly. Finally, 9.1 percent of teachers with
work experience of more than ten years reported that living standards has declined
significantly, 18.2 percent said declined, 45.5 percent said remained the same, 27.7
percent reported that living standards has increased and lastly 4.5 percent felt that
living standards increased significantly. The variations of these information do not
have any statistical association (p- value = 0.834).
(vi) Extra Duties
Spear et al. (2000) explain the wide range of factors that affect teachers’ career in
teaching profession in the United Kingdom and sub Saharan countries. Among them
are work overload and poor pay. The study also attested this incidence. Apart from
having class responsibilities with large number of students, teachers had other extra
duties. A larger proportion (87.5 percent) of teachers reported that they have extra
duties compared to those who had no any extra duty that accounted for 12.5 percent.
Having extra duties to majority was not an issue but what discouraged them is lack of
overtime payments.
Table 4.46: Extra Duties among Teachers
Presence of extra duties Frequency Percentage
Yes 175 87.5
No 25 12.5
Total 200 100.0
Source: Field Survey, (2012)
(a) Extra Duties and Education Level
The analysis in Table 4.47 shows that 100 percent of the respondents below diploma
level agreed that there are other duties apart from teaching. Likewise, 84.7 percent of

98
the respondents with diploma agreed that there are extra duties whereas 15.3 percent
disagreed by saying that they are only teaching. Respondents with bachelor level of
education also justified the presence of other duties by 90 percent and only 10
percent said there are no extra duties. These variations are not statistically significant
since p-value=0.458 (Table 4.47).
Table 4.47: Extra Duties and Education Level
Education level Do you have extra duties at your school?
Yes (n = 175) No (n = 25) Total (n = 200)
Below diploma (n = 2) 100.0% 0.0% 100.0%
Diploma (n=98) 84.7% 15.3% 100.0%
Bachelor (n=100) 90.0% 10.0% 100.0%
Total (n=200) 87.5% 12.5% 100.0%
563.12
, degree of freedom = 2, P-value = 0.458
Source: Field Survey, (2012)
(b) Extra Duties and Working Experience
The presence or absence of extra duties was further analyzed by working experience
of teachers. The patterns of the data show that many agreed on the presence of extra
duties while few disagreed (Table 4.48).
Table 4.48: Extra Duties and Working Experience
Work experience (years) Do you have extra duties at your school?
Yes (n = 175) No (n = 25) Total (n = 200)
< 5 (n = 119) 84.0% 16.0% 100.0%
5-10 (n = 59) 89.8% 10.2% 100.0%
>10 (n = 22) 100.0% 0.0% 100.0%
Total (n = 200) 87.5% 12.5% 100.0%
743.42
, degree of freedom = 2, p-value = 0.093
Source: Field Survey, (2012)

99
The data indicate that 84 percent of the respondents who had worked for less than
five years agreed that there are other extra duties, whereas 16 percent disagreed on
the same. Similarly to those who had worked for five to ten years larger proportion
(89.8 percent) of them reported the presence of other extra duties whereas smaller
proportion (10.2 percent) disagreed. Respondents with more than ten years working
experience, 100 percent reported the on presence of extra duties. The key informants
reported on these extra duties as school administration, meetings and controlling the
students’ behaviour which actually are inevitable at any school.
4.6 The Impact of Teachers’ Turnover on Academic Performance
The current performance as compared to three years ago was found to decline in
different schools. This has been justified by the study in which the results are
summarized in Table 4.49.
Table 4.49: Impact of Teachers’ Turnover on Academic Performance
Responses Frequency Percent
Better 49 24.5
Worse 87 43.5
Same 64 32.0
Total 200 100.0
Source: Field Survey, (2012)
The distribution of data in Table 4.49 shows some variations in responses. About
43.5 percent of the respondents said the results are worse if compared to the past
three years and 32 percent argued that the current performance is the same as in three
years ago whereas 24.5 percent reported that the performance is better. In general the

100
academic performance is declining because majority of the teachers are not satisfied
with the position they are. This has also been explained in the literature by Pestonjee
(1991) that there is a high positive correlation between job satisfaction and
performance. Also from the interview, it was reported that teachers’ turnover have a
significant negative effect on students’ academic performance because it results to
loss of skilled personnel for supporting students’ learning.
When teachers leave, the students are left without replacement for a long time or they
are left under Form Six leavers who are not teachers. Teachers’ turnover damage
students’ academic performance even if the incoming teachers are better than those
they replace because it disrupts the culture of the whole school (Source: Female
Head of school, July 2012).
Teachers’ turnover was found to be a problem in all schools. Poor environment and
long walking distances due to lack of accommodation make teachers to leave their
schools, science and mathematics teachers were found to be the most vulnerable
group.
Few teachers who are left in schools are overloaded with large classes, many periods,
many students to handle and poor supervision from heads of schools who are
working under stress because of being overloaded with piles of jobs to perform. The
results of all these are poor on academic achievements of students. For example, the
performance of the Form Four National Examination for the year 2009, 2010 and
2011 was 17.9 percent, 13.79 percent and 9.74 percent respectively for Division I-III,
whereas 60.11 percent, 44.85 percent and 51.15 percent respectively for Division IV

101
and the rest 21.99 percent, 41.36 percent and 39.11 percent respectively for Division
0, the trend shows that the academic performance is getting worse every year
(Source: Educational official, July, 2012).
4.6.1 The variations on the Impacts of Teachers’ Turnover on Academic
Performance
Cross-tabulations on the impact of teachers’ turnover data with various demographic
characteristics of the respondents indicated some similarities and variations. The
characteristics considered were experience, education levels, gender and age of the
respondents.
(i) Variations on the Impact of Teachers’ Turnover on Academic Performance
and Work Experience
There were different responses towards the impacts of teachers’ turnover. The study
explored the impact by considering the aspect of one’s experience. The outcomes are
presented in Table 4.50.
Table 4.50: Impact of Teachers Turnover on Academic Performance and
Experience
Performance Experience (years)
<5 years
(n = 119)
5 to 10 years
(n = 59)
>10 years (n
= 22)
Total (n =
200)
Better (n = 49) 27.7% 16.9% 27.3% 24.5%
Worse n = 87) 37.8% 49.2% 59.1% 43.5%
Same (n = 64) 34.5% 33.9% 13.6% 32.0%
Total (n = 200) 100.0% 100.0% 100.0% 100.0%
105.72
, degree of freedom = 4, p-value = 0.130
Source: Field Survey, (2012)

102
With reference to Table 4.50 the respondents with less than five years at work, 37.8
percent reported that the results are worse, 34.5 percent said no changes whereas
27.7 percent reported that the results are better if compared to the past three years.
On the other side the respondents with five to ten years working experience, 49.2
percent of them said the current results are worse, followed by 33.9 percent who said
the results are the same and 16.9 percent reported that there are good results if
compared to the past three years because of advancement technology which has
simplified the task of teaching and learning hence it is easy for the students to
perform. The variations of these results are statistically not significant (p-value =
0.130).
(ii) The Variations on the Impact of Teachers’ Turnover on Academic
Performance and Education Levels
The study explored the impact of teachers’ turnover among the respondents with
different education levels. The responses are shown in Table 4.51.
Table 4.51: Impact of Teachers’ Turnover on Academic performance and
Levels of Education
Performance Education level
Below diploma (n
= 2)
Diploma
(n = 98)
Bachelor/ above
(n = 100)
Total
(n = 200)
Better (n = 49) 0.0% 27.6% 22.0% 24.5%
Worse (n = 87) 50.0% 37.8% 49.0% 43.5%
Same (n = 64) 50.0% 34.7% 29.0% 32.0%
Total (n = 200) 100.0% 100.0% 100.0% 100.0%
282.32
, degree of freedom = 4, p-value = 0.512
Source: Field survey, (2012)

103
From Table 4.51 half (50 percent) of the respondents below diploma level of
education reported that the performances are worse whereas the remaining
proportion said the results are the same. About 37.8 percent of the respondents with
diploma said the current results are worse whereas 34.7 percent said they are the
same and 27.6 percent said the current results are better. In the category of the
respondents with bachelor level, 49 percent reported that the results are worse and 29
percent argued that academic performance is the same as the past three years whereas
22 percent said there are better performances. This distribution shows that teachers’
turnover in most cases result to decline in performances because students lack
assistances and directives from teachers. The variations of the information presented
in Table 4.50 do not show any statistical correlation (p-value = 0.512).
(iii) The Variations on the Impact of Teachers’ Turnover on Academic
Performance and Gender
The study investigated the impact of teachers’ turnover by gender of the respondents.
The results provided by males and females showed some interesting variations and
similarities. The distributions of their responses are presented in Table 4.52.
Table 4.52: The Impacts of Teachers’ Turnover on Academic Performance and
Gender
Performance Gender
Males (n = 68) Females (n = 132) Total (n = 200)
Better (n = 49) 22.1% 25.8% 24.5%
Worse (n = 87) 39.7% 45.5% 43.5%
Same (n = 64) 38.2% 28.8% 32.0%
Total (n = 200) 100.0% 100.0% 100.0%
843.12
, degree of freedom = 2, p-value = 0.398
Source: Field Survey, (2012)

104
With reference to Table 4.52 about 39.7 percent of males reported that teachers’
turnover has resulted to worse performance and 38.2 percent said the performance
has remained the same whereas 22.1 percent argued that there are better results in
spite of turnover. Other variations were also found among females. About 45.5
percent of females said teachers’ turnover has led to worse performance whereas
28.8 percent reported the performance are the same and 25.8 percent said there are
better performance in spite of teachers’ turnover. These findings are statistically
insignificant as suggested by the chi-square test whose p-value is 0.398.
(iv) The Variations on the Impact of Teachers’ Turnover on Academic
Performance and Age Group
The results about the impact of teachers turnover differed by the age of the
respondents. The variations are therefore presented in Table 4.53.
Table 4.53: The Impacts of Teachers’ Turnover on Academic Performance and
Age
Source: Field Survey, (2012)
Performance Age
20-34
(n = 162)
35-49 (n =
35)
50+
(n = 3)
Total (n = 200)
Better (n = 49) 24.1% 25.7% 33.4% 24.5%
Worse (n = 87) 43.8% 42.9% 33.3% 43.5%
Same (n = 64) 32.1% 31.4% 33.3% 32.0%
Total (n = 200) 100.0% 100.0% 100.0% 100.0%
213.02
, degree of freedom = 4, p-value = 0.995

105
The findings in Table 4.53 show that the respondents within age 20-34 about 43.8
percent of them said that the turnover leads to worse performance in secondary
schools. The remaining proportion said the performances are better and others said
the performances have remained the same, these responses accounted for 24.1
percent and 32.1 percent respectively. In age group 35-49 about 42.9 percent
reported that the performance are worse whereas 31.4 percent reported that the
performances are the same and 25.7 percent said there are better performances
compared to the past three years. Among the respondents with age of 50 years or
above about 33.4 percent said the performances are the same while worse and better
accounted for 33.3 percent each. These variations are not statistically significant
since p-value = 0.995.
4.7 Summary
In general teachers had different perception towards teaching profession, satisfaction
and choice for further career. Teachers were interested in teaching profession at a
larger proportion whereas few opted for teaching profession due to lack of other jobs
and others became teachers just temporarily. Difference in perception were also
observed, some teachers reported that their job means a lot more than just money.
Satisfaction was reported to increase because of flexibility and in case of further
choices it was found that there was a likelihood of choosing the same career again.
The study revealed that the existence of teachers’ turnover in the study area is
associated with social economic and social political factors and its impact was found
to be the decline of academic performance.

106
CHAPTER FIVE
5.0 CONCLUSION AND RECOMMENDATIONS
5.1 Overview
The study was guided by three objectives. The first was to assess the attitudes of
teachers towards teaching profession which are associated with teachers’ turnover in
government secondary schools. The second was to identify the causes for the
existence of teachers’ turnover and the third was to investigate the effects of
teachers’ turnover on academic performance in government secondary schools in
Mbozi district.
5.2 Summary of the Main Findings
This section provides very brief description of what had been covered and explained
in the previous chapter. It comprises the attitude of teachers towards teaching
profession. Also the summary presents the existence and causes of teachers’ turnover
and its effect on academic performance.
5.2.1 The Attitude of Teachers toward Teaching Profession
The study explored the attitude of teachers towards teaching profession from
different secondary schools. It focused on four aspects, which are; reasons for
becoming a teacher, perception of teaching profession, satisfaction and choice for
further career. It was found that a large majority (66 percent) of teachers were
interested in teaching profession whereas few others opted for teaching profession
due to lack of other jobs and the rest became teachers just temporarily and these are
the ones who argued that the profession is not respected and people opt due to being
the only profession which provides employment.

107
In terms of perception, a slight less than half (40 percent) of the respondents reported
that the job means a lot more than just money whereas the remaining perceived
teaching profession negatively since teaching is not a respected and liked profession
because of poor salaries.
Further, job satisfaction was reported differently among the interviewed respondents.
A larger proportion (74 percent) argued that the satisfaction remained the same,
others said it has declined. Fewer reported the increase of satisfaction.
5.2.2 Prevalence and Causes of Teachers’ Turnover
The findings of the study unfolded that there is teachers’ turnover in the study area.
This was vindicated by observing the number of teachers in secondary schools
during data collection which differed from the number of teachers recruited in those
schools. This prevalence of teachers’ turnover is caused by socio-economic and
political factors as explained below:
(i) Socio-Economic Factors
The socio-economic factors investigated were; salary scale, fringe benefits and non-
monetary benefits, rate of promotion and leave payments. The salary scale was found
to be very poor as the cost of life increases with time. Fringe benefits were also
investigated and the results revealed that they are not enough compared to the burden
that teachers have.
With regard to promotion, in normal situation teachers with higher level of education
and those with longer experience expect to be promoted but the findings reveals

108
differently from their perception. It was found that the rate of promotion found to be
low because one may retire in teaching career without any change in his/her
occupation.
Likewise, there are no non-monetary benefits such as houses for teachers. In case of
leave payments, teachers are not paid rather they continue claiming on these
payments without any success as compared to other jobs.
(ii) Socio-Political Factors
The socio-political factors investigated were; accountability, government policies,
working conditions, living standards and extra duties. It was found that the
respondents disagreed at a larger proportion on the presence of accountability. This is
due to prevalence of different problems such as school resources which is a
government burden, but in some schools teachers who are responsible were ready to
use their own initiatives. Hence this discourages teachers to continue with the
profession. Similar to that, the government policies are not supporting teachers in
secondary schools regardless of the presence of Secondary Education Development
Plan (SEDP). These unsupportive policies lead to poor working conditions like lack
of decent accommodation in schools. Moreover, the living standard is generally not
satisfactory. It was also found that teachers had many extra duties without any
overtime payments.
5.2.3 Impact of Teachers’ Turnover
The prevalence of teachers’ turnover has an adverse impact on academic
performance. In recent years the results of the Form Four National Examinations in

109
secondary schools have been deteriorating every year and among the causes, are the
socio-economic and political factors which lead to teachers’ turnover that bring about
the shortage of teachers in many secondary schools especially in rural areas.
5.3 Research Conclusion
The attitude of secondary school teachers is actually a reflection of teaching
environments. The study shows that the attitudes of teachers in ideal environment are
positive whereas the areas with poor environmental conditions are negative. It should
be noted that these negative attitudes result to teachers’ turnover which bring about a
negative impact on academic performance. Some of the respondents argued that it
might be due to underground resistance that exists among teachers.
Likewise, the causes of teachers’ turnover in both aspects were found to be dominant
in many schools and were determined by demographic characteristics such as age,
gender; work experience and education backgrounds.
5.4 Recommendations
5.4.1 Recommendations for Action
The problem of teachers’ turnover is common in all schools. Apart from increasing
salaries which does not work in such country with poor economy, the government
should consider issues of accommodation, provision of payments for extra duties and
formulation of supportive policies to retain teachers in their stations. Academic
issues should not be politicized otherwise the performance will continue to
deteriorate due to lack of commitment of teachers resulted from poor implementation

110
of academic policies. Teachers’ resistance should be noted down to make sure that
students get their rights of being taught. In order to experience high job satisfaction,
teachers need intellectual challenges, a high level of professional autonomy, need to
feel that they are benefiting the society and from the society rather than being
harassed on their status, to enjoy good relations with their colleagues or supervisors,
and to have enough time dealing with students. Enhanced pay, improved status, a
less demanding workload and fewer administrative responsibilities do not necessarily
bring about higher levels of job satisfaction rather it will boost up their activeness in
working.
5.4.2 Recommendations of Areas for Further Research
The study investigated the impacts of teachers’ turnover on academic performance,
but other studies are advised to explore the poor academic performance despite the
increased number of teachers. They should also consider the issue of recruitment. For
example the issues of short time training and teaching methodologies, the question of
how far have they contributed to teachers’ turnover, moral decay, and poor academic
performance, is still a debate. From this study the methodology part lacked some
important tools like focus group discussion where in-depth information can be
gathered because time was limited, thus next studies should at least apply the multi-
round survey rather than single round. This is because issues of attitudes cannot be
studied within a short period of time even the causes of irregular academic
performance should be studied by trend that means there should be an exploration of
at least five years consecutively.

111
REFERENCES
Acheampong, A. (2003). Ghana study: World Bank
Al-Samarrai,S., and Bennell, P. (2003). Where has all the education gone on Africa?
Employment outcomes among secondary school and university leavers,
IDS/KSD: Brighton
Babyegeya, E.B.N.K. (2002). Educational, Planning and Administration, Dar es
Salaam: The Open University of Tanzania.
Bennell, P.S and Acheampon,K. (2003). Research Project Application to DFID:
Teacher motivation and incentives in low-income developing countries,
Knowledge and skills for development: Brighton.
Bennell, P.S. (2006). ‘Teacher mortality in sub-Saharan Africa: A review’,
Knowledge and skills for development: Brighton
Best, J.W and Kahn, J.V. (2006). Research in education, New Delhi: Pearson
Education, Inc and Dorling Kindersley Publishing Inc:
Bhattacharyya, D.K. (2009). Organizational behaviour: Concepts and applications, :
New Delhi: Oxford University Press.
Chakraborty D., (2009. Research methodology, New Delhi: Saurabh Publishing
House:
Chamberlin, R., Wragg, T., Haynes, G. and Wragg, C. (2002). ‘Performance-related
pay and the teaching profession’: A review of the literature’, Research papers
in education, 17:31-49.
Cole, G.A. (1995). Organisational behaviour: Theory and practice, D. P Publications
Farrell, J.P. and Oliveira, J.B.(1993). ‘Teachers in developing countries,’ improving
effectiveness and management costs. Economic development institute,
Washington D.C.: World Bank.

112
Global Campaign for Education. (2005). Teachers for all; what governments and
donors should do? Cape Town: GCE.
Gupta, C.B. (2010). Human resource management, (12th ed.), New Delhi: Sultan
Chand and Sons.
Haldar, U.K. (2010). Leadership and team building, New Delhi: Oxford University
Press.
Herzberg, F., Mausner, B., Peterson, R., and Capwell, D. (1957). Job attitudes,
Review of research and opinion, Psychological Services of Pittsburg:
Pittsburg, PA
Herzberg, F. (1966) Work and the nature of man, New York: Crowell Publication.
Hoy, W. K., and Miskel, C.G. (1991). Educational administration: Theory, research
and practice, New York: McGraw Hill.
Hughes, R. L., Robert, C.G., and Gordon, J.C. (2008) Leadership enhancing lessons
of experience, New Delhi: Tata Mac Graw- Hill Publishing:
International Institute for Educational Planning (IIEP) (2004) Teachers: Paris.
Priority Newsletter Vol. XXII, no.1
Kothari, C.R. (2004). Research methodology: methods and techniques, New Delhi:
New Age International (P) Limited Publishers
Kombo, D. K., and Tromp, D.L.A. (2006). Proposal and thesis writing: An
Introduction, Nairobi, Paulines Publications Africa
Locke, E.A. (1976). ‘The nature and causes of job satisfaction’, in M.D. Dunnette
Handbook of industrial and organization, Chicago: McNally.
Maslow, A. H. (1943). Theory of human motivation, Psychological review, 50:379-
396.

113
Mingat, A. (2002). Teacher salary issues in African countries. World Bank
Mulkeen, A. (2005). ‘Teachers for rural schools: A challenge for Africa’, Paper
presented at the ministerial seminar on education for rural people in Africa:
Policy lessons, options, and priorities, Addis Ababa: FAO/IIEP/ADEA.
Orodha, A.J. (2003). Essentials of educational and social sciences research method,
Nairobi: Masola Publishers:
Pestonjee, D.M. (1991). Motivation and job satisfaction, New Delhi: Macmillan.
Saleemi, N.A. (I997). Personnel management simplified, Nairobi: N.A Saleem:
Spear, M., Gould, K., & Lee, B. (2000). Who would be a teacher? A review offactors
motivating and de-motivating prospective and practicing teachers, London:
National Foundation for Educational Research:
Spector, P.E. (1994). Job satisfaction survey, New Delhi: University of South
Florida.
United Republic of Tanzania (2002) Population and housing census: Mbozi District
Profile. Vol. IV
United Republic of Tanzania (2010c, 8 February) Public expenditure tracking survey
for primary and secondary education in mainland Tanzania: Final report.
Ministry of Education and Vocational Training: Claussen, J & Assad, A.S.
Dar es Salaam: Government Printer. Retrieved from http:/www.uwazi.org/
uploads/files/2010_ PETS%20 Education%20Tanzania%20Final%20Report.
Voluntary Service Overseas (VSO) (2002). What makes teachers tick? A policy
research report on teachers’ motivation in developing countries, London:
VSO.

114
Vroom, V. (1964). Work and motivation, New York: Wiley.
Wilson, D.C., & Rosenfeld, R.H.(1990). Managing organizations, tests, readings and
cases, London: McGraw-Hill.
World Bank (2004), World development report 2004, making services work for the
poor, Washington D.C: World Bank.
World Bank (2007) International bank for reconstruction and development 1818 H
Street, N.W. Washington, D.C. 20433, U.S.A.

115
APPENDICES
Appendix I: Research Questionnaire
I am a student of the Open University of Tanzania pursuing the Degree Master of
Education Administration, Planning and Policy Studies. I request you to respond to
the questions in this questionnaire whole heartedly and enthusiastically. The
questionnaire is designed to gather information that will be useful in revealing the
problem of teachers’ turnover in government secondary schools. Your response will
be kept strictly confidential. You are requested to read it very carefully and answer
all questions. Please put article (√) where is applicable to choose the appropriate
answer.
Please tick one only.
Section One: Demographic Characteristics
1. What is your sex?
(a) Female ( )
(b) Male ( )
2. What is your age group?
(a) 20-34 ( )
(b) 35-49 ( )
(c) 50+ ( )

116
3. What is your education level?
(a) Below Diploma ( )
(b) Diploma ( )
(c) Bachelor ( )
4. For how many years have you been teaching?
(a) Less than 5 ( )
(b) 2. 5-10 ( )
(c) More than 10 ( )
Section Two: Attitude
5. My job means a lot to me more than just money.
(a) Strongly Disagree ( )
(b) Disagree ( )
(c) Neither Agree nor Disagree ( )
(d) Agree ( )
(e) Strongly Agree ( )
6. Why did you decide to become a teacher?
(a) Interest in teaching ( )
(b) Lack of other employment opportunities ( )
(c) Temporary employment ( )

117
7. Given your experience as a teacher, would you still make the same career
choice again?
(a) No ( )
(b) Yes ( )
8. How is your level of job satisfaction as compared to the last three years?
(a) Declined significantly ( )
(b) Declined ( )
(c) Remained the same ( )
(d) Increased ( )
(e) Increased significantly ( )
9. My supervisors show too little interest in the feelings of subordinates
(a) Strongly disagree ( )
(b) Disagree ( )
(c) Undecided ( )
(d) Agree ( )
(e) Strongly agree ( )
Section Three: Prevalence of Teachers’ Turnover
10. Are there teachers’ turnover?
(a) Yes ( )
(b) No ( )
(c) Not Sure ( )

118
Section Four: Socio-economic Causes of Teachers’ Turnover
11. How is your salary scale as compared with those of similar qualifications in
other jobs?
(a) Excellent ( )
(b) Good ( )
(c) Fair ( )
(d) Poor ( )
(e) Very poor ( )
12. The provision of fringe benefits to your teaching profession is
(a) Very good ( )
(b) Good ( )
(c) Poor ( )
(d) Very poor ( )
13. I am strongly accountable to my work.
(a) Strongly Agree ( )
(b) Agree ( )
(c) Undecided ( )
(d) Disagree ( )
(e) Strongly Disagree ( )
14. Do you receive any non-monetary benefits (such as free or subsidized
housing)?
(a) Yes ( )
(b) No ( )

119
15. How many times have you been paid for your leave?
(a) Never ( )
(b) Once ( )
(c) More than once ( )
16. What is the rate of your promotion?
(a) No ( )
(b) Low ( )
(c) High ( )
Section Five: Socio-political Factors
17. How is your living standard as compared to the last three years?
(a) Declined significantly ( )
(b) Declined ( )
(c) Remained the same ( )
(d) Increased ( )
(e) Increased significantly ( )
18. Are the government policies supporting teaching professional effectively?
(a) Yes ( )
(b) No ( )
19. Accountability as practiced in our school system creates an undesirable
atmosphere of anxiety among teachers
(a) Strongly agree ( )

120
(b) Agree ( )
(c) Disagree ( )
(d) Strongly disagree ( )
20. Working conditions in this school are?
(a) Very good ( )
(b) Good ( )
(c) Just OK ( )
(d) Poor ( )
(e) Very poor ( )
21. Do you have extra duties at your school?
(a) Yes ( )
(b) No ( )
22. Do you have decent accommodation at your school?
(a) Yes ( )
(b) No ( )
Section Six: The Impact of Teachers Turnover
23. How is the academic performance of your school as compared to three years ago?
(a) Better ( )
(b) Worse ( )
(c) Same ( )

121
Appendix II: Interview Guide Questions for Educational Officers
1. How many teachers do you have at your school?
2. What are the qualifications of your teachers?
3. Give your own view why teachers move in and out of their schools?
4. How is the school academic performance in national examinations for the last
three years?
5. What are the factors that contributed to that performance?

122
Appendix III: The Map Showing the Study Area (Mbozi District)
Source: District Education Office-July 2012