an assessment of south africa’s agricultural …an assessment of south africa’s agricultural...
TRANSCRIPT

An Assessment of
South Africa’s
Agricultural Trading
Environment with select
trading regimes1
Report October 2010
���� PLEASE CONSIDER THE ENVIRONMENT BEFORE PRINTING THIS PUBLICATION.
1 This report is the outcome of a 1 week training session (Geek Week) on trade data analysis conducted by tralac at Rhodes University from 30 August – 03 September 2010.

An Assessment of South Africa’s Agricultural Trading Environment with select trading regimes
Report | October 2010
Copyright © tralac, 2010.
Readers are encouraged to quote and reproduce this material for educational, non-profit
purposes, provided the source is acknowledged. All views and opinions expressed remain
solely those of the authors and do not purport to reflect the views of tralac or NAMC.
Report prepared by:
Ron Sandrey2 Taku Fundira3 Bonani Nyhodo4 Aviwe Ganyaza5 Noma-Efese Mxi6
Nomonde Mampuru7 Sam Legare8
Shonisani Madzivhe9 Nico Scheltema10
2 Senior Research Fellow:- tralac Associate and Hobart Houghton Research Fellow at Rhodes University 3 Researcher: tralac 4 Senior Researcher:- Trade Analysis: National Agricultural Marketing Council 5 Assistant Director:- SADC International Trade and Economic Development Division (ITED): Department of Trade and Industry 6 Assistant Director:- SADC International Trade and Economic Development Division (ITED): Department of Trade and Industry 7 Deputy Director:- International trade & economic development (ITED): Department of Trade and Industry 8 Senior Agricultural Economist:- the Directorate International Trade of DAFF 9 Senior Agricultural Economist:- the Directorate International Trade of DAFF 10 Intern:- Trade Analysis: National Agricultural Marketing Council
1
An Assessment of South Africa’s Agricultural Trading Environment
with select trading regimes Report | October 2010
Background
As an essential part of tralac’s capacity building mandate in Southern Africa we hold, in cooperation
with the National Agricultural Marketing Council (NAMC), an annual trade data week to familiarise
participants with accessing, assessing and interpreting trade data (colloquially known as “Geek
Week”). This year the exercise was held at Rhodes University in Grahamstown11, and was attended
by analysts from NAMC, National Department of Agriculture and the dti. The objective of this paper
is to present the work was undertaken during this week and hopefully showcase how data can be
used to assist policy makers in assessing trade policy options for South Africa. Some of this work is
designed to assist in building the foundations of the tralac research on its forthcoming book “South
Africa’s way ahead: Cape to Cairo”12.
The group researched five separate areas of interest to trade policy. These were:
• An assessment of tariffs currently facing South African exporters of agricultural products in
the Cape to Cairo tripartite region;
• An assessment of the effects on bilateral trade of the earlier Trade and Development
Cooperation Agreement (TDCA) between the EU and South Africa;
• An assessment of the extent to which South African bilateral trade with some of its major
partners is trade in related products (intra-industry trade) as distinct from trade in unrelated
products (inter-industry trade);
• An assessment of the opportunities for South African exporters of agribusiness products in
the African continent; and
• An assessment of the impact of the late 2007-early 2008 commodity price boom on South
African exports and imports of agricultural products respectively.
We emphasise at the outset that this research was part of a data training week and the results
presented in the paper cannot be regarded as the definitive work on these topics, but rather an
example of how data can be used to address important policy questions.
11 The week was coordinated by tralac’s Taku Fundira and NAMC’s Bonani Nyhodo, with tralac Associate Ron Sandrey responsible for the work output. Ron Sandrey was at Rhodes on the Hobart Houghton Fellowship during this period, and we thank Prof Hugo Nel and Niki Cattaneo from the Economics Department for their support and cooperation. 12 This is the fourth book in the tralac “South Africa’s way ahead” series, and we are grateful to NAMC for the funding of this project. This book will examine the implications for South African agricultural interests of integration between SADC, EAC and Comesa to give a common market from Cape Town to Cairo (the so-called tripartite region).

An Assessment of South Africa’s Agricultural Trading Environment
with select trading regimes
Report | October 2010
2
1. An assessment of tariffs currently facing South African exporters of agricultural
products in the Cape to Cairo tripartite region
In an effort to enhance market access, harmonise policies in areas of common interest and address
the issue of multiple membership among other issues, Heads of States from the regional economic
communities (RECs) of COMESA, EAC and SADC agreed in 2008 to establish a FTA amongst the
three RECs. One area that will become contentious is the issue of sensitive products for exemption
from tariff liberalisation in the different countries/regional groupings. Unfortunately, much of the
basis for this exemption designation is likely to be arbitrary, and the sensitive products are more
likely to reflect protectionist interests or rent-seeking behaviour, both of which will perpetuate
inefficiencies. We urge countries to base their selection on genuine public policy objectives.
Currently COMESA and EAC have attained customs union (CU) status (in theory COMESA is a
customs union, but not yet implemented in practice) while SADC is still a FTA but is also aiming to
attain CU status. For the proposed tripartite FTA to function there is a need for the rationalisation
of tariff structures and to develop common criteria for sensitive products amongst other issues. For
the two CUs - COMESA and the EAC, rationalisation of tariff structures is not an issue as both have
agreed and established CET duty rates that have similar applied duties on capital goods (0%); raw
materials (0%); intermediate goods (10%); and finished goods (25%). However, SADC, which is still a
FTA will need to agree on a CET and because of the multiple membership conundrum that its
members face, may well rationalise its envisaged CET duties in a manner similar to those of the other
RECs (i.e. COMESA and EAC). The fact that within SADC there is a CU, SACU, with a rather
complex tariff structure in terms of the number of tariff lines and bands also complicates this process
A review of South African agricultural exports facing tariffs in the tripartite enclave
During the data training week we undertook a review of the agricultural products that South African
exporters face in the COMESA-EAC-SADC tripartite configuration. Our aim is to identify
agricultural products that are classified as sensitive products by members of the tripartite
configuration and thus may well remain so in the broader regional integration process. We have also
included the broad range of clothing and textile products, as an examination of the tariffs here may
give an indication as to whether or not better access may offer export opportunities for the
embattled South African clothing sector. In an attempt to determine these products we use the
current MFN applied rates as reported to the UN ITC MacMap database (at the HS 6 level of the
harmonised classification system) by the respective countries in the tripartite configuration.
An Assessment of South Africa’s Agricultural Trading Environment
with select trading regimes
Report | October 2010
3
Our preliminary analysis reveals the following:
- With the exception of SACU members and Libya, South African agricultural products still face
tariffs in the tripartite configuration;
- Mauritius (95%); Seychelles (85%); Zambia (83%) and Mozambique (81%) are the only countries
which are relatively open to South African exports of agriculture products. The rest of the
countries in the tripartite configuration still maintain protection in over 60% of the product
lines under review, with Burundi (100%); Rwanda (96%); Zimbabwe (95%) and Sudan (88%)
maintaining protection on virtually all products.
- In most countries under review, “Food, Beverages and Tobacco” and “Vegetable products”
still face the highest level of protection.
- Mauritius; Mozambique; Seychelles; Tanzania and Uganda are the only countries that offer duty
free access to South Africa C&T exports.
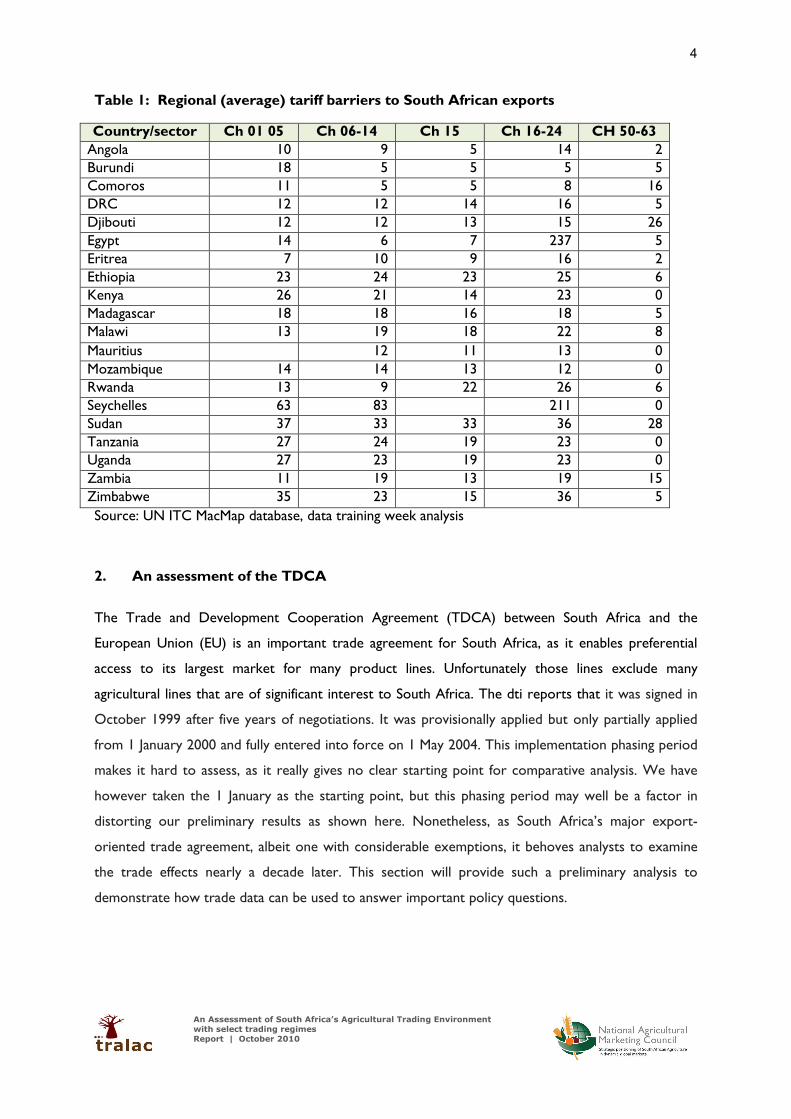
The tables below provide details of the level of protection that South African exporters are facing in
each of the countries in the tripartite configuration. We have only shown the averages and not the
variations within these categories. The data clearly signals that (a) there is a considerable distance to
go in implementation of the so-called SADC Free Trade Agreement, and (b) this and the high tariffs
further north do not auger well for anything other than an FTA in name only! The categories shown
are:
- Chapters HS 01 to 05 inclusive, live animals, animal products;
- Chapters HS 06 to 14 inclusive, vegetable products;
- Chapter 15, animal or vegetable fats & oils;
- Chapters 16-24 inclusive, food, beverages & tobacco; and
- Chapters 50 -63, clothing and textiles.
An Assessment of South Africa’s Agricultural Trading Environment
with select trading regimes
Report | October 2010
4
Table 1: Regional (average) tariff barriers to South African exports
Country/sector Ch 01 05 Ch 06-14 Ch 15 Ch 16-24 CH 50-63
Angola 10 9 5 14 2
Burundi 18 5 5 5 5
Comoros 11 5 5 8 16
DRC 12 12 14 16 5
Djibouti 12 12 13 15 26
Egypt 14 6 7 237 5
Eritrea 7 10 9 16 2
Ethiopia 23 24 23 25 6
Kenya 26 21 14 23 0
Madagascar 18 18 16 18 5
Malawi 13 19 18 22 8
Mauritius 12 11 13 0
Mozambique 14 14 13 12 0
Rwanda 13 9 22 26 6
Seychelles 63 83 211 0
Sudan 37 33 33 36 28
Tanzania 27 24 19 23 0
Uganda 27 23 19 23 0
Zambia 11 19 13 19 15
Zimbabwe 35 23 15 36 5
Source: UN ITC MacMap database, data training week analysis
2. An assessment of the TDCA
The Trade and Development Cooperation Agreement (TDCA) between South Africa and the
European Union (EU) is an important trade agreement for South Africa, as it enables preferential
access to its largest market for many product lines. Unfortunately those lines exclude many
agricultural lines that are of significant interest to South Africa. The dti reports that it was signed in
October 1999 after five years of negotiations. It was provisionally applied but only partially applied
from 1 January 2000 and fully entered into force on 1 May 2004. This implementation phasing period
makes it hard to assess, as it really gives no clear starting point for comparative analysis. We have
however taken the 1 January as the starting point, but this phasing period may well be a factor in
distorting our preliminary results as shown here. Nonetheless, as South Africa’s major export-
oriented trade agreement, albeit one with considerable exemptions, it behoves analysts to examine
the trade effects nearly a decade later. This section will provide such a preliminary analysis to
demonstrate how trade data can be used to answer important policy questions.
An Assessment of South Africa’s Agricultural Trading Environment
with select trading regimes
Report | October 2010
5
2.1 Has bilateral trade since 2000 been trade widening or trade deepening?
In an earlier 2005 publication Kalaba et al examined this question. We have used the same
framework to extent that work, as the 2005 paper concluded that perhaps insufficient time had
elapsed to fully assess the TDCA. Basically, as outlined in the 2005 paper, trade widening takes place
when new trade is created as a result of an FTA. It is defined as an expansion of trade in new areas
that did not take place prior to the FTA. It is distinct from trade deepening, defined as an expansion
of trade in the sectors as they were at the inception of the FTA. They emphasise that the
development of new trade is difficult to capture using computer general equilibrium (CGE) models,
as these model are based upon existing or extant trade and not potential or latent trade. It is
development of the latter that that goes a long way to suggesting that an FTA has been a success, but
Kalaba et al caution and we reiterate that that a related problem with FTA’s is that preferences may
merely divert trade away from lower-cost sources to the preferential sources and thus are not
welfare enhancing. Readers are referred to the earlier “South Africa’s way head” publications to see
computer analysis of this phenomena in the suite of FTAs and potential FTAs examined in this more
structured research.
The preliminary (but cautious and perhaps confusing) picture from Kalaba et al was that widening
seemed to have occurred since 2000 but that there was “preceded by a period during the second
half of the 1990s in which there was a clear trend of reverse widening (deepening)”. Therefore, new
or “relatively new” trade lines were being added to the bilateral basket, and furthermore these
products were generally associated with a higher tariff phase-down.
The Methodology used was to take the bilateral annual trade data from 1996 – 2009 as
reported by South Africa World Trade Atlas (WTA) and agree on a base year, in this case 2000
(TDCA inception year). The second step was to rank the HS6 product groups in terms of value for
2000. The third step involved segmenting the product groups into 10% deciles (10 groups of 10%
each).
- An increase in the top 10% segment will represent trade deepening as it contains typically only
a few product lines but with high values of trade.
- An increase in the bottom 10% segment represents trade widening as it contains a large
number of product lines with low individual values of trade.
- The fourth step was to track the shares of the segments over time. Trade deepening will be
seen when the total value of what represented the top 10% in 2000 has increased more than

An Assessment of South Africa’s Agricultural Trading Environment
with select trading regimes
Report | October 2010
6
proportionally over time. Trade widening will be seen when the total value of what
represented the bottom 10% in 2000 has increased more than proportionally over time.
Figure 1 shows the big-picture of the bilateral trade from 1996, expressed in millions of
South African rand. The data suggests that trade has been in favour of the EU since 1996 and this
seems to have accentuated after 2000, and the impacts of the global crisis of 2009 is clearly shown.
Figure 1: Bilateral EU-South African trade, 1996 to 2009 in R million
Source: WTA
Extending the analysis further Figure 2 shows the percentage of (a) South African global exports
destined for the EU and (b) the percentage of South African imports sourced from the EU over the
period. It is clear that the relative importance of the EU as an import source has steadily declined,
while conversely, excepting for the perhaps abnormal 2009 year, the importance of the EU as an
export destination has been very stable.
Figure 2: Relative importance of the EU as a trading partner for South Africa –
percentage shares
Source: WTA

An Assessment of South Africa’s Agricultural Trading Environment
with select trading regimes
Report | October 2010
7
Following Kalaba et al we also examined the data and excluded exports of coal and fuel (HS25 – 27)
as well as gold and diamond (HS71) from South Africa to the EU and imports of fuel (HS27) and
special vehicle imports under the MIDP scheme (HS98). While these lines are highly significant in
trade values, we assume that policy makers are not that interested in the performance of coal and
precious minerals in the EU market as there are generally zero duties assessed on this trade, and
similarly the importation of fuels and motor vehicles really only complicates an analysis trying to
examine the bigger picture.
The results
RSA Exports to the EU
Figure 3 shows the data for the first three of the top-ten percentage trade shares (recall that the
analysis excludes exports of minerals (HS25 – 27) as well as gold and diamond (HS71)). Note that
these groups were not exactly aligned at 10 percent shares as of 2000, as rather than split the
individual HS 6 digit lines we opted to approximate the desirable 10 percent shares with the closest
approximation.
Figure 3: Shares in the upper three segments
South Africa’s 1st top 10% product group exports to the EU deepened from 1996 to 2001, just after
the inception of the SA-EU FTA in 2000. This was exclusively caused by increase in exports of

An Assessment of South Africa’s Agricultural Trading Environment
with select trading regimes
Report | October 2010
8
filtering or purifying machinery as this was the only line in the group. However, these exports
increased prior to 2000. The 2nd top 10% exports product group consists entirely of motor
vehicles and an examination of the data suggests that perhaps a reclassification of trade between
HS8703.21 – 8703.24 may have been taking place that is confusing the picture here although the
combined overall trade in these four lines varied considerably between the years. Whatever, the
share of this particular HS line deepened from 1996 until 1999 when it started to decline until the
insignificant levels from 2007 to 2009. The 3rd top 10% exports product group consists of
chromium and parts of seats, and the shares of these two products appear to be stable over time.
Next we extended the analysis to the top four categories or 40 percent of the trade at
2000. This is shown in Figure 4. Based on the graph of these four categories it can be deduced
that South Africa’s exports to the EU deepened between 1996 and 2000 but thereafter stabilized
through until 2009. Much of this deepening can be attributed to increase in exports of filtering or
purifying machinery as well as the share of this export increased from just two percent in 1996 to
around ten percent in 2000. The conclusion supports Kalaba et al in that the TDCA has had little or
no impact on deepening RSA’s exports into the EU market since RSA’s exports remained stable after
its inception.
Figure 4: Shares in the mid four categories

An Assessment of South Africa’s Agricultural Trading Environment
with select trading regimes
Report | October 2010
9
We then examined the three lowest of the 10th product segments of exports to the EU to
assess whether trade has widened between 2000 and 2009 at this lower level. Shares of the lowest
or 10th segment is depicted by an increase in the share of these product lines that represented 10%
in 2000 to 32% in 2009 as shown in Figure 5, and implies that SA exports to the EU have widened by
22% from 2000 till 2009. However, again we note that exports in this group were declining prior to
the inception of the TDCA. This could perhaps suggest that the TDCA revived these exports.
Exports in both the second to bottom or 9th segment and the third to bottom or 8th segment show
remarkably consistent trends – they were very stable through to 200 but gradually declined from
that point.
Figure 5: Shares in the lower three segments
Source: WTA
Again, combining these three lower segments and adding the 7th or fourth to bottom segment (Figure
6) shows another stable pattern. The share of products constituting these four product segments
decline from the 1996 pre-TDCA levels to our 10 percent criteria for the four (40 percent in total)
at 2000 before increasing to almost exactly their 1996 levels. This, coupled the flat market share of
the EU in South Africa’s exports (Figure 6) reinforces the conclusion that there is little to suggest
that the TDCA has promoted South African exports to the EU. We cannot of course test the
corollary that the agreement may have arrested what otherwise may have been a greater decline.

An Assessment of South Africa’s Agricultural Trading Environment
with select trading regimes
Report | October 2010
10
Figure 6: Shares in the lower four segments
2.2 South African imports from the EU
We now turn to a comparable analysis of South African imports from the EU, and again recall that
imports of HS27 (fuels) and HS98 (special vehicle imports) have been excluded.
Figure 7: South African imports from the EU, 1st and 10th 10 percent-segments.
There is no clear picture with regard to deepening of South Africa’s top 10% product group
imported from the EU during the period under consideration. This segment increased through to
1998 and then stabilised until 2006 before declining. This segment consisted of only two products,
with the top line at 2000 being communication machinery. Import of this product increased from just

An Assessment of South Africa’s Agricultural Trading Environment
with select trading regimes
Report | October 2010
11
R1.5 billion in 1996 to around R5 billion from 2002 to 2006 before declining to zero. The only other
product was motor vehicles where imports increased from around half a billion in 1996 through to
R8 billion in 2007 before declining to just under R6 billion. More encouragingly the bottom 10%
import segment displays a clearer picture with regard to widening during the period under
consideration. A widening can be seen between 2000 and 2004 and thereafter between 2006 and
2008, but again imports in this segment were declining prior to 2000. Again, the TDCA may again
have arrested a decline immediately after 2000 as well as assisting with trade widening in the later
years of the first decade of the new millennium.
Next we combine the top four segments and the bottom four segments as shown in Figure 8. Again
we see the picture of some evidence of trade widening as indicated by the increase in the bottom
four segments after 2000 but this evidence tempered by the decline from 1996 through to 2000.
Similarly for the top 40 percent segments the imports steadily increased through to their high points
in 2000without the benefits of the TDCA before slowly declining to about exactly their 1996 initial
levels. As with South African exports to the EU we concur with Kalaba et al and see no compelling
evidence to suggest that the TDCA has manifestly impacted upon the bilateral trading relationship.
Figure 8: the top and bottom four segments of South African imports from EU at 2000.
Source: WTA
2.3 How well has South Africa performed in the EU market?
Perhaps of more importance is an examination of South Africa’s relative performance in the EU
market over this period. To assess this question we again used the World Trade Atlas data (but this
time from the EU) for the two periods 2000 and 2009 December years (expressed in Rand millions)
and examined South Africa’s performance relative to its competitors at the detailed HS 6 digit lines.

An Assessment of South Africa’s Agricultural Trading Environment
with select trading regimes
Report | October 2010
12
This gave us over 5,000 lines to work with. The first step was to look at the overall performance of
EU imports and then South Africa’s overall performance. We found that the EU imports in Rand had
increased by an average of 8.77 percent while those from South Africa increased by a lesser 6.93
percent, showing that overall South Africa was losing market share. Next we assessed each and
every line to see how well that line was doing against its competitors. This gave us eleven separate
categories to work from:
- Indeterminate, where there were no imports from South Africa in either 2000 or 2009 so we
could not assess an increase. We note at the outset that this is a preliminary assessment, and
changes to EU import classifications may have taken place which will exaggerate this category.
- The “gold stars”, where the line was increasing as a percentage of EU from both the world and
South Africa, and furthermore the increase from South Africa was above the corresponding
increase from the world – South Africa is gaining market share in a strongly growing EU
market.
- The “stars”, where as above except that South Africa’s share in these lines was above its
overall import share but not above the comparable competitor share in this line. South Africa
is doing very well in a growth EU market. Both “gold stars” and “stars” are doing well.
With the next set of seven categories we can assess the combinations of South African performance
against competitor performance in EU markets that can be growing above the EU import average,
below the EU import average, or where the EU import average is negative. These lines generally
represent “battlers” where exporters are fighting a steady but sometimes lonely and perhaps losing
battle.
- There are two combinations where the increases in the EU lines are above the EU average: (a)
where the South African line increase is still positive but below the South African average and
(b) where the South African increase is negative.
- Next there are three categories where the increases in the EU lines are still positive but below
the EU average: (a) where the South African line increase is above the South African average,
(b) where the South African increase is below the average but still positive and (c) where the
South African increase is negative.
- These are followed by two combinations where the increases in the EU lines are negative: (a)
where the South African line increase is above the South African average, and (b) where the
South African line increase is negative.
An Assessment of South Africa’s Agricultural Trading Environment
with select trading regimes
Report | October 2010
13
Finally, there is the bottom category (real dogs) where this particular line is declining overall in both
EU imports from the world and from South Africa. These exporters are engaged in more of a
forlorn battle.
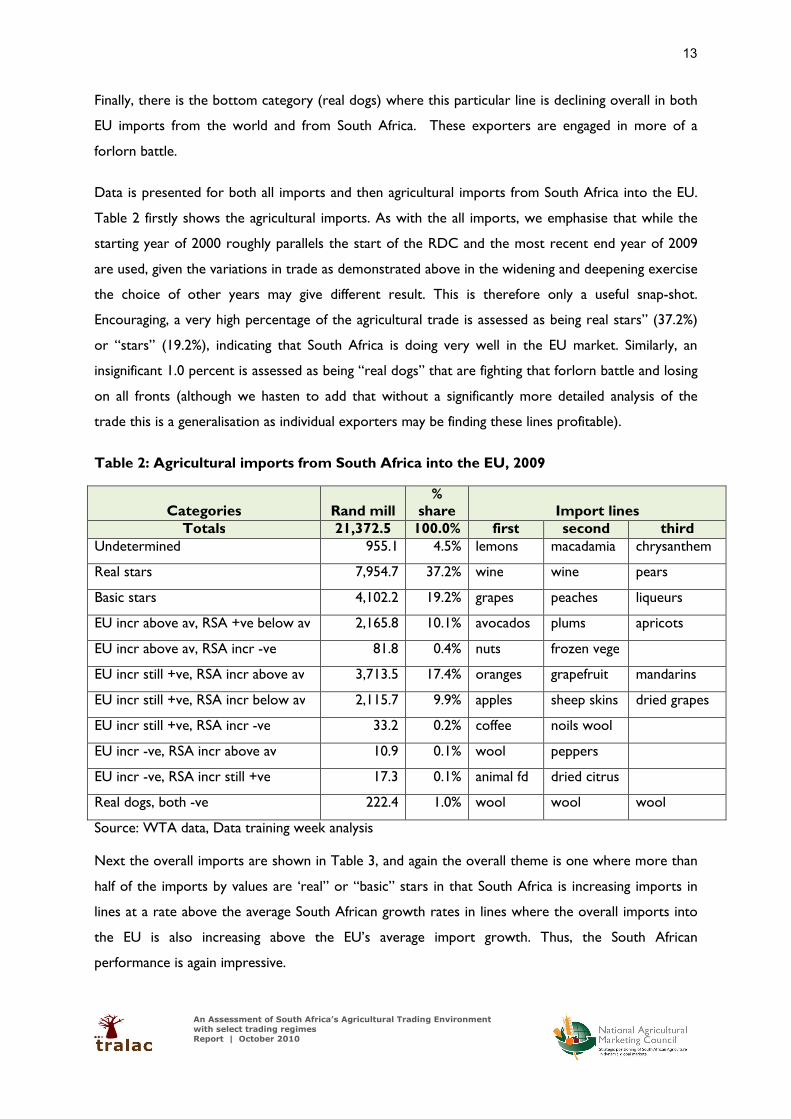
Data is presented for both all imports and then agricultural imports from South Africa into the EU.
Table 2 firstly shows the agricultural imports. As with the all imports, we emphasise that while the
starting year of 2000 roughly parallels the start of the RDC and the most recent end year of 2009
are used, given the variations in trade as demonstrated above in the widening and deepening exercise
the choice of other years may give different result. This is therefore only a useful snap-shot.
Encouraging, a very high percentage of the agricultural trade is assessed as being real stars” (37.2%)
or “stars” (19.2%), indicating that South Africa is doing very well in the EU market. Similarly, an
insignificant 1.0 percent is assessed as being “real dogs” that are fighting that forlorn battle and losing
on all fronts (although we hasten to add that without a significantly more detailed analysis of the
trade this is a generalisation as individual exporters may be finding these lines profitable).
Table 2: Agricultural imports from South Africa into the EU, 2009
Categories Rand mill %
share Import lines Totals 21,372.5 100.0% first second third
Undetermined 955.1 4.5% lemons macadamia chrysanthem
Real stars 7,954.7 37.2% wine wine pears
Basic stars 4,102.2 19.2% grapes peaches liqueurs
EU incr above av, RSA +ve below av 2,165.8 10.1% avocados plums apricots
EU incr above av, RSA incr -ve 81.8 0.4% nuts frozen vege
EU incr still +ve, RSA incr above av 3,713.5 17.4% oranges grapefruit mandarins
EU incr still +ve, RSA incr below av 2,115.7 9.9% apples sheep skins dried grapes
EU incr still +ve, RSA incr -ve 33.2 0.2% coffee noils wool
EU incr -ve, RSA incr above av 10.9 0.1% wool peppers
EU incr -ve, RSA incr still +ve 17.3 0.1% animal fd dried citrus
Real dogs, both -ve 222.4 1.0% wool wool wool
Source: WTA data, Data training week analysis
Next the overall imports are shown in Table 3, and again the overall theme is one where more than
half of the imports by values are ‘real” or “basic” stars in that South Africa is increasing imports in
lines at a rate above the average South African growth rates in lines where the overall imports into
the EU is also increasing above the EU’s average import growth. Thus, the South African
performance is again impressive.

An Assessment of South Africa’s Agricultural Trading Environment
with select trading regimes
Report | October 2010
14
Table 3: Overall imports from South Africa into the EU, 2009
Categories R mill %share Import lines Totals 21,373 100.0% first second third
Undetermined 10,303 6.0% platinum wast
fuels special petroleum
Real stars 44,589 25.8% filter mach prec metals wine
Basic stars 42,893 24.8% coal coal platinum
EU incr above av, RSA still +ve 6,880 4.0% seat parts part filtering avocados
EU incr above av, RSA incr -ve 1,382 0.8% wood doors anthracite wood pulp EU incr still +ve, RSA incr above av 24,544 14.2% ferro-chrom vehicles oranges EU incr still +ve, RSA incr below av 5,973 3.5% apples palladium fish chilled EU incr still +ve, RSA incr -ve 11,901 6.9% gold diamonds aluminium
EU incr -ve, RSA incr above av 371 0.2% prec amalgam carboxylic
EU incr -ve, RSA incr still +ve 22,544 13.0% diamonds granite Real dogs, both -ve 1,652 1.0% vehicles data parts greasy wool Source: WTA data, Data training week analysis
Conclusions
From this qualified analysis of (a) the effects of the TDCA using a trade widening-trade deepening
exercise and (b) a detailed analysis of how well South Africa is doing in the EU market relative to its
competitors we have concluded that (a) the TDCA does not appear to have opened new trade
opportunities for South Africa and (b) that South Africa has done very well in the EU market since
2000. We have not assessed this latter performance against the TDCA though to see if tariff
reductions have facilitated this performance. We also caution that the TDCA has a potential cost of
trade diversion for South African imports insofar as the EU is not necessarily the world’s lowest cost
supplier of many import goods – in general, we must turn attention eastwards for that source. This
also accentuates the reducing tariff collection and subsequent redistribution under the SACU
revenue formula – not necessarily a direct problem for South Africa as much of this redistribution is
effectively an aid grant to the BLNS but an increasingly severe problem for the BLNS countries.
3) Intra-industry trade
Traditional trade theory teaches that trade between partners will be governed by factor endowment
and comparative advantages. However, recent findings are questioning this pattern as more and more
trade is taking in similar products place between partners, and this has been defined Intra-industry
trade. Inter-industry is associated with the traditional reallocation of resources between industries,
while intra-industry requires reallocation within industries. The intra-industry trade (IIT) index is
calculated by taking the difference between total trade and the absolute value of net trade, dividing

An Assessment of South Africa’s Agricultural Trading Environment
with select trading regimes
Report | October 2010
15
that by total trade of the commodity as defined by the Grubel-Lloyd index. As with Section 2 above,
Kalaba et al examined this aspect of South Africa’s trading performance in 2005. The simplified
version of the formula is stated as stated Absolute value of (Xj minus Mj) dived by (Xj plus Mj) where
X and M are the value of exports and imports product in detailed product j. This is then trade-
weighted to give an overall figure, and if the original formula is multiplied by 100 the index varies
between 0, indicating complete inter-industry trade and 100, implying complete intra-industry. In
general, more disaggregation of the data is better as it gives a lower but more meaningful number of
the intra-industry trade.
This section of the paper look at intra-industry trade between South Africa (RSA) and eight trading
partners, namely, Brazil, China, European Union (EU-27), United States of America (USA), Common
Market for Eastern and Southern Africa (COMESA), East Africa Community (EAC-5), Southern
African Development Community (SADC). Results of the analysis found that in general.
- The higher the value, of total trade, the higher the level of intra-industry trade between RSA
and a country concerned or vice versa.
- There is more intra-industry trade between RSA and EU compared to USA and SADC.
- There has been an increase in intra-trade industry between RSA and EU from 1996 to 2003
and a decrease from 2004.
- There is more intra-industry trade between RSA and SADC-14 compared to RSA and USA
(see figure 9).
- The levels of intra-industry trade between RSA and USA from 1996 to 2003 are relatively high
and reduced from 2004 to 2009.
- The levels of intra-industry trade between RSA and SADC are at an average of 6.00 from 1996
to 2009.

An Assessment of South Africa’s Agricultural Trading Environment
with select trading regimes
Report | October 2010
16
Figure 9: Intra-industry trade between RSA and EU, SADC and the USA.
Source: WTA data, Data training week analysis
In the next set of calculations there are low levels of intra-industry trade between RSA, Brazil, China
and EAC-5 from 1996 to 2009 as shown in Figure 10:
- There is an extremely low level of intra-industry trade between RSA and COMESA from 1996
to2009 of almost zero.
- Intra-industry trade between RSA and EAC-5 fluctuates, with moderate levels in only 2008 and
perhaps 2007.
- Intra-industry trade between RSA and China fluctuate between 1.0 and 2.0.
- Brazil was the only country to show an increasing intra-industry trend from 1996 to 2009.

An Assessment of South Africa’s Agricultural Trading Environment
with select trading regimes
Report | October 2010
17
Figure 10: Intra-industry trade between RSA and EU, SADC and the USA.
Source: WTA data, Data training week analysis
4. An assessment of the agribusiness opportunities in Africa for South African
agricultural exporters.
This section of the paper presents an initial analysis of opportunities for South African agribusiness
traders in Africa. As such, it provides a background base for and an indication of the more detailed
analysis that tralac will undertake as part of the “Cape to Cairo” project for the NAMC. Data was
sourced from the UN Food and Agricultural Organisation (FAO) website and analysed as below. In
addition, a preliminary “eyeballing” of the WTA data for South African exports was used to shed
more light on export opportunities. While the FAO database provides a superb set of data on
African production and trade in several hundred agricultural and agricultural related products it does
have some limitations for this particular analysis. Those limitations are:
- there is no bilateral trade data, so although the African aggregate and indeed individual country
trade is provided it is not possible to get information on issues such as the share of South
African exports going to Africa; and
- Associated with this is that the HS codes applicable to the FAO definitions are not readily
available so that they can be reconciled with the WTA data on South African exports; and
- Note that we have defined agribusiness here as the FAO agricultural products minus those
classified by the FAO as “crops” (wheat, maize, soybeans per se etc.).

An Assessment of South Africa’s Agricultural Trading Environment
with select trading regimes
Report | October 2010
18
Notwithstanding these limitations the analysis is presented as it represents a valuable contribution to
a potential growth export area of higher-valued trade from South Africa to the wider region. Table 4
starts with a listing of the top agribusiness imports into Africa for the 2007 year – the most recent
comprehensive year available. The central segment shows African imports by value (US dollar 1000s)
for 2007, the totals from 2000 to 2007 inclusive to provide some indication of the variability in these
imports, and the annual rate of change at 2007 from 2000. The right hand side segment shows
comparable South African exports of these same products using the same formats. Thus, along with
details of the main African imports some indication can be gleaned of the potential for South Africa
to export these products.
Table 4: Top 25 African imports
African Imports $1000 RSA Exports $1000
item 2007 totals Change % 2007 total Change %
Palm oil 2,400,044 10,214,409 20.6% 930 8,402 -13.7%
Rice Milled 2,108,299 12,057,469 9.3% 2,153 27,387 -2.9%
Sugar Refined 1,547,466 9,634,138 9.0% 79,873 648,546 1.4%
Milk Whole Dried 1447043 7,071,090 15.4% 5,589 88,429 -10.4%
Soybean oil 1,343,487 6,100,404 15.8% 551 46,343 -38.5%
Food Prep Nes 1,276,266 7,137,348 10.8% 129,522 606,541 14.0%
Sugar Raw Centrifugal 1,209,224 5,480,663 16.8% 200,429 1,504,698 -2.0%
Beef & Veal 789605 3,468,173 13.7% 10,577 54,442 8.7%
Flour of Wheat 773,415 4,915,260 5.6% 2,474 87,189 -26.4%
Milk Skimmed Dry 747,883 3,565,318 11.5% 4,612 25,291 9.0%
Rice Broken 713,287 3,555,779 20.4% 1,211 10,910 21.1%
Crude Materials 692,604 2,920,579 18.9% 99,364 396,110
Cake of Soybeans 682,104 4,521,865 5.7% 1,944 10,134 0.2%
Chicken meat 679731 2,977,846 16.7% 3,870 54,097 -11.9%
Cigarettes 540,391 3,679,786 5.7% 70,725 494,927 -0.7%
Beverages Dist. Alc 512,215 2,412,776 15.3% 59,791 296,857 7.7%
Beer of Barley 390,689 1,644,265 21.5% 9,786 188,530 -15.2%
Wine 390,612 1,703,694 17.2% 668,629 3,504,062 15.4%
Paste of Tomatoes 379,825 1,980,929 13.9% 254 2,625 12.1%
Sunflower oil 374,935 2,263,867 3.0% 8,809 89,535 -2.1%
Beverage Non-Alc 349,509 1,540,012 16.6% 50,963 370,757 4.8%
Malt 340,624 1,764,477 12.0% 2,218 6,391 35.5%
Infant Food 323,779 1,146,801 20.3% 8,878 41,243 4.3% Cheese of Whole Cow Milk 319,406 1,393,865 12.8% 4,644 42,926 12.7%
Pastry 313,959 1,276,726 20.4% 10,555 73,349 6.7%
Source FAO data, Data training week analysis
An Assessment of South Africa’s Agricultural Trading Environment
with select trading regimes
Report | October 2010
19
The key points from the table are:
- Wine is one of the top products in South African exports. In 2007 South Africa’s (RSA) exports
for wine were $668 million and Africa imports were $390 millions. RSA’s exports are significantly
above Africa’s demand for wine, but an examination of the WTA data shows that South Africa
exported only about 7% of its wine to Africa in 2007.
- South Africa exports considerable amounts of sugar, food preparations, ‘crude materials’,
cigarettes and other beverages that potentially match with African imports, but few other
products appear to present opportunities. Also note that demand for agricultural products is
increasing each year in Africa while conversely exports from South Africa in many of these high-
demand African imports are declining.
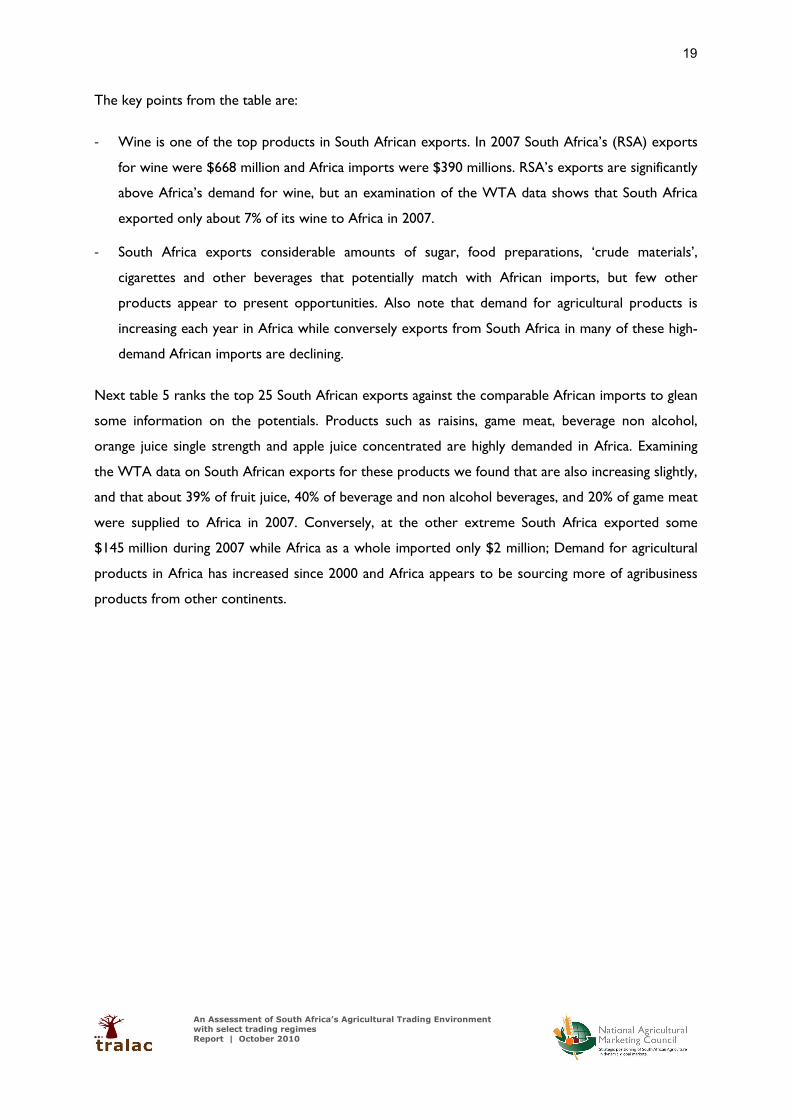
Next table 5 ranks the top 25 South African exports against the comparable African imports to glean
some information on the potentials. Products such as raisins, game meat, beverage non alcohol,
orange juice single strength and apple juice concentrated are highly demanded in Africa. Examining
the WTA data on South African exports for these products we found that are also increasing slightly,
and that about 39% of fruit juice, 40% of beverage and non alcohol beverages, and 20% of game meat
were supplied to Africa in 2007. Conversely, at the other extreme South Africa exported some
$145 million during 2007 while Africa as a whole imported only $2 million; Demand for agricultural
products in Africa has increased since 2000 and Africa appears to be sourcing more of agribusiness
products from other continents.
An Assessment of South Africa’s Agricultural Trading Environment
with select trading regimes
Report | October 2010
20
Table 5: Top 25 SA Exports
SA Exports ($1000) African Imports ($1000)
Items 2007 total Change % 2007 totals Change %
Wine 668,629 2,835,433 15.4% 390,612 15,155,329 17.2%
Sugar Raw Centrifugal 200,429 1,304,269 -2.0% 1,209,224 32,892,563 16.8%
Wool, greasy 145,655 426,006 22.1% 2,150 1,695,241 -9.2%
Food Prep Nes 129,522 477,019 14.0% 1,276,266 26,447,814 10.8%
Crude Materials 99,364 296,746 0 692,604 2,920,579 18.9%
Sugar Refined 79,873 568,673 1.4% 1,547,466 33,980,533 9.0%
Cigarettes 70,725 424,202 -0.7% 540,391 15,289,043 5.7%
Beverages Dist.Alc 59,791 237,066 7.7% 512,215 8,881,411 15.3%
Raisins 55,698 206,149 14.1% 15,178 1,278,747 7.0%
Game meat 54,993 208,607 5.0% 2,645 771,514 6.7%
Tobacco Products Nes 54,954 198,645 46.1% 166,180 5,122,071 1.7%
Beverage Non-Alc 50,963 319,794 4.8% 349,509 7,023,607 16.6%
Fruit Juice Nes 43,654 256,456 12.4% 109,550 2,923,344 14.1%
Hair Carded/ Combed 38,373 200,524 8.1% 5,007 1,024,075 8.0%
Skinsdry Sltsheep 37,199 239,289 3.7% 314 1,138,418 -10.6% Veg.Prod.Fresh Or Dried 25,080 79,099 38.3% 6,468 939,395 16.9%
Chocolate Prsnes 22,981 158,827 1.4% 236,862 4,858,464 20.6%
Grapefruit juice, conc 21,665 67,963 0 808 2,715 41.6%
Hides Wet Salted Cattle 19,406 134,850 1.7% 4,572 1,481,398 -25.6%
Skins With Wool Sheep 18,966 74,894 18.1% 1,774 8,359 21.4%
Hides Nes 17,430 90,839 8.4% 6,969 613,984 9.2% Orange juice, single strength 16,526 28,387 0 26,289 112,593 12.2% Apple juice, concentrated 14,897 40,332 0 35,454 67,829 62.1%
Wool Degreased 14,673 124,982 -2.2% 12,906 685,428 2.7%
Oil Essential Nes 14,462 102,763 1.7% 37,723 2,012,230 4.0%
Sugar Confectionery 13,494 114,119 -6.4% 274,159 5,855,577 17.5%
Source FAO data, Data training week analysis
Finally, in table 6 we have taken a selection from Table 1 of the top African imports where South
Africa may have export potential. These are shown alongside South African exports to the world in
the central columns and South African imports from the world in the right hand columns. Again,
South African exports to the world will include exports to Africa. Total trade from 2000 to 2007
inclusive is shown in US dollar 1000s. The “usual suspects” as discussed above appear in the table.

An Assessment of South Africa’s Agricultural Trading Environment
with select trading regimes
Report | October 2010
21
Table 6: Potential for SA market in Africa
African Imports
($1000) SA Exports ($1000) SA Imports ($1000)
item totals Change % total Change % Totals Change %
Sugar Refined 9,634,138 9.0% 648,546 1.4% 20,707 16.9%
Food Prep Nes 7,137,348 10.8% 606,541 14.0% 805,789 14.9%
Sugar Raw Centrifugal 5,480,663 16.8% 1,504,698 -2.0% 74,697 62.2%
Cigarettes 3,679,786 5.7% 494,927 -0.7% 57,177 27.2%
Crude Materials 2,920,579 18.9% 396,110 0.0% 456,165 0.0%
Beverages Dist. Alc 2,412,776 15.3% 296,857 7.7% 1,109,829 18.8%
Wine 1,703,694 17.2% 3,504,062 15.4% 88,443 13.0%
Beer of Barley 1,644,265 21.5% 188,530 -15.2% 139,946 42.3%
Beverage Non-Alc 1,540,012 16.6% 370,757 4.8% 195,415 16.9%
Sugar Confectionery 1,308,193 17.5% 127,613 -6.4% 252,521 21.8%
Source FAO data, Data training week analysis
In general, we find that in the products demanded by Africa, South Africa is not a major exporter and
except for sugar, wine and other beverages and cigarettes South Africa is importing more than it is
exporting. Furthermore, in general South African imports as shown in Table 6 are increasing
dramatically while exports are conversely increasing at a much lower rate or even declining in four
instances. We will need to drill down the tables and examine the detailed export data from South
Africa to Africa further to assess niche opportunities, reinforcing that this is a preliminary analysis.
5. An assessment of the impact of the late 2007-early 2008 commodity price boom
on South African exports and imports of agricultural products
The commodity boom of the late 2007 – early 2008 period had a dramatic impact upon global
markets, and many but not all agricultural products featured in this boom. The objective for this
section is to analyse the impacts of the boom on South African agricultural trade, and in particular
assess the relative effects on both exports and imports as measured by their prices changes as
measured quarter-on-quarter. Data is sourced from the WTA and trade-weighted to give an overall
rate of change, with the data assessed from 1996 through to and including second quarter 2010 with
the data expressed in South African Rand as distinct from US dollars.
We start by showing how well the rand has performed over the period against the US dollar. While
the dollar itself has been a weak performer in recent years and it can be argued that much of South
African exports are destined for the EU and therefore not especially exposed to the dollar we argue
that many commodities such as wheat, rice and, soybeans and sugar are generally denoted and traded

An Assessment of South Africa’s Agricultural Trading Environment
with select trading regimes
Report | October 2010
22
in dollars. From an initial start at 3.8 rand to the dollar it steadily rose to a high point of 11.5 in the
first quarter of 2002 before declining again to just over 6 and reaching a second high of 9.9 in first
quarter 2009 (Figure 11). The use of Rand will accentuate the US dollar global market changes when
the Rand is low but mitigate the changes when the rand is low, and we expect to see this reflected in
the index values later.
Figure 11: the Rand against the dollar, 1996 to June 2010.
Source: South African Reserve Bank
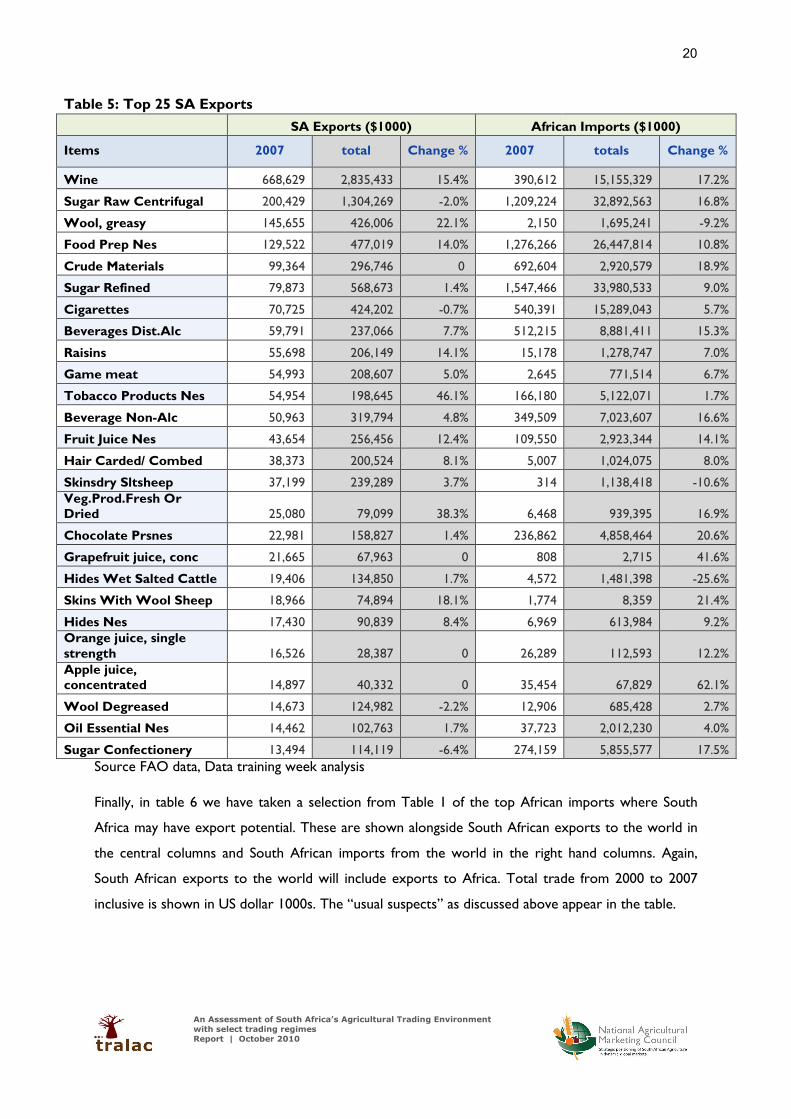
An indication of the possible effects upon import prices can be gleaned from Figures 12 below that
show that shows global rice and wheat prices from September 1985 through to July 2010. This data
is crucial, as rice and wheat are two major imports into South Africa (19.2% of agricultural imports in
2008). Note the dramatic changes in the rice price which peaked at 1,015 in April 2008 and the
similar but not as spectacular rise in wheat prices around the same time. Note also that while wheat
has declined to the more normal level rice is still above its longer term trend.
An Assessment of South Africa’s Agricultural Trading Environment
with select trading regimes
Report | October 2010
23
Figure 12: Global wheat and rice prices (Mundi Index)
Source: Mundi etc etc
Preliminary analysis is shown in Figure 13 of the trade-weighted average annual changes to both
export and import prices. The data is assessed using the top-20 exports and imports by value at
December 2009, where these top-20 exports represented 64 percent of the total exports and the
top-20 imports represented 60 percent of the total imports at December 2009. We have used this
annual data as an interim measure while we further assess the variability of the price data as shown
by the WTA. Note in particular (a) the big changes around the 2002 period when the rand was
weak and (b) the changes at the end of the period when global commodity prices were peaking. Also
note that annual changes will mitigate some of the fluctuations that may well show up in quarterly
data. The graph clearly shows how, during the commodity boom, the average import price change
was significantly above the average export price change but how both had retreated significantly
during 2009.

An Assessment of South Africa’s Agricultural Trading Environment
with select trading regimes
Report | October 2010
24
Figure 13: Trade-weighted annual percentage change in South African agr main exports & imports
Source: WTA, Data training week analysis
Another way to display the annual changes is to index them to the staring period and show the
resultant index vales for these cumulative increases. These are shown below in Figure 14, and note
how the increased export prices above import prices around 200 was sufficient to keep that Index
above the import Index over the period. Reconfiguring these graphs for US dollars instead of rand is
likely to show a different overall figure but the same relativities.
Figure 14: Cumulative changes to South African export and import prices for main products.
Source: WTA, Data training week analysis

An Assessment of South Africa’s Agricultural Trading Environment
with select trading regimes
Report | October 2010
25
Table 7 shows the main import and export lines that comprise these top-20 lines for South Africa as
ranked at 2009 and their associated annual % changes in prices 1996 to 2009. Again, note that this
analysis is a first and last year comparison, so the variability in the data will not be apparent.
Table 7: Main trade lines and associated annual % changes in prices 1996 to 2009
Exports Change % Imports Change %
Wines 6.4% Rice 9.7%
Maize 7.4% Soya Bean Cake 8.3%
Oranges 6.8% Wheat 6.9%
Grapes 7.3% Palm Oil 8.0%
Raw Sugar 6.9% Whiskies 9.8%
Apples 16.9% Tobacco, 8.7%
Wines Including Fort 6.4% Chicken 6.1%
Wool 7.8% Beer 4.3%
Pears 8.8% Food Preps Nes 8.6%
Refined Sugar 5.9% Sunflower Oil 7.5%
Tobacco 1.9% Malt 7.3%
Ethyl Alcohol 4.6% Soya-Bean Oil 5.0%
Food Preps Nes 6.6% Offal 1.6%
Grapefruit 2.5% Kidney Beans 7.4%
Cigarettes -2.8% Cotton 2.7%
Lemons Soya-Bean Oil 9.2%
Mandarins 9.7% Pork 4.7%
Soya Beans 2.4% Tea 6.8%
Peaches 7.9% Coffee 5.3%
Water 7.6% Confectionery 1.0%
Source: WTA, Data training week analysis
Overall, initial analysis suggests that import prices have risen above export prices for the top-20
South African trade lines over the period. Thus, based upon this analysis, the terms of trade have
gone against the Republic.
References
Mmatlou Kalaba, Ron Sandrey and Dirk Ernst van Seventer, 2005. Analysis of Trade between South
Africa and the EU and a Preliminary Attempt to Examine the Impact of the EU-SA FTA on Trade. Trade &
Industrial Policy Strategies (TIPS), January 2005
- - -