an assessment of demand for rural intercity transportation
TRANSCRIPT
An Assessment of Demand for Rural Intercity Transportation Services in a
Changing Environment
Jeremy MattsonDel Peterson
David RipplingerWilliam Thoms
Jill Hough
UGPTI Transportation Seminar SeriesJanuary 28, 2010

Overview Changing environment Rural intercity travel Factors affecting mode choice Survey Stated preference
Multinomial logit model Traveler attitudes Conclusions

Changing Environment Volatile gas prices Increase in air fares in 2008 Recession Government policy Aging population VMT has declined Transit ridership is up
ObjectiveDetermine the attitude of would-be
passengers in their choice of mode and the factors determining their choice in rural and small urban areas.
Factors Affecting Mode ChoiceMode characteristics Individual characteristics Trip characteristics
Factors Affecting Mode ChoiceMode characteristicsCost Travel time Service frequency Transfer AccessComfort and convenience

Elasticities of Travel Demand with respect to Fuel Price
Study Fuel DemandVehicle Miles
Traveled Time FrameShort-run Long-run Short-run Long-run
Goodwin (1992) -0.27 -0.71 -0.16 -0.33 1972-1987Espey (1998) -0.26 -0.58 1966-1997Graham and Glaister (2002) -0.25 -0.77 -0.15 -0.31 1966-2000
Goodwin (2004) -0.25 -0.64 -0.1 -0.29 1929-1998Brons et al.(2006) -0.53 -0.39 1974-1999
Hughes et al. (2006)
-0.21 to -0.34 1975-1980
Hughes et al. (2006)
-0.0034 to -0.077 2001-2006

Elasticities of Transit Demand with respect to Gasoline PriceStudy Elasticity Study AreaAgthe & Billings (1978) 0.42 Tucson, AZ city bus
systemDoi & Allen (1986) 0.11 New Jersey rail line
Luk & Hepburn (1993) 0.07 Australia
Hensher (1997) 0.02 – 0.12 Newcastle, Australia buses
TRACE (1999) 0.16 short-run0.12 long-run
Review of European studies
Storchmann (2001) 0.07 Germany
Currie & Phung (2007) 0.04 (bus) 0.12 (all transit)
United States
Litman (2007) 0.05 – 0.15 short-run0.2 – 0.4 long-run
Review of literature
Mattson (2008) 0.1 – 0.2 long-run United States

Factors Affecting Mode Choice Individual characteristics Income AgeGenderHabits Attitudes

Factors Affecting Mode Choice Trip characteristics Trip purpose Business or personal
Trip distance Size of travel party

Survey Focus on regional, intercity travel North Dakota and NW/West Central Minnesota Age 18+ Mail survey 2,000 sent 237 responses received (12.5% response rate)
4 Sections Current travel Stated preference Attitudes Demographics

Survey Area
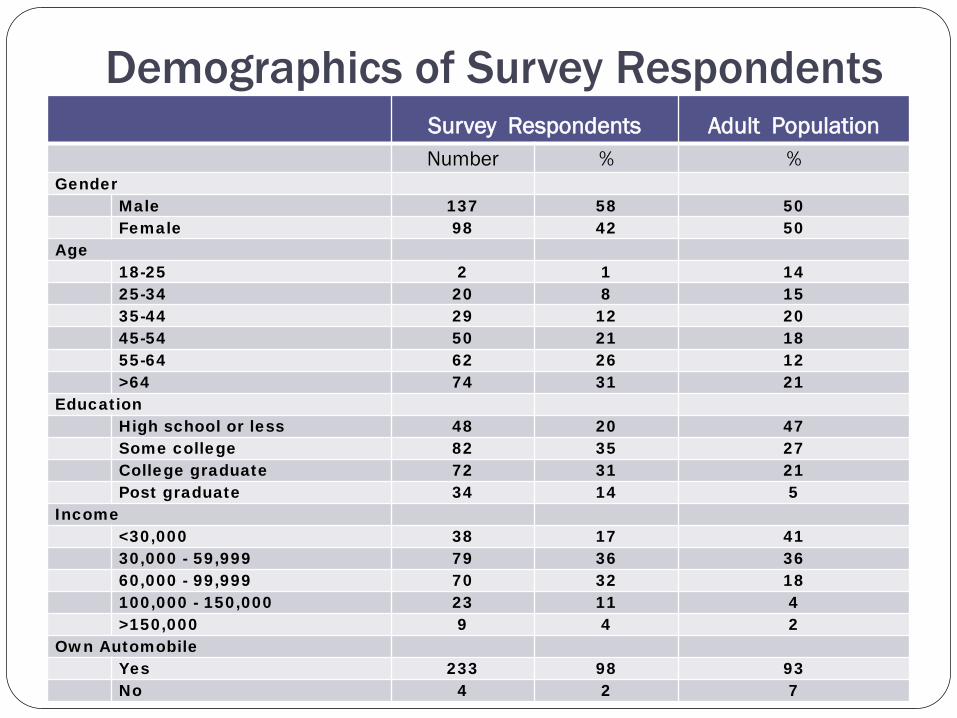
Demographics of Survey RespondentsSurvey Respondents Adult PopulationNumber % %
GenderMale 137 58 50Female 98 42 50
Age18-25 2 1 1425-34 20 8 1535-44 29 12 2045-54 50 21 1855-64 62 26 12>64 74 31 21
EducationHigh school or less 48 20 47Some college 82 35 27College graduate 72 31 21Post graduate 34 14 5
Income<30,000 38 17 4130,000 - 59,999 79 36 3660,000 - 99,999 70 32 18100,000 - 150,000 23 11 4>150,000 9 4 2
Own AutomobileYes 233 98 93No 4 2 7

Stated Preference (SP) Survey Choice set Trip characteristics Trip distance Personal or business Alone or group
Five alternatives Automobile Air Bus Train Van
Mode attributes Travel time Price Service frequency Transfer requirement

Mode Alternatives Automobile - Personal car, sport-utility vehicle, light-
duty truck, van or other vehicle that is driven by you or a member of your party.
Air - Commercial or private airplane. Bus - Bus that provides passenger service between
cities, such as Greyhound or Jefferson Lines. Train - Passenger train such as Amtrak. Van -Passenger van service operated by a private
company or public agency, requiring payment to ride.

Mode AttributesFactor Modes Levels
Price Bus, train, vanLow ($0.16/mile), high ($0.2083/mile)
Air Low ($250/trip), high ($500/trip)
AutomobileLow ($2/gal), medium ($4/gal), high ($6/gal)
Speed Bus, train, van Slow (48 mph), fast (60 mph)
Air Slow, fast
Automobile All travel at 60 mph
Transfer Air, bus, train, van Yes, no
Frequency Air, bus, train, vanOnce per day, every eight hours, every two hours

Example Stated Preference Survey Question
You are making a 60-mile personal trip with family and friends. The price of gas at the pump is $2 per gallon. Please consider the following alternatives and select the one that you would use to make the trip.
Mode Train Air Bus Automobile Van
Travel Time 75 minutes 30 minutes 1 hour 1 hour 75 minutes
Transfer No No Yes No No
Price$12.50/person
$500/person
$10/person $6
$10/person
Frequency Every 2 hoursOnce per
dayEvery 8 hours -
Every 2 hours
o o o o o

Stated Preference Survey Each survey respondent given 6 choice sets. 1,359 SP responses received. Mode of choice 80.4% Automobile 6.7% Van 5.4% Rail 4.0% Air 3.5% Bus
Results vary by cost, distance, income, trip purpose, age, gender.

Survey Results: Mode Share Data from the Stated Preference Survey, Overall and for Differing Levels of Gasoline Price and Income
Auto (%)
Air (%)
Bus (%)
Train (%)
Van (%)
Total 80 4 3 5 7Price of Gasoline
$2/gallon 87 5 1 3 3$4/gallon 83 4 3 5 5$6/gallon 70 2 7 8 12
Income<30,000 71 2 7 9 1130,000-59,999 81 4 4 5 760,000-99,999 81 5 3 5 7>100,000 85 5 1 5 4

Survey Results: Mode Choice Results from Stated Preference Survey, by Distance and Price of Gasoline (%)
Auto Air Bus Train Van30 miles
$2/gallon 96 0 1 0 4$4/gallon 89 0 5 3 3$6/gallon 77 0 7 8 9
60 miles$2/gallon 91 0 1 3 5$4/gallon 90 0 0 2 8$6/gallon 74 1 3 9 14
240 miles$2/gallon 90 1 0 6 4$4/gallon 85 0 3 5 7$6/gallon 72 1 9 6 12
480 miles$2/gallon 73 20 2 4 2$4/gallon 62 21 4 9 4$6/gallon 61 7 7 11 14
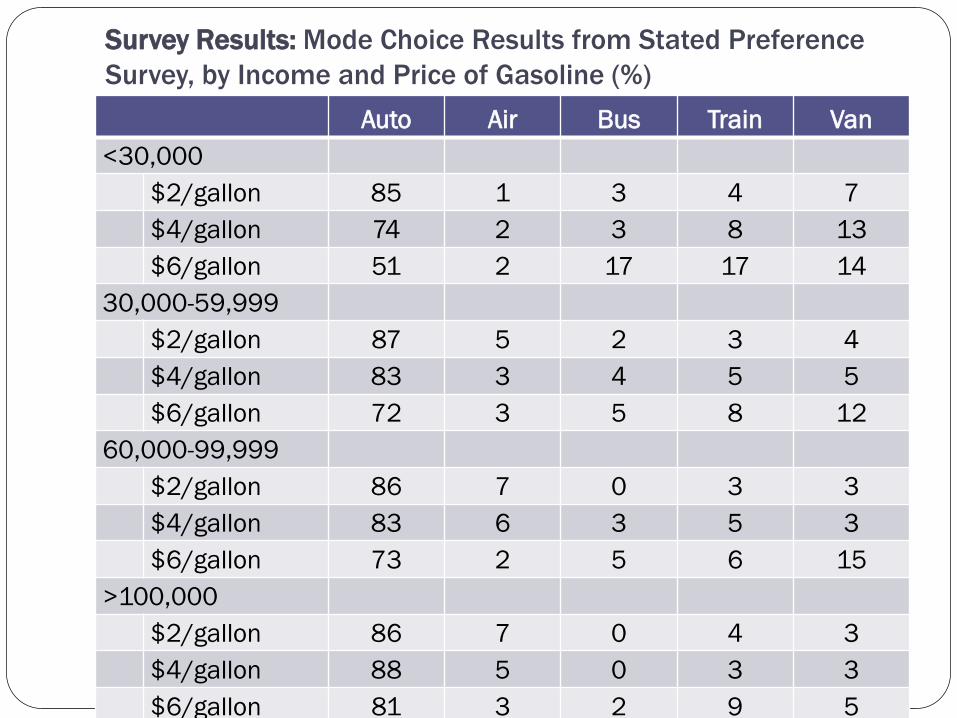
Survey Results: Mode Choice Results from Stated Preference Survey, by Income and Price of Gasoline (%)
Auto Air Bus Train Van <30,000
$2/gallon 85 1 3 4 7$4/gallon 74 2 3 8 13$6/gallon 51 2 17 17 14
30,000-59,999$2/gallon 87 5 2 3 4$4/gallon 83 3 4 5 5$6/gallon 72 3 5 8 12
60,000-99,999$2/gallon 86 7 0 3 3$4/gallon 83 6 3 5 3$6/gallon 73 2 5 6 15
>100,000$2/gallon 86 7 0 4 3$4/gallon 88 5 0 3 3$6/gallon 81 3 2 9 5
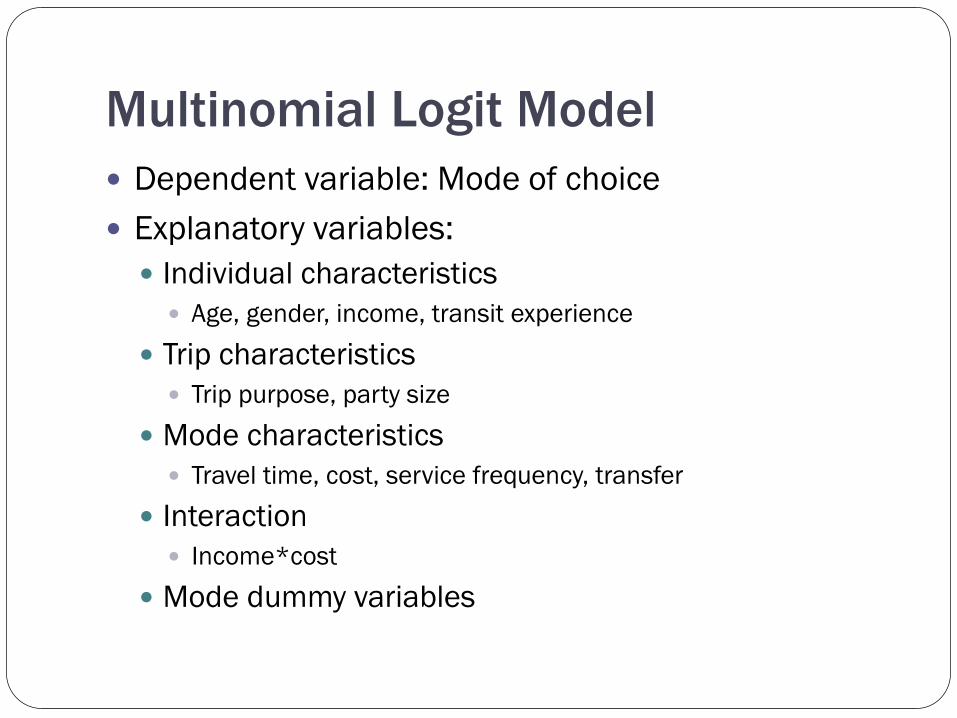
Multinomial Logit Model Dependent variable: Mode of choice Explanatory variables: Individual characteristics Age, gender, income, transit experience
Trip characteristics Trip purpose, party size
Mode characteristics Travel time, cost, service frequency, transfer
Interaction Income*cost
Mode dummy variables

Results from Multinomial Logit ModelIndependent variable Parameter estimate Odds ratio
Auto 1.40** 4.05
Age*Air -0.38** 0.69
Male*Auto 0.557** 1.74
Income*Auto 0.255* 1.29
Alone*Air 0.950** 2.58
Personal*Auto 0.465* 1.59
Personal*Air -0.862** 0.42
Transit Exp*Auto -0.652** 0.52
Travel Time -0.426** 0.65
Travel Price -0.0160** 0.984
Travel Price*Inc2 0.00866** 1.009
Travel Price*Inc3 0.00991** 1.010
Travel Price*Inc4 0.0115** 1.012
Transfer Not significant
Frequency Not significant*, ** denote significance at 10% and 5% levels, respectively
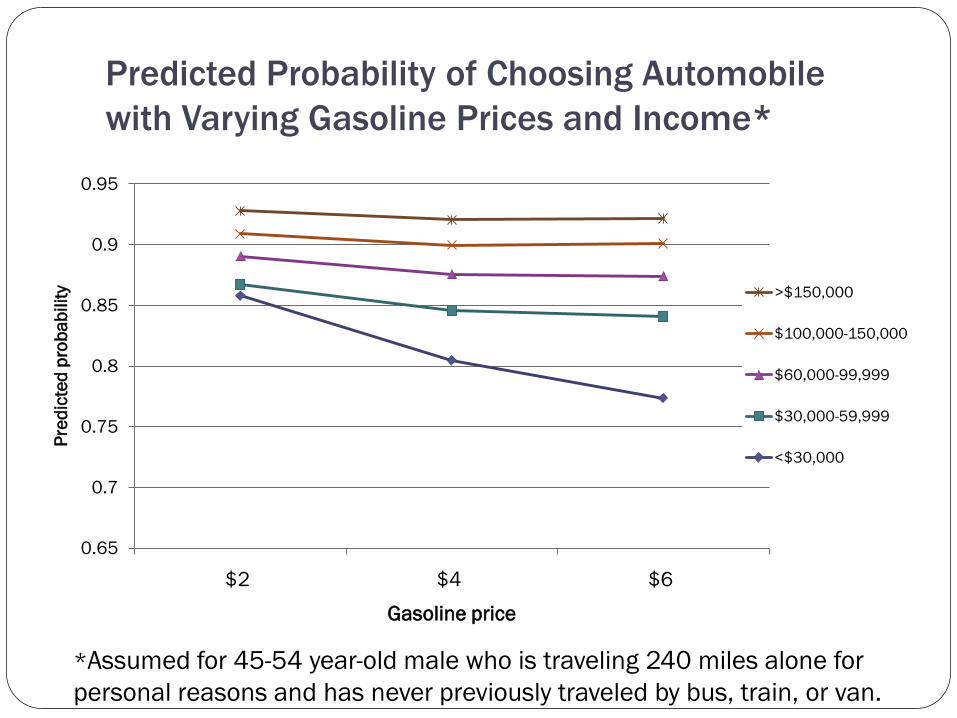
Predicted Probability of Choosing Automobile with Varying Gasoline Prices and Income*
0.65
0.7
0.75
0.8
0.85
0.9
0.95
$2 $4 $6
Pred
icte
d pr
obab
ility
Gasoline price
>$150,000
$100,000-150,000
$60,000-99,999
$30,000-59,999
<$30,000
*Assumed for 45-54 year-old male who is traveling 240 miles alone for personal reasons and has never previously traveled by bus, train, or van.

Predicted Probability of Choosing Automobile with Varying Gasoline Prices and Income*
0.5
0.55
0.6
0.65
0.7
0.75
0.8
0.85
$2 $4 $6
Pred
icte
d Pr
obab
ility
Gasoline Price
>$150,000
$100,000-150,000
$60,000-99,999
$30,000-59,999
<$30,000
* Assumed for 65+ year-old female who is traveling 240 miles alone for personal reasons and has previously traveled by bus, train, or van.

Predicted Probability of Choosing Air Travel with Varying Age and Income*
0
0.02
0.04
0.06
0.08
0.1
0.12
0.14
0.16
<25 25-34 35-44 45-54 55-64 >64
Pred
icte
d Pr
obab
ility
Age
>$150,000
$100,000-150,000
$60,000-99,999
$30,000-59,999
<$30,000
*Assumed for male traveling alone for personal reasons, low air fare.

Response to Opinion QuestionsAverage Score* Statement
8.2If my travel options are delayed, I want to know the cause and length of the delay.
8.1 It is important to have comfortable seats when I travel.
7.9When traveling, I like to keep as close as possible to my departure and arrival schedules.
7.7 A clean vehicle is important to me.
7.6 I prefer a travel option that has a predictable travel time.
6.7 Having a stress-free trip is more important than reaching my destination quickly.
6.5 I would like to make productive use of my time when traveling.
6.3 I would change my form of travel if it would save me some time.
6.0 Having privacy is important to me when I travel.
6.0 I avoid traveling at certain times because it is too stressful.
5.8 I would rather do something else with the time that I spend traveling.
5.7 It’s important to be able to change my travel plans at a moment’s notice.
5.6 When traveling, I like to talk and visit with other people.
5.4 I prefer to make trips alone, because I like the time to myself.
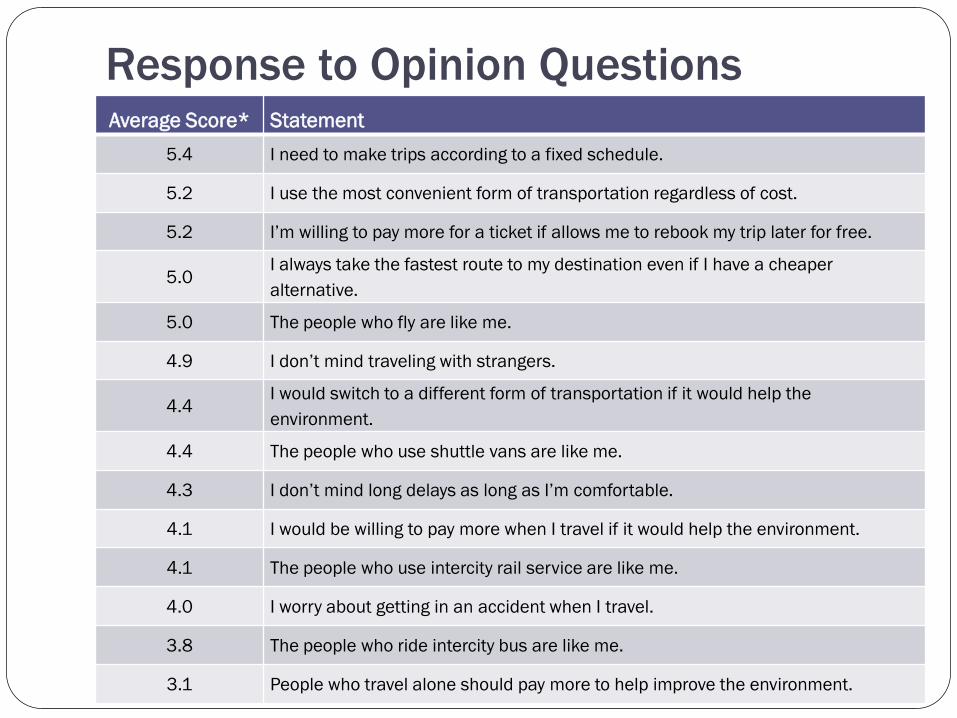
Response to Opinion QuestionsAverage Score* Statement
5.4 I need to make trips according to a fixed schedule.
5.2 I use the most convenient form of transportation regardless of cost.
5.2 I’m willing to pay more for a ticket if allows me to rebook my trip later for free.
5.0I always take the fastest route to my destination even if I have a cheaper alternative.
5.0 The people who fly are like me.
4.9 I don’t mind traveling with strangers.
4.4I would switch to a different form of transportation if it would help the environment.
4.4 The people who use shuttle vans are like me.
4.3 I don’t mind long delays as long as I’m comfortable.
4.1 I would be willing to pay more when I travel if it would help the environment.
4.1 The people who use intercity rail service are like me.
4.0 I worry about getting in an accident when I travel.
3.8 The people who ride intercity bus are like me.
3.1 People who travel alone should pay more to help improve the environment.

Analysis of Attitudes and Mode ChoiceStatement Mode Preference
Productive use of time. More likely to choose air.
Prefer predictable travel time. Less likely to choose air.
Willingness to travel with strangers. More likely to alternatives to auto.
Concerned about being able to change travel plans at a moment’s notice.
More likely to choose auto.Much less likely to choose air.
Concerned about having comfortableseats
Much less likely to choose air.
More concerned about having a stress-free trip than with reaching destinationquickly.
Less likely to choose auto.More likely to choose van.
Concerned with cleanliness of vehicles. More likely to choose auto.
People who ride a given mode are like me. More likely to choose that given mode.
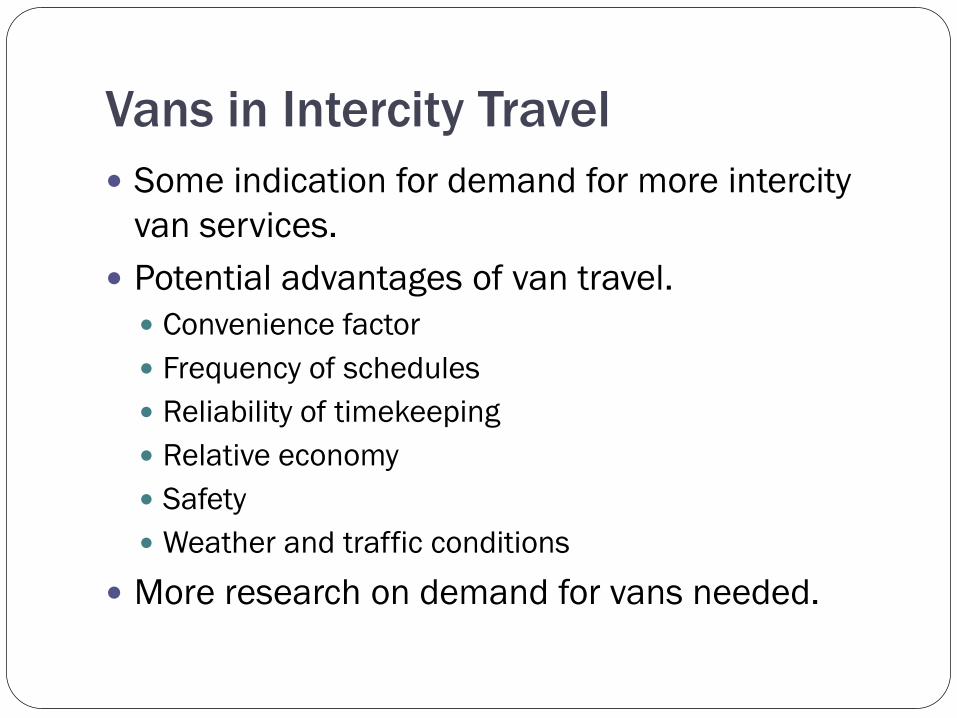
Vans in Intercity Travel Some indication for demand for more intercity
van services. Potential advantages of van travel. Convenience factor Frequency of schedules Reliability of timekeeping Relative economy Safety Weather and traffic conditions
More research on demand for vans needed.

Concluding Remarks At higher gas prices, there is an increase
in demand for alternative modes, especially among those of lower income.
An aging population is more likely to choose intercity train, van, or bus service than air for regional travel.
Previous transit experience increases likelihood of choosing intercity train, bus, or van.

Contact Info
Jeremy MattsonAssociate Research FellowSmall Urban and Rural Transit CenterUpper Great Plains Transportation InstituteNorth Dakota State [email protected]