an approximate pit optimization methodology suited to … · an approximate pit optimization...
TRANSCRIPT

Paper 305, CCG Annual Report 13, 2011 (© 2011)
305-1
An Approximate Pit Optimization Methodology Suited to the SLM
Framework
Miguel A. Cuba and Clayton V. Deutsch
The calculation of the ultimate-pit is the base for designing the life-of-mine plan of a surface mining project. In
industry, two widely popular methodologies to calculate the ultimate-pit limits are Lerchs and Grossmann and
Floating Cone. Lerchs and Grossmann delivers optimal results since it is based on numerical optimization. Floating
Cone is based on a heuristic algorithm and delivers an approximation of the optimal results. The advantage of the
Floating Cone methodology is that it is less computationally expensive. In this paper, an alternative methodology
based on a modified version of the Floating Cone methodology is presented. This methodology performs better
than Floating Cone without compromising the computation time. A toolbox based on this new methodology that is
suited to be implemented in the Simulated Learning Model framework is presented in this paper. In the comparison
section, an example that consists of 25 unconditional realizations is used to show that this new methodology
provides a better approximation to the optimal results than the Floating Cone methodology.
1. Introduction
In surface mining, the base of a mining plan consists of the calculation of the ultimate-pit. The ultimate pit is used
to calculate the mineable reserves of a deposit and is the base to design a life-of-mine plan of a project. Since the
early work of Lerchs and Grossmann (1965), mathematical optimization techniques have been widely implemented
to calculate ultimate-pits that maximize the revenue of surface mining projects. Suboleski, Cameron, and Albert
(2002), and Gaupp (2008) reviewed and grouped in six categories most of the relevant techniques used to
calculate ultimate-pit limits.
Up to date, the Lerchs and Grossmann (LG) algorithm based on graph theory seems the most popular
technique implemented in industry. Since LG is based on mathematical optimization techniques, it delivers
numerically optimal results for the deposits evaluated. Other alternatives to mathematical optimization such as
heuristic techniques are also successfully implemented in industry. The most representative of these is the
floating-cone (FC) technique, also known as moving-cone or dynamic-cone-heuristic, which was proposed by Pana
(1965). However, Kim, Cai, and Meyer (1988) presented it as a technique initially developed by Kennecott Copper
in 1961. These techniques are non-optimal. Despite its shortcomings, FC is very popular in industry due to its
simplicity and reduced computation time required. Being LG and FC very popular in industry, these two
methodlogies were widely discussed and analyzed by many authors such as Hustrulid and Kuchta (1998) and
Whittle & Whittle (1999). In industry, LG and FC are implemented in many comercial software packages such as
MineSight®, Vulcan®, among others.
In this paper, a modified version of the FC methodology, named indexed search floating cone (ISFC), is
presented. In the ISFC methodology, the cones are evaluated by implementing an indexed search algorithm. The
goal of the ISFC is to provide a practical tool that can be implemented as part of simulation learning model (SLM)
framework. The ISFC methodology provides a better approximation to the optimal revenues than FC without
compromising the computation time. ISFC also calculates the corresponding 'best case' mining sequence of the
ultimate-pit, which despite being non-operational, serves as referential to design a long term mining sequence.
A brief summary of the conventional FC is presented in the next section. In the following section, the
modular structure of the ISFC methodology and the indexed search algorithm are discussed. In the example
section, a comparison of ISFC versus LG and FC based on 25 realizations of a 3D model is discussed. Along with this
paper, a toolbox of four programs to implement ISCF are presented.
2. Conventional Floating Cone (FC)
The FC algorithm consists of extracting a series of cones of positive revenue from the deposit. The cones are
selected based on their positive contribution to the overall revenue to the ultimate-pit. During the
implementation, the cones are evaluated following specified paths. The resulting ultimate-pit is the combination of
all the cones extracted. However, the overall revenue of the ultimate-pit varies depending on the path followed.
The implementation of FC may also consider the use of multiple passes in additional specified directions. In each

Paper 305, CCG Annual Report 13, 2011 (© 2011)
305-2
additional pass, the algorithm keeps searching remaining cones with positive revenue. Berlanga, Cardona, and
Ibarra (1989) presented a formal revision of FC for programming purposes.
The FC algorithm has some implementation issues that have been widely reported and discussed by many
authors. Hustrulid & Kuchta (1998) classified the problems in three categories:
1) Missing combination of profitable blocks: This problem is due to the individual evaluation of cones.
Mining regions with positive revenue that consist of the combination of several cones may appear non-
economic if the cones are evaluated independently. Whittle and Whittle (1999) called this problem
‘Ignoring co-operation – mining too little’.
2) Extending the ultimate pit beyond the optimal limits: The problem occurs when large cones are mined.
The geometric configuration of mining regions tend to be dominated by these cones, thus including extra
waste blocks. Whittle and Whittle (1999) called this problem ‘Mining too much – pulling up the waste’
3) Combination of the first two problems. During the calculation of the ultimate-pit, due to the various
geologic characteristics of the deposit and the initial paths set, the regions extracted will be affected by
the first two problems combined.
In the next sections, the first two problems will be referred to as ‘problem 1’ and ‘problem 2’ respectively.
Despite its shortcomings, FC is very popular and is widely implemented in industry. The main advantages of FC are
(Hustrulid & Kuchta, 1998): The method is easy to understand because it is based on manual techniques, FC is
computationally simple to implement, FC can be implemented with generalized pit slopes, and FC provides usable
and sufficiently accurate results for mine planning. Besides, the reduced computation time required by FC with
respect to numerical optimization techniques such as LG.
3. Indexed Search Floating Cone (ISFC)
The ISFC methodology relies on an iterative algorithm based on a modified version of the conventional FC. ISFC is
able to calculate the ultimate-pit limits and the 'best case' mining sequence. ISFC comprises three main modules:
A) calculation of mineable limits, B) calculation of preliminary ultimate-pit limits, and C) calculation of the 'best-
case' mining sequence. The first module identifies the blocks that cannot be mined due to the limits of the project
and geotechnical constraints. The mineable limits narrow the search region in the deposit to calculate the
ultimate-pit, thus reducing the computation time of the algorithm. The second module calculates the preliminary
ultimate-pit limits. Despite this algorithm tends to deliver better results than FC, the resulting preliminary ultimate-
pit limits still has problems typical of the FC algorithm, which reduce the overall revenue. The ultimate-pit is
calculated after refining the preliminary ultimate-pit. The last module calculates the ‘best case’ mining sequence of
the ultimate pit. Although this mining sequence is not operational, this information is used to evaluate and outline
the operative mining sequence. A modified version of this module is used to refine the preliminary ultimate-pit to
calculate the ultimate pit-limits.
Unlike FC, where the search and extraction of cones is done following specific directions, ISFC is based on
a search and extraction (SE) algorithm. The SE algorithm consists of three steps: 1) build an inventory of available
cones, 2) target a candidate cone, and 3) extract the targeted cone and update the inventory. The inventory of
available cones is built by indexing the cones that can be extracted from the deposit within some specified limits.
The search process of the candidate cone is done by evaluating all the cones in the inventory that satisfy a
specified condition, e.g. maximum revenue. The candidate cone is extracted from the deposit. As a consequence,
the number of blocks of the surrounding cones is reduced. The SE algorithm identifies the affected cones and
updates the inventory for the next iteration. The details of the three main modules and their interaction with the
SE algorithm are discussed in the next sections.
2.1. Module 1: Mineable Limits
This module identifies the blocks that cannot be extracted from the deposit due to the limits of the project and
geotechnical restrictions. The limits of the project restrict the region where the mining operations can take place.
The set of geotechnical constraints, such as minimum pit slope, restricts the region below the limits of the project
that cannot be mined regardless of the economic value. The input information of this module consists of the initial
topographic surface, the limits of the project, and the mining geometric constraints. In Figure 1, two vertical cross-
sections of the mineable limits of a deposit are presented. The black cells represent the blocks that cannot be

Paper 305, CCG Annual Report 13, 2011 (© 2011)
305-3
mined regardless of their economic metal content. The gray cells represent the mineable region of the deposit
below the surface where the ultimate pit and its corresponding mining sequence are calculated.
The algorithm in this module searches and extracts all the cones that satisfy the geometric conditions
such as the overall pit slope and the minimum radius of the mining base. To satisfy the condition to not to mine
beyond the limits of the project, the cones with blocks below the surface that expand beyond the vertical
projection of the limits are rejected. The mineable limits consist of all the blocks that were not extracted by the
algorithm. Due to the simplicity of the algorithm, the computational time required is very small compared to
identifying these blocks during the calculation of the ultimate pit.
As part of the ISFC methodology, the mineable limits narrow the search region to calculate the ultimate-
pit. During the implementation of the SLM approach, this module helps in the evaluation of additional drilling by
identifying sampling regions that are not relevant to the mine plan. The mineable limits can be also implemented
along with other approaches such as FC or LG to reduce the computation time.
2.2. Module 2: Preliminary ultimate pit limits
This module calculates preliminary limits of the ultimate pit, which are later refined to outline the ultimate pit
limits. The input information of this module is the proportion of blocks below the initial surface, the economic
model of the deposit, the mineable limits, and the mining geometric constraints. The calculation of the preliminary
limits consists of an iterative process, where the SE algorithm targets cones with the largest revenue. The
algorithm stops when there are no more cones in the deposit with positive revenue. This type of search reduces
the impact of problem 1 of the FC approach. However, this algorithm still suffers from being affected by problem
2, since at the beginning of the search process, larger revenues are usually present in cones of large volumes. In
terms of computation time, extracting cones with large volume speed up the algorithm computation time because
it rapidly reduces the amount of remaining blocks in the deposit.
As occurs in problem 2, the use of large volume cones reduces the flexibility in extracting complex
geometric mining regions because the geometry of the mining cuts is mainly dominated by one large single cone.
To deal with this problem, a second algorithm is implemented to refine the preliminary limits calculated in this
module. The refining algorithm is based on a modified version of the 'best case' mining sequence module. This
module is more computationally expensive than the calculation of the preliminary ultimate pit limits module,
because several geometric configurations of mining cuts that aim to identify the regions that do not contribute to
the overall revenue are evaluated. The details of this module are discussed in the next section.
In Figure 2, the black blocks represent the ultimate pit limits, and the gray blocks represent the region
that is within the preliminary limits but is rejected in the refining process. The inclusion of the gray blocks as part
of the ultimate pit leads to a reduction of the overall revenue of the project.
Unlike the conventional FC approach which extracts cones in specified directions and requires multiple
passes to increment its efficiency, the preliminary ultimate pit algorithm searches and extracts cones based on a
unique indexed search, thus requiring only one pass.
2.3. Module 3: 'Best case' mining sequence
This module calculates the 'best case' mining sequence of extraction of an ultimate pit. One popular approach
consists of calculating several ultimate pit limits by varying metal prices (Whittle & Whittle, 1999). The best case
mining sequence is not often operational but along with the 'worst case' mining sequence they set referential
values to design mining phases or pushback aimed to maximize the revenue of the project (Whittle & Whittle,
1999). Unlike the conventional approach, where several calculations of the ultimate-pit are required, the algorithm
consists of scheduling the total ore tonnage and maximizing the extraction of each of the proportions.
Since the mine sequencing conditions are based on scheduling ore tonnage in each period, tonnage and
material type information are required as input information in this module, complementary to the information
used in the preliminary ultimate pit limits calculation. The number of periods is obtained by dividing the tonnage of
ore material in the ultimate pit by the targeted ore tonnage per period parameter. The mining limits of each period
are calculated sequentially. The calculation of the mining limits of each period consists of evaluating different
geometric configurations of mining cuts that satisfy the ore tonnage constraint. Among all the alternatives, the
mining cut that results in the maximum revenue is selected as the mining limits for the current period. This
evaluation process is repeated until the ultimate pit is completely mined. If the remaining ore tonnage in the
Paper 305, CCG Annual Report 13, 2011 (© 2011)
305-4
ultimate pit is smaller than the ore target, the remaining ultimate pit is considered as the mining limits of the last
period. This condition is valid because the ultimate pit was calculated under the mining geometric constraints.
In each period, the SE algorithm targets the cone with the maximum revenue under the constraint that
the accumulated ore tonnage cannot exceed the maximum ore tonnage parameter. However, as in the case of the
preliminary ultimate pit limits, the result may be influenced by the problem 2 of the FC approach. To overcome this
problem, a fragmentation parameter is implemented. This parameter controls the maximum ore tonnage of the
cones during the search process. Any cone which ore tonnage is larger than the limiting parameter is rejected
regardless of its revenue. This condition makes the mining limits of the current period is formed by cones of
smaller mass than of the initial case. Because of this, this reduction in the mass of the cones, the SE algorithm is
referred to as fragmented SE. The fragments are defined in terms of the reduced portions of ore tonnage in the
cones with respect to the initial case. For example, if the ore target in each period is 1000MT, using a
fragmentation parameter equal to 2 means the maximum limit of ore tonnage in each cone during the search
process is 1000MT/2 = 500MT.
Although a large number of fragments may result in larger revenues, the resulting configuration of the
mining limits may be unrealistic if the extracted cones are spread all over the deposit. It is recommended to verify
the configuration of the mining cuts for a large number of fragments. Besides, the computation time increases
proportionally with number of fragments analyzed.
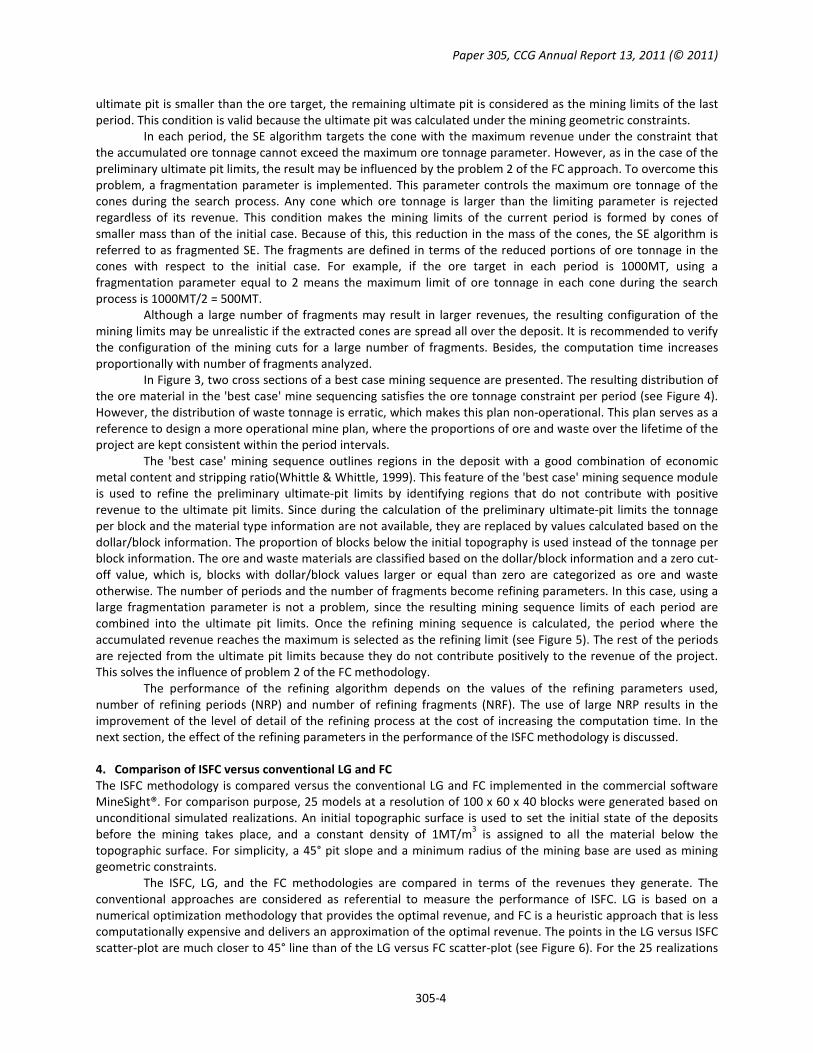
In Figure 3, two cross sections of a best case mining sequence are presented. The resulting distribution of
the ore material in the 'best case' mine sequencing satisfies the ore tonnage constraint per period (see Figure 4).
However, the distribution of waste tonnage is erratic, which makes this plan non-operational. This plan serves as a
reference to design a more operational mine plan, where the proportions of ore and waste over the lifetime of the
project are kept consistent within the period intervals.
The 'best case' mining sequence outlines regions in the deposit with a good combination of economic
metal content and stripping ratio(Whittle & Whittle, 1999). This feature of the 'best case' mining sequence module
is used to refine the preliminary ultimate-pit limits by identifying regions that do not contribute with positive
revenue to the ultimate pit limits. Since during the calculation of the preliminary ultimate-pit limits the tonnage
per block and the material type information are not available, they are replaced by values calculated based on the
dollar/block information. The proportion of blocks below the initial topography is used instead of the tonnage per
block information. The ore and waste materials are classified based on the dollar/block information and a zero cut-
off value, which is, blocks with dollar/block values larger or equal than zero are categorized as ore and waste
otherwise. The number of periods and the number of fragments become refining parameters. In this case, using a
large fragmentation parameter is not a problem, since the resulting mining sequence limits of each period are
combined into the ultimate pit limits. Once the refining mining sequence is calculated, the period where the
accumulated revenue reaches the maximum is selected as the refining limit (see Figure 5). The rest of the periods
are rejected from the ultimate pit limits because they do not contribute positively to the revenue of the project.
This solves the influence of problem 2 of the FC methodology.
The performance of the refining algorithm depends on the values of the refining parameters used,
number of refining periods (NRP) and number of refining fragments (NRF). The use of large NRP results in the
improvement of the level of detail of the refining process at the cost of increasing the computation time. In the
next section, the effect of the refining parameters in the performance of the ISFC methodology is discussed.
4. Comparison of ISFC versus conventional LG and FC
The ISFC methodology is compared versus the conventional LG and FC implemented in the commercial software
MineSight®. For comparison purpose, 25 models at a resolution of 100 x 60 x 40 blocks were generated based on
unconditional simulated realizations. An initial topographic surface is used to set the initial state of the deposits
before the mining takes place, and a constant density of 1MT/m3 is assigned to all the material below the
topographic surface. For simplicity, a 45° pit slope and a minimum radius of the mining base are used as mining
geometric constraints.
The ISFC, LG, and the FC methodologies are compared in terms of the revenues they generate. The
conventional approaches are considered as referential to measure the performance of ISFC. LG is based on a
numerical optimization methodology that provides the optimal revenue, and FC is a heuristic approach that is less
computationally expensive and delivers an approximation of the optimal revenue. The points in the LG versus ISFC
scatter-plot are much closer to 45° line than of the LG versus FC scatter-plot (see Figure 6). For the 25 realizations
Paper 305, CCG Annual Report 13, 2011 (© 2011)
305-5
used in this example, with respect to the optimal revenues, the gap of the FC revenues is larger than the gap of the
ISFC approach. In terms of revenue, the ISFC methodology, being a heuristic approach, provides a better
approximation of the optimal revenue than FC.
To standardize the measure of performance of the ISFC methodology, for each realization, the
proportions of both the FC and ISFC with respect to the LG revenue are compared (see Figure 7). On average, ISFC
approaches better to LG than FC. The average proportion of ISFC is 97.4% compared to 92.1% of FC. ISFC also
provides a smaller variability of the proportions of revenues compared to FC.
As discussed in the previous section, the performance of ISFC depends on the two refining parameters, 1)
number of refining periods and 2) number of refining fragments. Of these two, NRP is more important, since it
defines the degree of detail of the cumulative revenue curve to identify the refining limit. In the previous
comparison, ISFC was ran using 20 refining periods and 3 refining fragments. To show the effect of the NRP
parameter in the implementation of ISFC, the resulting revenues for two values of this parameter, 10 and 20, are
compared versus the FC revenues. The comparison is made based on the proportions of the FC revenue with
respect ISFC. On average, for the case of 10 refining periods, the FC revenues approach at 96.35% to ISFC (see
Figure 8 - left), and for the case of 20, FC approaches at 94.52% to ISFC (see Figure 8 - right). In the case of 10
refining periods, FC outperforms ISFC in two realizations by 1.19% and 1.40%. In the case of 20 refining periods,
ISFC outperforms FC in all the realizations.
To show the effect of increasing the NRP parameter in the performance of the ISFC approach, six NRP
parameters were tested, from 10 to 20 at intervals of 2. In Figure 9, the proportion of revenues of ISFC with
respect to LG with different number of NRP are presented in the box plots labelled from ISFC10 to ISFC20, where
the last two digits denote the value of the NRP parameter used. For comparison purpose, the proportion of
revenues of the preliminary ultimate pit limits is presented in the box plot labelled as Pre-ISFC. On average, even
the preliminary ultimate pit of the ISFC approach performs better than FC, however, the variability of the revenues
is higher. The implementation of the refining algorithm results in an improvement in the performance of the ISFC
approach. Starting the NRP parameter at 10 refining periods, that is, dividing the preliminary ultimate pit limits in
10 parts, ISFC starts giving better results than FC both in average and variability terms. By incrementing the NRP
parameter up to 20, ISFC shows a systematic improvement in its performance (see Figure 9). The effect in the
improvement of the performance of ISFC is not linear. It slowly approaches to the optimal revenue and reduces
the variability of the results (see Figure 10). For the 25 realizations, a preferable value for the NRP parameter is 14,
since it balances the increment in the average of the revenues and the reduction in the variability of the results.
Beyond this point, incrementing the NRP parameter does not produce significant improvement in the results.
In terms of the computation time required, the ISFC approach using 20 refining periods is slightly faster
than FC but much faster than LG (see Figure 11). The FC approach was implemented using five passes, which
means that algorithm has to scan the deposit in different directions five times. The computation time of LG is quite
variable. Depending of the spatial configuration of the ore bodies in the deposit, it would require more time to the
algorithm to find the optimal solution. It is also possible the LG approach can find the solution faster than both
ISFC and FC, although this occurs only in a few cases in the example presented.
One of the problems that can be identified during the implementation of ISFC is the tuning of the refining
parameters. Ideally, it would be recommended to verify different configurations of the refining parameters, as
discussed in this section. However, such tuning process would require running ISFC several times, thus increasing
the overall computation time. To overcome this problem it is recommended to run ISFC with a large NRP, for
example 20 or 30. The validation of the selected parameters could be done with one or two more runs while
increasing NRP.
5. ISFC Toolbox
As part of the implementation of the ISFC methodology in the SLM framework, four programs are presented. The
details of their parameter files described in the Appendix section.
TOPOMODEL: This program calculates the proportions of blocks below a surface. The input data consists
of a 2D map with topographic elevations. The output information consists of is a 3D gridded model with
proportions of cells below the input surface.
MINEABLELIMITS: This program calculates the mineable limits of a 3D gridded model based on a
topographic surface. The program considers the limits of the project are the same of the 3D model. The input data

Paper 305, CCG Annual Report 13, 2011 (© 2011)
305-6
consists of a 2D map with topographic elevations. The output information consists of a 3D gridded model, where
the non-mineable blocks are marked with 1, and the rest of the blocks are 0.
ULTIMATEPIT: This program calculates the ultimate-pit limits based on the ISFC methodology. The input
data consists of a 2D map with topographic information, and a 3D gridded model with dollar/block values. The
dollar/block values should be calculated considering the entire block, and not on the proportion below the
topographic surface. The program internally weights the dollar/block values according to the initial topographic
information. The program was designed this way to be able to handle different initial topographic surfaces without
having to calculate the dollar/block values multiple times. The output information consists of a 3D gridded model,
where the blocks within the ultimate-pit limits are marked with 1, and the rest of the blocks are 0. Also, a 2D map
with the topographic information after mining the ultimate-pit limits is provided.
MININGSEQUENCE_BC: This program calculates the 'best-case' mining sequence based on the ISFC
methodology. The input data consists of a 2D map with topographic information, and a 3D gridded model with
dollar/block, block density, and material type information. The dollar/block values should be calculated
considering the entire block. The output information consists of a 3D gridded model. The blocks are marked
according to the period number in which their mining region is scheduled to be mined. Also, a set of 2D maps with
topographic information at the end of each period is provided.
6. Final Remarks
The proposed ISFC is a good alternative to calculate ultimate-pit limits and its corresponding 'best case' mining
sequence. The ISFC methodology provides a better approximation to the optimal results than the conventional FC
methodology. Despite still being a prototype, this good performance, in terms of the results delivered, does not
compromise the computation time required. The ISFC methodology presented in this paper deals with two types
of material, ore and waste. However, the SE algorithm is very flexible and its implementation can be expanded to
deal with complex mining requirements, e.g. scheduling multiple economic metal elements.
The ISFC algorithm has been designed to be implemented as part of the SLM framework. The ISFC toolbox
presented in this paper provides useful information in the implementation of the SLM framework, such as the
mineable limits outline, the evolution of the surfaces through periods. The ISFC toolbox can interact with the
conventional GsLib programs in the implementation of the SLM framework. The SE algorithm is the core of the
ISFC methodology. It relies on indexing of the mineable cone alternatives in the deposit. The allocation in memory
of the indexed information makes the SE algorithm more dependent on memory space and may restrict its
applicability. Alternative indexing algorithms can be implemented to improve the efficiency in memory
management. The ISFC toolbox deals with a generic geometric mining constraint definition for all the deposit.
Dealing with multiple pit slopes based on specified regions, minimum slope/block, or directional minimum slopes is
part of future upgrades of this toolbox.
7. Acknowledgements
Special thanks to Alan Farfán from Tintaya Xstrata Copper for his help in the implementation of the LG and FC
methodologies in the commercial software MineSight®. The results of LG and FC example were presented in the
'comparison versus conventional LG and FC section.
References Berlanga, J. M., Cardona, R., & Ibarra, M. A. (1989). Recursive formulae for the floating cone algorithm. International Journal of
Surface Mining, Reclamation and Environment , 141-150.
Gaupp, M. P. (2008). PhD thesis - Methods for improving the tractability of the block sequencing problem for open pit mining.
Golden: Colorado School of Mines.
Hustrulid, W., & Kuchta, M. (1998). Open Pit Mine Planning and Design. Rotterdam, Netherlands: A. A. Balkema Publishers.
Kim, Y. C., Cai, W., & Meyer, W. L. (1988). Comparison of microcomputer-based optimum pit limit design algorithms. AIME
Transactions , 284.
Lerchs, H., & Grossmann, I. F. (1965). Optimum design of open pit mines. Canadian Institute of Mining Trans. , 17-24.
Osanloo, M., Gholamnejad, J., & Karimi, B. (2007). Long-term open pit mine production planning: A review of models and algorithms.
International Journal of Mining, Reclamation and Environment , 3-35.
Pana, M. (1965). The simulation approach to open-pit design. Short Course and Symposium on Computers and Computer Applications
in Mining and Exploration (pp. ZZ-1 - ZZ-24). Tucson, Arizona: College of Mines, University of Arizona.
Suboleski, S., Cameron, R., & Albert, E. (2002). Mining methods classification system. In H. L. Hartman, SME Mining Engineering
Handbook (pp. 563-597). Littleton, Colorado: Society of Mining, Mettalurgy, and Exporation.
Whittle, J., & Whittle, D. (1999). Optimization in Mine Design. Whittle Programming Pty Ltd.

Paper 305, CCG Annual Report 13, 2011 (© 2011)
305-7
Appendix
A description of the parameter files of the four programs that make up the ISFC toolbox are presented in this
section. The parameter files consist of three sections, the 'input-output' section where the input and output files
are specified, the 'run-options' section where the program parameters are specified, and the 'extra section' where
optional parameters are specified. The 'extra' section is optional. The ISFC programs will consider default values if
this section is missing in the parameter file. The parameters are presented in Figure 12 to Figure 15.
INPUT_TOPO: Filename of the input topographic 2D map.
INPUT_MODEL: Filename of the input 3D gridded model.
OUTPUT_TOPO: Filename of the output topographic 2D map(s). Program MININGSEQUENCE_BC generates
more than one surface.
OUTPUT_MODEL: Filename of the output 3D gridded model.
ID_TOPO: Column id of the topographic data used in INPUT_TOPO.
ID_USDB: Column id of dollar/block data used in INPUT_MODEL.
ID_TONB: Column id of tonnage/block data used in INPUT_MODEL.
ID_MATT: Column id of material type data used in INPUT_MODEL.
CODE_WST: Code of material type that denotes 'waste' material.
XNUM, YNUM, ZNUM: Number of blocks in x, y, and z Cartesian directions.
XINI, YINI, ZINI: Origin of blocks in x, y, and z Cartesian directions.
XSIZ, YSIZ, ZSIZ: Size of blocks in x, y, and z Cartesian directions.
M_BASE: Minimum radius of mining base at the bottom of cones.
M_SLOPE: Minimum pit slope.
ORE_TRG: Ore tonnage target per period.
ORE_TOL: Approximation tolerance of ORE_TRG.
NUM_FRG: Number of fragments of cones.
NUM_REFP: Optional parameter. Number of refining periods. The default value is 10. The
'NUM_PERIODS:' tag is required to identify this parameter in the 'extra' section.
NUM_REFF: Optional parameter. Number of refining fragments. The default value is 3. the
'NUM_FRAGMTS:' tag is required to identify this parameter in the 'extra' section.
Figures
Figure 1: Cross-sections, east-west (top) and north-south (bottom), of mineable limits calculated based on initial
topography and geometric mining constraints

Paper 305, CCG Annual Report 13, 2011 (© 2011)
305-8
Figure 2: Cross sections of blocks marked inside the preliminary ultimate pit (gray cells) and cleaned ultimate pit
(black cells)
Figure 3: Cross-section EW 120 of the best-case sequence phases of the ultimate pit

Paper 305, CCG Annual Report 13, 2011 (© 2011)
305-9
Figure 4: Distribution of ore and waste material per period of 'best case' mine sequencing scenario
Figure 5: Evaluation of cumulative revenues per period to refine preliminary ultimate pit limits
Figure 6: Comparison of revenue performance of FC (left) and ISFC (right) versus LG

Paper 305, CCG Annual Report 13, 2011 (© 2011)
305-10
Figure 7: Comparison of revenue performance of FC and ISFC versus LG
Figure 8: Performance ultimate pit revenue of FC versus ISFC using 10 (left) and 20 (right) refining periods
Figure 9: Comparison of revenue performance of FC and ISFC with different refining parameters

Paper 305, CCG Annual Report 13, 2011 (© 2011)
305-11
Figure 10: Effect of using different number of refining periods in the average (left) and variance (right) of revenue
proportions
Figure 11: Comparison of computation time for the ISFC, FC, and LG approaches
Figure 12: Template of parameter file of the TOPOMODEL program
Figure 13: Template of parameter file of the MINEABLELIMITS program

Paper 305, CCG Annual Report 13, 2011 (© 2011)
305-12
Figure 14: Template of parameter file of the ULTIMATEPIT program
Figure 15: Template parameter file of the MININGSEQUENCE_BC program