an approach to optimize mig welding parameters by using ... · and figures 5, 8, 9 and 10 leads to...
TRANSCRIPT

IOSR Journal of Mechanical and Civil Engineering (IOSR-JMCE)
e-ISSN: 2278-1684,p-ISSN: 2320-334X, Volume 11, Issue 6 Ver. IV (Nov- Dec. 2014), PP 72-84 www.iosrjournals.org
www.iosrjournals.org 72 | Page
An Approach to Optimize MIG Welding Parameters by Using
Design of Experiments
Priti Sonasale Department Of Mechanical Engineering Central University Of Karnataka Gulbarga, Karnataka, India.
Abstract:The Metal arc Welding (MIG) process finds wide application because all commercially important
applicable metals such as carbon steel, high-strength, low-alloy steel, and stainless steel, aluminum, copper,
titanium, and nickel alloys can be welded in all positions with this process by choosing the appropriate
shielding gas, electrode, and welding variables.In this work, the five control factors such as wire feed rate, arc
voltage, welding speed, nozzle to plate distance and gas flow rate are considered.The welding parameters such
as bead width, dilution and depth of HAZ have been considered.By using DOE method, the weld parameters
were optimized. Analysis is done using ANOVA to determine the significance of parameters.Finally the
confirmation test is carried out to compare the predicated values with the experimental values confirm its
effectiveness in the analysis of bead width, dilution and depth of HAZ.
Key words:MIG Welding, Mild steel, DOE, ANOVA
I. Introduction With the introduction of welding as joining method, the welding technology was applied as major
joining technique in hi-tech industries to the weldingof steels for manufacturing of different structures
like pressure vessels and aerospace applications.Mostly high strength low alloy steels in thin cylindrical
shell form are being used for aerospace structures due to high strength and low weight ratio.The
mechanical properties of a weldment depend largely on bead geometry parameters such as depth of HAZ,
dilution and bead width. MIG is a multi-objective, multi-factor metal fabrication technique [1, 3]. Several
process parameters interact in a complex manner resulting in direct or indirect influence on bead geometry and
hence on the mechanical behavior of the welds prepared by this process. Hence, it is necessary to find an
optimal process condition in terms of welding parameters such as, Wire feed rate, Arc Voltage,Welding Speed,
Nozzle to Plate Distance,Gas flow rate to obtain the optimum bead geometry. Detailed analysis using statistical
methods like factorial techniques have been employed by researchers to correlate these parameters with weld
bead geometry, weld quality, etc [4-7]. Purohit [8] has determined bead geometry parameters for metal inert gas (MIG) underwater welded bead-on-plates using 2-level factorial design of experiments. Gunaraj and Murugan
[9] have used 5-level factorial experiments to determine the main and interaction effects of process control
variables on important bead geometry parameters including bead volume quantitatively and optimal bead
volume with maximum penetration, minimum reinforcement and bead width have been obtained successfully.
Of late, Taguchi techniques areused extensively for solving optimization problems in the field of production
engineering [10]. This method utilizes a well balanced experimental design consisting of a limited number of
experimental runs, called orthogonal array (OA) and signal-to-noise ratio (S/N) which serve the objective
function to be optimized within experimental limits. Further, to determine the significance of factors on the
responses analysis of variance (ANOVA) is used. This paper presents the details of an experimental work on
surfacing of mild steel by chromium and manganese alloy steel by MIG process to yield desired quality of
surfacing, in terms of bead geometry, as influenced by Wire feed rate, Arc Voltage, Welding Speed, Nozzle to
Plate distance ,Gas flow rate which are varied at three different levels. Orthogonal array Taguchi approach has been carried out to solve this multi-response optimization problem [11].
II. Design of experiment based on the Taguchi method
The experiments have been performed by MIG Welding Machine. ACESS MIG 400 Copper coated
electrode wire of diameter 1.2mm [AWSER 70S-6].Gases used are Argon 98% and C𝑂22%. After surfacing
transverse sections of the weld bead have been cut from the middle portions of the plates by grinding cutting
machine as shown in the figure1A & B.

An Approach To Optimize Mig Welding Parameters By Using Design Of Experiments
www.iosrjournals.org 73 | Page
Figure 1 A:Working condition of Work piece Figure 1 B:Working principles of GMAW
The specimens have been polished by fine abrasive papers followed by the emery papers of grades1,
1/0, 2/0, 3/0 and 4/0 finally they have been smoothened by means of cloth polishing as shown in fig 2. The
properly polished specimens have been etched with 2% Nital solution for about 30sec.
Figure: 2showing cutting section of the hardfaced plate
The Microstructure of the sample is observed in light optical microscope as shown in figure 3
Sample No: 3 Sample No: 6 Sample No: 9
Sample No: 14 Sample no:18 Sample No :20
Figure 3: Microstructure of the specimens

An Approach To Optimize Mig Welding Parameters By Using Design Of Experiments
www.iosrjournals.org 74 | Page
Taguchi’s 𝐿27 orthogonal array has been selected to restrict the number of experimental runs.
Experiments have been conducted with these process control parameters to obtain bead-on-plate surfacing on mild steel plates of thickness of dimension [50 x 100 x 08] mm by MIG Welding(MIG). Design matrix has been
selected based on Taguchi’s 𝐿27orthogonal array consisting 27 sets of coded condition.
Table 1: Welding Process Parameters Control Factors Notation Levels units
I II III
Wire feed rate A 0.5 1.0 1.5 Ipm
Arc Voltage B 30 32 34 Volt
Welding Speed C 8 10 12 Sec/cm
Nozzle to Plate Distance D 10 13 18 mm
Gas flow rate E 10 13 18 Lit/min
The most important performance measures for MIG welding process are Bead Width ( 𝐵𝑤 ),
Dilution(𝐷𝑖) and Depth of HAZ (𝐷𝐻). Welding performance in MIG Process is mainly expressed as higher
value of Bead Width and smaller values of Dilution and Depth of HAZ. Bead Width is higher-the-better
performance characteristics while Dilution and Depth of HAZ are smaller-the-better performance characteristic. For the Experimental plan, the taguchi method of three level experiments was chosen.Table 1 indicates the
factors to be studied and their preferred levels that can be controlled through the experimental process.
Assignment of factors to various columns was made in accordance with the linear graph as shown in the figure
4, for an 𝐿27 (313) orthogonal array (Peace, 1993: Phadke, 1989.
Figure 4: Standard linear graph for𝑳𝟐𝟕 array
The detailed orthogonal array is shown in the table2. The chosen experimental design has 27 rows
corresponding to the number of experiments with 13 columns at three levels, as shown in the table 2. The plan
required 27 experimental runs, in which the first column was assigned to Wire feed rate(A), the second column
to Arc Voltage(B), the fifth column to Welding Speed (C), the ninth column to Nozzle to Plate Distance(D), and
tenth column to Gas flow rate (E), the third and fourth column were assigned to (AxB)₁ and AxB)₂ respectively to estimate the interaction between Wire feed rate (A) and Arc Voltage (B), the sixth and seventh
columns to (BxC)₁and (BxC)₂ respectively to estimate the interaction between Arc Voltage(B) and Welding
Speed (C), the eighth and eleventh columns to (AxC)₁ and (AxC)₂ respectively to estimate the interaction between to Wire feed rate(A) and Welding Speed (C). Two replications under each combination of factors were
used and performance output was calculated as average of two values. The experimental observations were
further transformed into signal-to-noise (S/N) ratio.
An Approach To Optimize Mig Welding Parameters By Using Design Of Experiments
www.iosrjournals.org 75 | Page
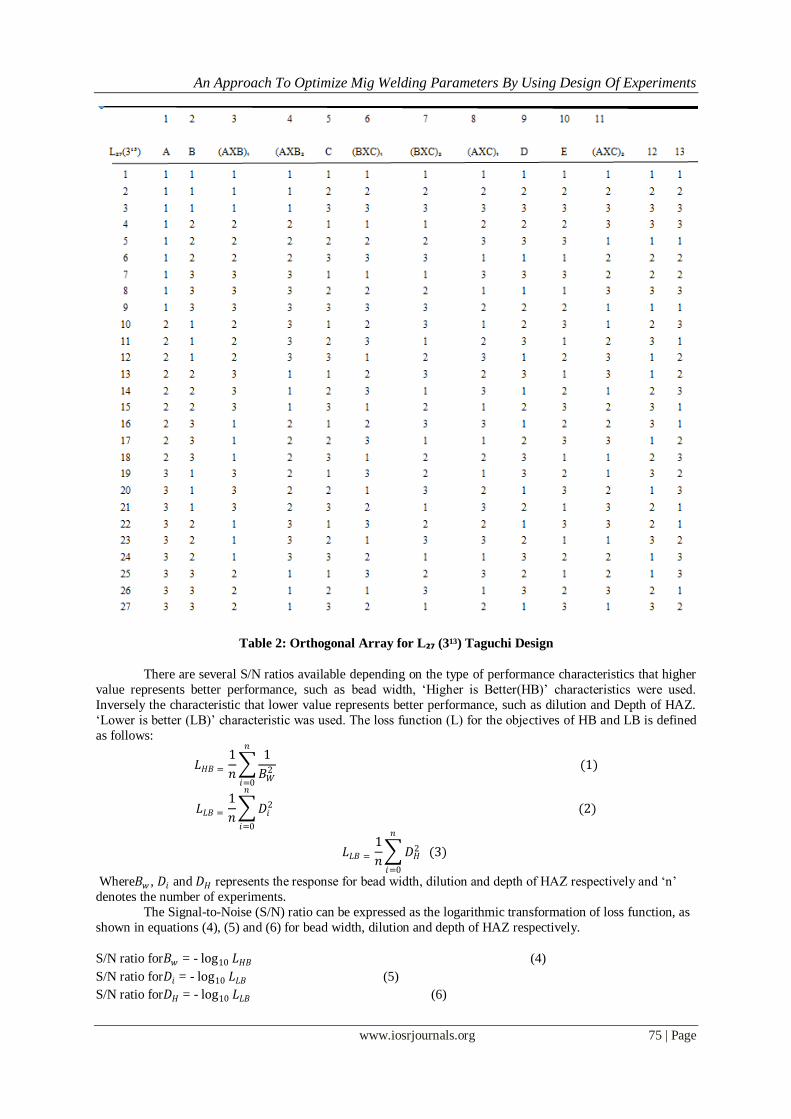
Table 2: Orthogonal Array for L₂₇ (3¹³) Taguchi Design
There are several S/N ratios available depending on the type of performance characteristics that higher
value represents better performance, such as bead width, ‘Higher is Better(HB)’ characteristics were used.
Inversely the characteristic that lower value represents better performance, such as dilution and Depth of HAZ.
‘Lower is better (LB)’ characteristic was used. The loss function (L) for the objectives of HB and LB is defined
as follows:
𝐿𝐻𝐵 =
1
𝑛
1
𝐵𝑊2
𝑛
𝑖=0
(1)
𝐿𝐿𝐵 =
1
𝑛 𝐷𝑖
2 (2)
𝑛
𝑖=0
𝐿𝐿𝐵 =
1
𝑛 𝐷𝐻
2
𝑛
𝑖=0
(3)
Where𝐵𝑤 , 𝐷𝑖 and 𝐷𝐻 represents the response for bead width, dilution and depth of HAZ respectively and ‘n’
denotes the number of experiments.
The Signal-to-Noise (S/N) ratio can be expressed as the logarithmic transformation of loss function, as
shown in equations (4), (5) and (6) for bead width, dilution and depth of HAZ respectively.
S/N ratio for𝐵𝑤 = - log10 𝐿𝐻𝐵 (4)
S/N ratio for𝐷𝑖 = - log10 𝐿𝐿𝐵 (5)
S/N ratio for𝐷𝐻 = - log10 𝐿𝐿𝐵 (6)

An Approach To Optimize Mig Welding Parameters By Using Design Of Experiments
www.iosrjournals.org 76 | Page
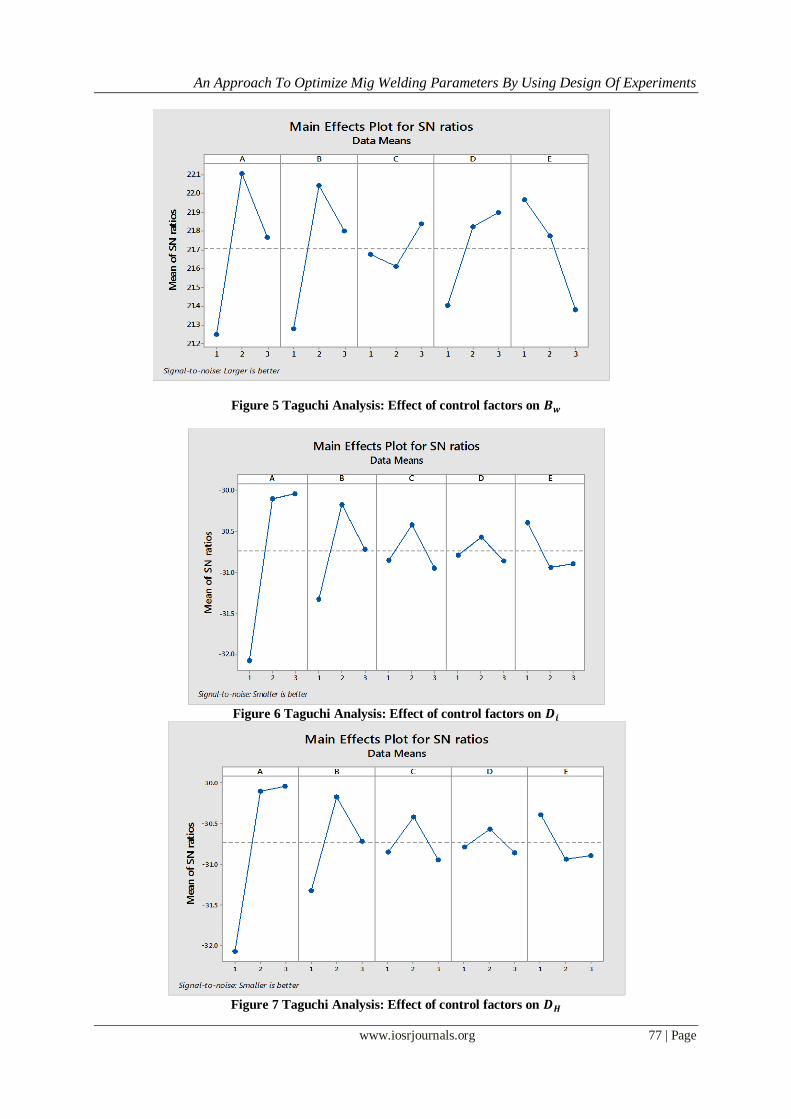
III. Results and discussion The experimental results are tabulated in table 3. The overall mean for S/N Ratio of Bead width (𝐵𝑤 ),
dilution (𝐷𝑖) and Depth of HAZ (𝐷𝐻) is found to be 21.66 dB, -30.73 dB and -2.53 dB respectively. Analysis of
experimental data was carried out using the popular software known as Minitab 17. The effects of five control
factors on performance measures𝐵𝑤 , 𝐷𝑖 and 𝐷𝐻 are shown graphically in the figures respectively.
Before any attempt is made to use this simple model as a predictor of the measures of performance, the
possible interactions between factors must be considered. Factorial design incorporates a simple means of
testing for the presence of interaction effects. The S/N Ratio response tables for performance measures𝐵𝑤 , 𝐷𝑖
and 𝐷𝐻 are depicted in table 4, 5, and 6 respectively.
An interesting phenomenon can be observed from the table 4 – that factors B and C do not show any
significant effect individually in comparison to factor A for improving 𝐵𝑤 , but their interaction with factor A
and with each other is quite significant. The interaction graphs between the factors A x B, B x C and A x C on
𝐵𝑤 are shown in the figures 8, 9, and 10 respectively. Therefore careful analysis of the response table (table 4)
and figures 5, 8, 9 and 10 leads to the conclusion that the maximum value of𝐵𝑤 can be achieved if control
factors are set at levels𝐴2 ,𝐵2 , 𝐶3 ,𝐷3and𝐸1
Table 3: Taguchi Experimental Design using 𝑳𝟐𝟕Orthogonal Array
An Approach To Optimize Mig Welding Parameters By Using Design Of Experiments
www.iosrjournals.org 77 | Page
Figure 5 Taguchi Analysis: Effect of control factors on 𝑩𝒘
Figure 6 Taguchi Analysis: Effect of control factors on 𝑫𝒊
Figure 7 Taguchi Analysis: Effect of control factors on 𝑫𝑯

An Approach To Optimize Mig Welding Parameters By Using Design Of Experiments
www.iosrjournals.org 78 | Page
Table 4 Response Table for Signal to Noise Ratios of 𝑩𝒘
Larger is better
Level A B (AxB)₁AxB)₂ C (BxC)₁ (BxC)₂ (AxC)₁ (AxC)₂ D E
1 21.25 21.28 21.68 21.40 21.97 21.85 21.88 21.70 21.78 21.58 21.71
2 22.11 22.04 21.61 21.82 21.77 21.62 21.49 21.85 21.65 21.66 21.56
3 21.77 21.80 21.84 21.90 21.38 21.66 21.75 21.57 21.70 21.88 21.85
Delta 0.86 0.77 0.23 0.50 0.59 0.23 0.39 0.28 0.13 0.30 0.30
Rank 1 2 10 4 3 9 5 8 11 6 7
Table5:Response Table for Signal to Noise Ratios of %𝑫𝒊 Smaller is better
Level A B (AxB)₁ (AxB)₂ C (BxC)₁ (BxC)₂ (AxC)₁ (AxC)₂ D E
1 -32.08 -31.33 -30.85 -30.79 -30.39 -31.13 -30.76 -30.64 -30.52 -30.81 -30.40
2 -30.10 -30.17 -30.41 -30.56 -30.93 -31.05 -31.26 -30.77 - 30.67 -30.87 -30.78
3 -30.04 -30.71 -30.95 -30.86 -30.89 -30.04 -30.19 -30.80 -31.02 -30.54 -31.0
Delta 2.04 1.15 0.53 0.30 0.55 1.08 1.06 0.15 0.49 0.33 0.62
Rank 1 2 7 10 6 3 4 11 8 9 5
Table 6: Response Table for Signal to Noise Ratios of 𝑫𝑯
Smaller is better
Level A B (AxB)₁ (AxB)₂ C (BxC)₁ (BxC)₂ (AxC)₁ (AxC)₂ D E
1 -2.615 -2.306 -2.653 -2.850 -2.301 -2.427 -2.522 -2.749 -2.068 -2.964 -2.393
2 -2.769 -2.296 -2.316 -2.204 -2.774 -2.764 -2.395 -2.626 -2.545 -2.477 -3.218
3 -2.224 -3.006 -2.640 -2.554 -2.534 -2.417 -2.692 -2.234 -2.996 -2.167 -1.998
Delta 0.546 0.711 0.337 0.646 0.473 0.346 0.297 0.515 0.928 0.797 1.220
Rank 6 4 10 5 8 9 11 7 2 3 1
Figure 8 Interaction graph between A x B for 𝑩𝒘
An Approach To Optimize Mig Welding Parameters By Using Design Of Experiments
www.iosrjournals.org 79 | Page
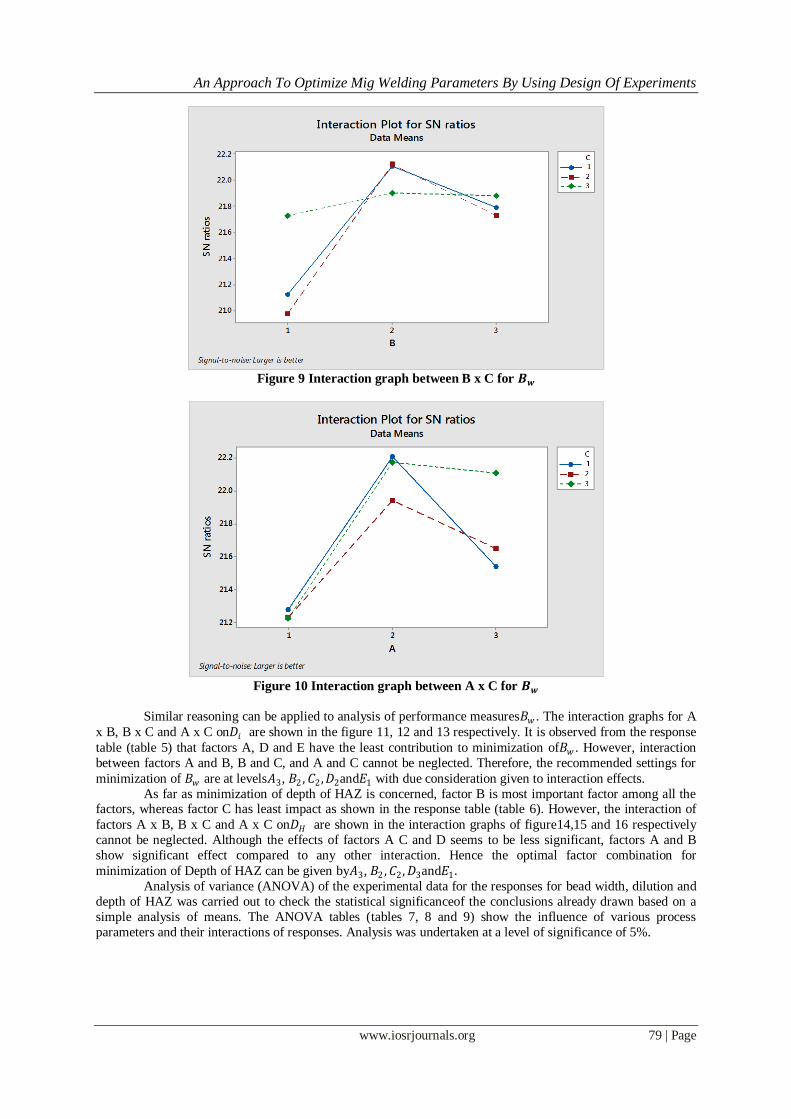
Figure 9 Interaction graph between B x C for 𝑩𝒘
Figure 10 Interaction graph between A x C for 𝑩𝒘
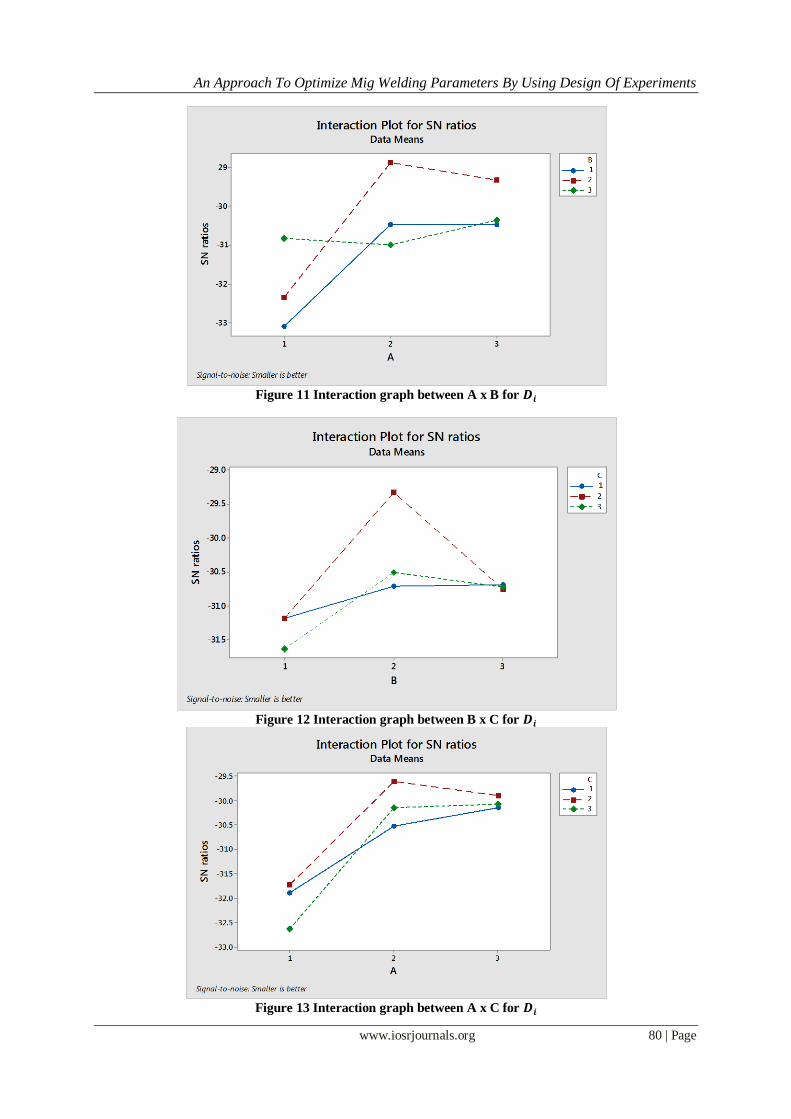
Similar reasoning can be applied to analysis of performance measures𝐵𝑤 . The interaction graphs for A
x B, B x C and A x C on𝐷𝑖 are shown in the figure 11, 12 and 13 respectively. It is observed from the response
table (table 5) that factors A, D and E have the least contribution to minimization of𝐵𝑤 . However, interaction
between factors A and B, B and C, and A and C cannot be neglected. Therefore, the recommended settings for
minimization of 𝐵𝑤 are at levels𝐴3, 𝐵2 , 𝐶2 ,𝐷2and𝐸1 with due consideration given to interaction effects.
As far as minimization of depth of HAZ is concerned, factor B is most important factor among all the factors, whereas factor C has least impact as shown in the response table (table 6). However, the interaction of
factors A x B, B x C and A x C on𝐷𝐻 are shown in the interaction graphs of figure14,15 and 16 respectively
cannot be neglected. Although the effects of factors A C and D seems to be less significant, factors A and B
show significant effect compared to any other interaction. Hence the optimal factor combination for
minimization of Depth of HAZ can be given by𝐴3, 𝐵2 ,𝐶2 ,𝐷3and𝐸1 . Analysis of variance (ANOVA) of the experimental data for the responses for bead width, dilution and
depth of HAZ was carried out to check the statistical significanceof the conclusions already drawn based on a
simple analysis of means. The ANOVA tables (tables 7, 8 and 9) show the influence of various process
parameters and their interactions of responses. Analysis was undertaken at a level of significance of 5%.
An Approach To Optimize Mig Welding Parameters By Using Design Of Experiments
www.iosrjournals.org 80 | Page
Figure 11 Interaction graph between A x B for 𝑫𝒊
Figure 12 Interaction graph between B x C for 𝑫𝒊
Figure 13 Interaction graph between A x C for 𝑫𝒊

An Approach To Optimize Mig Welding Parameters By Using Design Of Experiments
www.iosrjournals.org 81 | Page
Figure 14 Interaction graph between A x B for 𝑫𝑯
Figure 15 Interaction graph between B x C for 𝑫𝑯
Figure 16 Interaction graph between A x C for 𝑫𝑯

An Approach To Optimize Mig Welding Parameters By Using Design Of Experiments
www.iosrjournals.org 82 | Page
From the last column of table 7, it can be concluded that wire feed rate (0.706), Arc Voltage (0.695), Nozzle to
Plate Distance (0.470) have great influence on bead width. While interaction of wire feed rate and Arc Voltage
(0.850) and Arc Voltage and welding speed (0.603) cause significance contribution to bead width, the factor welding speed (0.913) and the interaction between the wire feed rate and welding speed (0.996) show less
significance.
Table 7: ANOVA tablefor Bead width (𝑩𝒘)
Source Degree of Sum of Squares Mean Square F-statistics Probability
Freedom (DF) (SS) (MS) (F) (P)
A 2 0.0042 0.00211 0.39 0.706
B 2 0.0044 0.00221 0.41 0.695
C 2 0.0010 0.00050 0.09 0.913 D 2 0.0105 0.00527 0.98 0.470
E 2 0.0002 0.00008 0.01 0.986
A*B 4 0.0069 0.00172 0.32 0.850
A*C 4 0.0008 0.00020 0.04 0.996
B*C 4 0.0169 0.00423 0.79 0.603
Error 3 0.0161 0.00537
Total 26 28.7941
Table8indicates that, the Arc Voltage (0.092), welding speed (0.418), Nozzle to Plate Distance (0.726)
have great influence on dilution. The interaction of Arc Voltage and welding speed (0.606) cause significant
contribution to dilution, whereas the interaction between wire feed rate and Arc Voltage (0.070) and that between the wire feed rate and welding speed (0.616), along with the factor wire feed rate (0.007) have less
significant effect on dilution.
Table 8: ANOVA table for % Dilution (%𝑫𝒊)
Source Degree of Sum of Squares Mean Square F-statistics Probability
Freedom (DF) (SS) (MS) (F) (P)
A 2 422.087 211.043 21.82 0.007
B 2 88.649 44.324 4.58 0.092
C 2 21.134 10.567 1.09 0.418 D 2 6.702 3.351 0.35 0.726
E 2 25.872 12.936 1.34 0.359
A*B 4 200.791 50.198 5.19 0.070
A*C 4 28.224 7.056 0.73 0.616
B*C 4 29.076 7.269 0.75 0.606
Error 4 38.681 9.670
Total 26 861.215
Similarly it is obvious from the table 9 that the arc voltage(0.315), wire feed rate(0.523) and nozzle to plate
distance (0.459) have great influence on depth of HAZ. The interaction between wire feed rate and arc voltage (0.937) and arc voltage and welding speed(0.208) show significant contribution to depth of HAZ, whereas the
factor welding speed (0.700) and the interaction between wire feed rate and welding speed (0.395) have less
contribution to the response ie depth of HAZ (𝐷𝐻)

An Approach To Optimize Mig Welding Parameters By Using Design Of Experiments
www.iosrjournals.org 83 | Page
Table 9: ANOVA table for Depth of HAZ (𝑫𝑯)
Source Degree of Sum of Squares Mean Square F-statistics Probability
Freedom (DF) (SS) (MS) (F) (P)
A 2 0.03630 0.018148 0.77 0.523
B 2 0.07407 0.037037 1.56 0.315
C 2 0.01852 0.009259 0.39 0.700
D 2 0.04519 0.022593 0.95 0.459
E 2 0.02741 0.013704 0.58 0.602
A*B 4 0.01704 0.004259 0.18 0.937
A*C 4 0.12593 0.031481 1.33 0.395
B*C 4 0.22815 0.057037 2.41 0.208
Error 4 0.09481 0.023704 Total 26 0.66741
IV. Confirmation Experiment The optimal contribution of welding process parameters has been determined for three responses
commonly used or hardfacing through MIG in the previous section. However, any design of experiment strategy
emphasizes conducting a confirmation experiment. Therefore, new combinations of welding process parameters
are used for verification or confirmation experiments and necessary predictive equations are developed. The
estimated S/N ratio for bead width can be calculated with the help of the following prediction equation:
ƞ ₁ = 𝑇 + (𝐴₂ - 𝑇) + (𝐵₂ - 𝑇) + [(𝐴₂𝐵₂-𝑇) - (𝐴₂ - 𝑇)- (𝐵₂ - 𝑇)]+ (𝐶₃- 𝑇)+[( (𝐵₂𝐶₃ - 𝑇)-
(𝐵₂ - 𝑇)- (𝐶₃- 𝑇)] + [(𝐴₂𝐶₃-𝑇) - (𝐴₂ - 𝑇) - (𝐶₃- 𝑇)] + (𝐷₃- 𝑇)+ (𝐸₁- 𝑇) (7)
ƞ ₁ = Predicted average
𝑇 = Overall experimental average
𝐴₂𝐵₂𝐶₃𝐷₃𝑎𝑛𝑑𝐸₁ = Mean responses for factor and interaction at designated levels.
By combining like terms, the equation is reduced to:
ƞ ₁ =𝐴2𝐵2 + 𝐵2𝐶3 +𝐴2𝐶3 - 𝐴2 -𝐵2 -𝐶3+𝐷3+ 𝐸1- 𝑇 (8)
A new combination of factors levels is𝐴2 ,𝐵2 ,𝐶3 ,𝐷3𝑎𝑛𝑑 𝐸1is used to predict Bead width through the prediction
equation, and it is found to be ƞ ₁= 21.96 dB
Similarly, a prediction equation is developed for estimating the S/N Ratio of Dilution, given in equation (9):
ƞ 2= 𝑇 + (𝐴3 - 𝑇) + (𝐵2- 𝑇) + [𝐴3𝐵2 -𝑇) - (𝐴3- 𝑇)- (𝐵2- 𝑇)]+ (𝐶2 − 𝑇)+[( (𝐵2𝐶2 - 𝑇)-
(𝐵2- 𝑇)- (𝐶2- 𝑇)] + [(𝐴3𝐶2- 𝑇) - (𝐴3- 𝑇) - (𝐶2- 𝑇)] + (𝐷2- 𝑇) + (𝐸1- 𝑇) (9)
ƞ 2= Predicted average
𝑇 = Overall experimental average
𝐴3𝐵2𝐶2𝐷2𝑎𝑛𝑑 𝐸1= Mean responses for factor and interaction at designated levels.
By combining like terms, the equation is reduced to:
ƞ 2=𝐴3𝐵2+ 𝐵2𝐶2 +𝐴3𝐶2 - 𝐴3 -𝐵2-𝐶2 +𝐷2+ 𝐸1- 𝑇 (10)
A new combination of factors levels is 𝐴3𝐵2𝐶2𝐷2𝑎𝑛𝑑 𝐸1is used to predict % Dilution through the prediction
equation, and it is found to be ƞ 2= -30.30 dB
Similarly, a prediction equation is developed for estimating the S/N Ratio of Depth of HAZ, given in equation
(11):
ƞ 3= 𝑇 + (𝐴3- 𝑇) + (𝐵2 - 𝑇) + [(𝐴3𝐵2 -𝑇) - (𝐴3 - 𝑇)- (𝐵2- 𝑇)]+ (𝐶2 - 𝑇)+[( (𝐵2𝐶2 - 𝑇)-
(𝐵2- 𝑇)- (𝐶2-𝑇)] + [(𝐴3𝐶2-𝑇) - (𝐴3- 𝑇)- (𝐶2-𝑇)] + (𝐷3- 𝑇)+ (𝐸1- 𝑇) (11)
ƞ 3 = Predicted average
𝑇 = Overall experimental average
𝐴3𝐵2𝐶2𝐷3𝑎𝑛𝑑 𝐸1= Mean responses for factor and interaction at designated levels.
By combining like terms, the equation is reduced to:
ƞ 3=𝐴3𝐵2 + 𝐵2𝐶2 +𝐴3𝐶2 - 𝐴3 -𝐵2 -𝐶2 +𝐷3+ 𝐸1-𝑇 (12)
A new combination of factors levels is 𝐴3𝐵2𝐶2𝐷3𝑎𝑛𝑑 𝐸1is used to predict Depth of HAZ through the
prediction equation, and it is found to be ƞ 3= -1.99dB.
An Approach To Optimize Mig Welding Parameters By Using Design Of Experiments
www.iosrjournals.org 84 | Page
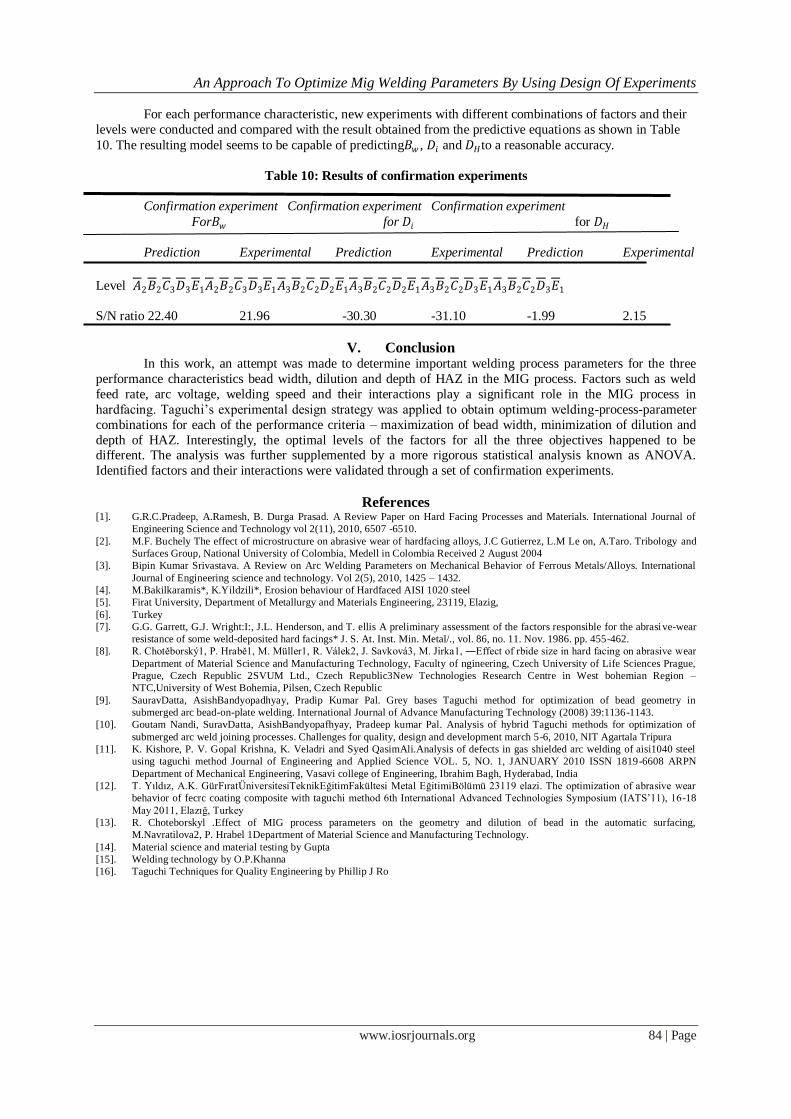
For each performance characteristic, new experiments with different combinations of factors and their
levels were conducted and compared with the result obtained from the predictive equations as shown in Table
10. The resulting model seems to be capable of predicting𝐵𝑤 , 𝐷𝑖 and 𝐷𝐻to a reasonable accuracy.
Table 10: Results of confirmation experiments
Confirmation experiment Confirmation experiment Confirmation experiment
For𝐵𝑤 for 𝐷𝑖 for 𝐷𝐻
Prediction Experimental Prediction Experimental Prediction Experimental
Level 𝐴2𝐵2𝐶3𝐷3𝐸1𝐴2𝐵2𝐶3𝐷3𝐸1𝐴3𝐵2𝐶2𝐷2𝐸1𝐴3𝐵2𝐶2𝐷2𝐸1𝐴3𝐵2𝐶2𝐷3𝐸1𝐴3𝐵2𝐶2𝐷3𝐸1
S/N ratio 22.40 21.96 -30.30 -31.10 -1.99 2.15
V. Conclusion In this work, an attempt was made to determine important welding process parameters for the three
performance characteristics bead width, dilution and depth of HAZ in the MIG process. Factors such as weld
feed rate, arc voltage, welding speed and their interactions play a significant role in the MIG process in
hardfacing. Taguchi’s experimental design strategy was applied to obtain optimum welding-process-parameter
combinations for each of the performance criteria – maximization of bead width, minimization of dilution and
depth of HAZ. Interestingly, the optimal levels of the factors for all the three objectives happened to be different. The analysis was further supplemented by a more rigorous statistical analysis known as ANOVA.
Identified factors and their interactions were validated through a set of confirmation experiments.
References [1]. G.R.C.Pradeep, A.Ramesh, B. Durga Prasad. A Review Paper on Hard Facing Processes and Materials. International Journal of
Engineering Science and Technology vol 2(11), 2010, 6507 -6510.
[2]. M.F. Buchely The effect of microstructure on abrasive wear of hardfacing alloys, J.C Gutierrez, L.M Le on, A.Taro. Tribology and
Surfaces Group, National University of Colombia, Medell in Colombia Received 2 August 2004
[3]. Bipin Kumar Srivastava. A Review on Arc Welding Parameters on Mechanical Behavior of Ferrous Metals/Alloys. International
Journal of Engineering science and technology. Vol 2(5), 2010, 1425 – 1432.
[4]. M.Bakilkaramis*, K.Yildzili*, Erosion behaviour of Hardfaced AISI 1020 steel
[5]. Firat University, Department of Metallurgy and Materials Engineering, 23119, Elazig,
[6]. Turkey
[7]. G.G. Garrett, G.J. Wright:I:, J.L. Henderson, and T. ellis A preliminary assessment of the factors responsible for the abrasive-wear
resistance of some weld-deposited hard facings* J. S. At. Inst. Min. Metal/., vol. 86, no. 11. Nov. 1986. pp. 455-462.
[8]. R. Chotěborský1, P. Hrabě1, M. Müller1, R. Válek2, J. Savková3, M. Jirka1, ―Effect of rbide size in hard facing on abrasive wear
Department of Material Science and Manufacturing Technology, Faculty of ngineering, Czech University of Life Sciences Prague,
Prague, Czech Republic 2SVUM Ltd., Czech Republic3New Technologies Research Centre in West bohemian Region –
NTC,University of West Bohemia, Pilsen, Czech Republic
[9]. SauravDatta, AsishBandyopadhyay, Pradip Kumar Pal. Grey bases Taguchi method for optimization of bead geometry in
submerged arc bead-on-plate welding. International Journal of Advance Manufacturing Technology (2008) 39:1136-1143.
[10]. Goutam Nandi, SuravDatta, AsishBandyopafhyay, Pradeep kumar Pal. Analysis of hybrid Taguchi methods for optimization of
submerged arc weld joining processes. Challenges for quality, design and development march 5-6, 2010, NIT Agartala Tripura
[11]. K. Kishore, P. V. Gopal Krishna, K. Veladri and Syed QasimAli.Analysis of defects in gas shielded arc welding of aisi1040 steel
using taguchi method Journal of Engineering and Applied Science VOL. 5, NO. 1, JANUARY 2010 ISSN 1819-6608 ARPN
Department of Mechanical Engineering, Vasavi college of Engineering, Ibrahim Bagh, Hyderabad, India
[12]. T. Yıldız, A.K. GürFıratÜniversitesiTeknikEğitimFakültesi Metal EğitimiBölümü 23119 elazi. The optimization of abrasive wear
behavior of fecrc coating composite with taguchi method 6th International Advanced Technologies Symposium (IATS’11), 16-18
May 2011, Elazığ, Turkey
[13]. R. Choteborskyl .Effect of MIG process parameters on the geometry and dilution of bead in the automatic surfacing,
M.Navratilova2, P. Hrabel 1Department of Material Science and Manufacturing Technology.
[14]. Material science and material testing by Gupta
[15]. Welding technology by O.P.Khanna
[16]. Taguchi Techniques for Quality Engineering by Phillip J Ro