an approach to discovering new technology opportunities
TRANSCRIPT

ARTICLE IN PRESS
0166-4972/$ - se
doi:10.1016/j.te
�CorrespondE-mail addr
Technovation 29 (2009) 481–497
www.elsevier.com/locate/technovation
An approach to discovering new technology opportunities:Keyword-based patent map approach
Sungjoo Leea, Byungun Yoonb, Yongtae Parkc,�
aDepartment of Industrial & Information Systems Engineering, Ajou University, San 5, Woncheon-dong, Yeongtong-gu,
Suwon, Kyunggi-do 443-749, Republic of KoreabDepartment of Industrial & Systems Engineering, Dongguk University, Pil-dong 3 ga, Chung-gu, Seoul 100-715, Republic of Korea
cDepartment of Industrial Engineering, School of Engineering, Seoul National University, San 56-1, Shillim-Dong,
Kwanak-Gu, Seoul 151-742, Republic of Korea
Abstract
This paper proposes an approach for creating and utilizing keyword-based patent maps for use in new technology creation activity.
The proposed approach comprises the following sub-modules. First, text mining is used to transform patent documents into structured
data to identify keyword vectors. Second, principal component analysis is employed to reduce the numbers of keyword vectors to make
suitable for use on a two-dimensional map. Third, patent ‘vacancies’, defined as blank areas in the map that are sparse in patent density
but large in size, are identified. The validity of the vacancy is then tested against such criteria as technological criticality and technological
trends. If a vacancy is judged as meaningful, its technological features are investigated in detail to identify the potential for new
technology creation. The procedure of the proposed approach is described in detail by employing an illustrative patent database and is
implemented into an expert system for new technology creation.
r 2008 Elsevier Ltd. All rights reserved.
Keywords: Keyword-based; Text-mining; PCA; New technology creation; Patent information; Patent map; Technology vacancy
1. Introduction
Recent trends of R&D paradigms accentuate the notionsof dominant designs for next-generation development,and discontinuous innovation for breakthrough products(Miller and Morris, 1999; Utterback, 1996). The creationand development of innovative ideas is recognized as anengine that gives traction to the whole innovation processin general, and new product development (NPD) andnew technology creation (NTC) processes in particular.Creative ideas are the precursor of commercial success, astime and effort invested at this very early stage will pay offin the market. In fact, the impact of new products on firmsuccess has increased markedly over time. During the1970s, new products accounted for 20% of corporateprofits, but this figure rose to 50% in the 1990s (Takeuchiand Nonaka, 1986; von Hippel, 1986). Economists have
e front matter r 2008 Elsevier Ltd. All rights reserved.
chnovation.2008.10.006
ing author. Tel.: +822 880 8358; fax: +82 2 889 8560.
ess: [email protected] (Y. Park).
reckoned that new products produced by new technologiesfor new markets have resulted in between 40% and 90%of the increase in national wealth in most countries(Campbell, 1983). Today, as markets change rapidly,technologies proliferate unceasingly, and thus product lifecycles become ever shorter, this factor has become moreimportant than ever (Slater, 1993).Despite its importance, innovation, whether for NPD or
NTC, by its nature presents ill-defined and poorly-structured problems, and thus there has been little effortto systematize practice. Potential sources of innovativeideas are ubiquitous, and while internal sources havetraditionally been seen as the major suppliers of new ideas,other studies argue that the majority of the ideas in manyindustries are derived from customers and users (vonHippel, 1986), and suppliers and even competitors mayalso provide insights for innovation. Consequently, a mixof internal and external resources needs to be searched(Chesbrough, 2003). The question then is how to system-atically transform ideas in the form of raw data, from

ARTICLE IN PRESSS. Lee et al. / Technovation 29 (2009) 481–497482
whatever source, into informative knowledge for innova-tion. Tools such as brainstorming, group dynamics, useranalysis, benchmarking, technology forecasting, or evenlarge-scale Delphi surveys have been suggested (Urban andHauser, 1993). But while these may direct the way wecan construct organizational settings or break complexproblems into simpler sub-problems, they may not offerconcrete ways to facilitate creative thinking. Probably themost scientific approach to the problem of idea generationis offered by Theory of Inventive Problem-Solving (TRIZ),which uses an extensive analysis of patents to provide atool for delicate and complex mental operations (Salama-tov, 1999). While clearly both scientific and useful, TRIZ islimited in practical application by the intensive trainingprogram required.
To provide more concrete and detailed guidelines fordeveloping innovative ideas, and especially for uncoveringopportunities to create new technologies, this researchsuggests a keyword-based patent map approach. Patentsare useful sources of knowledge about technical progressand innovative activity (Park et al., 2005) and thus havecommonly been examined in R&D planning, from themacrolevel analysis of strategy to the modeling of specificemerging technologies at the microlevel (Abraham andMorita, 2001; Liu and Shyu, 1997; Wang et al., 1998;Watanabe et al., 2001). A careful analysis of thetechnological information in patent documents is givenvisualized expression as a patent map, allowing complexpatent information to be understood easily and effectively(WIPO, 2003), and also highlighting various elements ofknowledge about technologies, competitive positions(Abraham and Morita, 2001; Liu and Shyu, 1997),infringement risks (Daim et al., 2006), etc. Moreover, ifcarefully analyzed, patents can show technological detailsand relationships, reveal business trends, inspire novelindustrial solutions and help decide investment policy(Campbell, 1983; Jung, 2003). They can also be a valuablesource of information for new products or technologies.Moreover, patents are becoming increasingly importantacross other industry sectors, even in service sectors. Upuntil recently, patents, as a means to protect inventionslegally, were perceived to be only for technology intensivesectors (Bader, 2008). However, as the value of firms,particularly in the knowledge-intensive business servicesector, is determined by the value of their intellectualproperty that can be represented and protected by patents(Hanel, 2006), more firms are trying to protect their serviceinnovations (Bader, 2008). Actually, business models andsoftware solutions are more patentable, which have alreadybeen quite common in the US and Japan.
Given the potential utility of patent databases as sourcesof innovative ideas, we present a novel approach of patentanalysis designed to help guide the NTC process, as well asa support system to facilitate the process of generating akeyword-based patent map to identify promising opportu-nities for NTC. For the purpose, we first focus on thedescription section of patent documents, using text-mining
techniques to discover undeveloped technological fieldsfrom the patent database. In fact, there have been severalattempts to apply text mining to developing patent maps(Tseng et al., 2007a, b; Yoon and Park, 2004), but previousstudies have focused mainly on the development process.Studies on the interpretation algorithm have been limited,and thus interpretation of patent maps has tended to beintuitive. To overcome this limitation, our second stepprovides several indexes to guide patent map usage thateliminate unnecessary information so that only what isrelevant to the search for next-generation technologies issorted and revealed. This means we emphasize not only thevisualization of patent map, but also its interpretation andevaluation. The suggested approach to developing patentmaps relies heavily on manual work, thus restricting itsoperational efficiency. To solve this problem, our paperalso develops a web-based software system to implementthe approach proposed in this research more simply, reduc-ing the manual work involved in information extraction,and thus allowing even those who are unfamiliar with textmining or patent analysis to benefit from the research results.This article is organized as follows. After a brief introduction
of patent analysis techniques in Section 2, the overall researchprocess and detailed procedure of the proposed approach forNTC is described in Section 3. The approach is then illustratedin Section 4, with an exemplary patent database and is thenembodied within the prototype system introduced in Section 5.Finally, some limitations of current research and suggestionsfor future research are discussed in Section 6.
2. Patent analysis techniques
Patents are an ample source of technical and commercialknowledge, and thus patent analysis has long beenconsidered as a useful vehicle for R&D management.Patents possess both technical and market attributes, sincethey meet explicit criteria for originality, technical feasi-bility and commercial worth (Kuznets, 1962). However,while only few patents are developed into something ofcommercial value, most are technically significant in thatthey encourage follow-on developments in technology(Ashton and Sen, 1988). Nevertheless, patents and patent-ing activities are quite important for firms. It has beenreported that there is a positive correlation between a firms’success and the strength of its patent portfolio (Lerner,1994; Ernst, 2001; Shane, 2001). Ernst (1995, 2001) hasfound that firms that have an active patent strategy aremore successful than others that remain inactive in themechanical engineering sector. Austin (1993) has shownthat patents have a positive influence on the market valueof firms in the biotechnology sector. Therefore, patents areworth acquiring, investigating and analyzing. Moreover,patent databases are usually freely accessible in mostcounties (Daim et al., 2006) and so have advantages interms of the availability and variety of information (Parket al., 2005). Although it is known that only patents of highvalue with broad technical claims and a high citation index

ARTICLE IN PRESSS. Lee et al. / Technovation 29 (2009) 481–497 483
increase the financial value of firms (Lerner, 1994; Shane,2001), all patents have value in terms of technology develop-ment and so should be considered in analyzing their trend.
A patent document contains dozens of items for analysis,which can be grouped into two categories. The first includesstructured items, which are uniform in semantics and informat across patents (such as patent number, filing date,issued date, or assignees), while the other is composed ofwith unstructured items, meaning they are texts of contentssuch as descriptions of the invention. The visualizationresult is called patent graph if an analysis of patentdocuments is based on the structured data and patent map
if it is based on the unstructured data, but the general termpatent maps can refer to both cases (Liu, 2003).
2.1. Structured data analysis
Although different forms of patent maps have beendeveloped, most conventional ones use information ex-tracted from the bibliographic fields of patent documentto provide simple statistical results. For example, theJapanese Patent Office has been producing and providingmore than 50 types of expressions and more than 200 mapsfor several technological fields (Japan Institute of Inven-tion and Innovation (JIII), 2002), while the KoreanIntellectual Property Office has plans to create maps fordifferent technology domains over the next 5 years (Bay,2003). Many other countries such as Italy (Camus andBrancaleon, 2003; Fattori et al., 2003) and the USA(Morris et al., 2002) develop patent maps, mostly based onthe analysis of structured data from patent documents’bibliographic fields.
Likewise, patent analysis in general utilizes bibliometricdata. Bibliometrics is defined as the measurement of texts andinformation (Norton, 2001), which helps to explore, organizeand analyze large amounts of historical data in order thatresearchers can identify ‘hidden patterns’ to support theirdecision-making. Some common bibliometric tools employedon patent databases have been authors, affiliations, technol-ogy field, cluster and factor analysis, citations and so on(Daim et al., 2006), and one of the most frequently adopted iscitation analysis (Karki, 1997; Morris et al., 2001). Patentcitations are defined as the count of citations of a patent insubsequent patents, and thus citations per patent representsthe relative importance of the patent.
However, conventional patent maps, while easy tounderstand and simple to develop, are subject to somelimitations in terms of their explanatory and creativecapacity, since they only use the bibliographic fields,despite the potential utility of the description section ofpatent documents. As a result, the scope of analysis and therichness of information are limited.
2.2. Unstructured data analysis
Recognizing the shortcomings of conventional patentmaps, data mining (DM) is proposed as an alternative.
DM, also known as ‘knowledge discovery’, is a recentdevelopment for accessing and extracting information fromdatabases (Fayyad et al., 1996). DM applies machine-learning and statistical analysis techniques for the auto-matic discovery of patterns in databases, enabling themapping of scientific and technical information by assistingin the complex process of analyzing large quantities of suchinformation (Kim et al., 2008).In particular, analyzing the unstructured textual data in
patent documents has become possible thanks to thedevelopment of text mining (TM), a popular DMtechnique for handling huge amounts of unstructuredtextual documents (Kostoff et al., 2001). TM puts a set oflabels on each document, usually by attaching them tospecific words, which allows discovery operations to beperformed on the labels. The text document can then becharacterized according to the keywords extracted throughthe TM algorithm (Weiss et al., 2005). Recently, TM hasattracted increasing interest and has been actively appliedin patent analysis (Andal, 2006; Kim et al., 2008; Tsenget al., 2007a, b; Yoon and Park, 2004). For example, Yoonet al. (2002) applied TM to feature a patent by its keywordsand suggested a new map where patents are mapped intotwo-dimensional space according to the similarity of theirkeywords. Tseng et al. (2007a, b) created a patent map forthe technology domain of carbon nano-tubes based onTM. He also described a series of TM techniques includingtext segmentation, summary extraction, feature selection,term association, cluster generation, topic identification,and information mapping. Most of those techniques arebasically based on natural language processing and havebeen frequently applied to information retrieval (Fujiiet al., 2007), summarization (Tseng et al., 2005, 2007a, b;Yoon et al., 2008), technology trend analysis (Yeap et al.,2003; Yoon and Park, 2004; Yoon et al., 2002), andautomated classification applications (Schellner, 2002;Krier and Zacca, 2002; Larkey, 1999). Especially, auto-matic methods for patent classification are expected torelieve the work by human experts, which is expensive andsubjective (Fujii et al., 2007). Consequently, a number oforganizations including the The United States Patent andTrademark Office (USPTO) (Larkey, 1999), the EPO(Krier and Zacca, 2002), the JPO (Delegation of Japan,2000), INPI (Leclercq, 1999; Lyon, 1999), and Xerox (Hullet al., 2001) are tying to design and implement systems ofautomated classification of patent documents.The most important advantage of applying TM in patent
analysis is that it can handle large volumes of patentdocuments and extract some meaningful implications fromtextual data. Patent documents contain significant researchoutputs but are so lengthy that a lot of human efforts arerequired to analyze the contents. TM will assist patentengineers or decision-makers in patent analysis (Smith,2002; Tseng et al., 2005, 2007a, b). In addition, TM mightbe better than human in some areas. Tseng et al. (2005)provide that the machine-derived important categorizationfeatures might be as good as or even better than those
ARTICLE IN PRESSS. Lee et al. / Technovation 29 (2009) 481–497484
derived manually. Though software based on TM can bedifficult to make proper distinctions in others and thus maynot be acceptable for some areas where accuracy isemphasized (Smith, 2002), it is very useful at least forpre-classification and supportive information (Krier andZacca, 2002).
However, patent documents pose unique challenges toTM application. Firstly, regarding the TM algorithm, mostexiting TM software cannot consider synonyms and/or co-occurrences of keywords (Uchida et al., 2004). In addition,TM algorithm does not include compound words due tothe difficulties of determining them, which is critical toimprove the algorithm. Also, relatively large numbers ofkeywords are required to ensure a subtle distinctionbetween documents using TM (Smith, 2002). Secondly,relating to the feature of patent documents, the claims,which precisely specify the boundary of the invention andthus are valuable for TM, are generally written in arcanelegalese and thus difficult to extract technical meanings.Moreover, when the whole body of patent document isused for TM, it is not easy to distinguish texts describing‘‘prior art’’ from texts describing ‘‘the invention’’, which isessential to address the technical characteristics of theinvention (Smith, 2002). Despite those limitations, ad-vances in computer technologies are expected to increasethe efficiency and accuracy of TM, strengthening theadvantages.
In this manner, therefore, various studies have beenconducted to analyze unstructured patent information, butlittle was concentrated on applying related TM techniquesin the context of NTC or NPD. Besides, ‘interpretation’during patent processing, is relatively at the early stageof research compared to ‘information retrieval’ or‘classification’, though it is more difficult (Fujii et al.,2007). Therefore, this research adopts TM to analyze thetechnological contents of patent documents, and developsa keyword-based patent map where patents that are similarin terms of technological contents are located close to eachother, as does the existing research. However, the suggestedmap is then used as a basis for NTC and its interpretationis emphasized to maximize its use.
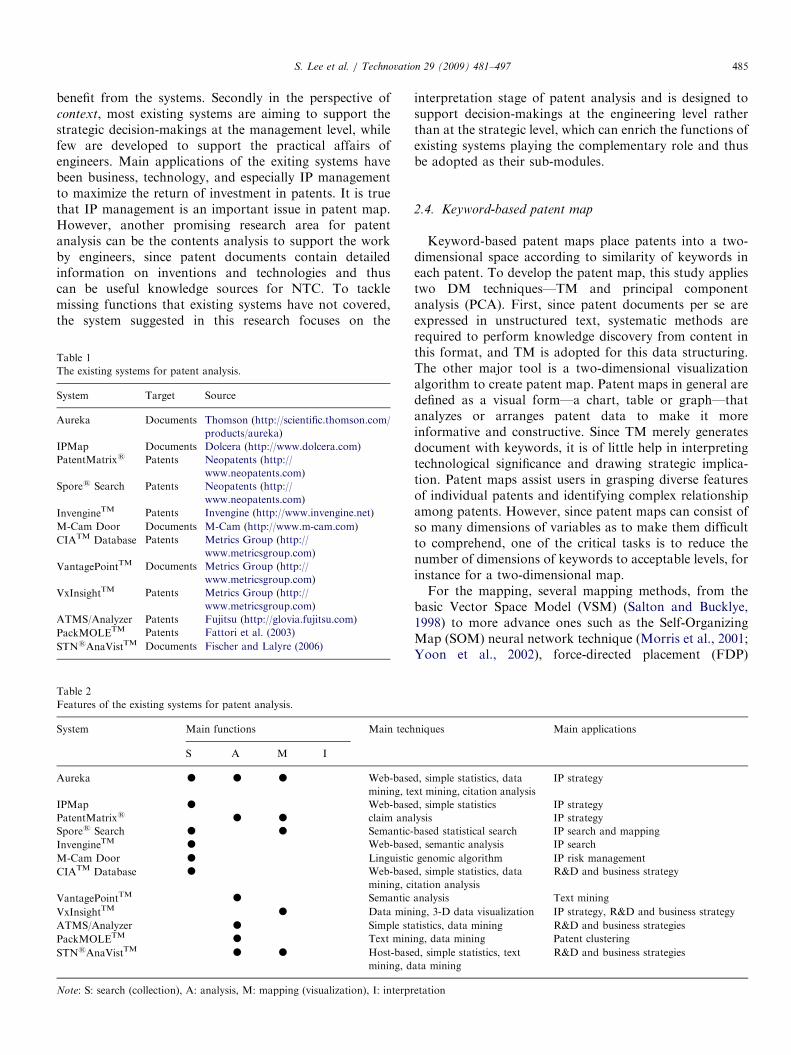
2.3. Patent analysis systems
Patent analysis to extract useful knowledge fromdatabases is usually time consuming, which requiresthousands of patents to be examined and informationclassified. Consequently, manual generation of patent mapis very costly and has a limited supply (Uchida et al., 2004).Therefore, the automation of patent map generation andanalysis is in great demand. To reflect the need, severalsoftware systems have been developed, out of which someprovide only a function to generate ‘‘patent graph’’, whilethe others adopt TM algorithm to help generate ‘‘patentmap’’ as well. To name a few, Thomson (http://scientific.thomson.com/products/aureka) has introduced its ad-vanced Intellectual Property (IP) management and analysis
system, called Aureka, which is characterized by suchfeatures as messaging, annotations, proprietary fields,alerts, themes cape mapping and hosted/local model.Neopatents (http://www.neopatents.com) has developedtwo software systems specifically designed for patent searchand analysis—one is Spores Search that optimizes thesearch process based on statistical permutations of thekeywords and the other is PatentMatrixs that providesgraphical representations of analysis results. MetricsGroup (http://www.metricsgroup.com) provides threedifferent systems useful for patent analysis: (1) CIATM
Database that is a web-enabled system to discover trendsand patterns in US patent databases; (2) text miningsoftware called VantagePointTM; and (3) VxInsightTM
developed as a visualization tool to explore patent data.Other systems have been suggested to address the specificfunction of searching, which includes IPMap (http://www.dolcera.com), InvengineTM (http://www.invengine.-net), M-Cam Door (http://www.m-cam.com). They canfunction as an IP search engine, layering onto patent andtechnology databases and enabling accurate and precisesearching with results in an effective and easy to reviewformat. Along with those efforts in practical areas,academic areas continue to struggle with problems in theautomatic generation of patent maps, increasing theeffectiveness and efficiency of algorithms applied. Forexample, Fattori et al. (2003) adopted TM technology toovercome the limits of existing patent classificationsapproaches. They suggested a bottom-up clustering appro-ach instead of a top-down classification for patentcategorization and developed the system called PackMO-LETM, though insisting those two approaches should beused in synergy. Later, not only TM but also DM wasinvestigated to gain information for strategic businessdecisions. Fischer and Lalyre (2006) developed STNsA-naVistTM using host-based analysis and visualization,where many interactive analysis and visualization optionsare available and the navigation between the individualdata elements is easy. Tables 1 and 2 summarize therepresentative systems of patent analysis with theirfeatures.As is shown in the tables, firstly in the perspective of
process, most well-known systems have focused on patentsearch, analysis, and visualization, though the utility ofsome systems are not limited to patent documents. Theyare quite useful for an effective analysis of current states ofdata and have proved their value in a real businessscenario. However, the systems concerning knowledgeinterpretation issues are rare, which can help to analyzepatent mapping results and is more difficult but essential toensure the benefits of patent mapping. Since the techniquesfor the patent analysis and mapping have developeddramatically and thus the further research should integratesome kinds of facilities for manipulating patent mappingresults and other descriptive indexes to interpret the results,to speed up the whole process and to guarantee that evenpeople who are not familiar with patent map can get the
ARTICLE IN PRESSS. Lee et al. / Technovation 29 (2009) 481–497 485
benefit from the systems. Secondly in the perspective ofcontext, most existing systems are aiming to support thestrategic decision-makings at the management level, whilefew are developed to support the practical affairs ofengineers. Main applications of the exiting systems havebeen business, technology, and especially IP managementto maximize the return of investment in patents. It is truethat IP management is an important issue in patent map.However, another promising research area for patentanalysis can be the contents analysis to support the workby engineers, since patent documents contain detailedinformation on inventions and technologies and thuscan be useful knowledge sources for NTC. To tacklemissing functions that existing systems have not covered,the system suggested in this research focuses on the
Table 1
The existing systems for patent analysis.
System Target Source
Aureka Documents Thomson (http://scientific.thomson.com/
products/aureka)
IPMap Documents Dolcera (http://www.dolcera.com)
PatentMatrixs Patents Neopatents (http://
www.neopatents.com)
Spores Search Patents Neopatents (http://
www.neopatents.com)
InvengineTM Patents Invengine (http://www.invengine.net)
M-Cam Door Documents M-Cam (http://www.m-cam.com)
CIATM Database Patents Metrics Group (http://
www.metricsgroup.com)
VantagePointTM Documents Metrics Group (http://
www.metricsgroup.com)
VxInsightTM Patents Metrics Group (http://
www.metricsgroup.com)
ATMS/Analyzer Patents Fujitsu (http://glovia.fujitsu.com)
PackMOLETM Patents Fattori et al. (2003)
STNsAnaVistTM Documents Fischer and Lalyre (2006)
Table 2
Features of the existing systems for patent analysis.
System Main functions Main tech
S A M I
Aureka K K K Web-base
mining, te
IPMap K Web-base
PatentMatrixs K K claim ana
Spores Search K K Semantic-
InvengineTM K Web-base
M-Cam Door K Linguistic
CIATM Database K Web-base
mining, ci
VantagePointTM K Semantic
VxInsightTM K Data min
ATMS/Analyzer K Simple sta
PackMOLETM K Text mini
STNsAnaVistTM K K Host-base
mining, d
Note: S: search (collection), A: analysis, M: mapping (visualization), I: interpr
interpretation stage of patent analysis and is designed tosupport decision-makings at the engineering level ratherthan at the strategic level, which can enrich the functions ofexisting systems playing the complementary role and thusbe adopted as their sub-modules.
2.4. Keyword-based patent map
Keyword-based patent maps place patents into a two-dimensional space according to similarity of keywords ineach patent. To develop the patent map, this study appliestwo DM techniques—TM and principal componentanalysis (PCA). First, since patent documents per se areexpressed in unstructured text, systematic methods arerequired to perform knowledge discovery from content inthis format, and TM is adopted for this data structuring.The other major tool is a two-dimensional visualizationalgorithm to create patent map. Patent maps in general aredefined as a visual form—a chart, table or graph—thatanalyzes or arranges patent data to make it moreinformative and constructive. Since TM merely generatesdocument with keywords, it is of little help in interpretingtechnological significance and drawing strategic implica-tion. Patent maps assist users in grasping diverse featuresof individual patents and identifying complex relationshipamong patents. However, since patent maps can consist ofso many dimensions of variables as to make them difficultto comprehend, one of the critical tasks is to reduce thenumber of dimensions of keywords to acceptable levels, forinstance for a two-dimensional map.For the mapping, several mapping methods, from the
basic Vector Space Model (VSM) (Salton and Bucklye,1998) to more advance ones such as the Self-OrganizingMap (SOM) neural network technique (Morris et al., 2001;Yoon et al., 2002), force-directed placement (FDP)
niques Main applications
d, simple statistics, data
xt mining, citation analysis
IP strategy
d, simple statistics IP strategy
lysis IP strategy
based statistical search IP search and mapping
d, semantic analysis IP search
genomic algorithm IP risk management
d, simple statistics, data
tation analysis
R&D and business strategy
analysis Text mining
ing, 3-D data visualization IP strategy, R&D and business strategy
tistics, data mining R&D and business strategies
ng, data mining Patent clustering
d, simple statistics, text
ata mining
R&D and business strategies
etation

ARTICLE IN PRESSS. Lee et al. / Technovation 29 (2009) 481–497486
(Davidson et al., 1998), Latent Semantic Indexing (LSI),have been proposed (Deerwester et al., 1990), but theirutility is limited since multi-dimensional information isdecomposed into two ‘‘unclear’’ dimensions. Correspon-dence analysis (CA) might be applied, which is one type ofPCA, yielding joint graphical displays and using acontingency table for categorical variables (Greenacre,1984). Its distinctive strength over other methods is that itproduces two dual displays, whose row and columngeometries have similar interpretations, while other multi-variate approaches to mapping do not have this duality(Theodorou et al., 2007). However, this research treats thekeyword frequency that will be the basis of mapping ascontinuous values, not as categorical values, and alsofocuses only on the relationships between documents and isnot interested in the relationships between keywords.Another is a co-occurrence based model (Sch +utze andPedersen, 1994, 1995; Uchida et al., 2004), but again, itdoes not deal with the word frequencies that may causeinformation loss. As a result, we concluded that the mostsuitable method for this research will be PCA, whosegeneral objective is data reduction by converting differentvariables into a few linear combinations (Johnson andWichern, 1998).
PCA has four main advantages over other methods.First, the meaning of axes in the two-dimensional map canbe interpreted easily and clearly since it reveals therelationship between each principal component and itsrespective variables. Second, it provides richer information,such as expressing the absolute location of each patent as anumerical value. Third, unlike the SOM technique, allpatents can be represented on a single map. Finally, we canget several PCs from the PCA results, out of which variouscombinations of two PCs generate several patent maps.Since the purpose of this research is not to map patents ona two-dimensional space accurately but to explore newopportunities through the mapping, PCA that enables todevelop several patent maps in various perspectives isjudged to be more suitable techniques.
The basic idea of our proposed approach for discoveringNTC opportunities using keyword-based patent map is asfollows. If we can excavate the latent characteristics ofpatents and locate individual patents on the map usingthese characteristics, we may be able to identify some‘vacancies’ in the map. In this context, a vacancy can bedefined as a blank zone surrounded by many existing
Phase 1. Development of patent map
Phase 2Identification of pa
Patent collection
Patent analysis
Patent mapping
Vacancy detec
Vacancy defin
Patent listin
Fig. 1. Overall process
patents. It therefore represents an as yet unexplored area,but one which may have development potential for thefuture, given the active development of adjacent areas.Such technologically undeveloped zones can have greatNTC potential, as successful occupation of such vacantareas may offer significant first mover advantages. Promis-ing opportunities for NTC may then be derived byintensively examining surrounding patents.In spite of the problems inherent in applying TM in
patent analysis, we judge that it is not so critical in thisresearch. Since the focus of this research is the technicalcontents rather than the right of the invention, we use theabstract or the whole body instead of the claims. It enablesus to eliminate the problems caused by failing to extractenough keywords to distinguish documents or havingdifficulties in analyzing a legal term of claims. Nevertheless,additional work by experts was designed to solve theproblem. For example, extracted keywords are encouragedto be reviewed by experts with domain knowledge,considering synonymies and compound words beforedetermining the final set of keywords to be used for thefurther analysis.
3. Finding new technology opportunities
3.1. Overall research framework
The overall process of our proposed approach consists ofthe following three modules—development of patent map,identification of patent vacancy, and test of vacancy validity.These major modules are each composed of several sub-modules that carry out more detailed functions. Fig. 1shows the major modules and detailed sub-modules of theoverall process.In the first phase, patents are located on a two-
dimensional map according to their technological contents.Then at the second phase, we identify patent vacanciesfrom the map, which aids the identification of anytechnologically undeveloped ‘blank zones’. The final phaseinvolves screening to identify and investigate meaningfulpatent vacancy areas: as not all will be worth investigatingfor potential new technology development, they can beclassified as either ‘fruitful’ or ‘barren’ areas. For thispurpose, two further analysis types—criticality analysis
and trend analysis—are conducted. In the criticality
. tent vacancy
Phase 3. Test of vacancy validity
tion
ition
g
Criticality analysis
Trend analysis
Feature analysis
of NTC approach.

ARTICLE IN PRESSS. Lee et al. / Technovation 29 (2009) 481–497 487
analysis, patents in areas around the vacancy (we call themadjacent patents) are examined on the basis of citation,claims and density, which may tell us whether the vacancyis technologically valuable or not. Trend analysis measuresthe percentage of keywords and classes appearing inadjacent patents that are associated with the latesttechnologies, which may tell us whether the vacancy isassociated with emerging or declining technologies. Wherethe analysis results suggest the vacancy has valuablepotential for NTC development, we recommend deeperinvestigation of patents in the adjacent areas, to see ifanalyzing, recombining and integrating the patents canidentify NTC opportunities. More detailed explanation ofthe process is provided below.
3.2. Detailed procedures
3.2.1. Development of patent map
Fist, patent map is developed through three successivesteps—patent collection, patent analysis and patent map-ping (See Fig. 2).
Patent collection: The first task is to collect patentdocuments in the specific technology field to be analyzed.Recent advances and diffusion of internet-based abstractservices allow easy access to patent databases in electronicform. Patent documents collected at this stage are unstruc-tured data, in that they are merely expressed in text format.
Patent analysis: The next step is to transform unstruc-tured the text document into structured data. A typicalpatent analysis scenario includes task identification,searching, segmentation, abstracting, clustering, visualiza-tion, and interpretation (Tseng et al., 2007a, b). Out ofthem, as described above, TM serves as a tool for analyzingrelationships among patents to be used a basis for the
Patentdatabase
Patent n (Pn)
Patent 1 (P1)
PC 1
PC 2
Patent collection
Patent mapping
Patentretrieval
P1P2
P3
P4 P5
Pn
P6
P7
P8
P9 P10
Fig. 2. Process of paten
clustering, visualization, and interpretation. Specifically,each patent will include keywords that can be used torepresent its technological characteristics. Here, how toextract keywords to be used for the analysis relies firstly onTM software and secondly experts’ judgment. TM softwarecan yield an importance of each keyword in the wholedocuments. Or the keyword frequency in the wholedocuments can be used as a proxy measure of theimportance. Then, keywords only with high importancewill be selected as the first candidates and go throughexperts’ screening. The remaining keywords after thescreening will be a final subject of analysis. Then, for eachpatent, the frequency of the keywords’ use in the patentdocumentation is assigned to a corresponding vector field,and thus each patent document can be distinguished by akeyword vector.
Patent mapping: Once the keyword vector is completed,documents are mapped to a rectangular planar surface inorder to generate the patent map. In applying PCA tocreating the map, an important task is to determine thenumber of components. While there is no definitive methodto determine the optimal number of components, thecomponents that can well-explain the variance of overallvariables are used in a business practice and usually threeor four may be sufficient to explain the majority of totalsample variance. This explanation power can be measuredby the eigenvalue of each component. In general, thecomponents whose eigenvalue is over one are regarded asprinciple components (PCs), while close to zero should beexcluded from them (Johnson and Wichern, 1998). There-fore, information loss might be a problem. To deal with it,using more than two PCs, for example, developing a three-dimensional map based on three PCs or examining severalpatent maps based on various combinations of two PCs, isencouraged.
Pn
…
P2
P1
K1 K2 K3 …Km
PC1 PC2
Pn
…
P2
P1
PC3
Ki: Keyword i
PCj: Principle Component j
Patent analysis
Textmining
PCA
t map development.

ARTICLE IN PRESSS. Lee et al. / Technovation 29 (2009) 481–497488
3.2.2. Identification of patent vacancy
After patent map is generated, the second modulefocuses on identifying patent vacancy areas through threesteps—vacancy detection, vacancy definition, and patentlisting (see Fig. 3).
Vacancy detection: As a preliminary step, the patent mapis examined to detect sparse areas, defined as relativelylarge areas where patent density is extremely low. Althoughquantitative criteria can be applied to detect possible areasfor further investigation, qualitative and intuitive judg-ments may be more flexible in terms of identifying areaswith real potential.
Vacancy definition: In general, sparse areas on patentmaps will be surrounded by many patents: however, it isunrealistic to consider all the surrounded patents, and asubset of related patents must be used to determine the‘boundary’ of the patent vacancy. The criteria for thesubset and the determination of which adjacent patents toexamine will be subjective to the investigating company,and the process is of necessity conducted manually. Forexample, if a company is conducting an exploratoryresearch to discover the NTC possibilities by and large,more information may be provided by including morepatents in adjacent patent group. Whereas, if a company isinterested in minor innovation to avoid infringement risk,restricting analysis scope to the patents directly boundingon the vacancies will give more practical solution. Analysisrange, of course, will be affected by the capability of thecompany to retrieve the patents. Once a sparse area on thematrix is detected and the surrounded patents selected, apatent vacancy is generated. It is common that a number ofvacancies can be drawn from a given patent map.
Patent listing: After developing the patent map andidentifying patent vacancies, the next step would be toinvestigate the validity of each vacancy. The validation stepis indispensable, since some vacancies may appear to befertile but turn out to be sterile in terms of the potentialvalue of surrounded patents. The validation criterion isbased on the idea that the importance of a vacancy isdetermined by some primary characteristics of thesurrounding patents. Thus, for each vacancy, the taskrequired for validation is to organize the list of patents thatare both adjacent to each other and located on the vacancyboundary.
PC 1
PC 2
P1P2
P3
P4 P5
Pn
P6
P7
P8
P9
PC 2
V1 V
Vt: Vacancy tPi: Patent i, PCj: Principle Component j
P10
Vacancy detection Vacancy definition
Fig. 3. Process of patent v
3.2.3. Test of vacancy validity
The final module is designed to test the validity of eachvacancy identified in the previous module through threesteps—criticality analysis, trend analysis, and featureanalysis (see Fig. 4).The first task for the validation is to collect primary
information for each of patents that are used to define thevacancies. The scope of information is wide and diverse,ranging from basic information (patent number, title andassignee, etc.) to more sophisticated information such asabstract, description and claim. Some of this information isused to calculate the development potentials. Amongothers, the following three indexes for criticality analysisand four indexes for trend analysis are operationallydefined. Then, based on those indexes, the vacancies tobe explored are finally determined and their technologicalfeatures are analyzed to find NTC opportunities.
Criticality analysis: Criticality analysis aims at evaluat-ing criticality of each vacancy for future NTC activities. Inthis analysis, the degree of criticality of adjacent patents ismeasured by the average frequency of citation, the averagenumber of claims, and the density of the vacancy. Firstly,citation measures how often the patent is cited in otherpatents. Since patent citations have significant relationshipwith patent value (Engelsman and van Raan, 1994; Karki,1997; Lanjouw and Schankerman, 1999), the averagenumber of citations of adjacent patents is regarded as theindicator for the importance of the vacancy. This ismeasured in the Value of Technology (VoT) index.Secondly, claim is defined as the average number of claimitems per patent. The claims specify in detail the buildingblocks of the patented invention and the number may beindicative of the scope or width of the patent (Ernst, 2003;Lanjouw and Schankerman, 1999; Park et al., 2005). Thisleads to the Scope of Technology (SoT) index, whichmeasures the average number of claim items of adjacentpatents. Finally, density is calculated as the number of alladjacent patents divided by the size of the vacancy area inthe Competition of Technology (CoT) index. A high value,which indicates keen competition between adjacent patents(Kohonen, 1995; Yoon, 2005), can hint that the vacancyarea has a rich NTC.
Trend analysis: This analysis evaluates adjacent patentsin terms of how they relate to the most up-to-date
PC 1
2
V3
PC 1
PC 2
V1 V2
V3PG1[P4, P9, …]
PG3[P5, P10, …]
PG2[P3, P6, …]
PGk: Patent Group k
Patent listing
acancy identification.

ARTICLE IN PRESS
List of meaningful vacancies
Feature
analysis
Criticality analysis
List of vacancies worth addressing
List of promising vacancies
P5, P10, …
P3, P6, …
P4, P9, …
PG VoT SoT CoT
V3
V2
V1
Vacancy LTK
P5, P10, …
P3, P6, …
P4, P9, …
PG LTC OTC OTK
V3
V2
V1
Vacancy
P3, P6, …
P4, P9, …
PG Major keywords
V3
V2
Vacancy
Trend analysis
Fig. 4. Process of vacancy validity test.
Table 3
Indexes to test vacancy importance.
Purpose Index Information
source
Definition
Significance
analysis
VoT (the degree of technological
diffusion)
Citation The average number of citations of adjacent patents
SoT (the scope of legal protection) Claim The average number of claim items of adjacent patents
CoT (the degree of technological
competition)
Number The number of all adjacent patents divided by vacancy
size
Trend analysis LTC (the latest technological contents) Abstract The percentage of patents having emerging
technological keywords out of all adjacent patents
OTC (the outdated technological
knowledge flow)
Abstract The percentage of patents having declining
technological keywords out of all adjacent patents
LTK (the latest technological knowledge
flow)
Class, citation The percentage of patents citing emerging classes out
of all adjacent patents
OTK (the outdated technological
knowledge flow)
Class, citation The percentage of patents citing declining classes out
of all adjacent patents
S. Lee et al. / Technovation 29 (2009) 481–497 489
technologies and technological knowledge flow. The first—trend analysis of technological contents—is based on theextent to which the keywords can be categorized as eitherof two types: emerging or declining keywords. A time-seriesanalysis of keyword frequency in technological documentscan show general features of technology trend (Lee et al.,2008; Yoon et al., 2008) and thus by comparing theanalysis results with technological contents in adjacentpatents of a vacancy, we are expected to measure itsimportance in terms of technology trend. In specific, thehigher the percentage of adjacent patents with emergingkeywords, and the lower the percentage with decliningkeywords, the more the vacancy reflects the latesttechnological trends. On the other hand, the second—trend analysis of technological knowledge flow—is basedon the class information. When patents are issued,classification codes are used to assign them to similartechnology groups. Here, emerging and declining classesare defined according to the rate of increase in patentapplications in these classes. If patents adjacent to a
specific vacuum are citing more patents coded to emergingclasses and fewer to declining classes, the vacancy can bejudged as reflecting the most recent flows of technologicalknowledge on the assumption that knowledge flows inpatents represent technological flows (Scherer, 1981). Forthe purpose, four indexes—Latest Technological Contents(LTC), Outdated Technological Contents (OTC), LatestTechnological Knowledge-flow (LTK), and OutdatedTechnological Knowledge-flow (OTK)—are designed tomeasure the extent to which the vacancy reflects the mostrecent technological trends. While LTC and OTC measurethe percentage of adjacent patents which have emerging ordeclining technological keywords, LTK and OTK measurethe percentage of adjacent patents citing emerging ordeclining classes. The operational definition of indexes totest vacancy importance is described in Table 3.
Feature analysis: The final task is to perform a detailanalysis of the features of those vacancies that have beenidentified as meaningful and promising. For vacancies thusselected, all keywords related to adjacent patents are
ARTICLE IN PRESSS. Lee et al. / Technovation 29 (2009) 481–497490
collected to infer their technological features and seek forsignificant opportunities for new technology development.
4. An example of approach implementation: the case of
PDA technology
In the current research, patents related to PersonalDigital Assistant (PDA) technologies are employed forillustration. The United States Patent and TrademarkOffice (USPTO) database serves as the source for collectingpatent documents. In all, 141 PDA-related patents aregathered covering the period 1996–2003. The set rangesfrom US Patent No. 5 497 339–6 516 251, but since realpatent numbers are too cumbersome for database analysisand map display, they have been given serial numbers(1–141) according to their application date. The reasonwhy PDA-related patents were selected is two-fold. First,PDA technology is suitable for monitoring trends due to itsrapid technical advancement, which facilitates the diffusionof mobile services. Second, the PDA database is of aconvenient size for mining latent information and mappingin two-dimensional space.
4.1. Patent map development
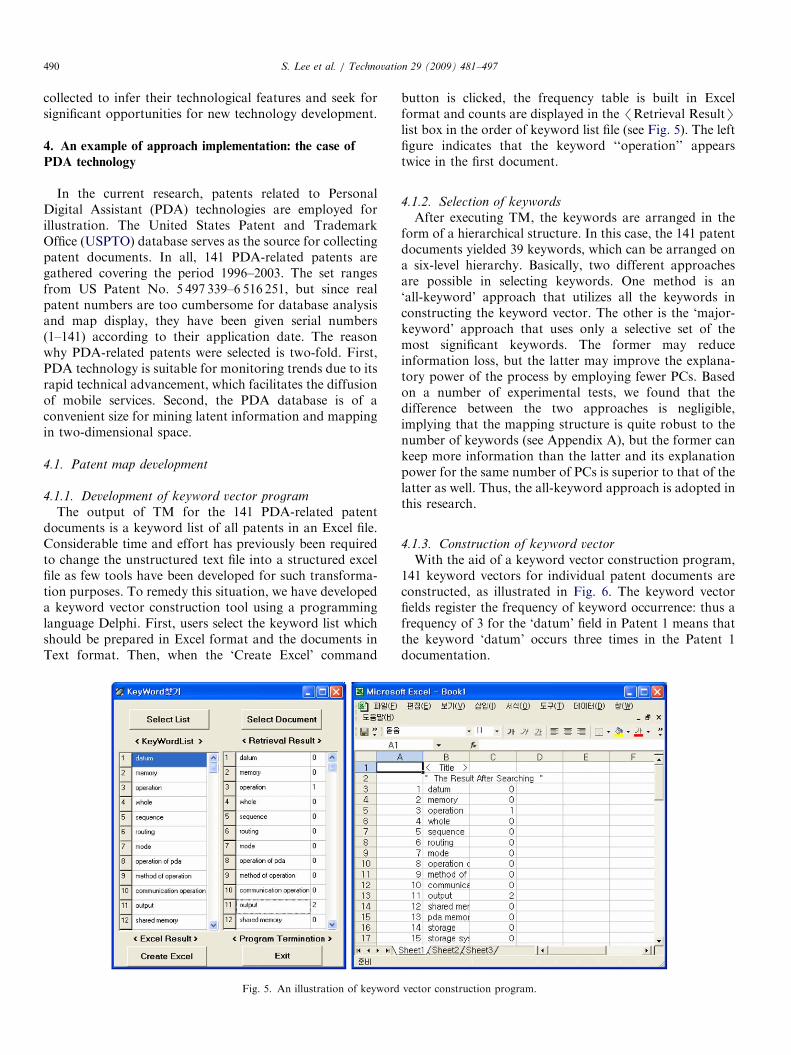
4.1.1. Development of keyword vector program
The output of TM for the 141 PDA-related patentdocuments is a keyword list of all patents in an Excel file.Considerable time and effort has previously been requiredto change the unstructured text file into a structured excelfile as few tools have been developed for such transforma-tion purposes. To remedy this situation, we have developeda keyword vector construction tool using a programminglanguage Delphi. First, users select the keyword list whichshould be prepared in Excel format and the documents inText format. Then, when the ‘Create Excel’ command
Fig. 5. An illustration of keyword
button is clicked, the frequency table is built in Excelformat and counts are displayed in the /Retrieval ResultSlist box in the order of keyword list file (see Fig. 5). The leftfigure indicates that the keyword ‘‘operation’’ appearstwice in the first document.
4.1.2. Selection of keywords
After executing TM, the keywords are arranged in theform of a hierarchical structure. In this case, the 141 patentdocuments yielded 39 keywords, which can be arranged ona six-level hierarchy. Basically, two different approachesare possible in selecting keywords. One method is an‘all-keyword’ approach that utilizes all the keywords inconstructing the keyword vector. The other is the ‘major-keyword’ approach that uses only a selective set of themost significant keywords. The former may reduceinformation loss, but the latter may improve the explana-tory power of the process by employing fewer PCs. Basedon a number of experimental tests, we found that thedifference between the two approaches is negligible,implying that the mapping structure is quite robust to thenumber of keywords (see Appendix A), but the former cankeep more information than the latter and its explanationpower for the same number of PCs is superior to that of thelatter as well. Thus, the all-keyword approach is adopted inthis research.
4.1.3. Construction of keyword vector
With the aid of a keyword vector construction program,141 keyword vectors for individual patent documents areconstructed, as illustrated in Fig. 6. The keyword vectorfields register the frequency of keyword occurrence: thus afrequency of 3 for the ‘datum’ field in Patent 1 means thatthe keyword ‘datum’ occurs three times in the Patent 1documentation.
vector construction program.
ARTICLE IN PRESS
Keyword
Patent 1
Patent 2
Patent 141
:
:
:
:
datum, memory, operation, sequence, ••• electronic datum
( 3 , 4 , 0 , 0 , ••• 0 )
( 1 , 0 , 0 , 0 , ••• 0 )
( 2 , 5 , 3 , 31 , ••• 0 )
•••••
Fig. 6. Keyword frequency vector.
2.01.91.81.71.61.51.41.31.21.11.00.90.80.70.60.50.40.30.20.10.0
-0.1-0.2-0.3-0.4-0.5-0.6-0.7-0.8-0.9-1.0
-0.6 -0.5 -0.4 -0.3 -0.2 -0.1 0.0 0.1 0.2 0.3 0.4 0.5 0.6 0.7 0.8 0.9 1.0REGR factor score 1 for analysis 1
RE
GR
fact
or s
core
2 fo
r ana
lysi
s 1
Fig. 7. An example of two-dimensional patent map.
S. Lee et al. / Technovation 29 (2009) 481–497 491
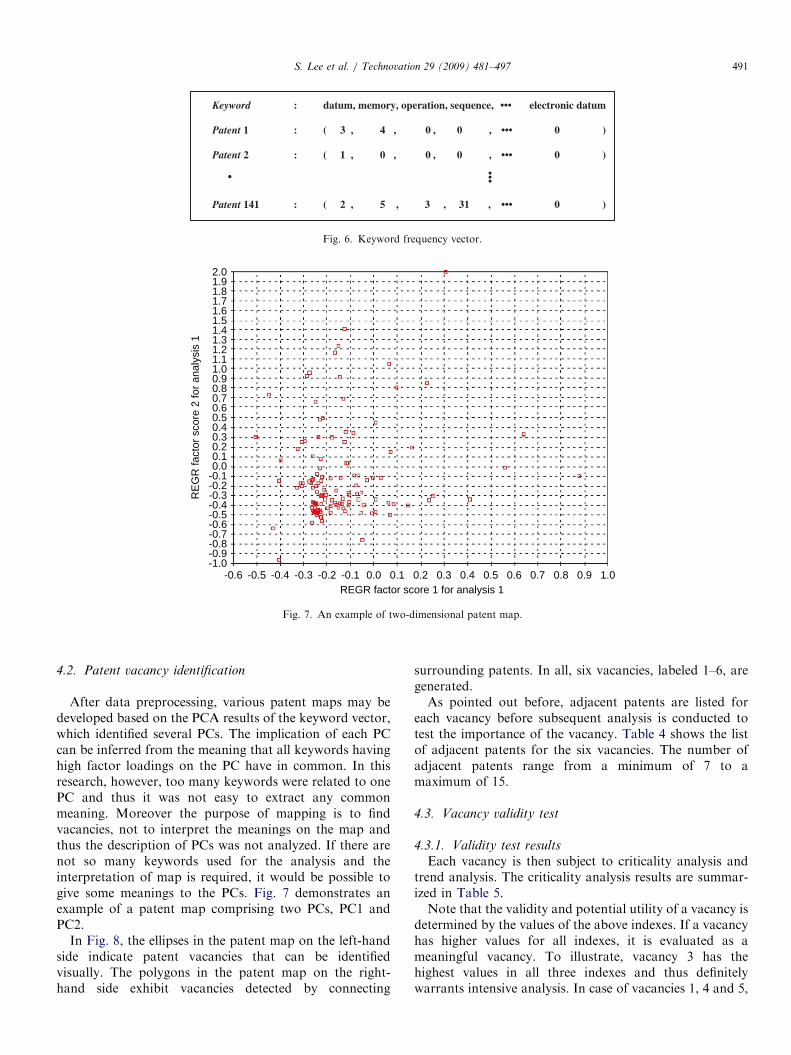
4.2. Patent vacancy identification
After data preprocessing, various patent maps may bedeveloped based on the PCA results of the keyword vector,which identified several PCs. The implication of each PCcan be inferred from the meaning that all keywords havinghigh factor loadings on the PC have in common. In thisresearch, however, too many keywords were related to onePC and thus it was not easy to extract any commonmeaning. Moreover the purpose of mapping is to findvacancies, not to interpret the meanings on the map andthus the description of PCs was not analyzed. If there arenot so many keywords used for the analysis and theinterpretation of map is required, it would be possible togive some meanings to the PCs. Fig. 7 demonstrates anexample of a patent map comprising two PCs, PC1 andPC2.
In Fig. 8, the ellipses in the patent map on the left-handside indicate patent vacancies that can be identifiedvisually. The polygons in the patent map on the right-hand side exhibit vacancies detected by connecting
surrounding patents. In all, six vacancies, labeled 1–6, aregenerated.As pointed out before, adjacent patents are listed for
each vacancy before subsequent analysis is conducted totest the importance of the vacancy. Table 4 shows the listof adjacent patents for the six vacancies. The number ofadjacent patents range from a minimum of 7 to amaximum of 15.
4.3. Vacancy validity test
4.3.1. Validity test results
Each vacancy is then subject to criticality analysis andtrend analysis. The criticality analysis results are summar-ized in Table 5.Note that the validity and potential utility of a vacancy is
determined by the values of the above indexes. If a vacancyhas higher values for all indexes, it is evaluated as ameaningful vacancy. To illustrate, vacancy 3 has thehighest values in all three indexes and thus definitelywarrants intensive analysis. In case of vacancies 1, 4 and 5,

ARTICLE IN PRESS
2.01.91.81.71.61.51.41.31.21.11.00.90.80.70.60.50.40.30.20.10.0
-0.1-0.2-0.3-0.4-0.5-0.6-0.7-0.8-0.9-1.0
-0.6
-0.5
-0.4
-0.3
-0.2
-0.1 0.0
0.1
0.2
0.3
0.4
0.5
0.6
0.7
0.8
0.9
1.0
REGR factor score 1 for analysis 1
RE
GR
fact
or s
core
2 fo
r ana
lysi
s 1
2.01.91.81.71.61.51.41.31.21.11.00.90.80.70.60.50.40.30.20.10.0
-0.1-0.2-0.3-0.4-0.5-0.6-0.7-0.8-0.9-1.0
-0.6
-0.5
-0.4
-0.3
-0.2
-0.1 0.0
0.1
0.2
0.3
0.4
0.5
0.6
0.7
0.8
0.9
1.0
REGR factor score 1 for analysis 1R
EG
R fa
ctor
sco
re 2
for a
naly
sis
1
2
1
43
6
5
2
1
43
6
5
Fig. 8. Illustrations of patent vacancies.
Table 4
List of adjacent patents for patent vacancies.
Vacancy 1 Vacancy 2 Vacancy 3 Vacancy 4 Vacancy 5 Vacancy 6
Patent list
5 675 524 5 778 256 4 083 797 5 600 841 5 704 029 5 515 305
5 687 254 5 938 721 4 612 584 5 797 089 5 742 905 5 802 275
6 016 476 5 983 073 5 526 481 5 952 994 6 034 621 5 974 334
6 049 453 6 018 724 5 606 594 6 032 255 6 169 498 6 101 562
6 137 481 6 266 612 5 699 244 6 173 310 6 189 056 6 163 274
6 308 201 6 317 718 5 819 227 6 292 186 6 343 148 6 195 589
6 457 062 6 411 899 6 168 331 6 301 551 6 403 312 6 230 303
6 459 969 6 421 235 6 198 941 6 356 956 6 233 464
6 424 369 6 244 873 6 360 172 6 247 947
6 467 088 6 270 271 6 366 898 6 262 684
6 475 146 6 305 603 6 421 232 6 334 575
6 360 172 6 363 271
6 366 450 6 393 463
6 424 369 6 516 251
6 512 515
Total number
8 11 15 11 7 14
Table 5
Criticality analysis results.
Vacancy 1 Vacancy 2 Vacancy 3 Vacancy 4 Vacancy 5 Vacancy 6
VoT 3.50 1.00 13.33 0.67 10.00 0.67
SoT 12.00 3.00 26.88 26.50 17.00 2.00
CoT 0.57 0.85 3.00 1.47 0.23 1.27
S. Lee et al. / Technovation 29 (2009) 481–497492
some of indexes show relatively high values, and thushave some potential and deserve in-depth investigation.However, vacancies 2 and 6 have relatively low values for
all indexes and seem to display little potential. Fig. 9indicates the relative importance of respective vacancies inthe map.Trend analysis is then conducted. With respect to the
trend of technological contents, emerging keywords include‘mode’, ‘store’, rom’, ‘ICMCIA’ and so on, while decliningkeywords include ‘routing’, ‘workstation’, ‘PC software’,etc., while for the technological knowledge flow trend,emerging classes include 345, 382, 435, 702, 707, 709, and712, while declining classes include 235, 365, 378, 432, and456. This trend is based on the 141 PDA-related patentdocuments. Emerging (declining) keywords are the key-words whose appearance frequency in the documents isincreasing (decreasing) and the classes where the number ofpatents applied to the class is increasing (decreasing) aredefined as emerging (declining) classes. Table 6 shows trendanalysis results giving the percentage of adjacent patentswhich have emerging/declining keywords, and which citepatents from emerging/declining classes for each vacancy.Table 7 shows the final results of the vacancy validity
tests, putting together the criticality analysis and trendanalysis results.As is shown in Table 5, those vacancies judged as critical
by the criticality analysis are not absolutely in keeping withthose identified by the trend analysis. This is becausecriticality analysis regards patent vacancies with adjacentpatents that are frequently cited and have many claim itemsas a critical, while trend analysis regards patent vacanciesthat reflect the latest technological trends as the valuableones. Since emerging areas, of course, have not yet beenexposed to development competition, it is likely thatpatents in these areas show relatively lower values forfrequency of citation and number of claims. Thus vacancy3 can be considered a critical but declining vacancy. Itmeans that its adjacent patents tend to be old ones which

ARTICLE IN PRESS
2.01.91.81.71.61.51.41.31.21.11.00.90.80.70.60.50.40.30.20.10.0
-0.1-0.2-0.3-0.4-0.5-0.6-0.7-0.8-0.9-1.0
-0.6 -0.5 -0.4 -0.3 -0.2 -0.1 0.0 0.1 0.2 0.3 0.4 0.5 0.6 0.7 0.8 0.9 1.0REGR factor score 1 for analysis 1
RE
GR
fact
or s
core
2 fo
r ana
lysi
s 1
2
1
4
6
53
Medium Value Vacancy
High Value Vacancy
Low Value Vacancy
Fig. 9. Visual identification of significant vacancies.
Table 6
Trend analysis results.
Vacancy 1 Vacancy 2 Vacancy 3 Vacancy 4 Vacancy 5 Vacancy 6
Technological contents
Emerging keywords 0.813 0.932 0.733 0.886 0.893 0.768
Declining keywords 0.344 0.523 0.323 0.364 0.250 0.268
Technological knowledge flow
Emerging classes 0.232 0.234 0.162 0.312 0.245 0.184
Declining classes 0.100 0.110 0.173 0.127 0.135 0.167
Evaluation results Emerging Neutral Declining Emerging Emerging Declining
Table 7
Final results of vacancy validity test.
Vacancy 1 Vacancy 2 Vacancy 3 Vacancy 4 Vacancy 5 Vacancy 6
Criticality analysis Meaningful Meaningless Critical Meaningful Meaningful Meaningless
Trend analysis Emerging Neutral Declining Emerging Emerging Declining
S. Lee et al. / Technovation 29 (2009) 481–497 493
involve what has have been regarded as a major technologyhitherto. If a firm wishes to develop a core competence,relying on comparatively established but newly-structuredtechnologies, and needs to avoid patent infringement,finding NTC opportunities though vacancy 3 would bebeneficial. On the other hand, vacancies 1, 4, and 5 arecharacterized as meaningful and emerging vacancies. Mostof their adjacent patents correspond to the latest techno-logical trends, and have been frequently cited, with largenumbers of claim items, and show a fairly high density. If afirms wishing to identify emerging technologies which arenot core yet but appear likely to be significant in the future,and is willing to take the risk of technology development,finding NTC opportunities through vacancies 1, 4 and 5
would be advantageous. Therefore, criticality analysis todiscover technologically valuable vacancies should becomplimented by trend analysis to provide informationon technological trend information according to thepurpose or scope of technology development envisagedby the firm conducting the analysis.
4.3.2. Feature analysis results
If the development objective is to create furtherworthwhile technology developments from existing tech-nologies, vacancy 3 is the most promising of the sixvacancies, and is selected for further analysis. This analysismay be performed in various dimensions or variables.Keywords and technical fields may be investigated from the

ARTICLE IN PRESSS. Lee et al. / Technovation 29 (2009) 481–497494
illustration. First, keywords in adjacent patents are listedto provide an outline insight into the characteristics ofvacancy 3. Since it is unnecessary to include all thekeywords in adjacent patents, only a selective set ofrepresentative keywords is picked, which is inevitably asubjective decision. In the current research, a keyword isselected if the average number of its appearances per patentis over five. Seven keywords meet the criterion, and aredisplayed in Table 8. If users want to see more keywordsrelated to the vacancy, the value can be reduced. On theother hand, if users want to see only core keywords, thevalue needs to be raised.
Second, adjacent patents are analyzed with respect tobasic properties of their technical fields. Table 9 exhibitsthe basic properties of the 15 adjacent patents, of whichfour are related to display technology, two to input/outputdevices, six to communication including telecommunicat-ing and the final three to data processing. Although these15 patents belong to somewhat different technologicalfields, they are closely related to each other in terms of their
Table 9
List of adjacent patents for Vacancy 3.
Patent
number
Title
4 083 797 Nematic liquid crystal compositions
4 612 584 Screen gravure engraving system for electromechanical
engravers
5 526 481 Display scrolling system for personal digital assistant
5 606 594 Communication accessory and method of telecommunicating
for a PDA
5699 244 Hand-held GUI PDA with GPS/DGPS receiver for
collecting agronomic and GPS position data
5 819 227 Tour schedule processor for moving bodies
6 168 331 Case keyboard
6 198 941 Method of operating a portable communication device
6 244 873 Wireless myoelectric control apparatus and methods
6 270 271 Printer for portable information processor
6 305 603 Personal digital assistant-based financial transaction method
and system
6 360 172 Generation and distribution of personalized multimedia
natural-phenomenological information
6 366 450 Hideaway integrated docking cradled
6 424 369 Electronic device having a display
6 512 515 Data compression through motion and geometric relation
estimation functions
Table 8
List of representative keywords.
Keyword Average appearance
Operation 5.47
Data 44.60
Memory 8.67
Output 5.91
Storage 8.00
Area 13.73
Processor 16.47
keyword features, which collectively locate them in thesame area on the patent map. A promising opportunity forNTC may be excavated by in-depth analysis acrossindividual patents. Clearly, the task necessitates a compre-hensive set of domain knowledge. The supports of thisapproach are limited to providing a list of patents that havea high possibility of NTC and their technology features incommon. How to create new technology based on thepatents in the list is a role of experts.
4.4. Discussions
The suggested approach is based on the two-dimensionalpatent mapping, which has several advantages over thebasic patent statistics (Englesman and van Raan, 1994).Firstly, it is easy to understand the patent data when it isvisualized in two-dimensional space rather than summar-ized just in tables. Secondly, the overall structure of thedata can be investigated in short time and the results shownin the patent map are easy to remember. Finally, the latentmeanings in the data are easy to be explored by eliminationany noise from raw data. In general, a large scale of datainevitably contains a noise, which needs to be removed toreveal the significant meanings from the data. The key-word-based patent map enables to distinguish only thenecessary information from the unnecessary data.Despite those advantages, two-dimensional mapping
may cause an information loss. However, as the ultimategoal of this research is not to visualize the patent data butto explore technological vacancies, there is less need to putall knowledge extracted from the patent documents exactlyon a two-dimensional space. On the contrary, consideringthat this research is to discover ‘‘possibilities’’ of NSC,limiting its focus only to the main information showing asignificant variance of keyword frequency would be a goodstrategy. Actually, various possibilities for NSC could beexplored from the several combinations of two PCs out ofseveral PCs extracted from the PCA results.To apply the suggested approach, a plenty of time and
efforts may be required in developing the suggested mapand analyzing the information on the map. More efficientway to save time and efforts is required to increase theutility of the approach. For the purpose, we designed asupporting system to deal with a large amount of patentdata, which was incorporated in a knowledge managementsystem (KMS) as its sub-function.1 Without the system, all
1The suggested system has also been integrated into a KMS developed
by Seoul National University over the past 5 years to address ‘KMS for
4th generation R&D’, called KNOWVATION (Park and Kim, 2006). It
divides R&D activities into three stages: strategy, execution and
evaluation. Within this structure, the suggested system for NTC functions
as a sub-module of the first stage, with the aim of identifying potential
R&D programs. The system allows a keyword-based patent map for a
specific technology field to be developed with little human effort. When
possible patent vacancies have been roughly defined by expert judgment,
the system automatically identifies adjacent patents for each vacancy and
provides vacancy validity test results, which should be reviewed by experts.

ARTICLE IN PRESSS. Lee et al. / Technovation 29 (2009) 481–497 495
the steps proposed in this research should be donemanually and thus time consuming. However, once thesystem is developed, the mapping and test results can beobtained automatically, saving time and cost significantly.Of course, user inputs are necessary to set criteria to getthose results. For example, candidates for keyword list canbe generated automatically but the final list should bedetermined by users. Similarly, candidates for adjacentpatents can be obtained automatically, but the final patentsfor subsequent analysis should be selected by users.
Therefore, it may be possible to reduce experts’ manualwork by developing a supporting system, and yet theanalysis and interpretation of experts having domainknowledge is indispensable not only during the selectionprocess of keywords or adjacent patents but also through-out the whole process of this research. In most data-miningapplications, data-mining techniques do not eliminate theneed for human input (Piramuthu, 2004). They indeedrequires experts to set the boundaries of the analysis (e.g. toprovide query to gather patent documents of concern), aprocess known as feature selection (e.g. to determine akeyword list, vacancy boundaries, or adjacent patents), andinterpret the results of the analysis (e.g. to decide finally thevacancies to be examined in detail). These are particularlyimportant when applying data-mining to patent analysis,due to the complex linguistics embedded in patent files(Fattori et al., 2003). Though large parts of patent analysiscan be automated, the role of experts must be emphasized.
5. Conclusions
This article presents a new approach for developingkeyword-based patent maps and applying them to the ideageneration phase of NTC practice. Compared to aconventional bibliographic patent map, the keyword-basedpatent map has considerable advantages in terms ofinformation extraction, visualization and analysis. Opera-tional efficiency is also enhanced, as the keyword-basedpatent map reduces the burden of manual work.
The application of patent mapping to NTC practicerepresents an unprecedented experiment, and thus accountsfor the major contribution of the current research. Theunderlying idea is to excavate the latent characteristics ofpatents from a patent map and identify some unexploredvacancies in the map. These are blank zones which aresurrounded by numerous existing patents, and whichcan be expected to provide potential for future NTC.Promising NTC opportunities can be derived by intensivelyexamining surrounding patents. Above all, the focus of thisresearch is not limited to the development of the patentmap. Rather, this research emphasizes on how to analyze,interpret and utilize the patent map to discover newtechnology opportunities that may have NTC potential,and provide an algorithm for examining this potential. Allactivities in the process that could be computerized havebeen systemized, which saves considerable time and effortin generating the map, thus giving specific practical help to
staff in charge of NTC. Also, the suggested approach canbe applied to business model patents in order to discovernew business opportunities. The same procedures can beused in identifying new business creation potential insteadof NTC potential. Although more business models andsoftware solutions are patented, they haven’t been yetanalyzed actively. Those patents can be good sources ofnew business creation and should be addressed in thefuture research.By its nature, this study is an exploratory one, and needs
more extension and/or elaboration in terms of methodol-ogy and application. Ensuing research may consider thefollowing issues among others. First, the validation ofvacancy importance should be extended. For instance,market analysis needs to be incorporated, since technicalprogress and customer needs may provide richer informa-tion for the process. Second, the whole process needs to besystemized and automated. Although we have developedan expert system and automated some elements, there isstill considerable scope for further work to enhanceoperational efficiency. Third, the validity of this approachnecessitates more testing work by employing patentdocuments from a wider range of technologies, which isindispensable for gaining external validity. In addition, realcase studies in the company setting will be required in thefuture and we are planning to continue the research.Fourth, more techniques for patent mapping, especiallyputting the information on a two-dimensional space, needto be investigated. Though PCA was adopted in this study,which was regarded as the most suitable technique, it mustbe meaningful to compare the results of PCA with those ofSOFM, CA, and possible other mapping techniques.Actually, PCA is subjected to the information loss thatmight be serious in other applications. Thorough review ofmore techniques will be helpful for increasing theeffectiveness of this approach. Finally, but most impor-tantly, the current research must be elaborated to identifyspecific meanings of PCs and extended to develop moreconcrete NTC specifications. The outcome of the currentresearch may generate a set of patents that surelycontribute to reducing the domain for exploration, butwithout actually being able to pinpoint the exact specifica-tion of new product proposal: this is a task for the future.
Appendix A. Comparisons of ‘all-keyword approach’ and
‘major-keyword approach’
All-keyword approach utilizes all keywords in construct-ing the keyword vector. Major-keyword approach, on theother hand, uses only a selective set of the most significantkeywords. The former may reduce information loss, butthe latter may improve the explanatory power in PCAresults. Major-keyword approach again can be divided intotwo types according to the way of selecting majorkeywords. Major keywords can be defined as the keywordsthat show a high frequency of appearance in the documentson the assumption that more important keywords are

ARTICLE IN PRESS
Table A1
Comparisons of approaches in terms of explanation power.
Comparison All-keyword
approach (A)
Major-keyword approach
High
frequency
(B)
High
variance (C)
Number of keywords 39 11 12
Explanation power of
4 PCs (%)
72 62 39
Table A2
Comparisons of approaches in terms of average difference of PC 1.
Comparison A–B B–C A–C
Average difference of PC 1 0.16 0.09 0.20
S. Lee et al. / Technovation 29 (2009) 481–497496
mentioned more frequently. Or they also can be defined asthe keywords that show a high variance of appearanceamong the documents because such keywords represent thetechnological features that distinguish patent documentsquite well.
For the purpose of comparisons between three ap-proaches, we conducted an experimental test in terms ofexplanation power and average difference of the first PCs.Here, the whole set of 39 keywords was used for the all-keyword approach (A), but only the 11 keywords with thehighest frequency were applied for the first major-keywordapproach (B) and the 12 keywords with the highestvariance were used for the second major-keyword ap-proach (C). The comparison results are provided in TablesA1 and A2. Table A1 shows that the four PCs extractedfrom A can still explain 72% of the sample variance, thosefrom B can guarantee 62%, and finally those from C canpreserve only 39%, which signifies that the informationloss might be serious in C. As shown in Table A2, however,the differences between approaches in terms of averagedifference of PC1 are negligible, ranging from 0.09 to 0.20.It implies that the mapping structure compared to theinformation loss is quite robust to the number of keywords.And thus, all-keyword approach is adopted in thisresearch, which is similar to other approaches in itsmapping structure but can keep much more informationthan others.
References
Abraham, B., Morita, S., 2001. Innovation assessment through patent
analysis. Technovation 21, 245–252.
Andal, M., Oyanagi, S., Yamakazi, K., 2006. Research on text mining
techniques to support patent map generation. Forum on Information
Technology, 111–112.
Ashton, W., Sen, R., 1988. Using patent information in technology
business planning—II. Research Technology Management 32, 36–42.
Austin, D., 1993. An event-study approach to measuring innovative
output: the case of biotechnology. American Economic Review 83,
253–258.
Bader, M., 2008. Managing intellectual property in the financial services
industry sector: learning from Swiss Re. Technovation 28, 196–207.
Bay, Y., 2003. Development and applications of patent map in Korean
high-tech industry. In: Proceedings of the First Asia-Pacific Con-
ference on Patent Maps, Taipei, October 29, 2003, pp. 3–23.
Campbell, R.S., 1983. Patent trends as a technological forecasting tool.
World Patent Information 5 (3), 137–143.
Camus, C., Brancaleon, R., 2003. Intellectual assets management: from
patents to knowledge. World Patent Information 25 (2), 155–159.
Chesbrough, H., 2003. Open Innovation: The New Imperative for
Creating and Profiting from Technology. Harvard Business School
Press, Boston.
Daim, T., Rueda, G., Martin, H., Gerdsri, P., 2006. Forecasting emerging
technologies: use of bibliometrics and patent analysis. Technological
Forecasting & Social Change 73, 981–1012.
Davidson, G., Hendrickson, B., Johnson, D., Meyers, J., Wylie, B., 1998.
Knowledge mining with VxInsight: discovery through interaction.
Journal of Intelligent Information System 11, 259–279.
Deerwester, S., Dumais, S., Furnas, G., 1990. Indexing by latent semantic
analysis. Journal of American Society for Information Science 41 (6),
391–407.
Delegation of Japan, 2000. OWAKE system—primary automatic
classification. WIPO Report 59, pp. 13–17. Available at /http://
www.wipo.int/classificationsS.
Dolcera website. Available at /http://www.dolcera.comS.
Englesman, E.C., van Raan, A.F.J., 1994. A patent-based cartography of
technology. Research Policy 23, 1–26.
Ernst, H., 1995. Patenting strategies in the German mechanical engineer-
ing and their relationship to company performance. Technovation 15,
225–240.
Ernst, H., 2001. Patent applications and subsequent changes of
performance: evidence from time-series cross-section analyses on the
firm level. Research Policy 30, 143–157.
Ernst, H., 2003. Patent information for strategic technology management.
World Patent Information 25 (3), 233–242.
Fattori, M., Pedrazzi, G., Turra, R., 2003. Text mining applied to patent
mapping: a practical business case. World Patent Information 25,
335–342.
Fayyad, U., Piatetsky-Shapiro, P., Smyth, P., Uthurusamy, R., 1996.
Advances in Knowledge Discovery and Data Mining. AAI Press, CA.
Fischer, G., Lalyre, N., 2006. Analysis and visualisation with host-based
software—the features of STNsAnaVistTM. World Patent Informa-
tion 28 (4), 312–318.
Fujii, A., Iwayama, M., Kando, N., 2007. Introduction to the special issue
on patent processing. Information and Process Management 43 (5),
1149–1153.
Fujitsu website. Available at /http://glovia.fujitsu.comS.
Greenacre, M., 1984. Theory and Applications of Correspondence
Analysis. Academic Press, New York.
Hanel, P., 2006. Intellectual property rights business management
practices: a survey of literature. Technovation 26 (8), 895–931.
Hull, D., Aıt-Mokhtar, S., Chuat, M., Eisele, A., Gaussier, E.,Grefenstette, G., 2001. Language technologies and patent search and
classification. World Patent Information 23, 265–268.
Invengine website. Available at /http://www.invengine.netS.
Japan Institute of Invention and Innovation (JIII), 2002. Guide Book for
Practical Use of Patent Map for Each Technology Field.
Johnson, R., Wichern, D., 1998. Applied Multivariate Statistical Analysis.
Prentice-Hall, Englewood Cliff, NJ.
Jung, S., 2003. Importance of using patent information. In: WIPO—Most
Intermediate Training Course on Practical Intellectual Property Issues
in Business. World Intellectual Property Organization (WIPO),
Geneva, pp. 10–14.
Karki, M., 1997. Patent citation analysis: a policy analysis tool. World
Patent Information 19 (4), 269–272.
ARTICLE IN PRESSS. Lee et al. / Technovation 29 (2009) 481–497 497
Kim, Y.G., Suh, J.H., Park, S.C., 2008. Visualization of patent analysis
for emerging technology. Expert Systems with Applications 34 (3),
1804–1812.
Kohonen, T., 1995. Self-organizing Maps. Springer, Berlin.
Kostoff, R., Toothman, D., Eberhart, H., Humenik, J., 2001. Text mining
using database tomography and bibliometrics: a review. Technological
Forecasting and Social Change 68, 223–252.
Krier, M., Zacca, F., 2002. Automatic categorisation applications at the
European patent office. World Patent Information 24, 187–196.
Kuznets, S., 1962. Innovative activity: problems of definition and
measurement. In: Nelson, R. (Ed.), The Rate and Direction of
Inventive Activity. Princeton University Press, New Jersey.
Lanjouw, J., Schankerman, M., 1999. The quality of ideas: measuring
innovation with multiple indicators. National Bureau of Economic
Research, 7345.
Larkey, L., 1999. A patent search and classification system. In:
Proceedings of the Fourth ACM Conference, 1999, pp. 179–187.
Leclercq, I., 1999. INPI, the Internet and electronic commerce. World
Patent Information 21, 259–265.
Lee, S., Lee, S., Seol, H., Park, Y., 2008. Using patent information for
designing new product and technology: keyword-based technology
roadmapping. R&D Management 38 (2), 166–188.
Lerner, J., 1994. The importance of patent scope: an empirical analysis.
RAND Journal of Economics 25, 319–332.
Liu, S., Shyu, J., 1997. Strategic planning for technology development
with patent analysis. International Journal of Technology Manage-
ment 13 (May), 661–680.
Liu, S.J., 2003. A route to a strategic intelligence of industrial
competitiveness. In: Proceedings of the First Asia-Pacific Conference
on Patent Maps, 2003, pp. 2–13.
Lyon, M., 1999. Language related problems in the IPC and search systems
using natural language. World Patent Information 21, 89–95.
M-Cam website. Available at /http://www.m-cam.comS.
Miller, W., Morris, L., 1999. 4th Generation R&D: Managing Knowl-
edge, Technology, and Innovation. Wiley, New York.
Morris, A., Wu, Z., Yen, G., 2001. A SOM mapping technique for
visualizing documents in a database. In: Proceedings of the IEEE
International Joint Conference on Neural Networks, Washington DC,
USA, July 2001.
Morris, S., DeYong, C., Wu, Z., Salman, S., Yemenu, D., 2002. DIVA: a
visualization system for exploring documents databases for technology
forecasting. Computers & Industrial Engineering 43 (4), 841–862.
Neopatents website. Available at /http://www.neopatents.comS.
Norton, M.J., 2001. Introductory Concepts in Information Science. ASIA,
New Jersey.
Park, Y., Kim, S., 2006. Knowledge management system for fourth
generation R&D. Technovation 26 (5–6), 595–602.
Park, Y., Yoon, B., Lee, S., 2005. The idiosyncrasy and dynamism of
technological innovation across industries: patent citation analysis.
Technology in Society 27 (4), 471–485.
Piramuthu, S., 2004. Evaluating feature selection methods for learning in
data mining applications. European Journal of Operations Research
156, 483–494.
Salamatov, Y., 1999. TRIZ: The Right Solution at the Right Time—A
Guide to Innovative Problem Solving. Insytec, Hattem.
Salton, G., Buckley, C., 1998. Term-weighting approaches in automatic
text retrieval. Information Processing & Management 24 (5), 513–523.
Schellner, I., 2002. Japanese file index classification and F-terms. World
Patent Information 24, 197–201.
Scherer, F.M., 1981. Using linked patent and R&D data to measure inter-
industry technology flows. In: Griliches, Z. (Ed.), R&D, Patents, and
Productivity. University of Chicago Press for NBER, Chicago.
Sch +utze, H., Pedersen, J., 1994. A co-occurrence-based thesaurus and two
applications to information retrieval. In: Proceedings of the RIAO ‘94
Conference.
Sch +utze, H., Pedersen, J., 1995. Information retrieval based on
word sense. In: Proceedings of Fourth Annual Symposium, 1995,
pp. 161–176.
Shane, S., 2001. Technological opportunities and new firm creation.
Management Science 47, 205–220.
Slater, S., 1993. Competing in high-velocity markets. Industrial Marketing
Management 22 (1), 225–263.
Smith, H., 2002. Automation of patent classification. World Patent
Information 24, 269–271.
Takeuchi, H., Nonaka, I., 1986. The new product development game.
Harvard Business Review 64, 137–146.
Theodorou, Y., Drossosb, C., Alevizos, P., 2007. Correspondence analysis
with fuzzy data: the fuzzy eigenvalue problem. Fuzzy Sets and Systems
158, 704–721.
Thomson website. Available at /http://scientific.thomson.com/products/
aurekaS.
Tseng, Y., Juang, D., Wang, Y., Lin, C., 2005. Text mining for patent map
analysis. In: Proceedings of IACIS Pacific 2005 Conference, May
19–21, Taipei, Taiwan, 2005, pp. 1109–1116.
Tseng, Y., Lin, C., Lin, Y., 2007a. Text mining techniques for
patent analysis. Information Processing and Management 43 (5),
1216–1247.
Tseng, Y., Wang, Y., Lin, Y., Lin, C., Juang, D., 2007b. Patent surrogate
extraction and evaluation in the context of patent mapping. Journal of
Information Science 33 (6), 718–736.
Uchida, H., Mano, A., Yukawa, T., 2004. Patent map generation using
concept-based vector space model. In: Proceedings of the Fourth
NTCIR workshop, June 2–4, Tokyo, Japan.
Urban, G., Hauser, J., 1993. Design and Marketing of New Products.
Prentice-Hall, Englewood Cliffs, NJ.
USPTO website. Available at: /http://www.uspto.govS.
Utterback, J., 1996. Mastering the Dynamics of Innovation. Harvard
Business School Press, Massachusetts.
von Hippel, E., 1986. Lead user: a source of novel product concepts.
Management Science 32, 791–805.
VxInsight website. Available at /http://www.metricsgroup.comS.
Wang, P., Cockburn, I., Puterman, M., 1998. Analysis of patent data—
a mixed Poisson-regression-model approach. Journal of Business &
Economic Statistics 16, 27–41.
Watanabe, C., Tsuji, Y., Griffy-Brown, C., 2001. Patent statistics:
deciphering a ‘real’ versus a ‘pseudo’ proxy of innovation. Technovation
21 (12), 783–790.
Weiss, S., Indurkhya, N., Zhang, T., Damerau, F., 2005. Text Mining
Predictive Methods for Analyzing Unstructured Information. Springer,
Berlin.
WIPO, 2003. Patent map with exercises (related). WIPO-MOST inter-
mediate training course on practical intellectual property issues in
business, Theme 16.
Yeap, T., Loo, G., Pang, S., 2003. Computational patent mapping:
intelligent agents for nanotechnology. In: Proceedings of the Interna-
tional Conference on MEMS, NANO and Smart Systems, 20–23 July
2003, 2003, pp. 274–278.
Yoon, B., 2005. Methodology for managing technological knowledge and
developing new technology using patent analysis. Ph.D. Thesis, Seoul
National University.
Yoon, B., Park, Y., 2004. A text-mining-based patent network: analytic
tool for high-technology trend. The Journal of High Technology
Management Research 15 (1), 37–50.
Yoon, B., Phaal, R., Probert, D., 2008. Structuring technological
information for technology roadmapping: data mining approach. In:
Proceedings of the WSEA Conference, Cambridge, UK, February
2008.
Yoon, B., Yoon, C., Park, Y., 2002. On the development and application
of a self-organizing feature map-based patent map. R&DManagement
32 (4), 291–300.