an appraisal into the potential application of big …
TRANSCRIPT

1
AN APPRAISAL INTO THE POTENTIAL APPLICATION OF BIG DATA IN
THE CONSTRUCTION INDUSTRY
SITI AISYAH ISMAIL
Universiti Teknologi Malaysia

2
NOTES: * If the thesis is CONFIDENTAL or RESTRICTED, please attach with the letter from
the organization with period and reasons for confidentiality or restriction.

iii

iv
AN APPRAISAL INTO THE POTENTIAL APPLICATION OF BIG DATA IN
THE CONSTRUCTION INDUSTRY
SITI AISYAH ISMAIL
A dissertation submitted in partial fulfillment of the
requirements for the awards of the degree of
Bachelor of Quantity Surveying
Faculty of Built Environment
Universiti Teknologi Malaysia
JUNE 2018

ii
ii

iii
iii
DEDICATION
To my late dad, Ismail Abas
Thank you for always believing in me. This is for you, Ayah.
Dearest mum, Kamariah Mohd Basri, and sisters (Sasa, Yana, Rara),
Thank you for all the endless love and support you gave me, morally and financially.
My beloved Amyrul Hafiz and dearest friends,
Thank you for always being there for me through thick and thin.
And last but not least, to myself,
Thank you for not giving up. All the hard work, sacrifices, sleepless nights, struggles,
downfalls have finally paid off!
“May Allah SWT shower His countless blessings on all of us in both worlds.
Ameen”
Love, A

iv
iv
ACKNOWLEDGMENT
My deepest appreciation goes out to all those people that had provided me with
assistance, guidance, support, and motivation for me to complete the writing of this
thesis.
First and foremost, I would like to express my gratitude to my supervisor, Dr.
Shamsulhadi Bin Bandi. I am beyond grateful with him sharing his expertise, ideas,
guidance as well as encouragement for me upon completing this thesis. Thank you for
giving me the trust to conduct this study.
I am also thankful for my respondents who are willing to spare their time
despite their busy schedule for me. They deserve a special thanks for their assistance
in providing necessary information that is required for my thesis write-up.
Last but not least, to my family and Amyrul Hafiz, thank you for your endless
support and to my dearest friends (Zulaikha, Nabila, Raihan, Najiha, Husna, Zureen
and Zati) whom struggle with me in achieving the best for our degree, may we never
forget the memories we had upon completing our studies. Finally, we’ve made it girls!

v
v
ABSTRACT
The volume of data generated by the construction industry has increased exponentially following an intense use of modern technologies. The data explosion thus lead towards the big data phenomenon which is envisioned to revolutionize the construction like never before. Like any other technologies, big data is a disruptive paradigm and inevitably will give impact to the construction industry. As the industry is refocusing towards an improved productivity, the appeal to embrace big data is certain given the value it offers. This certainly will benefit construction akin to the manufacturing and the retail industry alike. Nevertheless, a review of the literature suggested a limited coverage on the potential application of big data in construction as compared to other industries. This limits understanding of its potential, where the industry is seemingly unaware thus could not relate and extract its real value. Hence, this study aims to draw insights into the potential application of big data in the construction industry. The research objectives include: (1) to analyse the current extent of big data research in construction; (2) to map out the orientation of the current research on big data in construction; and (3) to validate the findings as the basis to identify the potential application of big data in construction. The qualitative method through a desk study approach has been carried out to attain the first two objectives. It involved a structured review process which covered articles from the online databases assisted by the NVivo software. This resulted in the theoretical orientation which was conceptualized as: (1) project management; (2) safety; (3) energy management; (4) decision making design framework; and (5) resource management. The theoretical orientation discovered from the review process form the basis for the semi-structured interviews that were held with industry personnel who have experienced big data. The outcome of the interview agreed that project management is the focused area of big data and added that the same attention should be given to resource management. Correspondingly, the findings then suggested that the potential application of big data in the construction industry can be categorized into; (1) Big data application through IoT devices; (2) Predictive model for decision-making; (3) Pricing system; and (4) Contractors’ information system. As big data is set to influence the industry, the research findings would be a catalyst for creating an awareness to support the development of big data for the construction industry.

vi
vi
ABSTRAK
Bilangan data yang dihasilkan oleh industri pembinaan telah meningkat dengan pesat berikutan penggunaan teknologi moden yang berlebihan. Ledakan data seterusnya membawa kepada fenomena data raya di mana ia dijangka untuk merevolusikan industri pembinaan. Sepertimana teknologi-teknologi yang lain, data raya merupakan sebuah paradigma yang tidak dapat dielakkan dan bakal memberikan impak kepada industri pembinaan. Memandangkan industri sedang menuju ke arah produktiviti yang lebih baik, penglibatan untuk menerima data raya pasti memberi nilai yang sewajarnya. Ini semestinya akan memberi manfaat kepada industri pembinaan sebagaimana dengan industri pembuatan dan industri runcit. Walau bagaimanapun, kajian literatur menunjukkan liputan yang terhad mengenai potensi penggunaan data raya dalam pembinaan berbanding dengan industri lain. Hal ini menghalang pemahaman mengenai potensi data raya, di mana industri kelihatan tidak sedar sehingga tidak dapat mengaitkan dan mengekstrak nilai sebenar data raya. Oleh itu, kajian ini bertujuan untuk memberi gambaran tentang potensi penggunaan data raya di dalam industri pembinaan. Objektif penyelidikan merangkumi: (1) untuk menganalisis sejauh mana penyelidikan data raya dalam pembinaan; (2) untuk memetakan arah tuju penyelidikan semasa mengenai data raya dalam pembinaan; dan (3) untuk mengesahkan penemuan sebagai asas untuk mengenal pasti potensi penggunaan data raya dalam pembinaan. Kaedah kualitatif melalui pendekatan desk
study telah dijalankan untuk mencapai objektif pertama dan kedua. Ia melibatkan proses analisis berstruktur yang meliputi artikel dari pangkalan data dalam talian yang dibantu oleh perisian NVivo. Ini membawa penemuan kepada teori arah tuju data raya yang dikonseptualisasikan sebagai: (1) pengurusan projek pembinaan; (2) keselamatan; (3) pengurusan tenaga; (4) rangka keputusan kerja reka bentuk; dan (5) pengurusan sumber. Teori arah tuju yang ditemui dari proses kajian membentuk asas untuk wawancara separa berstruktur yang diadakan bersama pihak industri yang mempunyai pengetahuan dan pengalaman berkenaan data raya. Hasil temubual bersetuju bahawa pengurusan projek merupakan fokus utama kepada applikasi data raya dan perhatian yang sama harus diberikan kepada pengurusan sumber. Sejajar dengan itu, penemuan kemudian mencadangkan bahawa potensi penggunaan data besar dalam industri pembinaan dapat dikategorikan sebagai; (1) Penggunaan data raya melalui peranti IoT; (2) Model ramalan untuk membuat keputusan; (3) Sistem harga; dan (4) Sistem maklumat kontraktor. Oleh kerana data raya dilihat dapat mempengaruhi industri, penemuan penyelidikan ini akan menjadi pemangkin untuk mewujudkan kesedaran dalam menyokong pembangunan data raya dalam industri pembinaan.

vii
vii
TABLE OF CONTENT
CHAPTER TITLE PAGE
ACKNOWLEDGMENT iv
ABSTRACT v
ABSTRAK vi
TABLE OF CONTENT vii
LIST OF TABLES x
LIST OF FIGURES xi
LIST OF ABBREVIATIONS xii
LIST OF APPENDICES xiii
INTRODUCTION 1
1.1 Introduction 1
1.2 Background of Study 1
1.3 Problem Statement 4
1.4 Research Questions 6
1.5 Research Aim and Objectives 7
1.6 Scope of Study 7
1.7 Significance of Study 8
1.8 Research Methodology 8
1.9 Chapter Outline 10
1.10 Chapter Summary 11
LITERATURE REVIEW 12
2.1 Introduction 12
2.2 Big Data Evolution 12

viii
viii
2.2.1 Big Data 1.0 (1994 – 2004) 14
2.2.2 Big Data 2.0 (2005 – 2014) 15
2.2.3 Big Data 3.0 (2015 – present) 15
2.3 An Overview of Big Data 16
2.3.1 Definition of Big Data 17
2.3.2 The V’s in Big Data 19
2.3.3 Categorisation of Big Data 22
2.4 Big Data Application in Other Industries 24
2.4.1 Banking 24
2.4.2 Healthcare 25
2.4.3 Retail 25
2.4.4 Manufacturing 26
2.4.5 Oil and Gas 26
2.5 Big Data and the Construction Industry 27
2.6 Triggering Constituents of Big Data in the Construction
Industry 28
2.6.1 Building Information Modelling (BIM) 29
2.6.2 Cloud Computing 29
2.6.3 Internet of Things (IoT) 30
2.6.4 Smart Buildings 30
2.6.5 Augmented Reality (AR) 31
2.6.6 Social Networking Services 31
2.7 Current Big Data Research in the Construction Industry 32
2.8 Chapter Summary 36
RESEARCH METHODOLOGY 37
3.1 Introduction 37
3.2 Research Design 37
3.2.1 Stage 1: Preliminary Study 40
3.2.2 Stage 2: Research Methodology 40
3.2.2.1 Desk Study 41
3.2.2.2 Semi-structured interview 41
3.2.2.3 Sampling 43
3.2.3 Stage 3: Data Analysis and Findings 44

ix
ix
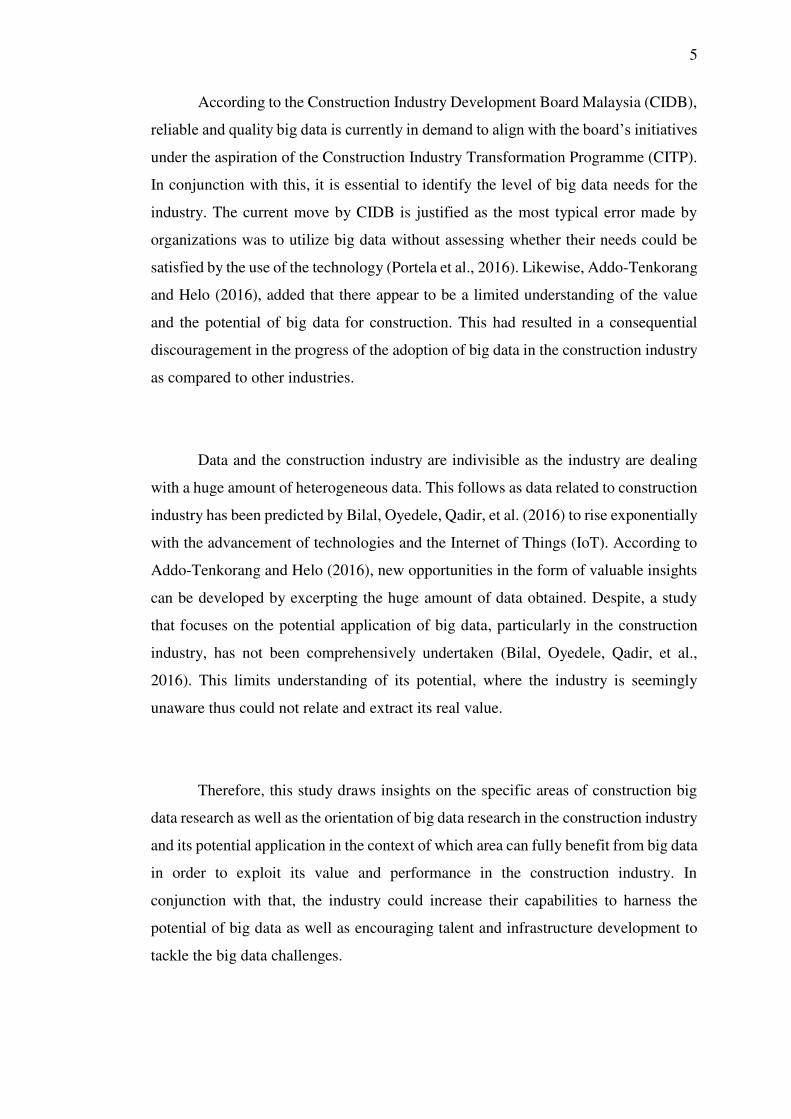
3.2.3.1 Detail Analytical Study 45
3.2.3.2 Qualitative Analysis using NVivo
Software 45
3.2.3.3 Interview Content Analysis 46
3.2.4 Stage 4: Conclusion and Recommendation 46
3.3 Chapter Summary 47
DATA ANALYSIS AND DISCUSSION 48
4.1 Introduction 48
4.2 Detail Analytical Study 48
4.2.1 Searching 49
4.2.2 Mapping Ideas and Analysis 50
4.2.3 Synthesis, Mapping, and Discussion of the
outcomes 50
4.4 Validation of the Findings 54
4.5 Respondents’ Background 54
4.6 Interview Findings 56
4.6.1 Concept of big data in the context of the
construction industry 56
4.6.2 Orientation of big data in the construction
industry 59
4.6.3 Potential application of big data in the
construction industry 63
4.7 Chapter Summary 71
CONCLUSION AND RECOMMENDATION 73
5.1 Introduction 73
5.2 Achievements of Research Objectives 73
5.3 Research Limitations 77
5.4 Recommendations for future research 78
REFERENCES 79
Appendices A - C 93 - 142

x
x
LIST OF TABLES
TABLE NO. TITLE PAGE
2.1 Definitions of Big Data from several literatures 18
2.2 Categorisation of Big Data 22
2.3 Big Data Context in the Construction Industry 27
2.4 Big Data Research from various literatures 33
3.1 Details of interview instrument 42
4.1 Detailed context of big data research area 52
4.2 Respondents’ Background 55
4.3 Respondents’ responses towards the big data concept 56
4.4 Respondents’ responses towards the big data orientation 59
4.5 Summarisation of respondents’ responses towards the big
data orientation 62
4.6 Suggested potential application of big data in the construction
industry 65
4.7 Correlation between the suggested potential applications with
the theoretical big data orientation 67
5.1 Detailed context of the suggested potential application 75

xi
xi
LIST OF FIGURES
FIGURE NO. TITLE PAGE
1.1 Data growth rate in Zettabytes 2
1.2 Personalities of Big Data 3
2.1 Summarisation of Big Data Evolution 13
2.2 Information created surpass the available storage 17
2.3 Integration between Big Data Characteristics 21
2.4 Triggering Constituents of Big Data 28
3.1 Research Methodology Framework 39
3.2 Exponential Non-Discriminative Snowball Sampling 44
4.1 Generated model representing the frequency of big data
research area 51
4.2 Generated model representing the frequency of big data
concept by respondents 58
4.3 NVivo project map on big data concept in the context of
construction industry 58
4.4 NVivo project map on big data orientation in the
construction industry 61
4.5 Generated model representing the frequency of big data
orientation by respondents 62
4.6 NVivo project map on potential application of big data in
the construction industry 64
4.7 Correlation between suggested potential applications with
the theoretical big data orientation 66

xii
xii
LIST OF ABBREVIATIONS
AI - Artificial Intelligence
AR - Augmented Reality
BD - Big Data
BIM - Building Information Modelling
CAD - Computer-Aided Drawing
CIDB - Construction Industry Development Board
CITP - Construction Industry Transformation Programme
GPS - Global Positioning System
ICT - Information and Communication Technology
IEEE - Institute of Electrical and Electronics Engineers
IoT - Internet of Things
IT - Information Technology
LEED - Leadership in Energy and Environmental Design
LOD - Linked Open Data
MGI - Mckinsey Global Institute
PC - Personal Computer
RFID - Radio Frequency Identification
SALSA - Search, Appraisal, Synthesis, and Analysis
SQL - Structured Query Language
UTM - Universiti Teknologi Malaysia
VR - Virtual Reality
WWW - World Wide Web

xiii
xiii
LIST OF APPENDICES
APPENDIX TITLE PAGE
APPENDIX A Interview questions form 93 - 97
APPENDIX B Interview Transcript 98 - 128
APPENDIX C Published article in IJBES 129 - 142

xiv
xiv
CHAPTER 1 INTRODUCTION
CHAPTER 1
INTRODUCTION
1.1 Introduction
This chapter delves into the background of the study, the issues identified, the
research questions, aim and the objectives of the study. A brief methodology is then
presented and ends by the organization of the study.
1.2 Background of Study
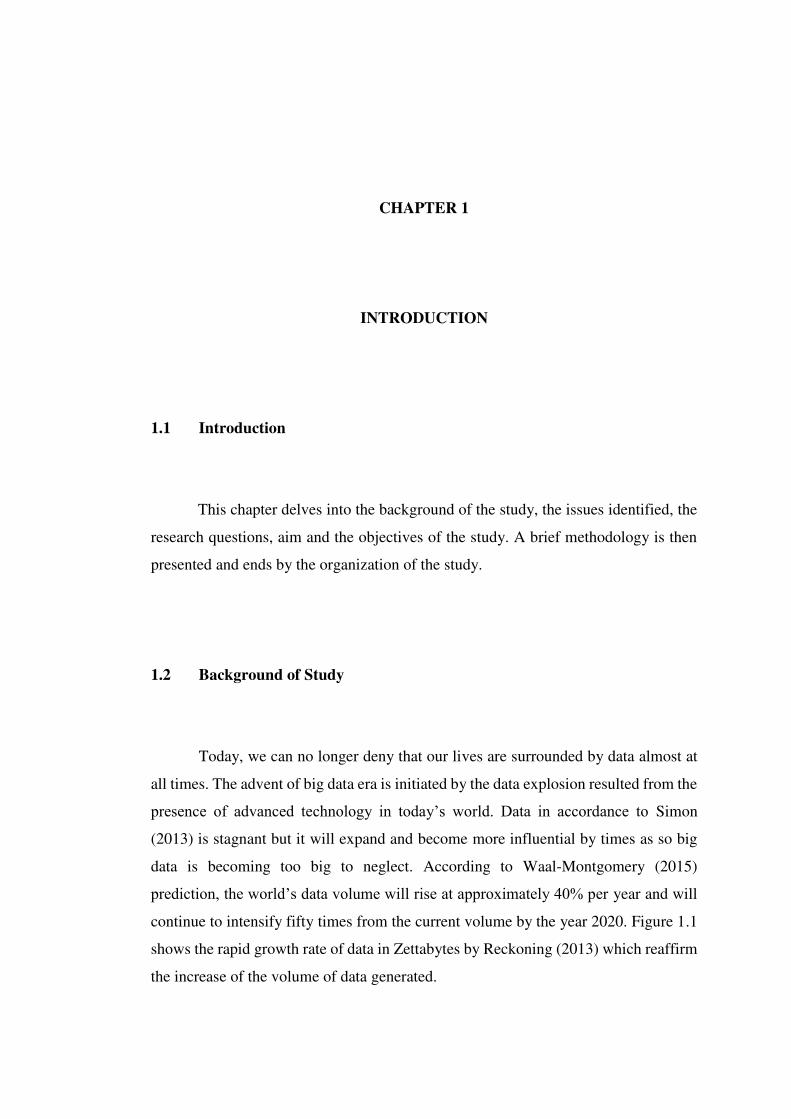
Today, we can no longer deny that our lives are surrounded by data almost at
all times. The advent of big data era is initiated by the data explosion resulted from the
presence of advanced technology in today’s world. Data in accordance to Simon
(2013) is stagnant but it will expand and become more influential by times as so big
data is becoming too big to neglect. According to Waal-Montgomery (2015)
prediction, the world’s data volume will rise at approximately 40% per year and will
continue to intensify fifty times from the current volume by the year 2020. Figure 1.1
shows the rapid growth rate of data in Zettabytes by Reckoning (2013) which reaffirm
the increase of the volume of data generated.

2
2
Figure 1.1: Data growth rate in Zettabytes
Source: Reckoning (2013)
Big data has been buzzing among many industries around the world on its
potential in dissolving most of the industries’ common issues and transform them into
a smarter way of operating. The pace at which data is being generated has lead towards
data explosion hence big data gain its traction. Basically, big data is often termed based
on the 3Vs namely (i) Volume - amount of the data itself, (ii) Velocity – the speed
where the data is generated and (iii) Variety – the diversity and complexity of data
sources.
A model made by Elragal (2014) shows that the characteristics of big data
involve two additional attributes that are Veracity and Value. Elragal (2014) defines
Veracity as the accuracy of the data as the resources where the data is obtained from
should be precise and the security should also be assured. On the other hand, Value is
explained as the process of the product of the data generally described as information
is enriched as well as the information should be generated after all of the procedures
take place. As it is the major aim in the big data technology (Emani, Cullot, & Nicolle,
2015), it is included to the V’s of big data.

3
3
Figure 1.2: 5 Personalities of Big Data
Source: (Elragal, 2014)
The significance of the additional attributes of Veracity is because of the arising
issues regarding the trustworthiness of the data (Yaqoob et al., 2016). On the other
hand, Value is added as in order to harness the benefits of big data, one must have the
insight on the worth of big data (Yaqoob et al., 2016). This is supported by a study
from Portela, Lima, and Santos (2016) that include Veracity and Value into the big
data personalities that stressed out on the quality of information presented in terms of
its worthy and reliability.
The construction industry is considered as the sector which responsible towards
all development projects in the world. There are a vast amount of data being generated
from the great number of resources for the construction projects. This includes both
written and graphic information produced at every construction stages, from planning
towards the project completion Shrestha (2013). Additionally, the rises of big data in
construction industry is also triggered by the digitalized revolution such as the
introductory of Building Information Modeling (BIM), Internet of Things (IoT), Smart
Buildings and others which adds to the tremendous amount of data growth (Bilal,
Oyedele, Qadir, et al., 2016). Other than that, the technological change in the
construction industry has also given impact towards the invaded of big data into the
industry. The data that are generated from the technology used in the construction
BIG DATA
Volume
Veracity
Value
Velocity
Variety

4
4
industry reflects the 3Vs of big data basic concept and the utilization of these data
could be the next frontier for construction industry development.
1.3 Problem Statement
Peiffer (2016) asserted big data as one of the significant driving factors in
configuring the direction which should lead towards improving the industry’s
efficiency. Though the construction industry is acknowledged as one of the indicators
for economic well-being, productivity and efficiency are at an all-time low which
Harenberg (2017) sorely contended in comparison to when it was in the year 1993.
This inefficiency, according to Santiago Castagnino, Christoph Rothballer, and
Gerbert (2016) was the result of the slow movement made by the industry in adopting
new technologies. This is supported by the MGI’s digitization index that put
construction sector as the least digitized industry in the world. Santiago Castagnino et
al. (2016) added the deliberate changes made by the industry is caused by the
insufficient data-driven decision making.
Data is said to be the poster child in enhancing the industry’s productivity. This
follows as a real-time data exchange could lead to a broadened insight into the
industry’s operational performance thus making way for a smarter working (Peiffer,
2016). However, albeit of the massive amount of data that is generated in the
construction industry, the big data is usually siloed and not being fully utilized for a
bigger picture. According to Burger (2017), the inefficiencies of data usage is due to
the limited ability in dealing with unstructured data such as free text, images or sensors
reading. This is where big data could be the saviour in improving the utilization of
data.
5
5
According to the Construction Industry Development Board Malaysia (CIDB),
reliable and quality big data is currently in demand to align with the board’s initiatives
under the aspiration of the Construction Industry Transformation Programme (CITP).
In conjunction with this, it is essential to identify the level of big data needs for the
industry. The current move by CIDB is justified as the most typical error made by
organizations was to utilize big data without assessing whether their needs could be
satisfied by the use of the technology (Portela et al., 2016). Likewise, Addo-Tenkorang
and Helo (2016), added that there appear to be a limited understanding of the value
and the potential of big data for construction. This had resulted in a consequential
discouragement in the progress of the adoption of big data in the construction industry
as compared to other industries.
Data and the construction industry are indivisible as the industry are dealing
with a huge amount of heterogeneous data. This follows as data related to construction
industry has been predicted by Bilal, Oyedele, Qadir, et al. (2016) to rise exponentially
with the advancement of technologies and the Internet of Things (IoT). According to
Addo-Tenkorang and Helo (2016), new opportunities in the form of valuable insights
can be developed by excerpting the huge amount of data obtained. Despite, a study
that focuses on the potential application of big data, particularly in the construction
industry, has not been comprehensively undertaken (Bilal, Oyedele, Qadir, et al.,
2016). This limits understanding of its potential, where the industry is seemingly
unaware thus could not relate and extract its real value.
Therefore, this study draws insights on the specific areas of construction big
data research as well as the orientation of big data research in the construction industry
and its potential application in the context of which area can fully benefit from big data
in order to exploit its value and performance in the construction industry. In
conjunction with that, the industry could increase their capabilities to harness the
potential of big data as well as encouraging talent and infrastructure development to
tackle the big data challenges.

6
6
1.4 Research Questions
Based on the problems and issues highlighted, this study attempts to answer
the following questions:
i. What is the current extent of big data research in the construction
industry?
This research question will provide an indication of the area of
literature coverage on big data, particularly in the construction industry.
ii. What is the orientation of big data research in the construction industry?
This research question will provide an indication on the direction or
trends of big data in the construction industry.
iii. In relation to research question 2, what are the potential application of
big data in the construction industry?
This research question will provide an indication on the potential
application of big data in support of the construction industry
development.

7
7
1.5 Research Aim and Objectives
This study aims to draw insights into the potential application of big data in the
construction industry thus the main objectives have been set as follows:
i. To analyse the current extent of big data research in the construction
industry.
ii. To map out the orientation of the current research on big data in the
construction industry.
iii. To validate the findings as the basis to identify the potential application
of big data in the construction industry.
1.6 Scope of Study
The focus of the study circulated on the current extent to which the construction
industry has engaged with big data. Thus, the scope of this research includes both
theories on the area of big data itself as well as the insight of real big data application
in the construction industry. For the first and second research objectives, it covered
articles on big data in the construction industry from the online database. Furthermore,
the third research objectives emphasized on the potential application of big data in the
construction industry based on the trends identified. The trends then were validated
through the interview with the industry’s personnel who has extended knowledge on
big data.

8
8
1.7 Significance of Study
As big data is set to influence the industry, the research findings would be a
catalyst for creating the much-needed awareness to support the development of big
data for the construction industry. This would further lead the industry to gear up in
developing their capabilities in harnessing the potential of big data as well as
encouraging talent and infrastructure development to engage in the forthcoming wave
of big data technology in the construction industry.
1.8 Research Methodology
A structured and well-defined framework is the key to achieve the
research objectives. The research methodologies used in conducting this study
are as followings;
First Stage.
Preliminary study on the proposed research area was made for further
understanding on the topics in order to formulate the problem statement,
research questions, and objectives as well as its significance and scope of the
study.
Second Stage.
The second stage mainly focused on literature review where all the secondary
sources of knowledge or information regarding big data research in the
construction industry such as books, journal papers, online articles or e-news,

9
9
and organization website were extracted to develop a further understanding on
the topic.
Third Stage.
This stage emphasized the research methodology that was used to achieve the
research objectives. For the first and second objectives, the best sources used is
through the secondary data which includes journal papers, articles, and
organization website. Next, data collection for the third objective was obtained
through a semi-structured interview with the industry’s personnel who has
extended knowledge on big data.
Fourth Stage.
At this stage, all data and information gained from the data collection (third
stage) were analysed and synthesized in order to resolve the research objectives.
Detail analytical study was used in attaining the first objective and for the second
objective, qualitative analysis through NVivo software was adopted to highlight
the trends. Last but not least, the content obtained from the interview was
analysed to achieve the third objective.
Fifth Stage.
Based on the data analysis output in the fourth stage, all the research questions
and objectives are resolved and the overall conclusion was made as well as
recommendations for further research were proposed in the fifth stage.

10
10
1.9 Chapter Outline
Chapter 1 – Introduction
Chapter 1 is focused on the introductory of the research topic which includes
the issues as well as problem statement on big data particularly in the
construction industry, the research objectives, its significance and scope of the
study. This chapter discloses generally about big data and its involvement in
the construction industry.
Chapter 2 – Literature Review
In this chapter, it will review the literature readings made from the secondary
sources such as books, journal papers, articles and others in order to expand
the understanding of the topic. Literature reviews include the overview of big
data and its connection with data in the construction industry, trends in the
construction industry that trigger the advent of big data, big data application
across other industries and further dive into the current research of big data
application in the construction industry.
Chapter 3 – Research Methodology
Chapter 3 emphasized the research method used in collecting as well as
analysing the data. For this study, the data collection is made through both
primary (interview) and secondary sources (journals, articles, books, etc). The
data analysis is further explained in the next chapter.

11
11
Chapter 4 – Data Analysis
All data and information collected in the previous chapter are analysed in
chapter 4. The data analysis adopted in this study to attain the research
objectives includes detail analytical study, qualitative analysis via NVivo
software and interview content analysis.
Chapter 5 – Conclusion and Recommendations
Last but not least, the outcome of the analysed data is concluded and
recommendations are proposed for further enhancement of the research topic
in this chapter.
1.10 Chapter Summary
In conclusion, this chapter has discussed briefly the background study with
emphasis on the problem statement. This chapter also serves as a guideline for the
entire following research activities. The next chapter will present reviews on the
previous literature in order to provide an overview of previous studies and theories
which are relevant to the research.

CHAPTER 2 LITERATURE REVIEW

CHAPTER 2
LITERATURE REVIEW
2.1 Introduction
Chapter 2 disclosed on the literature review regarding the overall context of big
data, a pinch of its arrival, its concept as well as the relationship with data in the
construction industry. Firstly, this chapter will present the introductory of the big data
evolution followed by an overview of big data. Secondly, it will go further to the
application of big data across other industries. Then, it started with the correlation
between the big data concept and data in the construction industry before dive further
into the emerging trends in the construction industry that trigger big data followed by
the current big data research made in the construction industry.
2.2 Big Data Evolution
Back to the early 1950s, the introductory of the first commercial mainframe
computers has triggered the activity of collecting and keeping huge amounts of data.
The data is highly structured and been used as an operational and information systems

13
13
support (Lee, 2017). Generally, Information Technology (IT) and big data have a
forceful relationship as in according to Press (2013), Personal Computer (PC) was the
main contributor to the data growth as well as responsible for digitization. As for
example, computer networks were capable to shift the manual process of creating a
memo using a typewriter and assuring the message generation. This causes data
generated, stored, transferred and consumed to increase excessively.
Figure 2.1: Summarisation of Big Data Evolution Source: (Lee, 2017)
Figure 2.1 shows the stages of big data revolution from the 1990s to present
where it was initially triggered by the advent of World Wide Web (WWW). The
development of World Wide Web is seen as the carrier to the digitization of almost
every human activities thus responsible for the upswing amount of data created (Press,
2013). According to Viktor and Kenneth (2013), before the arrival of big data due to
the scarcity of data and costly process in collecting it. The decision was made based
on hypotheses guided by theories where data were gathered and correlation analysis
was conducted to certify the suitability of the proxies hence contributed to the slow
The advent of World Wide Web in the early 1990s
Big Data 1.0 (1994-2004)
- The appearance of e-commerce
- The development of web mining techniques
Big Data 2.0 (2005-2014)
- The arrival of Web 2.0 and social media
Big Data 3.0 (2015-present)
- Includes both data from Big Data 1.0 and Big Data 2.0
- The Internet of Things (IoT) as the major contributor

14
14
process of data growth. As data is increasing remarkably, the usage of hypotheses as
decision-making means was no longer adequate hence the importance of the big data
to evolve.
2.2.1 Big Data 1.0 (1994 – 2004)
As stated in Figure 2.1, Big Data 1.0 was initially set off by the advent of World
Wide Web or called as Web 1.0 where it was a read-only web through internet
browsing without any allowance for the users to interact with the web content (Nath,
Dhar, & Basishtha, 2014). Lee (2017) said that users only have a minor contribution
to the web content due to the limited web applications. Thus, it gives rise to the
development of e-commerce where the web content was generated by the online firms.
It is the initial stage of Web 1.0 where business firms leveraged the power of basic
internet technologies to establish a web presence, building capacity to process large
data conducive to their efficiency improvements (Provost & Fawcett, 2013). This is
driven by the development of web mining techniques where it enables the users’ online
activities being monitored and analysed.
According to Lee (2017), web mining techniques can be sorted into three
categories. The first one is web usage mining where it enables the provision of
personalized services based on the users’ browsing style captured. Secondly, web
structure mining will elucidate the links and website structures. The third techniques
are the web content mining which involved the extraction of valuable information or
knowledge from the web content. However, in the Big Data 1.0 era, there were
limitations in the application of these techniques.

15
15
2.2.2 Big Data 2.0 (2005 – 2014)
As Big Data 1.0 is related to Web 1.0, the age of Big Data 2.0 was in
conjunction with the arrival of Web 2.0 and social media phenomenon Lee (2017).
Web 2.0 as stated by (Nath et al., 2014) is an advanced way of using the present
internet technologies. As compared to the one-way communication of Web 1.0, Web
2.0 enables the users to interact and contribute to the web content. For Web 2.0, the
web page contents such as text, video, and photo were generally produced by its users
itself (Cormode & Krishnamurthy, 2008). This is complementary to the existing of
social media where it has been propulsive to the Big Data Revolution where Simon
(2013) describes Web 2.0 as ‘the social web’.
In this era, the web mining techniques developed in Big Data 1.0 is supported
by the social media analytics where human behaviours on social webs were analysed
and interpreted. This gives vision as well as drawing assumption based on the users’
interests, web navigating styles, feelings or thoughts as well as their expertise (Lee,
2017). Additionally, the usage of social media rose from the expansion of social
networks platform. As according to Simon (2013) wider networks and platform
supplement the users capacity on networks hence the data grows remarkably. This
further leads to the vast amount of unstructured data by social media and represents
the big data.
2.2.3 Big Data 3.0 (2015 – present)
Big Data 3.0 includes both data from Big Data 1.0 and Big Data 2.0 and is
driven mainly by the Internet of Things applications. Internet of Things or familiarly
called as IoT is referred as the interactions of daily things, which regularly include the
ubiquitous intelligence (Xia, Yang, Wang, & Vinel, 2012). Lee (2017) defines IoT as
an innovation in which gadgets and sensors have a particular identifier with the

16
16
capacity to share information and interact over the internet-deprived of the human
interference. Moreover, according to Schwab (2017), the tipping point of IoT is the
amount of sensors connected to the internet that is now has reached 1 trillion. Given
this point, the linked gadgets and sensors are said to outweigh the web-based social
networking and e-commerce sites as the initial sources of big data (Lee, 2017).
In addition, one of the remarkable cases of machine-speed produced
information that could be gathered and dissected is the radio frequency identification
(RFID) (Zikopoulos, Parasuraman, Deutsch, Giles, & Corrigan, 2012). The RFID is
shifting the world to be considerably more instrumented and interconnected. The IoT
can create big data as the volume of data inferable from IoT is considerable. As sensors
collaborate with the world, RFID, for instance, will produce enormous volumes of data
in an exceptional velocity compared to the traditional way of data capturing (O'Leary,
2013). Consequently, this pushes the Internet of Things to generate big data.
2.3 An Overview of Big Data
With the arrival of big data, data will no longer be viewed as stagnant whose
worth is limited to the accomplishment of its gathering purposes (Viktor & Kenneth,
2013). Whereas, in order to cross the boundary of data collecting purposes, the data
need to be handled by means of advanced technologies and human skills as well as
data entry base. However, according to Akbar (2017), the current amount of digital
information had surpassed the ability of the present tools to process it. Figure 2.2
shows the gap between the information created and the availability of storage
illustrated by IDC.

17
17
Figure 2.2: Information created surpassed the available storage
Source: (IDC, 2009; Cukier, 2010)
Cukier (2010) in a special report titled Data, data everywhere uses the chart
from Information Data Centre to highlight the state of data growth which is faster than
the network capability to support it all. He also highlighted that although there has
been a plenty of tools to gather, process and convey information such as sensors,
computers, and advanced gadgets, data generated has outstripped the available storage
space. This situation is described as “The Industrial Revolution of Data” by Joe
Hellerstein, a computer scientist at the University of California in Berkeley and it has
affected various public and private sectors (Cukier, 2010).
2.3.1 Definition of Big Data
Generally, there is no official agreement on the actual definition of big data as
there are various translations of the term in different literature. Part of the definitions
extracted from several literatures are as in Table 2.1.

18
18
Table 2.1: Definitions of Big Data from several literatures
Source: As shown
No Authors Definition
1 (Manyika et al.,
2011)
“Big Data is a set of massive data quantity that the
technological capacity is unable to support the process of
storing, running and operating it”
2 (Mills et al.,
2012)
“Big Data is the hi-tech, high velocity, high-volume,
unpredictable and varieties of data to be collected, stored,
delivered and processed”
3 (I. Gartner, 2014) “Big Data is characterized as high volume, high speed as
well as high variety data resources that need a new way of
operation to improve decision making, understand
revelation and process development”
4 (Hashem et al.,
2015)
“Big Data is the group of techniques and technologies where
its new structures are incorporated to extract the values in
variety, complex and high volume data collections”
5 (Whitehorn,
2012)
“Big Data is the data which is not well suited to be fit into
tables and reacts inadequately to control by Structured
Query Language (SQL)”
6 (C. P. Chen &
Zhang, 2014)
“Big Data is a set of the vast volume of complex data that is
unmanageable efficiently by the cutting edge of data
processing technologies”
7 (O'Leary, 2013) “Big Data represents the skyrocketed volume of data
created, the endeavours in enabling it to be analysed and
utilize the value in order to enhance productivity,
technologies advancement and decision making”
8 (K. Davis, 2012) “Big Data is a high volume of data to deal with and analysed
by conventional database protocols such as Structured
Query Language (SQL)”
9 (Koseleva &
Ropaite, 2017)
“Big data is a set of data that are terabytes to petabytes and
even reached exabytes and the gigantic volume of data
surpass the ability for a normal database software to process
them adequately”

19
19
Despite the fact that there is no certain description to actually define big data,
there are few keywords that can be grasped from the definitions mentioned in Table
2.1. Essentially, there is a connection between most of the definitions and it can be
concluded based on the authors’ ideas. It can be said that big data is broadly portrayed
by the 3Vs which are Volume, Velocity, and Variety of data which today’s technology
is incapable of processing it.
2.3.2 The V’s in Big Data
The renowned 3Vs characteristics which form the big data concept were
established by one of the Gartner analyst named Laney Doug in 2001. Respectively,
the Gartner’s IT Glossary defined big data as a high-volume, high-velocity and/or
high-variety information assets that demand cost-effective, innovative forms of
information processing that enable enhanced insight, decision making and process
automation (I. Gartner, 2014).
Definition of big data might varies in different literature, but the domain of the
concept is the 3Vs characteristics. Volume is the most important characteristic that
represents the extent of big data magnitude. According to C. P. Chen and Zhang (2014)
volume is epitomized as the size of the data itself that is generated by the advanced
technologies, networks and human interactions especially on the nets (Hammer,
Kostroch, & Quiros, 2017).
On the other hand, velocity signifies that data is produced at a remarkably high
speed which outstrips the conventional systems (Zikopoulos et al., 2012). Data
velocity is regarded as a supplementary to data volume as greater data volume requires
the data processing to be winged (Özköse, Arı, & Gencer, 2015). As Gartner (2015)
has profoundly predicted, there will be as much as 20.8 billion connected devices by
the year 2020 as compared to 6.4 billion as reported in 2016. This shows that the pace

20
20
of data velocity will continue to speed up following the connected devices’ enhanced
features for data streaming (Lee, 2017).
Last but not least is variety which means the diversity and complexity of data
categories and sources (Zikopoulos et al., 2012). According to Özköse et al. (2015),
data may be derived from various resources both internally and externally. Similarly,
O'Reilly (2014) emphasized in his book that these data come from an assortment of
structures and it is often hard to obtain an impeccably, processing-ready data. Such
data can be categorized into structured, semi-structured or unstructured data. This
classification of data is derived from the existence of the social network, sensors,
mobile devices, GPS and other technological appliances (Portela et al., 2016).
Additionally, as data grows vastly and rapidly, it raises the concerns on the
quality of information obtained. With this in mind, Zikopoulos et al. (2012) added two
more V’s namely, Veracity and Value to the big data concept. Veracity is much related
to the accuracy, consistency, and reliability of the data. The various sources of data
production give the challenge to ensure its trustworthiness (Zikopoulos et al., 2012).
In order to address this, Özköse et al. (2015) suggested that the data sources should be
extracted from an authorized resource with the provision of its security. In short, the
data should only be accessible with permission.
Value as according to Zikopoulos et al. (2012) is the big data potential in
providing an added value to the enterprise’s technology in terms of cost benefits. In
fact, the value is the primary aim of big data technology (Emani et al., 2015).
Correspondingly, value basically means the worth of hidden bits of knowledge in big
data (C. P. Chen & Zhang, 2014). Thus, Lee (2017) underlined that in order to fully
utilized the benefits of big data, firms need to understand the significance of applying
big data towards their revenue, operational costs and services.

21
21
Over time, the list of V’s continues to expand as big data has a forceful
connection towards most of the digital innovations in this big data 3.0 era which
includes artificial intelligence (AI), data science and the Internet of Things (IoT)
(Marr, 2017). Variability is added by SAS (2013) referred as a variation of speed for
data streaming. In conjunction with the rising of data velocity and variety, data streams
may change unpredictably. Apart from that, as big data are produced by changing
technology or business situations, it could prompt invalid results as well as to delicacy
in big data as data source hence Hammer et al. (2017) developed the next V named
Volatility.
Other than that, as proposed by (Özköse et al., 2015), big data does not really
necessary depends on the volume but also consider the data complexity. SAS (2013)
also highlighted complexity as the dimension of big data due to the high-variety of big
data sources hence complicate the gathering, storing and analysing the process of the
heterogeneous data. Last but not least, in recent research by Lee (2017) on the big data
dimension, he proposed additional features called Decay that denote the deteriorating
of the data value in future. Figure 2.3 shows the integration between all of the big data
characteristics that have been discussed.
Figure 2.3: Integration between Big Data Characteristics
Source: (Hammer et al., 2017; Laney, 2001; Lee, 2017; SAS, 2013; Zikopoulos et al.,
2012)

22
22
Based on Figure 2.3, it is clearly seen that all of the characteristics discussed
over the years on the big data dimension is actually complement one another. In short,
the value should be generated through today’s hi-technology against the data volume,
variety and veracity at instant data processing otherwise the value could be depreciated
(Lee, 2017; Reeve, 2013; Zikopoulos et al., 2012).
2.3.3 Categorisation of Big Data
According to Özköse et al. (2015), data may be derived from various resources
both internally and externally. Similarly, O'Reilly (2014) emphasized in his book that
these data come from an assortment of structures and it is often hard to obtain an
impeccably, processing-ready data. Such data can be categorized into structured, semi-
structured or unstructured data. This classification of data is derived from the existence
of the social network, sensors, mobile devices, GPS and other technological appliances
(Portela et al., 2016).
Hashem et al. (2015) suggested that in order to further comprehend the
characteristics of big data, it is best to be divided into few categories. Table 2.2
illustrates the classifications and its examples.
Table 2.2: Categorisation of Big Data
Source: (Hammer et al., 2017; Hashem et al., 2015; Lee, 2017)
Category Examples
Data Sources Web & Social
a) Social networks (Facebook, Twitter, Linkedln)
b) collaborative projects over the web c) search engines (Google, Bing) d) mobile data content (call detail record, location update, text messages)

23
23
Category Examples
Sensing
a) Fixed sensors (home automation, weather/pollution sensors, traffic sensors/webcam, scientific sensor) b) Mobile sensors (GPS, Satellite Images) Transactions – financial and work data, commercial transactions, e-
commerce, bank records, credit cards
Internet of Things (IoT)
a) A machine-generated data from hardware or software (computer, mobile devices, machines)
b) An enormous volume of data and information are created when
those devices connected to the Internet
Content
Format
Structured – manageable data and available in various types of conventional databases. (numbers, words, dates)
Semi-structured – unorganized structured data that do not compatible with the traditional database system. Unstructured – data with no specific format and lack of consistency for proficient computing. (text messages, location information, data from
social networks)
Data Stores Document-oriented Column-oriented Graph database
Key-value
Data Staging
Data Processing Batch
Real-time
In conclusion, the classification made is closely relatable to the big data
dimension. For instance, the format of today’s data varied from unstructured to
structured data due to the abundant data sources available (Variety). Indirectly, the
variations in data source cause the overflowing of various data size (Volume) to be
processed either in batch or real-time (Velocity) taking into consideration its idleness,
reliability, and bias (Veracity) (Hashem et al., 2015).
Cleaning
sorting the unnecessary
and incomplete data
Transform
converting data for analysis
Normalization
structuring database to reduce data repitition

24
24
2.4 Big Data Application in Other Industries
In recent times, big data has been discussed across various sectors and is
considered as a game changer in major industries (Gaitho, 2017). For this reason, many
organizations have taken steps to change their plan of action in utilizing the big data
value effectively (Akbar, 2017). A survey made by Gartner in 2015 proved that
companies have incrementally increased their investment in big data to 75% from 58%
recorded by the same survey in 2012. The extensive scope of big data has provided a
massive scale of potential and value that can be generated across different industries
such as banking, healthcare, retail, manufacturing and the upstream industry.
2.4.1 Banking
Banks deal with numerous data of their client’s personal information was
generally the progress was monitored and evaluated through internet and data
analytics. However, with the advent of big data, this information can be monitored in
real time hence enabling banks to deliver the clients need (Mauricio, 2016). According
to Feschyn (2017), it is crucial to understand the clients’ needs and preferences as
clients usually have high standards on how they interrelate with the banks. By meeting
the clients’ requirement, it may actually improve the banks’ overall profitability
(Mauricio, 2016). Furthermore, big data technology could also provide a better
predictive system especially in engaging with the risk. Fraud is one of the major
concern in the banking sector and big data could be the reducing factor of this problem
(Mauricio, 2016). For instance, fraud signals could be sensed through the systems
empowered with big data. This system could analysed the signal in real time and
predict unauthorized users or transactions hence improving the banking security
(Feschyn, 2017).

25
25
2.4.2 Healthcare
The high volume of big data along with its complexity, variety, and velocity
has also provided healthcare stakeholders promising new strings of information.
Traditionally, data collected in healthcare or medical industry is lack of integration as
it is controlled separately by various specialists' surgeries, hospitals, clinics and
administrative divisions. However, in recent big data projects by Pittsburgh Health
Data Alliance, a partnership between medical and data professionals is being
developed to excerpt data from numerous sources such as medical and insurance
records, wearable sensors, and genetic data as well as social media data. The
partnership enables a data integration to take place in providing doctors a better
prediction on the treatment type to be prescribed. This can be done by analysing and
comparing all data from the patient as well as other similar patients that will result in
the emphasizing of the issues and emerging trends (Marr, 2015). Hence, big data could
help in addressing the major errors in medical sector which is medication prescription
(Ayers, 2017).
2.4.3 Retail
The retail sector is among the earliest to recognise the potential of big data.
This follows from the upsurge of e-commerce during the big data 1.0 era (Laney,
2001). During that time retail businesses leveraged the power of basic internet
technologies to establish a strong web presence followed by building their capacity to
process a large data which was conducive to their efficiency improvements (Provost
& Fawcett, 2013). The potential was further extended in analysing the vast amount of
data to support the decision to expand businesses, improve cost efficiency and revenue
forecasting (Meneer, 2015).

26
26
2.4.4 Manufacturing
Manufacturing is another leading sector that has moved towards big data
exploration in enhancing their product quality, and at the same time reducing the
operational costs (Oracle, 2015). External data, especially from social networks and
suppliers’ data combined with data from sensors and machines, has given valuable insights
into the existing information. In this respect, big data was utilized to analyse varieties in
enhancing the efficiency of manufacturing and the operational process by providing the
bird’s eye view of the processes which led to a better decision making. Apart from that, big
data technologies also assist in improving the product quality and reducing the overall cost
through production and quality data analysis along with customers’ returning data, capacity
consumption as well as machinery efficiency (Oracle, 2015).
2.4.5 Oil and Gas
The oil and gas industry has also gained a lot from big data. According to B.
Mathew (2016), in the current situation, data collected particularly in the operational
process is used mainly for detection and control purposes. Big data’s advanced
analytics assisted in the decision making where big data insights were used to plan for
predictive maintenance. In this case, it was reported that the technology has managed
to bring the maintenance cost down to about 13% (Choudhry, Mohammad, Tan, &
Ward, 2016). The benefits of digital monitoring and predictive maintenance extends
towards detecting errors in equipment and performing maintenance before they are entirely
damaged. It was reported by analytics firm, Kimberlite that an approximately $49 million
annually were wasted due to an unplanned downtime (Choudhry et al., 2016). Hence, big
data in this respect helped to enhance production and addressed the financial impacts before
it eventually occurs.

27
27
2.5 Big Data and the Construction Industry
Construction is one of the major industry that is responsible towards a country
development. The construction works to be carried out in a project is dynamic (Wood,
2016) and involve a high volume of data exchange from various stakeholders to be
gathered and processed (Shrestha, 2013). Shrestha (2013) added that data is generated
throughout the various phases of construction projects from planning phase to
completion. As shown in Table 2.3, the stream of data includes design and financial
data, sensors and equipment data, photos and videos and others. This data is often
large in volume, highly diverse in format and dynamic. The multi-faceted data reflects
the multitude characteristics of data streaming from construction activities thus sits in
conformity with the 3V’s concept of big data.
Table 2.3: Big data Context in the Construction Industry
Source: Aouad, Kagioglou, Cooper, Hinks, and Sexton (1999); Bilal, Oyedele,
Qadir, et al. (2016)
Characteristics Contributors Examples
Volume A large volume of data
from different sources
Design data, cost data, financial data,
contractual data, Enterprise Resource
Planning (ERP) system, etc
Variety Diversity in the
content format
DWG (drawing), DXF (drawing
exchange format), DGN (design),
RVT (revit), ifcXML, ifcOWL,
DOC/XLS/PPT (Microsoft format),
RM/MPG (videos), JPEG (images)
Velocity Dynamic nature of
data sources
Sensors, RFIDs, Building
Management System (BMS)

28
28
Further, Table 2.3 shows that the advancement of construction processes
through the widespread utilization of these data shall be the next frontier of
construction industry innovation and productivity. This is supported by Harenberg
(2017) who mentioned real-time data processing as the future booster of productivity
in construction.
2.6 Triggering Constituents of Big Data in the Construction Industry
The digitalized revolution has impacted the construction industry rather
significantly as the industry is dealing with the heterogeneous amount of data (Bilal,
Oyedele, Qadir, et al., 2016). These triggering constituents to big data are identified as
in Figure 2.4 and discussed in the following sub-headings.
Figure 2.4: Triggering Constituents of Big Data
Source: (Bilal, Oyedele, Qadir, et al., 2016)
Triggering Constituents of Big Data
BIM
Cloud Computing
IoT
Smart Buildings
Augmented Reality
Social Networking
Services

29
29
2.6.1 Building Information Modelling (BIM)
BIM is anticipated to capture the multi-dimensional CAD data to deliberately
support the multidisciplinary and coordinated working environment among the
stakeholders involved in a project (Eadie, Browne, Odeyinka, McKeown, & McNiff,
2013). As BIM involves capturing the additional layers of information throughout the
entire building lifecycle, BIM is perceived to transform the construction industry
across various perspectives (Azhar, 2011). Though data volume has been the
characteristic of BIM, yet Humphreys (2016) argued that this data are not precisely
big data. This follows the huge files of BIM with the combination of the numerous
models is still promptly prepared only to be processed by BIM applications. Likewise,
the arrival of built-in devices and sensors has increased the amount of data generated
where it eventually leads to the wellsprings of Big BIM Data (Bilal, Oyedele, Qadir,
et al., 2016). Thus, this triggers the construction industry to penetrate the big data era.
2.6.2 Cloud Computing
Cloud computing is an internet computing trend which on request, give access
to the merge of configurable resources (Bughin, Chui, & Manyika, 2010). The main
purpose is to provide multiple users with access to data storage and computation
without each having to resort to an individual license. The acceleration of cloud
computing technology has contributed to the evolution of big data (Qubole, 2017). As
cloud computing is supporting the coordination of errands in the BIM-based
application, it has been broadly applied in the construction industry and big data
performance in this revolution is astounding (Bilal, Oyedele, Qadir, et al., 2016). In
addition, cloud computing and big data are said to be an ideal combo that contributes
to the cost efficiency and extensible infrastructure in supporting big data and business
analytics (Ferkoun, 2014).

30
30
2.6.3 Internet of Things (IoT)
The Internet of Things (IoT) has been the main pillar that triggers the big data
3.0 era. Basically, IoT is a system of Internet-connected devices that gather and
transfer data through installed sensors (Meola, 2016). IoT application frequently
conveyed a substantial number of sensors devices for data accumulation. As the
industry presents boundless big data utilization cases for IoT, big data is inalienably
the subject of intrigue (Bilal, Oyedele, Qadir, et al., 2016). Among the prominent areas
of IoT applications includes logistics, transport, asset recording, intelligent homes and
buildings, energy and agriculture. Bilal, Oyedele, Qadir, et al. (2016) claimed that IoT
and big data are interdependent trends where a huge amount of data is created, accessed
and analysed in real-time in construction applications. Additionally, Pal (2015)
suggested that during the selection of big data processing technology, a huge flood of
information produced by IoT triggers big data on a reciprocal basis following the
selection of big data processing technology.
2.6.4 Smart Buildings
Smart building technology assimilates the contemporary technologies with
existing building systems to attract the economic trade-off between comfort
maximization and energy reduction (Khan & Hornbæk, 2011). Often, these systems
will produce an enormous volume of data and the greater part of this information often
stay undiscovered and eventually disposed of. According to Bilal, Oyedele, Qadir, et
al. (2016), this data needs to be interpreted to truly reflect smart buildings hence gives
big data analytics a significant role to play. The information and communication
technology (ICT)-based integration and development systems, particularly Internet of
Things is an important catalyst for various applications, both industry and the general
population in realizing the smart buildings (Perera, Zaslavsky, Christen, &
Georgakopoulos, 2014). In this sense, Moreno et al. (2016) opined that big data and
IoT are an impeccable combination in enhancing energy efficiency for smart buildings.

31
31
2.6.5 Augmented Reality (AR)
Augmented Reality is a technology that coordinates virtual object images into
real-world images. These images can be taken from the camera or, by using a live
view, the audience can be added directly to the world (Reiners, Stricker, Klinker, &
Müller, 1998). According to Jiao, Zhang, Li, Wang, and Yang (2013) AR comes from
‘Virtual Reality’ (VR) and provides a half-depth environment that highlights the exact
alignment between actual scenes and virtual world images in real time. It is also
broadly recognized as an assuring technology to improve human viewpoint.
Additionally, the means to enhance prevailing big data visualization techniques is
correlated with AR and VR where it is relevant for human limited perception
capabilities (Olshannikova, Ometov, Koucheryavy, & Olsson, 2015). Consequently,
AR and big data are certainly unavoidable where the complexity related with big data
in construction is tremendous and must be overcome by advanced visualization
methods, specifically AR and VR (Bilal, Oyedele, Qadir, et al., 2016).
2.6.6 Social Networking Services
Social media is one of the exciting trends that could assist the construction
industry to improve the communication among project teams (Jiao, Wang, et al.,
2013). Yet, one of the main challenges is to accede the value and exploring ways of
analysing it (H. Chen, Chiang, & Storey, 2012). This follows from the enormous
volume of heterogeneous data produced by the social networks. Hence, to properly
analyse data from social media, the analytical techniques of data analysis need to be
modified and incorporated into the new enormous data for enormous information
processing (Bello-Orgaz, Jung, & Camacho, 2016). In relation to this, big data can be
utilized in developing appealing domain applications through the high volume,
velocity, and variety of social network data to improve stakeholders’ productivity.

32
32
2.7 Current Big Data Research in the Construction Industry
Big data has begun to set foot in the construction industry in sync with other
sectors that have long benefited from big data. In this regard, the construction industry
could exploit big data in the same manner as anticipated by the other sectors or
industries. As discussed earlier, this includes enhancing efficiency, decision making,
and sensors monitoring. Bilal, Oyedele, Qadir, et al. (2016) maintained that the outlook
on the applicability of big data in construction could be magnified as the triggering
constituents discussed in section 2.4 advanced. Thus, the surge of these constituents
and trends could be the factors to propel the construction industry to the next level of
data-driven initiatives.
The current big data research or application excerpted from various literature
is summarized in Table 2 with the important concepts identified from the review
process are aggregated and accentuated in brackets. The findings will become the basis
to map the orientation of big data research in construction and subsequently suggesting
the probable direction for research to ensue.

33
33
Table 2.4: Big Data Research from various literature
Source: As shown
No Big Data research area from the literature review Authors
1 BD with Visual Analytics used for (building performance) comparison that leads to renovation and
construction with low (energy) consumption.
(Ioannidis et al., 2015)
2 LEED uses actual data to verify the (building performance) (D. Davis, 2015)
3 Improve (project management) by using technologies or sensors for (performance) monitoring and
tracking
(Wood, 2016), (Bleby, 2015),
(Yang, Park, Vela, & Golparvar-
Fard, 2015)
4 Cost efficiency (design) through a real-time, data-focused predictive model. (Sadhu, 2016)
5 BD assist in (project management) to ensure the project is delivered on (time) and (minimize delays) (Sadhu, 2016), (Rijmenam, 2015),
(Faure, 2016), (Augur, 2016),
(Akbar, 2017)
6 Real-time data sharing to improve (communication) between stakeholders (Rijmenam, 2015), (Augur, 2016)
7 Resource tracking through sensors-equipped assets or machinery. (resource management) (Rijmenam, 2015), (Augur, 2016),
(Azzeddine Oudjehane & Moeini,
2017), Akhavian and Behzadan
(2015)
8 Deriving information from stakeholders to improve the (planning) process and (project management) (Caron, 2015)
9 Integration of information technologies with data handling in facilitating (decision-making) for
(project management)
(Martínez-Rojas, Marín, & Vila,
2015)
10 BD generate (prediction) system for construction businesses bankruptcy (Hafiz et al., 2015)
11 Drones use for construction progress monitoring (project management) (Azzeddine Oudjehane & Moeini,
2017), Knight (2015)

34
No Big Data research area from the literature review Authors
12 Geospatial/geo-location data for (resources optimization) and (resource management) (Akbar, 2017)
13 Data simulation tool in reducing project (risk). (Akbar, 2017)
14 BD for construction (cost management) through tender price assessment system.
(project management)
(Y. Zhang, Luo, & He, 2015)
15 Visual BD to improve (communication) among project stakeholders. (K. K. Han & Golparvar-Fard, 2017)
16 Assess (Construction waste management) performance using BD (Lu, Chen, Ho, & Wang, 2016), (Lu,
Chen, Peng, & Shen, 2015)
17 Developing (waste) simulation tool using BD for (Construction waste management) (Bilal, Oyedele, Akinade, et al.,
2016)
18 Social network analysis and (energy) usage analyses as sources in establishing an integrated green
building (design) model
Redmond, El-Diraby, and Papagelis
(2015)
19 BD algorithms to accurately reduce the design space and enabled generative (design) tool (Bilal, Oyedele, Qadir, et al., 2016)
20 BD and VR for better building (design) decision (Bernstein, 2017), (Barista, 2014)
21 BD helps in generating a predictive model for (energy) consumption (Moreno et al., 2016)
22 BD algorithm for (building performance) in terms of (energy) consumption (P. A. Mathew et al., 2015)
23 Implementing prototype software called Project Dasher for (energy) data visualization and real-time
monitoring.
(Khan & Hornbæk, 2011)
24 BD analysis used to understand energy consumption behaviour thus help to improve (energy
efficiency) in building
(Koseleva & Ropaite, 2017), (Janda
et al., 2015)
25 Real-time (energy) consumption data monitoring and control to improve energy efficiency (Wei & Li, 2011)
26 BD-based platform to visualize workers’ unsafe (safety) act in real-time (SY Guo, Ding, Luo, & Jiang,
2016), (Shengyu Guo, Luo, & Yong,
2015)
27 Use wearable to track worker proximity to rolling (safety) exclusionary zones (Wood, 2016)

35
No Big Data research area from the literature review Authors
28 Use drones to check on site (safety) (Oudjehane & Moeini, 2017)
29 Real-time (safety) tracking and data visualization technologies improve (safety) understanding. (Teizer, Cheng, & Fang, 2013)
(Hampton, 2015)
30 Application of BD-driven BIM system in improving construction (safety) (S. Zhang, Teizer, Lee, Eastman, &
Venugopal, 2013)
31 Integrating BIM data with external data such as Linked Open Data (LOD) for better (project
management) and reduce project (risk)
(Curry et al., 2013)
32 Sensor-based fire-fighting system for skyscraper building in associate with the authorities help in a fire
detecting as well as evacuation process (safety)
(Stankovic, 2014)
33 Predicting site injury and workers’ behaviour towards (safety) through 3D skeleton motion model from
videos.
(S. Han, Lee, & Peña-Mora, 2012)
34 Data from robotics and automated equipment has the potential to improve job (safety) and enhance
construction (productivity).
(Skibniewski & Golparvar-Fard,
2016)
35 Capturing (safety), quality and performance data for real-time analysis in improving the site (safety)
and construction work (productivity).
(Bleby, 2015)
36 Big Data from mobile apps for a contractor to track (resource) and document schedule changes to
enhance (resource management).
(Sadhu, 2016)
37 (Energy) consumption prediction through computational models developed based on user behaviour
for better (energy management).
(C. Chen & Cook, 2012)
38 BD in (design) model comprises of architectural, structural, and building services data to enhance
(design) efficiency
(Porwal & Hewage, 2013)
39 Past project data-driven (design) to improve (design) decision and efficiency. (Barista, 2014)

36
36
2.8 Chapter Summary
In a nutshell, this chapter summarized the literature review on the overall
context of big data in general as well as the extent of big data in the construction
industry. It can be said that big data has invaded the construction industry and likely
to remain. Hence, it is important for the industry to exploit the benefits of big data as
it is forecasted to transform the way in which construction industry is dealing with the
high volume, velocity, and variety of data. The past studies discussed in this chapter
regarding the big data application in the construction industry will be the basis for
developing the research method.

0
0
CHAPTER 3 RESEARCH
METHODOLOGY

37
37
CHAPTER 3
RESEARCH METHODOLOGY
3.1 Introduction
Generally, research methodology is a process which describes the procedure of
the study that will be conducted. It is important to determine the most appropriate and
effective method in responding to the research questions. Hence, this chapter
represents the research methodology adopted in collecting data in order to achieve the
research objectives. Firstly, it highlighted the research design for this study which
includes the research approach and strategy. Next, the techniques applied in data
collection were justified as well as the method for data analysis and validation of
information were discussed.
3.2 Research Design
The qualitative research design was adopted for this study. According to
Bryman (2008), qualitative research is a research strategy that typically emphasizes on
words rather than the computation of data. In this regard, the aim is to provide a thick
explanation about phenomena following the specific issue identified from the literature
(Elo & Kyngas, 2008; Fellows & Liu, 2008). The decision for adapting the strategy

38
38
was also guided by the objectives of the study. As the research objectives
include analysing the current extent of big data research and mapping out its
orientation and potential application, these are better achieved by going deep through
an analytical explanation of the existing research (Creswell, 2005).
Generally, research design is described as the strategy to assimilate all the
components of the research in a comprehensible and rational way so that the evidence
obtained is guaranteed to address the research problem (Labaree, 2009). For this study,
the research design is categorized into four stages which are the preliminary study,
research methodology, data analysis, and conclusion. Figure 3.1 shows the research
methodology framework for this research in light of achieving the research objectives.

39
39
Figure 3.1: Research Methodology Framework
First Stage - Preliminary Study
1. Identify the issues regarding big data in the construction industry. 2. Specifying the problem statement 3. Identification of the research objectives. 4. Identification of scope and significance of the study.
Research Objective 1
To analyse the current extent of big data research in the construction industry
Literature Review
Literature review aims: 1. Enhance the understanding on overall context of big data
2. Identify the involvement of big data in the construction industry
Data Collection
Secondary data sourced from past journals, articles, books, dissertations and
other related sources – desk study
Research Objectives 1 & 2
Third Stage - Data Analysis & Findings
Fourth Stage – Conclusion and Recommendation
To validate the findings as the basis to identify the potential application of big data in the
construction industry
Research Objective 3 Research Objective 2
To map out the orientation of the current research on big data
in the construction industry
Second Stage – Research Methodology
Identifying data collection method and instrument
Research Objectives 3
Primary data - semi-structured interview with the industry personnel who have experienced and knowledge
on big data.
Literature review process with detail analytical study
Research Objectives 1
Qualitative Analysis using NVivo Software
Research Objectives 2
Interview content analysis with the assist of NVivo
Research Objectives 3

40
3.2.1 Stage 1: Preliminary Study
Initially, a preliminary study was conducted in order to describe the
background study in detailed and further identify the issues regarding the chosen
research topic to form the problem statement. A research problem is important to be
emphasized as it will show the significance and direction of the study. The preliminary
study can be made through literature reviewing from various sources such as journals,
articles, books, and others to extend the view on the research topic as according to
Welman, Kruger, and Mitchell (2005), various parts of the study could be expanded
through a comprehensive literature review. For this research, the aim of the literature
review is specified which is to enhance the understanding on the overall context of big
data in the construction industry and identify the involvement of big data in the
construction industry. With this, the literature review from the mentioned sources
helps in explaining the background of the research, problem statement and importance
of the study as well as shaping the objectives of the study.
3.2.2 Stage 2: Research Methodology
This stage includes the identification of data collection method or techniques
as well as the instrument used. There are three types of data collection includes a
qualitative research that involves individuals such as in-depth, open-ended interviews,
coordinate perceptions and written documents (Patton, 2005). The data collection for
this study includes both primary and secondary data. The first method used is data
collected from secondary data through desk study. On the other hand, the second data
collection method used is from primary data that focused on the semi-structured
interview with the industry personnel who have experienced big data.

41
3.2.2.1 Desk Study
Desk study method was used to collect the data required for attaining the first
and the second objectives. According to Travis (2016) desk study relied on the
researcher’s skill to review the previous research findings in order to obtain an
expansive comprehension of the study area. This is done by reviewing the secondary
data sourced from past journals, articles, books, dissertations and other related sources
to achieve the objectives. UTM Library Online Database which contained access to
academic journals from Emerald, Science Direct, IEEE Xplore Digital Library and
SpringerLink was searched. The main keywords used in searching the literature were
“big data” and “construction industry”. Desk study is applied in attaining the first and
second objectives. A thorough review was made based on the secondary data that
emphasize the current big data research particularly in the construction industry. This
method was adopted as it provides the fastest and inexpensive method in understanding
the realm of the research, where a thorough review was made to obtain cross-sectional
insights on big data in the construction industry.
3.2.2.2 Semi-structured interview
A series of interviews were conducted to consolidate and validate the insights
that are to be gained from the desk study. The interviews were administered with
personnel who have experienced big data and is aimed to identify the potential
application of big data in construction. According to Rubin and Rubin (2011), the
qualitative interview is a discussion where the researcher aides a conversational
accomplice in a broadened exchange. The interviews allow the researcher to expand
the questions to the extent that they are willing to share. Accordingly, the desk study
is important in this regard as it gives the researcher a gist of the previous research
findings before the interviews are carried out to validate it.

42
Invitations were e-mailed to the respondents that are known to be experienced
with big data to validate the research findings through the desk study. The main
purpose of validation is to ascertain the congruity of the research’s findings with the
opinion of the respondents (Bryman, 2015). The interview is the most suitable method
used in soliciting agreement towards the findings made from the analysis of the desk
study industry as well as in obtaining further suggestion from the respondents. Open-
ended questions were established for capturing pertinent opinion and suggestion from
the research’s outcomes. The interview session takes about thirty minutes to one hour
where questions related to the findings on the direction of big data research area were
asked as well as their further opinion on the potential application of big data in the
construction industry. The details of the interview instrument are as follows:
Table 3.1: Details of interview instrument
No Main Aspects Content
A Big data concept How the concept is being practiced in
the context of the construction industry
B The direction of big data Validation of the research findings
made from desk study
C The potential application of big data Suggestion on the potential application
of big data in the construction industry
Table 3.1 shows the aspects considered for the purpose of validating the
outcomes of from the desk study analysis. The responses through the semi-structured
interview are able to capture the respondents’ views on the research findings presented
as it is interesting to contemplate the industry’s views on the findings obtained and
extending the findings by receiving further recommendations from the respondents.
The result includes what and how would the industry profit from the adoption of big
data.

43
3.2.2.3 Sampling
Mainly, in qualitative research, there are three types of qualitative sampling
which are purposeful sampling, quota sampling, and snowball sampling. Maxwell
(2012) stated that sampling is contemplated to be difficult because usually, sampling
is focusing on the population to be sampled. Hence, a purposeful sampling which also
known as the criterion-based selection is adopted instead of a probability and
convenience sampling.
Purposive sampling is the widely used as sampling strategy where the selection
of contributors is chosen in light of their criteria based on the research questions. One
of the examples of purposive sampling that is suitable to be adopted in this study is
expert sampling. According to Laerd Dissertation (2015), expert sampling is utilized
when a researcher needs to gather information from people with a specific expertise or
knowledge. Hence, this type of sampling was adopted for this study as the targetted
interviewee would be among the personnel who have experienced big data. From this,
the information gathered from the secondary data for the first two objectives were
validated as well as a depth view regarding the topic could be explored in order to
achieve the third objective.
Additionally, snowball sampling was also be applied to this study where
usually this type of sampling is used to assist the researchers in finding the most
eligible interviewee. Snowball sampling allows the initial interviewee to suggest other
individuals who have the potential to conceivably contribute to the research.

44
Figure 3.2: Exponential Non-Discriminative Snowball Sampling
Source: Dudovskiy (2016)
Exponential Non-Discriminative Snowball Sampling is one of the types of
snowball sampling that was used where the initial participants enrolled in the sample
group provides multiple referrals. Then, each new referral will be explored until the
primary data gathered attained the desired amount of samples. Creswell (2005)
proposed that the number of samples for qualitative data between 5 to 25 interviews is
sufficient enough to achieve the objective.
3.2.3 Stage 3: Data Analysis and Findings
Data collected were analysed in accordance to the scope of study by examining
all of the data and information obtained. Analysing and interpreting data is crucial as
it will affect the overall outcome of the study. As for this study, the analysis focused
on analysing and synthesizing the current research of big data application and mapping
its outcome. Then, a wider insight of big data in the construction industry is further
explored through an interview to validate the analyzed data and identify its potential
application. The data were analyzed through a detail analytical study and qualitative
analysis using NVivo software as well as interview content analysis.
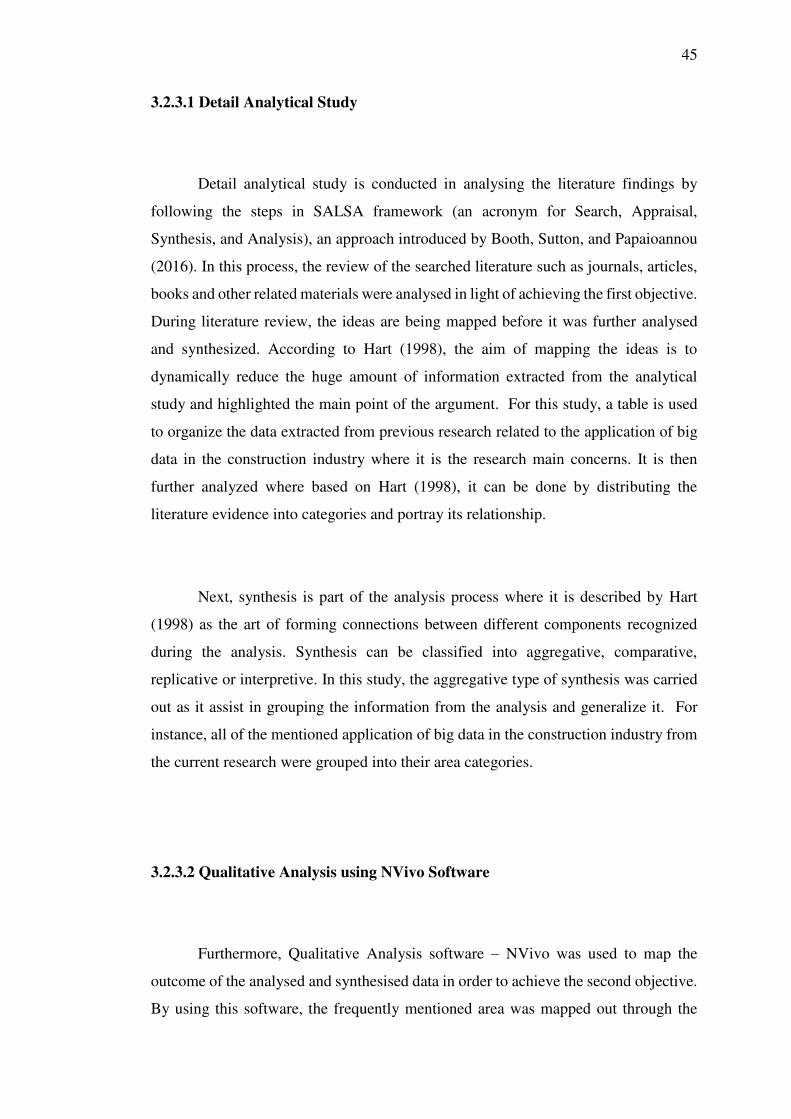
45
3.2.3.1 Detail Analytical Study
Detail analytical study is conducted in analysing the literature findings by
following the steps in SALSA framework (an acronym for Search, Appraisal,
Synthesis, and Analysis), an approach introduced by Booth, Sutton, and Papaioannou
(2016). In this process, the review of the searched literature such as journals, articles,
books and other related materials were analysed in light of achieving the first objective.
During literature review, the ideas are being mapped before it was further analysed
and synthesized. According to Hart (1998), the aim of mapping the ideas is to
dynamically reduce the huge amount of information extracted from the analytical
study and highlighted the main point of the argument. For this study, a table is used
to organize the data extracted from previous research related to the application of big
data in the construction industry where it is the research main concerns. It is then
further analyzed where based on Hart (1998), it can be done by distributing the
literature evidence into categories and portray its relationship.
Next, synthesis is part of the analysis process where it is described by Hart
(1998) as the art of forming connections between different components recognized
during the analysis. Synthesis can be classified into aggregative, comparative,
replicative or interpretive. In this study, the aggregative type of synthesis was carried
out as it assist in grouping the information from the analysis and generalize it. For
instance, all of the mentioned application of big data in the construction industry from
the current research were grouped into their area categories.
3.2.3.2 Qualitative Analysis using NVivo Software
Furthermore, Qualitative Analysis software – NVivo was used to map the
outcome of the analysed and synthesised data in order to achieve the second objective.
By using this software, the frequently mentioned area was mapped out through the

46
automating coding with word frequency. In the ‘Word Frequency Query’ command, it
counted the frequency of a particular word or phrase or a set of alternative words
immediately from the analysis. It then was generated and saved as a node. In relation
to the study underpinning this paper, ‘Word Frequency Query’ in NVivo was used to
produce a specified area of big data that has been acknowledged the most in the form
of the word cloud. From this, the predilection of big data in the construction industry
was obtained hence attaining the second objective.
3.2.3.3 Interview Content Analysis
The method used to analyze the primary data obtained from the semi-structured
interview is the interview content analysis method. It is the most common method used
to analyze communication content such as the interview transcript. The content
analysis for the study underpinning this paper is related to the third objective regarding
the potential application of big data in the construction industry. In addition, the
interview content is actually to validate the results obtained from the detail analytical
study and qualitative analysis software. For this study, qualitative analysis software is
used to aid the interview content analysis in producing project map and word cloud.
3.2.4 Stage 4: Conclusion and Recommendation
Last but not least, the research objectives have been attained following the
process of research design. At this stage, the study was evaluated by providing a
rationale wrap up based on the analyzed data as well as suggesting relevant
recommendations for future research.

47
3.3 Chapter Summary
This chapter summarises the process of research methodology in the attempt
of attaining the research objectives. This research is a qualitative research where the
data is collected from both primary and secondary data. The method adopted to collect
these data include the desk study approach and a semi-structured interview. Moreover,
the data collected will be further detailed and analysed in the next chapter through
content analysis method as well as qualitative analysis software.

0
0
CHAPTER 4 DATA ANALYSIS
AND DISCUSSION

48
48
CHAPTER 4
DATA ANALYSIS AND DISCUSSION
4.1 Introduction
This chapter represents the adopted research analysis of this research topic. It
starts with the detail analytical study done following the SALSA (Search, Appraisal,
Synthesis, and Analysis) framework steps and the data is further analysed with the
assist of NVivo software, which managed to achieve the first two research objectives.
The findings were validated through interview content analysis to identify the potential
application of big data in the construction industry.
4.2 Detail Analytical Study
The important concepts on big data excerpted from the review were structurally
analysed by following the steps in the framework known as SALSA where the acronym
stands for Search, Appraisal, Synthesis, and Analysis. A complete application of the
SALSA framework was illustrated in a study by Shamsulhadi, Fadhlin, and Hamimah
(2015) and was further methodologically discussed by Shamsulhadi and Fadhlin
(2016) and Zafira, Shamsulhadi, and Roslan (2018). In the studies mentioned, it was

49
observed that the NVivo software was predominantly deployed to assist in the
analytical process. Part of the analytical outcomes as presented in Table 2 had followed
the processes as outlined by the previous studies and include the usage of the NVivo
software as well. This approach was intentional to maintain the rigour as justified in
the illustrated research. Details of the processes carried out for the study are further
explained in the following sections.
4.2.1 Searching
The exploratory nature of this study had naturally required the researcher to
search the relevant literature concerning big data in construction. For this purpose, the
researcher had first established the search parameter and subsequently drawn the
relevant keywords from the aim and objectives of the study. A snowballing technique
was then exercised where literature was identified through the backward and forward
approaches (Webster & Watson, 2002).
To achieve this, the UTM Library Online Database which contained access to
academic journals from Emerald, Science Direct, IEEE Xplore Digital Library, and
SpringerLink was searched. The main keywords used in searching the literature were
“big data” and “construction industry”. Additionally, the Boolean operators, truncation
characters, and wildcards were also used in selecting the relatable journal articles.
Based on the search results, large numbers of big data articles were displayed from
both constructions as well as other domains. However, the results were again filtered
where only the content that portrays the presence of big data in the construction
industry was of particular interest.

50
4.2.2 Mapping Ideas and Analysis
Mapping involves putting together different strands that make up the topic to
enable analysis and synthesis to be undertaken. The process involves accumulating the
literature content from the review and sorting the list into categories for the purpose of
establishing connections (Hart, 1998). According to Hart (1998), the aim of this
process is to dynamically reduce the huge amount of information extracted from the
review with due emphasized given to extract the main points of the argument. For this
study, a featured map, in a form of a table proposed by Hart (1998) was developed and
showed in Table 2.4. The table showed the results of the analysis which has taken
place by reflecting the words (or terms) derived from the extracted data. These were
reflected as the features which had characterised the literature and a structural form of
recognition of the leading concepts. Despite, at this stage, it appears that the concepts
derived were rather disjointed and had followed the individual reflection from the
sources. This necessitates the next step in the process - synthesis.
4.2.3 Synthesis, Mapping, and Discussion of the outcomes
Concepts that arose from the analysis were synthesized through the aggregative
approach in which the concepts were grouped into relatable themes or area. This
process was carried out by using the NVivo software where apart from its ability in
mapping out the outcome, proved to be useful in espousing the weightage which could
exaggerate a certain number of concepts. The frequently mentioned concepts were
mapped out through the word frequency command. It counts the frequency of a
particular word or phrase or a set of alternative words fed from the analysis. In relation
to this study, the ‘Word Frequency Query’ in NVivo was used to reveal a specified
concept of big data that have been mentioned the most in the form of the word cloud.
Hence, the predilections of big data in construction were obtained thus attaining the
second objective.
51
51
Figure 4.1: Generated model representing the frequency of big data research area
1 5
2
3
4

52
52
A model which was developed from the synthesis is presented in Figure 4.1. It
shows that prior research on big data in construction had centered around
‘management’ which contributed to the area of ‘project’ management, ‘energy’
management and ‘resource’ management. Based on the discussion, the theoretical
orientations obtain from the analytical processes could be summarised in sequence as
(1) project management; (2) safety; (3) energy management; (4) decision making
design framework and (5) resource management. Table 3 recapitulates the
interpretative context of the most frequent big data research area in relation to the
findings previously presented in Table 4.1.
Table 4.1: Detailed context of big data research area
The context of big
data research area
Important
keywords
Detail of research area
Construction Project
Management
Monitoring Progress/performance monitoring
through IoT devices
time, cost Better time and cost management
Decision-
making
Making decision using predictive data
that leads to lower project risk and better
management for improved productivity
Safety Site safety,
workers’ safety behaviour
Big data generated through IoT devices
in tracking and visualize site safety
conditions as well as workers’ behaviour towards safety
Energy management Consumption,
building
performance
Enhancing energy efficiency and
building performance through an
understanding of building energy
consumption
Decision-making
design framework
Decision-
making
Big data for prompt and informed
decision-making
Resource management Resources
tracking
Resources tracking through IoT devices
to improve resources utilization
efficiency
Big data in ‘project management’ involves those linked-construction data in
cloud base that provides broad understanding of a complex project. It was submitted
that big data leads to a better ‘project management’, especially in ensuring that cost

53
efficiency was achieved as well as minimizing delays. Likewise, big data initiated by
the IoT devices such as drones, sensors or smartphones aid in recording construction
work progress and monitoring work performance. It was postulated that a real-time
data was able to be provided so that actionable actions could be taken in enhancing the
project productivity. Big data also contribute to a better project management through
data wise enhancing ‘decision-making’ process especially in predicting the project
orientation that leads to lower project risk as well as improved productivity.
Additionally, the IoT devices also generate data on the ‘safety’ aspect such as
workers’ safety behaviour on site and site safety conditions through sensors, automated
equipment, tracking devices as well as visualization technologies. Big data application
towards safety is mainly focusing on enhancing safety behaviour understanding in
real-time so that the data could be analysed for immediate actions to be taken hence
improving the site safety condition.
On the other hand, ‘energy management’ encompasses the integration of IoT
or BIM with big data analytics in understanding the building energy consumption to
increase energy efficiency and add to building performance. Energy analyses further
assist in decision making ‘design’ framework where the results could be the
determinant in generating integrated models for building design. Also, big data provide
an aerial view on all aspects of the built environment that facilitates a better decision-
making design framework.
Correspondingly, resources tracking and monitoring through sensors or mobile
apps helped to enhance the decision-making for ‘resources management’ and ensure
resource optimization. Other big data potential application reviewed from the literature
includes construction waste management as well as data-sharing efficiency to improve
communication.

54
4.4 Validation of the Findings
This sub-section deliberate on the validation towards the results developed
from the NVivo software on the direction of big data in the construction industry. It
features the respondents who have participated in the semi-structured interview
session to discuss the findings. This validation process was carried out to identify the
appropriateness of findings as a useful basis for a further recommendation on the
potential application of big data in the construction industry. The semi-structured
interviews were conducted to contemplate the industry’s views on the findings
obtained and extending the findings by receiving further recommendations from the
respondents.
4.5 Respondents’ Background
The interviews to validate the findings and obtaining further suggestion on the
potential application of big data in the construction industry were conducted among
the personnel that has experience with big data as well as the construction industry
personnel that has an extended knowledge on big data. Invitations were sent out to 16
potential interviewees that comes from Malaysia, Singapore, and Hong Kong with the
aim to gather information on the potential application of big data in the construction
industry through their perspectives. Out of the 16 invitations sent, only 5 respondents
were agreed to be interviewed mainly from Malaysia. All of the respondents has
reached 10 years and above of working experience except for RV2 with the working
experience of 8 years and all of them are known to be familiar with the concept of big
data through the emerging technologies. Table 4.2 shows the background of the 5
respondents that were being interviewed.

55
55
Table 4.2: Respondents’ Background
No Organization
/Company Position
Working
Experience
(Years)
Knowledge/Experience on Big Data
RV1
Department of Statistics
Malaysia
(DOSM)
Director, Industrial Production and
Construction Statistics
Division
17
Respondent RV1 has involved in one big data project called price intelligence where it is a web
scraping project in collecting price data from online businesses to improve the consumers’ price index. This project is still on-going and has started since 2014. RV1 thinks that the construction
data collected by DOSM can be utilized for extensive usage and the opinions given is based on the experience obtained from the involvement with the big data project.
RV2 Setia Precast
Sdn Bhd
Senior Manager
(Design) 8
Respondent RV2 has well-familiarized with the technologies and trends in the construction industry that causes the emerging of big data but does not aware that the data involved is called big data. Respondent also shared that he has been to several conference and knowledge sharing on the application of technologies in the construction industry thus the opinions given were based
on the knowledge he obtained from the session.
RV3
Ministry of
Works, Malaysia
Chief Assistant,
Contractors and Entrepreneur
Development Division
11
Respondent RV3 has moderate knowledge on big data and is highly aware of the emerging trends
in the construction industry that causes the spread of big data. Currently respondent RV3 with his team is trying to propose the extensive usage of drone on construction site as well as establishing
a platform to assist the selection of the best contractor for construction projects.
RV4 Public Private Partnership
Unit
Principal Assistant Director, Quantity
Surveyor Department
16
Respondent RV4 has moderate knowledge on big data and is highly aware of the emerging trends in the construction industry that causes the spread of big data. She had involved in the project that utilize the usage of visual cameras on site for project monitoring. Her opinions on big data in the
construction industry is based on her knowledge and experience with the emerging technologies in the industry.
RV5
Malaysia Productivity
Corporation (MPC)
Director, Productivity & Competitiveness Development
28
Respondent RV5 has involved in several conference on big data by giving talk on the possibility of having big data in Malaysia. RV5 also made survey on the openness of data sharing by different
organizations as she described open data as big data. Her main focus of big data in the construction industry is on how big data would be useful in improving the industry’s productivity.

56
56
4.6 Interview Findings
Questions mainly on the concept of big data in the construction industry,
validation to the direction of big data research gained from the detail analytical study
as well as the potential application of big data in the construction industry were asked
to the respective respondents. The questions focused on their interpretations of the
findings obtained on the study of big data in the construction industry as well as their
extended suggestions on its potential application. The responses have been recorded
in tables and were analysed to generate the word cloud and project map with the assist
of NVivo software.
4.6.1 Concept of big data in the context of the construction industry
The respondents were asked about how the 3V’s concept of big data which is
Volume, Velocity, and Variety is related to the data involved in the construction
industry. Table 4.3 shows the responses given.
Table 4.3: Respondents’ responses towards the big data concept
Respondent Big data concept in the context of the construction industry
RV1 Traditionally, data is being collected by doing survey whereas
today’s advanced technology especially the advent of the Internet
of Things (IoT) enables us to gather the data in real-time and
utilize it at an instant. Big data comprises two types of data which
are structured and unstructured data. Data involved in every
industry, as well as the construction industry, are in big volume
and it comes in these both form thus reflecting the big data concept.
However, the utilisation of unstructured data needs to be revised
carefully as to ensure the reliability of the data.

57
Respondent Big data concept in the context of the construction industry
RV2 Generally, the advent of big data in the construction industry is
supported by the usage of BIM in a construction project as BIM
gather all relevant data or information from various sources
regarding the project onto one platform thus shows the big volume
and variety of data gathered for a project. The reachability of the
same data among different stakeholders also shows the big data
concept of velocity. However, the slow internet speed may
influence its velocity.
RV3 Knowingly, the construction industry had to deal with the
voluminous amount of data which comes from different sources
and the data is actually needed for various uses especially towards
improving the efficiency of the industry. However, it seems that the
level of data integration or sharing is low as all of the data available
was usually siloed thus resulting in low accuracy of data and data-
driven decision making.
RV4 Basically, construction data is huge in terms of its volume and
undoubtedly the data is generated from various different
sources. However, the data is not synchronized as it is siloed and
does not integrate with each other. The emerging of BIM adoption
does help in enhancing the data integration during construction
planning and big data technology is seen to be the next tool to
encourage better use of construction data.
RV5 The concept of big data is based on the availability of the data
over the net as well as the technology or other sources that
generate data where it can be excerpt by everyone at an instant.
The high velocity and real-time data created indicate that the big
data involved both structured and unstructured data. Thus, this
arouses the concern on the certainty of the data whether it can be
used or not.
The respondents’ answers were exported to NVivo software and a project map
on the big data concept in the context of the construction industry is generated to
summarise the responses. The illustration can be seen in Figure 4.2.

58
Figure 4.2: Generated model representing the frequency of big data concept by
respondents
Figure 4.3: NVivo project map on big data concept in the context of the construction
industry
Figure 4.3 summarised the responses given in Table 4.3 in project map from
the Nvivo software. Based on the summarisation, the respondents agreed that the 3Vs
concept of big data which is Volume, Velocity, and Variety reflects the data associated

59
with the construction industry. This can be seen from Table 4.3 and Figure 4.2 that
most of the respondents mentioned on the voluminous data that is available in the
construction industry, the diversity of data sources and forms which include structured
and unstructured data as well as the rapidity of the data generated and be reached in
real-time. RV1 and RV5 added the fourth V of big data which is Veracity whereas can
be seen in Table 4.3 and Figure 4.3, it is due to the increased volume of unstructured
data that drove the concern towards reliability and certainty of the data. Some of the
respondents also mentioned on the emerging trends in the construction industry that
pushes the initiation of big data into the industry such as Building Information
Modelling (BIM) and the Internet of Things (IoT). This hence validated the findings
made based on a literature review that big data in the construction industry is triggered
by the emerging trends listed in Chapter 2 sub-heading 2.6.
4.6.2 Orientation of big data in the construction industry
The respondents were asked to validate the big data research orientation in the
construction industry based on the theoretical orientation discovered from the review
process with the assist of NVivo software. Table 4.4 presents the responses given.
Table 4.4: Respondents’ responses towards the big data orientation
Respondent Orientation of big data in the construction industry
RV1 Respondent shared that the implementation of big data in the
construction industry particularly in the developed countries is
directed towards the usage of IoT devices especially sensors to
monitor the performance of the construction process. Others
include the machinery and equipment tracking to enhance its
efficiencies usage on site. Thus, the respondent agreed that the
orientation of big data in the construction industry is centered on
construction project management particularly during the
construction stage. Also, respondent thinks that the orientation of
big data in the construction industry could be projected towards
decision making to improve time and cost of a project.

60
Respondent Orientation of big data in the construction industry
RV2 Respondent thinks that the area of big data in the construction
industry discovered from the review process has been well covered
and agreed that the focused area of big data is towards
construction project management as the way a project is being
managed will determine the success of a project. Also, the
respondent mentioned that the direction of big data could also lead
towards safety as well as a decision making design framework.
The respondent elaborate that the emerging of BIM has encouraged
the application of big data for a better design decision.
RV3 Respondent feels that it is good to direct the big data research
towards construction project management especially on project
monitoring. Basically, the current system that the government had
on project monitoring is in the form of manual supervision and
reports resulting in a slow extraction of the data and its value.
Therefore, the government has always looked up to enhance the
project monitoring system for better project management,
particularly for government projects. Other than that, the future
direction could also move toward resource management in terms
of faster delivery of materials to the site.
RV4 Big data undoubtedly have more potential towards construction
project management. In fact, respondent shared on the projects
that the respondent involved where cameras are installed on site for
the upper management to monitor the work progress and to use the
information for further action in enhancing the construction
progress. Respondent also suggested that the direction could also
be projected towards safety as it is an important aspect to be taken
care of in every construction projects.
RV5 Decision making on project management is the direction
highlighted by the respondent based on the theoretical orientation
discovered. The respondent added that big data for decision making
could aid in enhancing the productivity of construction industry
particularly through a decision made for cost and time
management. Besides that, the resource management could also
lead the orientation of big data in terms of improving the process
of material delivery as one of the factors causes the low
productivity of the construction industry is a long waiting-time for
materials and supplies delivery.

61
Figure 4.4: NVivo project map on big data orientation in the construction industry
The project map in Figure 4.4 summarised the responses made by the
respondents on the big data orientation in the construction industry. This includes
construction project management on decision making and project monitoring,
decision-making design framework, resource management and safety. The responses
were also being analysed with the assist of NVivo software to illustrate the direction
of big data in the construction industry based on the respondents’ sequence. Word
frequency function in the NVivo software was used again to find the projection in the
form of the word cloud. The results can be seen in Figure 4.5.

62
Figure 4.5: Generated model representing the frequency of big data
orientation by respondents
Table 4.5: Summarisation of respondents’ responses towards big data orientation
Big data orientation Respondents
RV1 RV2 RV3 RV4 RV5
Construction Project
Management
Project monitoring
Decision-making
Safety
Energy management
Decision-making design framework
Resource management
From the word cloud in Figure 4.5 and Table 4.5, it can be seen that ‘project
management’ appeared more which means it is the most mentioned direction by the
respondents. This hence validates the theoretical findings made on the big data
research orientation that construction project management is leading compared to
another area. Additionally, the respondents supported their justification on the big data
orientation by sharing their knowledge as well as experiences on the current big data
application in that area which has been stated in Table 4.4. Respondent RV2 also
11
12
33
14

63
mentioned that the core for a particular project to success is based on how the project
is being managed thus the potential application of big data in the construction project
management need to be explored in harnessing its further benefits.
Moreover, as portrayed in Figure 4.5 and Table 4.5, it can be concluded that
the respondents’ view on the big data orientation in sequence is towards (1)
construction project management, (2) resource management, (3) safety and (4)
decision-making design framework. However, none of the respondents responded in
the direction of big data in the construction industry towards energy management. This
contrast with the theoretical orientation discovered based on the big data research made
where energy management is the third focused area of big data research. Also, based
on the theoretical orientation, big data research is not really centered on resource
management. However, from the interviews made, respondents suggested that further
attention should also be given towards resource management besides construction
project management.
4.6.3 Potential application of big data in the construction industry
The respondents were asked about the potentiality of big data to be applied in
the construction industry prior to suggesting its potential application. All of the
respondents answered that big data has the potential in construction but it may be
challenged by few factors such as budget as well as lack of knowledge and skill in big
data handling. Next, the respondents give recommendations on the potential
application where the suggestions made were based on the respondents’ experiences
and knowledge on big data. The responses on the potential applications highlighted by
the respondents were summarised and illustrated with the assist of NVivo software and
four categories were encapsulated as in Figure 4.6 and Table 4.6 which are (1) Big
data application through IoT devices; (2) Predictive model for decision making; (3)
Pricing system; and (4) Contractors’ information system.

64
64
Figure 4.6: NVivo project map on the potential application of big data in the construction industry

65
65
Table 4.6: Suggested potential application of big data in the construction industry
Potential application of big data Respondents
RV1 RV2 RV3 RV4 RV5
Big data application through IoT devices for;
Project progress
Machinery control
Materials delivery
Safety
Workers’ productivity
A predictive model for decision making on;
Project planning through past project data
Construction type through buyers’ demand
for property
Pricing system for;
Pricing evaluation at the bidding stage
Construction cost decision
Contractors’ information platform for;
Performance assessment
Contractor selection process
Based on the project map in Figure 4.6 and Table 4.6, it can be seen that the
application of big data in the construction industry was propagated by the emerging of
IoT devices as the majority of the suggested potential application of big data outlined
by the respondents are through IoT devices. Next, the potential application of big data
in the construction industry suggested by the respondents were then be related back to
the theoretical orientation of big data research discovered in Table 4.1. The correlation
can be seen in Figure 4.7 and Table 4.7.

66
66
Figure 4.7: Correlation between suggested potential applications with the theoretical big data orientation

67
67
Table 4.7: Correlation between the suggested potential applications with the
theoretical big data orientation
Potential application of big data
Theoretical orientation
Con
stru
ctio
n P
roje
ct
Man
agem
ent
Sa
fety
En
ergy m
an
agem
ent
Dec
isio
n-m
ak
ing
des
ign
fra
mew
ork
Res
ou
rce
man
agem
ent
Big data application through IoT devices for;
Project progress
Machinery control
Materials delivery
Safety
Workers’ productivity
A predictive model for decision making on;
Project planning through past project data
Construction type through buyers’ demand for property
Pricing system for; Pricing evaluation at the bidding stage
Construction cost decision
Contractors’ information platform for;
Performance assessment
Contractor selection process
Based on the correlation, it can be seen that the application of big data in the
construction industry appeared most around the construction project management area
thus reaffirm the theoretical orientation obtained from the literature review process
where construction project management is the most intensified area for big data in the
construction industry. The elaboration on the correlation between the suggested
potential applications of big data in the construction industry by the respondents with
the theoretical orientation discovered from the literature review process can be further
reviewed as in following paragraphs.
68
i. Construction project management
The potential application of big data in the construction industry on
construction project management especially for project monitoring is mainly driven
by the Internet of Things devices such as drones, visual camera, and other similar
devices. The application of these devices could provide a real-time data needed for a
better management in construction work progress which resulted in minimizing delays.
Respondent RV3 suggested on the extended employment of drones beyond the current
utilisation which is to capture work progress photo. Instead, according to respondent
RV3, the drones could be exploited to visualize the real-time site condition and
connecting it with the upper management or client so that they can envisage immediate
actions to be taken to improve the construction work progress. This would extend the
traditional way of progress work reporting that resulted to and low project management
and discourage significant improvement to be made. Additionally, respondent RV4
suggested the use of the visual camera on construction site for project monitoring
where the function is similar to drones. Conversely, according to respondent RV3, the
adoption of drones would give wider views on the construction site compared to the
use of the visual camera. Nevertheless, respondent RV3 added despite the high cost,
the application of drones may require several procedures and approval from the
authority before it can be adopted.
Other than that, respondent RV1 and RV5 also suggested developing a pricing
system where it could help in the bidding process. Respondent RV1 suggested that the
pricing system could be developed where all prices such as for materials, labours and
other construction cost-related could be logged and accessed in real-time. The data
could be then utilised for price-related decision making. Respondent RV4
recommended the pricing system as to set a price benchmark so that all contractors
will price in accordance to the specified price on the system. This will further evade
the case of underpriced and overpriced by the contractors. Furthermore, the
respondents viewed the system as an assistant to speed up and facilitate the process of
evaluating the contractor’s bid compared to the traditional way of evaluating the
process. Also, respondent RV1 and RV4 think that with the help of the data from the

69
system, the updated cost-related data could assist on the decision making for better
budget determination and improved cost estimation made for a particular project hence
ensure that the construction cost will not exceed beyond its actual cost. This is related
to the construction project management in terms of cost management as besides time,
the cost is the most crucial aspect to be monitored throughout the project period.
Furthermore, the suggested potential application by respondent RV3 on
developing a contractors’ information system is generally to assist the client in
assessing the contractors’ performance for them to choose the best contractor.
According to respondent RV3, with the support of this system, the process of
contractors’ selection could become more efficient by reducing the time taken to
evaluate the contractors as in a conventional way. This is related to the construction
project management where by selecting the best contractor with excellent performance
for a particular project would affect the whole construction process as well as may
contribute to good project management.
ii. Resource management
The emerging of the Internet of Things has also initiated big data for resource
management. The respondent suggested that benefits of IoT devices in generating big
data could be harnessed to improve the delivery process of materials. Respondent RV3
and RV5 proposed that it can be done through the utilisation of geo-tagging and
sensors technology to produce a real-time data to the contractors to monitor the
movement of the materials to be delivered to the site. From this, the contractors can
monitor the process of materials delivered to the site through the real-time data
generated from the IoT devices. The data can also be used for contractors to detect any
problems and take action to improve the delivery process. Respondents viewed the
application will evade delayed in materials delivery and thus avoid any interruptions
to the construction works progress. Respondent RV5 also added that enhanced delivery
materials process will result in a better resource management and indirectly improve
the productivity.

70
Also, the application of these devices on machinery and equipment could
enhance the efficiency of construction works need to be done by the machinery or
equipment. For instance, respondent RV2 proposed the utilisation of geo-tagging and
sensors technology that is installed on the machinery and setting out the work need to
be done by the machinery by keying required data to the control device. The data input
will enable remote control of the machinery or equipment to carry out the construction
activity. Other than that, respondent RV2 also perceive wearable devices as a
mechanism to improve the management of the workers’ activity. This can be done
through the real-time data provided by the devices on the workers’ whereabouts and
activities. The data could be extracted and analysed for a further actionable solution to
be made in improving the workers’ productivity. From the big data application
proposed for resource management area where most of it is by the employment of IoT
devices, it reaffirms the literature review made on the current era of big data (Big Data
3.0) where big data is driven mainly by the Internet of Things applications.
iii. Safety
Based on the respondents’ responses, the application of big data in the
construction safety area is also initiated by the IoT devices. For instance, despite
project monitoring, respondent RV3 and RV4 suggested that drones and visual
cameras could also be used to monitor the safety condition of a particular site. In this
case, these devices will provide a real-time data on the safety aspects especially on the
safety behaviour of the workers so that an immediate action to prevent or rectify the
safety-related problems on site could be taken. Similar to the workers’ activity tracking
via wearable devices, the respondent suggested that the use of the device could also
resort to the workers’ safety behaviour monitoring where it will facilitate the reporting
process of unsafe acts made by the workers thus appropriate action could be taken
immediately.

71
iv. Decision-making design framework
For this area, respondent RV2 mentioned on the potential in developing a
predictive model to assist the decision making for upcoming projects in terms of design
or other related decision to be made prior to the project commencement. The predictive
model could be structured based on the data from previous projects gathered on a
single platform and utilise it for decision making in project planning and management.
The decision taken based on the predictive model could prevent any repeatable
mistakes made and thus lowering the project risk. Additionally, respondent RV2 and
RV5 proposed that the predictive model could also be developed for decision making
on the type of construction to be built. This can be done by collecting information or
data regarding buyers’ trend of demand on the property where according to respondent
RV5, this kind of information include those data from the social networking services
thus makes the information be categorised under big data. The data may comprise of
preferable design or material, price and other related information that reflects the
buyers’ property requirements where it indirectly will affect the type of development
or building construction to be proposed.
Other than that, respondent RV5’s extended view on the pricing system
proposed is that it could also assist in decision-making for cost-efficient building
design. The respondent thinks that from the system, a better decision on materials
selection with an equitable price could be made. This would further contribute to a
cost-efficient building design produced.
4.7 Chapter Summary
This chapter analysed the overall findings on the current extent of big data
research in the construction industry as well as its orientation. Generally, the findings
were being analysed based on the literature review process called SALSA framework

72
which stands for Search, Appraisal, Synthesis, and Analysis and with the assist of
NVivo software. Overall, based on the analysed made using the word frequency
function in the NVivo software, it could be seen that the sequence of big data
orientation in the construction industry is as follows; (1) Construction project
management; (2) Safety; (3) Energy management; (4) Decision-making design
framework; and (5) Resource management.
This chapter also analysed the interview content to validate the theoretical
orientation and seeking recommendations on the potential application of big data in
the construction industry. Throughout the analysis, the findings show that most of the
respondents agreed that construction project management is the most focused area for
the big data orientation in the construction industry. Also, the recommendations made
on the potential application of big data in the construction industry reflects that the
application propagated more in the construction project management area thus
validating the theoretical orientation obtained.

0
0
CHAPTER 5 CONCLUSION AND
RECOMMENDATION

73
73
CHAPTER 5
CONCLUSION AND RECOMMENDATION
5.1 Introduction
This chapter explains the conclusion of the research based on the three
objectives mentioned in earlier chapters, which is to analyse the current extent of big
data research in the construction industry, to map out the orientation of big data
research in construction as well as to identify the potential application of big data in
the construction industry. This chapter also discusses the problems encountered
throughout the research process and the recommendations for future research.
5.2 Achievements of Research Objectives
Based on the analysis made, it can be concluded that the research objectives
presented in the early study were achieved. The summarisation can be seen in
following paragraphs.

74
Objective 1 & 2: The current extent of big data research and its orientation in
the construction industry
As the foregoing discussions have shown, a structured analytical framework
has been employed to analyse the resources obtained, assisted by the use of NVivo
software. This has permitted a wider inclusion of resources, thus had broadened the
base for the qualitative analysis to take place. Based on the findings made from the
study, the current extent and orientation of the present construction big data research
cover a diverse research area. The study had suggested that the current direction of
construction big data research could be translated into five specific areas which are
(1) Construction project management; (2) Safety; (3) Energy management; (4)
Decision making design framework; and (5) Resource management. Of the five areas
mentioned, big data for construction project management was identified as the area
which research is really intensified especially on project monitoring, progress tracking
and decision making to enhance cost and time management. This follows as the
construction industry is a data-dependent industry hence data must be managed
efficiently with the right tool to ensure the success of a project.
Additionally, a semi-structured interview was conducted to validate the
theoretical orientation findings. From the responses, it can be concluded that most of
the respondents agreed that the big data orientation is cast on construction project
management notably on project monitoring and decision-making. With the aid of
NVivo software, the interview content on the big data orientation was further analysed
to find the sequence of the most frequently mentioned area by the respondents. The
findings concluded that the orientation of big data based on the respondents’ responses
is slightly differed which are (1) Construction project management; (2) Resource
management; (3) Safety; and (4) Decision-making design framework. Construction
project management is still being emphasized by the respondents in the big data
projection. However, the respondents also suggested that the orientation on resource
management should also be intensified as resource management is closely related to
the construction project management. In order for a particular project to excel in its

75
management, resources such as materials, machinery and equipment, labours and other
resources also need to be well-managed. This is due to poor resources management
could affect the planned cost and time for the projects thus lead to low productivity.
Objective 3: Potential application of big data in the construction industry
The potential application of big data in the construction industry was obtained
from the semi-structured interview where the interviewees were asked to give their
extended views or suggestions on the big data potential application in construction.
The responses given were analysed and summarised with the assist of project map
function on the NVivo software. Based on the analysis, the potential application could
be categorised into four main themes which are (1) Big data application through IoT
devices; (2) Predictive model for decision making; (3) Pricing system; and (4)
Contractors’ information system. The potential application is suggested by the
respondents based on their experiences and knowledge on big data. Table 5.1
recapitulates the interpretative context of the recommended potential application of
big data mentioned by the respondents.
Table 5.1: Detailed context of the suggested potential application
Suggested potential
application
Details
Big data application
through IoT devices
Drones and visual camera for project and site safety
condition monitoring
Geo-tagging and sensors for resource management such
as the improved delivery process of materials and remote
control of machinery
Wearable devices to track workers’ activities as well as their safety behaviour
A predictive model
for decision-making
Data and information from past projects used for decision
making during project planning and management
Information on buyers’ property demand to assist in decision-making for the type of
construction/development

76
Suggested potential
application
Details
Pricing system
To assist in tender price evaluation during the bidding
stage
To improve the construction cost decision made
Contractors’ information platform
To asses contractors’ performance thus facilitate the contractors’ selection process
Besides that, the suggested potential application was also being interrelated
back to the theoretical orientation made and based on the correlation, it can be seen
that the application of big data in the construction industry appeared most around the
construction project management area thus reaffirm the theoretical findings obtained
on the big data orientation from the literature review process. Apparently, this suggests
the rapid pace of big data development in construction and the on-going interest to
harness the technology for common good.
Recommendation:
The findings have given an insight on the potential application of big data in
the construction industry on respective areas. However, the adoption of big data in the
construction industry is slower compared to other industries and according to the
respondents, it is due to the unwillingness of the industry to invest in it and poor data
management. Thus, the following recommendation to push the adoption of big data is
made:
i. The government should find a way to bring the technology with the
lower cost so that the market could adopt the technology. Other than
that, the budget should be allocated to giving incentives to the company
that utilises technology in their project.

77
ii. Develop talents with skill and knowledge on handling big data and
analytical capability in analysing the data. This could impulse the
adoption of the potential application of big data and support the
development of big data for the construction industry.
5.3 Research Limitations
Throughout the research process, there were few limitations encountered
upon completing it. The limitations were listed as follows:
i. The current extent of big data research could be explored further but due to the
time constraint, only those mentioned in Table 2.4 was being analysed to obtain
research objective 2 which is the orientation of big data in the construction
industry.
ii. Identifying suitable interviewees was a challenge as it is difficult to recognise
the personnel who had experienced and extended knowledge of big data as big
data is the new face in the construction industry.
iii. As most of the respondents identified were holding a high position in the
particular organisations, thus it is quite difficult to make appointments with
them. Also, due to their busyness and time constraint, only 5 respondents were
managed to be interviewed.

78
iv. The approach has been made to obtain extensive views from the respondents
of another country that has been adopting big data such as Singapore and Hong
Kong. However, none of them were willing or free to be interviewed.
5.4 Recommendations for future research
The study has managed to draw important insights on the specific areas in
construction big data research. These were achieved through the accomplishment of
the following objectives: (1) to analyse the current extent of construction big data
research; (2) to map out the orientation of the current construction big data research;
and (3) to identify the potential application of big data in the construction industry. As
the study has shown, construction big data research offers a potentially good prospect
to improve the industry. It is a step ahead of the current digitalisation effort and brings
a new wave in obtaining insights from the voluminous amount of data. Thus it is
recommended for a study to be conducted on;
i. The challenges impeding the adoption of big data in the construction
industry. This would provide an indication on the challenges need to be
addressed by the industry in order to harness the benefits of big data adoption.
ii. The construction industry’s readiness in embracing to big data wave. This
effort shall increase the depth and breadth of the current knowledge which
could further bolster the industry’s understanding of big data.

0
0
REFERENCES

79
REFERENCES
Addo-Tenkorang, R., & Helo, P. T. (2016). Big data applications in operations/supply-
chain management: A literature review. Computers & Industrial Engineering,
101, 528-543.
Akbar, S. (2017). Is Big Data The Most Trending Thing In Construction Now.
Retrieved from https://geniebelt.com/blog/big-data-in-construction
Akhavian, R., & Behzadan, A. H. (2015). Construction Equipment Activity
Recognition for Simulation Input Modeling using Mobile Sensors and Machine
Learning Classifiers. Advanced Engineering Informatics, 29(4), 867-877.
doi:10.1016/j.aei.2015.03.001
Aouad, G., Kagioglou, M., Cooper, R., Hinks, J., & Sexton, M. (1999). Technology
management of IT in construction: a driver or an enabler? Logistics
Information Management, 12(1/2), 130-137.
Augur, H. (2016). Big Data is Transforming Commercial Construction. Retrieved
from http://dataconomy.com/2016/07/big-data-is-transforming-commercial-
construction/
Ayers, R. (2017). 5 Ways the Healthcare Industry Could Use Big Data - and Why It's
Not.
Azhar, S. (2011). Building information modeling (BIM): Trends, benefits, risks, and
challenges for the AEC industry. Leadership and management in engineering,
11(3), 241-252.
Azzeddine Oudjehane, & Moeini, S. (2017). Big Data in Construction Projects Risk
and Opportunity Management.
Barista, D. (2014). The Big Data revolution: How data-driven design is transforming
project planning. Building Design+Construction.

80
Bello-Orgaz, G., Jung, J. J., & Camacho, D. (2016). Social big data: Recent
achievements and new challenges. Information Fusion, 28, 45-59.
Bernstein, P. (2017). How Big Data and VR in Architecture Will Greatly Improve
Design. Retrieved from https://www.autodesk.com/redshift/big-data-vr-in-
architecture/
Bilal, M., Oyedele, L. O., Akinade, O. O., Ajayi, S. O., Alaka, H. A., Owolabi, H. A.,
. . . Bello, S. A. (2016). Big data architecture for construction waste analytics
(CWA): A conceptual framework. Journal of Building Engineering, 6, 144-
156.
Bilal, M., Oyedele, L. O., Qadir, J., Munir, K., Ajayi, S. O., Akinade, O. O., . . . Pasha,
M. (2016). Big Data in the construction industry: A review of present status,
opportunities, and future trends. Advanced Engineering Informatics, 30(3),
500-521. doi:10.1016/j.aei.2016.07.001
Bleby, M. (2015). Big Data boosts construction. Retrieved from
http://www.afr.com/real-estate/commercial/big-data-boosts-constrcution-
20150109-12l8xx
Booth, A., Sutton, A., & Papaioannou, D. (2016). Systematic approaches to a
successful literature review: Sage.
Bryman, A. (2008). Mixed methods research: combining quantitative and qualitative
research. Social research methods, 3, 608-626.
Bryman, A. (2015). Social research methods: Oxford university press.
Bughin, J., Chui, M., & Manyika, J. (2010). Clouds, big data, and smart assets: Ten
tech-enabled business trends to watch. McKinsey Quarterly, 56(1), 75-86.
81
Burger, R. (2017). How the Construction Industry is Using Big Data. Retrieved from
https://www.thebalance.com/how-the-construction-industry-is-using-big-
data-845322
Caron, F. (2015). Data management in project planning and control. International
Journal of Data Science, 1(1), 42-57.
Chen, C., & Cook, D. J. (2012). Behavior-Based Home Energy Prediction. IEEE
Internet of Things Journal.
Chen, C. P., & Zhang, C.-Y. (2014). Data-intensive applications, challenges,
techniques and technologies: A survey on Big Data. Information Sciences, 275,
314-347.
Chen, H., Chiang, R. H., & Storey, V. C. (2012). Business intelligence and analytics:
From big data to big impact. MIS quarterly, 36(4).
Choudhry, H., Mohammad, A., Tan, K. T., & Ward, R. (2016). The next frontier for
digital technologies in oil and gas. Retrieved from
https://www.mckinsey.com/industries/oil-and-gas/our-insights/the-next-
frontier-for-digital-technologies-in-oil-and-gas
Cormode, G., & Krishnamurthy, B. (2008). Key differences between Web 1.0 and
Web 2.0. First Monday, 13(6).
Creswell, J. (2005). Planning, conducting, and evaluating quantitative and qualitative
research: Educational research. In: Prentice Hall: Upper Saddle River, NJ
Creswell, JW (2007). Research method: Qualitative, quantitative and mixed
methods approaches (2nd ed.). Thousand Oaks, CA: Sage.
Cukier, K. (2010). Data, data everywhere: A special report on managing information:
Economist Newspaper.

82
Curry, E., O’Donnell, J., Corry, E., Hasan, S., Keane, M., & O’Riain, S. (2013).
Linking building data in the cloud: Integrating cross-domain building data
using linked data. ADVANCED ENGINEERING INFORMATICS, 27(2), 206-
219.
Davis, D. (2015). How Big Data is Transforming Architecture.
Davis, K. (2012). Ethics of Big Data: Balancing risk and innovation: " O'Reilly Media,
Inc.".
Dissertation, L. (2015). Purposive Sampling. In: Retrieved November.
Dudovskiy, J. (2016). The Ultimate Guide to Writing a Dissertation in Business
Studies: A step by-step assistance. Research-methodology. net.
Eadie, R., Browne, M., Odeyinka, H., McKeown, C., & McNiff, S. (2013). BIM
implementation throughout the UK construction project lifecycle: An analysis.
Automation in Construction, 36, 145-151.
Elo, S., & Kyngas, H. (2008). The qualitative content analysis process. Journal of
Advanced Nursing, 62(1), 107-115.
Elragal, A. (2014). ERP and Big Data: The Inept Couple. Procedia Technology,
16(Supplement C), 242-249. doi:https://doi.org/10.1016/j.protcy.2014.10.089
Emani, C. K., Cullot, N., & Nicolle, C. (2015). Understandable big data: A survey.
Computer science review, 17, 70-81.
Faure, A. (2016). Big data is revolutionizing business: the construction industry in
general and building sites in particular. Retrieved from
https://blog.serenacapital.com/big-data-is-revolutionizing-business-the-
construction-industry-in-general-and-building-sites-in-de7a53a20516

83
Fellows, R., & Liu, A. (2008). Research Methods for Construction (3rd. ed.). Oxford:
Wiley-Blackwell.
Ferkoun, M. (2014). Cloud Computing and Big Data: An ideal combination. Retrieved
from https://www.ibm.com/blogs/cloud-computing/2014/02/cloud-
computing-and-big-data-an-ideal-combination/
Feschyn, A. (2017). THE IMPACT OF BIG DATA ON BANKING AND
FINANCIAL SYSTEMS. Retrieved from
http://dataconomy.com/2017/07/big-data-banking-financial-systems/
Gaitho, M. (2017). How Applications of Big Data Drive Industries. Retrieved from
https://www.simplilearn.com/big-data-applications-in-industries-article
Gartner. (2015). 6.4 billion connected “Things” will be in use in 2016, up 30 percent
from 2015. Gart. Inc.
Gartner, I. (2014). Glossary.(2013). Big Data.
Guo, S., Ding, L., Luo, H., & Jiang, X. (2016). A Big-Data-based platform of workers’
behavior: Observations from the field. Accident Analysis & Prevention, 93,
299-309.
Guo, S., Luo, H., & Yong, L. (2015). A big data-based workers behavior observation
in China metro construction. Procedia Engineering, 123, 190-197.
Hafiz, A., Lukumon, O., Muhammad, B., Olugbenga, A., Hakeem, O., & Saheed, A.
(2015). Bankruptcy prediction of construction businesses: towards a big data
analytics approach. Paper presented at the Big Data Computing Service and
Applications (BigDataService), 2015 IEEE First International Conference on.
Hammer, C., Kostroch, D. C., & Quiros, G. (2017). Big Data; Potential, Challenges
and Statistical Implications. Retrieved from
84
Hampton, T. V. (2015). Big Data Boosts Safety in Brazil. Retrieved from
https://www.enr.com/articles/9640-big-data-boosts-safety-in-
brazil?v=preview
Han, K. K., & Golparvar-Fard, M. (2017). Potential of big visual data and building
information modeling for construction performance analytics: An exploratory
study. Automation in Construction, 73, 184-198.
Han, S., Lee, S., & Peña-Mora, F. (2012). A machine-learning classification approach
to automatic detection of workers' actions for behavior-based safety analysis.
In Computing in Civil Engineering (2012) (pp. 65-72).
Harenberg, M. (2017). 5 ways to boost construction productivity. Retrieved from
https://www.planradar.com/construction-productivity/
Hart, C. (1998). Doing a literature review: Releasing the social science research
imagination: Sage.
Hashem, I. A. T., Yaqoob, I., Anuar, N. B., Mokhtar, S., Gani, A., & Khan, S. U.
(2015). The rise of “big data” on cloud computing: Review and open research
issues. Information Systems, 47, 98-115.
Humphreys, R. (2016). How Big Data Complements Information Management.
Retrieved from https://sourceable.net/how-big-data-complements-
information-management/
Ioannidis, D., Fotiadou, A., Krinidis, S., Stavropoulos, G., Tzovaras, D., &
Likothanassis, S. (2015). Big Data and Visual Analytics for Building
Performance Comparison. Paper presented at the IFIP International
Conference on Artificial Intelligence Applications and Innovations.
Janda, K. B., Patrick, J., Granell, R., Bright, S., Wallom, D., & Layberry, R. (2015). A
WICKED approach to retail sector energy management. Paper presented at the
Proceedings of ECEEE Summer Study.

85
Jiao, Y., Wang, Y., Zhang, S., Li, Y., Yang, B., & Yuan, L. (2013). A cloud approach
to unified lifecycle data management in architecture, engineering, construction
and facilities management: Integrating BIMs and SNS. ADVANCED
ENGINEERING INFORMATICS, 27(2), 173-188.
Jiao, Y., Zhang, S., Li, Y., Wang, Y., & Yang, B. (2013). Towards cloud augmented
reality for construction application by BIM and SNS integration. Automation
in Construction, 33, 37-47.
Khan, A., & Hornbæk, K. (2011). Big data from the built environment. Paper presented
at the Proceedings of the 2nd international workshop on Research in the large.
Knight, W. (2015). New boss on construction sites is a drone. In: MIT Technology
review.
Koseleva, N., & Ropaite, G. (2017). Big Data in Building Energy Efficiency:
Understanding of Big Data and Main Challenges. Procedia Engineering, 172,
544-549.
Labaree, R. V. (2009). Research Guides: Organizing Your Social Sciences Research
Paper: Types of Research Designs.
Laney, D. (2001). 3D data management: Controlling data volume, velocity and variety.
META Group Research Note, 6, 70.
Lee, I. (2017). Big data: Dimensions, evolution, impacts, and challenges. Business
Horizons, 60(3), 293-303.
Lu, W., Chen, X., Ho, D. C., & Wang, H. (2016). Analysis of the construction waste
management performance in Hong Kong: the public and private sectors
compared using big data. Journal of Cleaner Production, 112, 521-531.
Lu, W., Chen, X., Peng, Y., & Shen, L. (2015). Benchmarking construction waste
management performance using big data. Resources, Conservation and
Recycling, 105, 49-58.

86
Manyika, J., Chui, M., Brown, B., Bughin, J., Dobbs, R., Roxburgh, C., & Byers, A.
H. (2011). Big data: The next frontier for innovation, competition, and
productivity.
Marr, B. (2015). How Big Data is Changing Healthcare. Retrieved from
https://www.forbes.com/sites/bernardmarr/2015/04/21/how-big-data-is-
changing-healthcare/#215a20d72873
Marr, B. (2017). The Complete Beginner’s Guide to Big Data in 2017. In: Forbess.
Martínez-Rojas, M., Marín, N., & Vila, M. A. (2015). The role of information
technologies to address data handling in construction project management.
Journal of Computing in Civil Engineering, 30(4), 04015064.
Mathew, B. (2016). How Big Data is reducing costs and improving performance in the
upstream industry. Retrieved from
http://www.worldoil.com/news/2016/12/13/how-big-data-is-reducing-costs-
and-improving-performance-in-the-upstream-industry
Mathew, P. A., Dunn, L. N., Sohn, M. D., Mercado, A., Custudio, C., & Walter, T.
(2015). Big-data for building energy performance: Lessons from assembling a
very large national database of building energy use. Applied Energy, 140, 85-
93.
Mauricio. (2016). The role of big data In the banking industry. Retrieved from
http://bigdata-madesimple.com/role-big-data-banking-industry/
Maxwell, J. A. (2012). Qualitative research design: An interactive approach (Vol.
41): Sage publications.
Meneer, D. (2015). How Big Data is Transforming Construction Businesses. Retrieved
from https://www.constructionmonitor.com/blog/2015/06/26/how-big-data-is-
transforming-construction-businesses/

87
Meola, A. (2016). What is the Internet of Things (IoT)? Retrieved from
http://www.businessinsider.com/what-is-the-internet-of-things-definition-
2016-8/?IR=T
Mills, S., Lucas, S., Irakliotis, L., Rappa, M., Carlson, T., & Perlowitz, B. (2012).
DEMYSTIFYING BIG DATA: a practical guide to transforming the business
of Government. TechAmerica Foundation, Washington.
Moreno, M. V., Dufour, L., Skarmeta, A. F., Jara, A. J., Genoud, D., Ladevie, B., &
Bezian, J.-J. (2016). Big data: the key to energy efficiency in smart buildings.
Soft Computing, 20(5), 1749-1762.
Nath, K., Dhar, S., & Basishtha, S. (2014). Web 1.0 to Web 3.0-Evolution of the Web
and its various challenges. Paper presented at the Optimization, Reliabilty, and
Information Technology (ICROIT), 2014 International Conference on.
O'Leary, D. E. (2013). BIG DATA’, THE ‘INTERNET OF THINGS’AND THE
‘INTERNET OF SIGNS. Intelligent Systems in Accounting, Finance and
Management, 20(1), 53-65.
O'Reilly. (2014). Big data now: 2014 Edition: O'Reilly Media, Incorporated.
Olshannikova, E., Ometov, A., Koucheryavy, Y., & Olsson, T. (2015). Visualizing
Big Data with augmented and virtual reality: challenges and research agenda.
Journal of Big Data, 2(1), 22.
Oracle. (2015). Improving Manufacturing Performance with Big Data: Architect’s
Guide and Reference Architecture Introduction. Retrieved from
http://www.oracle.com/us/technologies/big-data/big-data-manufacturing-
2511058.pdf
Oudjehane, A., & Moeini, S. (2017). Big data in construction projects: Risk and
opportunity management.

88
Özköse, H., Arı, E. S., & Gencer, C. (2015). Yesterday, today and tomorrow of big
data. Procedia-Social and Behavioral Sciences, 195, 1042-1050.
Pal, K. (2015). The Impact of the Internet of Things on Big Data. Retrieved from
http://data-informed.com/the-impact-of-internet-of-things-on-big-data/
Patton, M. Q. (2005). Qualitative research: Wiley Online Library.
Peiffer, E. (2016). 3 concepts that will shape the future of construction. Retrieved from
https://www.constructiondive.com/news/3-concepts-that-will-shape-the-
future-of-construction/417049/
Perera, C., Zaslavsky, A., Christen, P., & Georgakopoulos, D. (2014). Sensing as a
service model for smart cities supported by internet of things. Transactions on
Emerging Telecommunications Technologies, 25(1), 81-93.
Portela, F., Lima, L., & Santos, M. F. (2016). Why Big Data? Towards a Project
Assessment Framework. Procedia Computer Science, 98, 604-609.
Porwal, A., & Hewage, K. N. (2013). Building Information Modeling (BIM)
partnering framework for public construction projects. Automation in
Construction, 31, 204-214.
Press, G. (2013). 3 Big Data Milestones. Forbes Tech Magazine, May, 9.
Provost, F., & Fawcett, T. (2013). Data science and its relationship to big data and
data-driven decision making. Big Data, 1(1), 51-59.
Qubole. (2017). Big Data Cloud Database & Computing. Retrieved from
https://www.qubole.com/resources/big-data-cloud-database-and-computing/
Reckoning, T. D. (2013). The six most fascinating technology statistics today.
Retrieved from https://dailyreckoning.com/the-six-most-fascinating-
technology-statistics-today/

89
Redmond, A., El-Diraby, T., & Papagelis, M. (2015). Employing an Exploratory
Research Stage to Evaluate Green Building Technologies for Sustainable
Systems. Submitted to international journal; under review.
Reeve, A. (2013). Managing data in motion: data integration best practice techniques
and technologies: Newnes.
Reiners, D., Stricker, D., Klinker, G., & Müller, S. (1998). Augmented reality for
construction tasks: Doorlock assembly. Proc. IEEE and ACM IWAR, 98(1),
31-46.
Rijmenam, M. v. (2015). Big Data Can Help Construction Companies Deliver Projects
On Time. Retrieved from https://datafloq.com/read/big-data-construction-
companies-deliver-projects-t/143
Rubin, H. J., & Rubin, I. S. (2011). Qualitative interviewing: The art of hearing data:
Sage.
Sadhu, R. (2016). Big Data For Construction: How It Can Help You Deliver Your
Project On Time. Retrieved from https://www.planacademy.com/big-data-
construction/
Santiago Castagnino, Christoph Rothballer, & Gerbert, P. (2016). What's the future of
the construction industry? Retrieved from
https://www.weforum.org/agenda/2016/04/building-in-the-fourth-industrial-
revolution/
SAS. (2013). Five Big Data Challenges. Retrieved from
https://www.sas.com/content/dam/SAS/en_us/doc/other1/five-big-data-
challenges-106263.pdf
Schwab, K. (2017). The fourth industrial revolution: Crown Business.

90
Shamsulhadi, B., & Fadhlin, A. (2016). Documenting its application in Quantity
Surveying research: A Review. International Journal of Built Environment and
Sustainability, 3(1), 10-17. doi:10.11113/ijbes.v3.n1.105
Shamsulhadi, B., Fadhlin, A., & Hamimah, A. (2015). Research into the Bills of
Quantities: Where can it be focused. The Malaysian Surveyor Journal, 50(3),
15-24.
Shrestha, J. (2013). Big Data, Predictive Analytics, and Data Visualization in The
Construction Engineering. CCEE Graduate Student Research Showcase and
Poster Competition.
Simon, P. (2013). Too Big To Ignore. Canada: John Wiley & Sons, Inc.
Skibniewski, M., & Golparvar-Fard, M. (2016). Toward a Science of Autonomy for
Physical Systems: Construction. arXiv preprint arXiv:1604.03563.
Stankovic, J. A. (2014). Research directions for the internet of things. IEEE Internet
of Things Journal, 1(1), 3-9.
Teizer, J., Cheng, T., & Fang, Y. (2013). Location tracking and data visualization
technology to advance construction ironworkers' education and training in
safety and productivity. Automation in Construction, 35, 53-68.
Travis, D. (2016). Desk research: the what, why and how. Dostupno na http://www.
userfocus. co. uk/articles/desk-research-the-what-why-and-how. html,
pristupljeno, 10, 2017.
Viktor, M.-S., & Kenneth, C. (2013). Big data: A revolution that will transform how
we live, work, and think. Houghton Mifflin Harcourt.
Waal-Montgomery, M. d. (2015). World's data volume to grow 40% per year & 50
times by 2020: Aureus. Retrieved Syyskuu, 28, 2016.

91
Webster, J., & Watson, R. T. (2002). Analysing the past to prepare for the future:
writing a literature review. MIS Quarterly, 26(2), 1-11.
Wei, C., & Li, Y. (2011). Design of energy consumption monitoring and energy-saving
management system of intelligent building based on the Internet of things.
Paper presented at the Electronics, Communications and Control (ICECC),
2011 International Conference on.
Welman, C., Kruger, F., & Mitchell, B. (2005). Research methodology: Oxford
University Press Cape Town.
Whitehorn, M. (2012). Big Data bites back: How to handle those unwieldy digits when
you can't just cram it into tables. Retrieved from
https://www.theregister.co.uk/2012/08/27/how_did_big_data_get_so_big/
Wood, C. (2016). Betting on big data: How construction firms are leveraging digitized
job sites. Retrieved from https://www.constructiondive.com/news/betting-on-
big-data-how-construction-firms-are-leveraging-digitized-job-si/431047/
Xia, F., Yang, L. T., Wang, L., & Vinel, A. (2012). Internet of things. International
Journal of Communication Systems, 25(9), 1101.
Yang, J., Park, M.-W., Vela, P. A., & Golparvar-Fard, M. (2015). Construction
performance monitoring via still images, time-lapse photos, and video streams:
Now, tomorrow, and the future. ADVANCED ENGINEERING
INFORMATICS, 29(2), 211-224.
Yaqoob, I., Hashem, I. A. T., Gani, A., Mokhtar, S., Ahmed, E., Anuar, N. B., &
Vasilakos, A. V. (2016). Big data: From beginning to future. International
Journal of Information Management, 36(6), 1231-1247.

92
Zafira, N. M., Shamsulhadi, B., & Roslan, A. (2018). Potential opportunities and
future directions of big data in the construction industry. Paper presented at
the The 12th SEATUC Symposium 2018, Universitas Gadjah Mada,
Yogyakarta.
Zhang, S., Teizer, J., Lee, J.-K., Eastman, C. M., & Venugopal, M. (2013). Building
information modeling (BIM) and safety: Automatic safety checking of
construction models and schedules. Automation in Construction, 29, 183-195.
Zhang, Y., Luo, H., & He, Y. (2015). A system for tender price evaluation of
construction project based on big data. Procedia Engineering, 123, 606-614.
Zikopoulos, P., Parasuraman, K., Deutsch, T., Giles, J., & Corrigan, D. (2012).
Harness the power of big data The IBM big data platform: McGraw Hill
Professional.

APPENDIX A
APPENDIX A INTERVIEW QUESTION

APPENDIX A
QUANTITY SURVEYING DEPARTMENT
FACULTY OF BUILT ENVIRONMENT
UNIVERSITI TEKNOLOGI MALAYSIA
SEMI-STRUCTURED INTERVIEW FORM FOR
AN APPRAISAL INTO THE POTENTIAL APPLICATION OF
BIG DATA IN CONSTRUCTION INDUSTRY
Objective of Interview:
1. To seek opinions on the direction of big data in the construction
industry.
2. To seek opinions and suggestions on the potential application of
big data in the construction industry.
Prepared by; Siti Aisyah binti Ismail (A13BE0148) 941101-08-6232 4SBEQ (Bachelor of Quantity Surveying) Email : [email protected] / [email protected]
Tel: 018-9714460
Supervisor : Dr Shamsulhadi bin Bandi
NOTES: This interview session is used to collect data for the above study. All the
information given will be kept as PRIVATE & CONFIDENTIAL and for the use of
academic purposes only. The interview will only be recorded with the consent of the
interviewees.

APPENDIX A
SECTION A: INTERVIEW SESSION DETAILS
Date
Day
Venue
SECTION B : INTERVIEWEE DETAILS
Name
Designation
Background
SECTION C
Big data concept is normally based on the 3Vs (volume, variety and velocity) where
according to Gartner IT Glossary, big data is ‘a high-volume, high-velocity and/or
high-variety information assets that demand cost-effective, innovative forms of
information processing that enable enhanced insight, decision making, and process
automation’.
1. How do you think the concept is being practiced in the context of construction
industry?
Based on literature review, the applicability of big data in construction industry is
magnified by the emerging trends in the industry such as BIM, Internet of Things
(IoT), smart buildings, cloud computing and augmented/virtual reality.
2. What is your opinion on this?
3. Manufacturing and retail industry is among the industry that has already
benefited from the big data adoption. From your opinion, is big data has the
potential to be applied in the construction industry as well?

APPENDIX A
Based on my theoretical analysis of various literature, the results of the big data
research orientation are as follows;
Table 1: Detail context of big data research area
Context of big
data research area
Important
keywords
Detail of research area
Construction Project Management
monitoring Progress/performance monitoring through IoT devices
time, cost Better time and cost management Decision-making Making decision using predictive data that
leads to lower project risk and better management
Safety Site safety, workers’ safety
behaviour
Big data generated through IoT devices in tracking and visualize site safety conditions as well as workers’ behaviour towards safety
Energy management
Consumption, building
performance
Enhancing energy efficiency and building performance through an understanding of building energy consumption
Decision-making design framework
Decision-making Big data for prompt and informed decision-making
Resource management
Resources tracking Resources tracking through IoT devices to improve resources utilization efficiency
4. Based on Figure 1 and Table 1, what is your opinion on the findings?
1 5
2
3
4
Figure 1: Generated model by NVivo software representing the
frequency of big data research area

APPENDIX A
5. Based on your own point of view, where do you think is the future direction of
big data in the construction industry?
6. Do you have any suggestion on the potential application of big data in the
construction industry?
---- End of questions. Thank you ----

APPENDIX B
APPENDIX B INTERVIEW TRANSCRIPT

APPENDIX B
QUANTITY SURVEYING DEPARTMENT
FACULTY OF BUILT ENVIRONMENT
UNIVERSITI TEKNOLOGI MALAYSIA
SEMI-STRUCTURED INTERVIEW FORM FOR
AN APPRAISAL INTO THE POTENTIAL APPLICATION OF
BIG DATA IN CONSTRUCTION INDUSTRY
Objective of Interview:
1. To seek opinions on the direction of big data in the construction
industry.
2. To seek opinions and suggestions on the potential application of
big data in the construction industry.
Prepared by; Siti Aisyah binti Ismail (A13BE0148) 941101-08-6232 4SBEQ (Bachelor of Quantity Surveying) Email : [email protected] / [email protected]
Tel: 018-9714460
Supervisor : Dr Shamsulhadi bin Bandi
NOTES: This interview session is used to collect data for the above study. All the
information given will be kept as PRIVATE & CONFIDENTIAL and for the use of
academic purposes only. The interview will only be recorded with the consent of the
interviewees.

APPENDIX B
SECTION A: INTERVIEW SESSION DETAILS
Date 19th March 2018, 2.30PM
Day Monday
Venue
Bilik Perbincangan BPPIB,
Aras 5, Blok C6, Kompleks C,
Putrajaya
SECTION B: INTERVIEWEE DETAILS
Name Puan Jamaliah binti Jaafar
Designation
Director, Industrial Production and Construction Statistics
Division
Department of Statistics Malaysia (DOSM)
Background
- Working experience : 17 years
- Involved in big data project called price intelligence using
web scraping to collect price data not only from physical shop
but also from online businesses to develop consumers’ price index
- The big data project started in 2014 and is still on-going
SECTION C
Big data concept is normally based on the 3Vs (volume, variety and velocity) where
according to Gartner IT Glossary, big data is ‘a high-volume, high-velocity and/or
high-variety information assets that demand cost-effective, innovative forms of
information processing that enable enhanced insight, decision making, and process
automation’.
1. How do you think the concept is being practiced in the context of construction
industry?
Seperti yang diketahui, data-data sebelum ni kita kumpulkan melalui survey.
Contohnya, kalau nak tahu harga seseuatu barang tu, kita akan pergi kedai ke kedai
untuk dapatkan harga jualan. Tapi, dengan teknologi harini, data harga tu kita boleh
dapat melalui internet juga. Benda ni sama juga kalau kita kaitkan dengan construction
industry. Penggunaan teknologi dalam pembinaan juga membolehkan data itu
available untuk dikumpul, dianalisis dan digunapakai dengan cepat. Big data ni dia

APPENDIX B
melibatkan pelbagai sumber data structured, unstructured dan juga data-data dari
media social pun diambil kira. Oleh itu, data tu perlu diteliti terlebih dahulu sebelum
nak gunakan dia means tak boleh amik terus. Data tu kena kaji dahulu before making
decision to utilize it supaya ianya boleh dipercayai.
Based on literature review, the applicability of big data in construction industry is
magnified by the emerging trends in the industry such as BIM, Internet of Things
(IoT), smart buildings, cloud computing and augmented/virtual reality.
2. What is your opinion on this?
Betul. Big data memang sebenarnya disokong oleh trend2 lain yang semakin
berkembang. Cloud computing contoh yang paling mudah dimana data-data sekarang
kita boleh dapat dari internet. Data-data yang banyak dan dating daripada pelbagai
sumber tu kita kumpulkan, proses atau analisis dan seterusnya diterbitkan on internet
untuk kegunaan pelbagai pihak. Selain itu, penggunaan IoT devices untuk big data
juga banyak tetapi banyak di Negara luar kalau untuk construction industry. Malaysia
masih belum apply lagi kalau ada pun mungkin hanya company yang berkeupayaan
sahaja yang mampu. Sebab teknologi IoT ni usually costly.
3. Manufacturing and retail industry is among the industry that has already
benefited from the big data adoption. From your opinion, is big data has the
potential to be applied in the construction industry as well?
Yes, memang berpotensi. Sebenarnya big data ni memang berpotensi untuk pelbagai
industri sebabnya setiap industri pun akan ada data, akan deal with data yang menepati
ciri big data tu. So, construction industry memang tidak terkecuali.

APPENDIX B
Based on my theoretical analysis of various literature, the results of the big data
research orientation are as follows;
Table 1: Detail context of big data research area
Context of big
data research area
Important
keywords
Detail of research area
Construction Project Management
monitoring Progress/performance monitoring through IoT devices
time, cost Better time and cost management Decision-making Making decision using predictive data that
leads to lower project risk and better management
Safety Site safety, workers’ safety
behaviour
Big data generated through IoT devices in tracking and visualize site safety conditions as well as workers’ behaviour towards safety
Energy management
Consumption, building
performance
Enhancing energy efficiency and building performance through an understanding of building energy consumption
Decision-making design framework
Decision-making Big data for prompt and informed decision-making
Resource management
Resources tracking Resources tracking through IoT devices to improve resources utilization efficiency
1 5
2
3
4
Figure 1: Generated model by NVivo software representing the
frequency of big data research area

APPENDIX B
4. Based on Figure 1 and Table 1, what is your opinion on the findings?
Setuju dengan construction project management. Sebab kalau kita lihat pun negara-
negara luar memang dah mula guna big data contoh dalam penentuan bajet pembinaan,
mengurangkan risiko projek supaya projek tidak delay dengan menggunakan pelbagai
sumber maklumat sesuai dengan ciri-ciri big data itu sendiri. Mereka juga
menggunakan big data ni untuk organize construction site. Contohnya seperti saya
katakan tadi, penggunaan IoT devices seperti sensors. Dari apa yang saya tahu, negara
luar, mereka dah mula apply sensors dekat jentera-jentera yang digunakan di dalam
pembinaan untuk track location jentera tersebut dan penggunaan jentera itu.
Maksudnya macam kalau jentera tu tidak digunakan atau sedang digunakan, dia boleh
tahu. Dari situ dia boleh manage jentera-jentera di tapak pembinaan. Tetapi, rasanya
dalam Malaysia belum apply lagi. If ada pun maybe company yang berkeupayaan
sahaja yang mampu.
5. Based on your own point of view, where do you think is the future direction of
big data in the construction industry?
Construction project management memang will be the future sebab macam contoh
yang saya berikan tadi dari Negara luar, semua tu ke arah pengurusan projek, dan
aplikasi yang sama mungkin boleh di apply di Malaysia. Selain itu, mungkin untuk
membantu dalam decision making. Sebab data-data yang banyak dan dari pelbagai
sumber ni kalau kita dapat extract the value, memang ia dapat membantu dalam
membuat sesuatu keputusan. Contohnya, kalau dalam hidupan harian, jika kita nak
buat sesuatu keputusan, mesti kita akan meneliti setiap maklumat yang berkenaan
sampai kita dapat keputusan yang betul.
6. Do you have any suggestion on the potential application of big data in the
construction industry?
Kalau ikutkan big data project yang saya involve sekarang adalah berkenaan web
scraping dimana data-data berkenaan harga yang dikumpul melalui survey dan juga
data daripada internet digabungkan di dalam satu platform. Di sini, harga-harga ni
dapat dianalisis untuk membangunkan indeks harga. Mungkin konsep yang sama

APPENDIX B
boleh digunakan. Contohnya, buat satu system harga untuk barang-barang pembinaan
di mana sistem tu boleh digunakan untuk menentukan bajet pembinaan. Data-data
harga tu adalah data yang updated dari masa ke semasa mengikut perubahan harga
supaya ianya reliable untuk dirujuk. Dengan adanya sistem ni, penentuan harga tidak
akan melebihi harga sebenar dan keputusan dalam pemilihan kontraktor semasa proses
pembidaan projek boleh improve. Maksudnya di sini, bila semua kontraktor bid
menggunakan indeks harga yang ditetapkan dalam sistem tu, so harga masa bidding
process tu akan jadi lebih competitive.
---- End of questions. Thank you ----
APPENDIX B
QUANTITY SURVEYING DEPARTMENT
FACULTY OF BUILT ENVIRONMENT
UNIVERSITI TEKNOLOGI MALAYSIA
SEMI-STRUCTURED INTERVIEW FORM FOR
AN APPRAISAL INTO THE POTENTIAL APPLICATION OF
BIG DATA IN CONSTRUCTION INDUSTRY
Objective of Interview:
1. To seek opinions on the direction of big data in the construction
industry.
2. To seek opinions and suggestions on the potential application of
big data in the construction industry.
Prepared by; Siti Aisyah binti Ismail (A13BE0148) 941101-08-6232 4SBEQ (Bachelor of Quantity Surveying) Email : [email protected] / [email protected]
Tel: 018-9714460
Supervisor : Dr Shamsulhadi bin Bandi
NOTES: This interview session is used to collect data for the above study. All the
information given will be kept as PRIVATE & CONFIDENTIAL and for the use of
academic purposes only. The interview will only be recorded with the consent of the
interviewees.

APPENDIX B
SECTION A: INTERVIEW SESSION DETAILS
Date 30th March 2018, 10.00AM
Day Friday
Venue
S P Setia Bhd Corporate HQ,
No. 12, Persiaran Setia Dagang,
Setia Alam, Seksyen U13,
40170 Shah Alam,
Selangor Darul Ehsan, Malaysia
SECTION B: INTERVIEWEE DETAILS
Name M. Shahrul Azri Bin Mamat
Designation Senior Manager
Design
Background
- Working experience : 8 years
- Never involve in big data project
- Familiar with the technologies that causes the emerging of big
data but never thought that the data generated from the
technologies is called as big data
- Went to few conferences and knowledge sharing on the
utilization of advanced technologies in the construction
industry
SECTION C
Big data concept is normally based on the 3Vs (volume, variety and velocity) where
according to Gartner IT Glossary, big data is ‘a high-volume, high-velocity and/or
high-variety information assets that demand cost-effective, innovative forms of
information processing that enable enhanced insight, decision making, and process
automation’.
1. How do you think the concept is being practiced in the context of construction
industry?
Big data in the construction industry kebanyakannya digunakan untuk BIM di mana
daripada BIM itu sendiri all construction data/informations are gathered. Data itu
adalah dalam bentuk material (dari supplier), data dari segi costing atau price. Data-
data ini dirangkumkan untuk biasanya kalau BIM digunakan secara menyeluruh

APPENDIX B
contohnya BIM level up to 5D 6D will include cost and project scheduling. So bila ia
melibatkan all of that, maksudnya banyak information will be included in the BIM
contohnya dari segi volume – materials data or any other data will be gathered all
together. Variety – kebanyakan jenis2 data yang ada dalam model itu sendiri to form
a model and model itu digunakan untuk construction purposes. Velocity – In
construction industry, particularly overseas, big data is already matured - dah banyak
apply BIM even stage BIM itu sendiri dah achieve up to 6D 7D while in Malaysia
we’re still at 3D 4D. Dekat sana dah boleh ada data yang banyak dikumpul and even
in a meeting pun they will use the same data. Bila meeting just buka all the data they
have dalam satu platform. Data yang sama reach the stakeholders at instant compared
dengan conventional way different dimana stakeholders akan guna data yang
personally emailed or given to them which may differ from the data yang diterima oleh
stakeholders lain.
Based on literature review, the applicability of big data in construction industry is
magnified by the emerging trends in the industry such as BIM, Internet of Things
(IoT), smart buildings, cloud computing and augmented/virtual reality.
2. What is your opinion on this?
Yes, seperti yang saya katakan tadi, penggunaan BIM di dalam construction industry
memang influence the big data.
3. Manufacturing and retail industry is among the industry that has already
benefited from the big data adoption. From your opinion, is big data has the
potential to be applied in the construction industry as well?
Yes, memang berpotensi to be applied dan akan memberi big impact to the
construction industry but adoption very slow sebab technology. Kita adopt technology
from outside so it is costly. That is why now we adopt one by one. Contohnya, kita
start dengan 3D modelling dulu only then baru start dengan project coordination using
IoT. Macam ada certain overseas country yang dah ada satu base using IoT dimana
guna satu platform untuk do the checking on site and keluarkan RFI, keluarkan semua
EI/AI through one platform so everything tracked. Sekarang dekat Malaysia, benda ini

APPENDIX B
ada but terlalu sedikit. Dah ada BIM level tapi tak sampai project scheduling and
project tracking lagi sebab we need technology for this. And it also requires internet.
The thing is internet speed sini memang slow lagi compared to kat luar which is 2 to
3 times slower. So that influence the adoption of big data analysis and etc. And untuk
upgrade semua itu – cost. Cost untuk Malaysia mahal, sebab satu is currency kalau
currency kita sama macam Singapore maybe adoption boleh jadi cepat. So, one thing
is cost. Kesimpulannya, memang big data akan bring huge impact but at the same time
kita belum ready in terms of budget as well as knowledge and skill.
Based on my theoretical analysis of various literature, the results of the big data
research orientation are as follows;
Table 1: Detail context of big data research area
Context of big
data research area
Important
keywords
Detail of research area
Construction Project Management
monitoring Progress/performance monitoring through IoT devices
time, cost Better time and cost management
1 5
2
3
4
Figure 1: Generated model by NVivo software representing the
frequency of big data research area
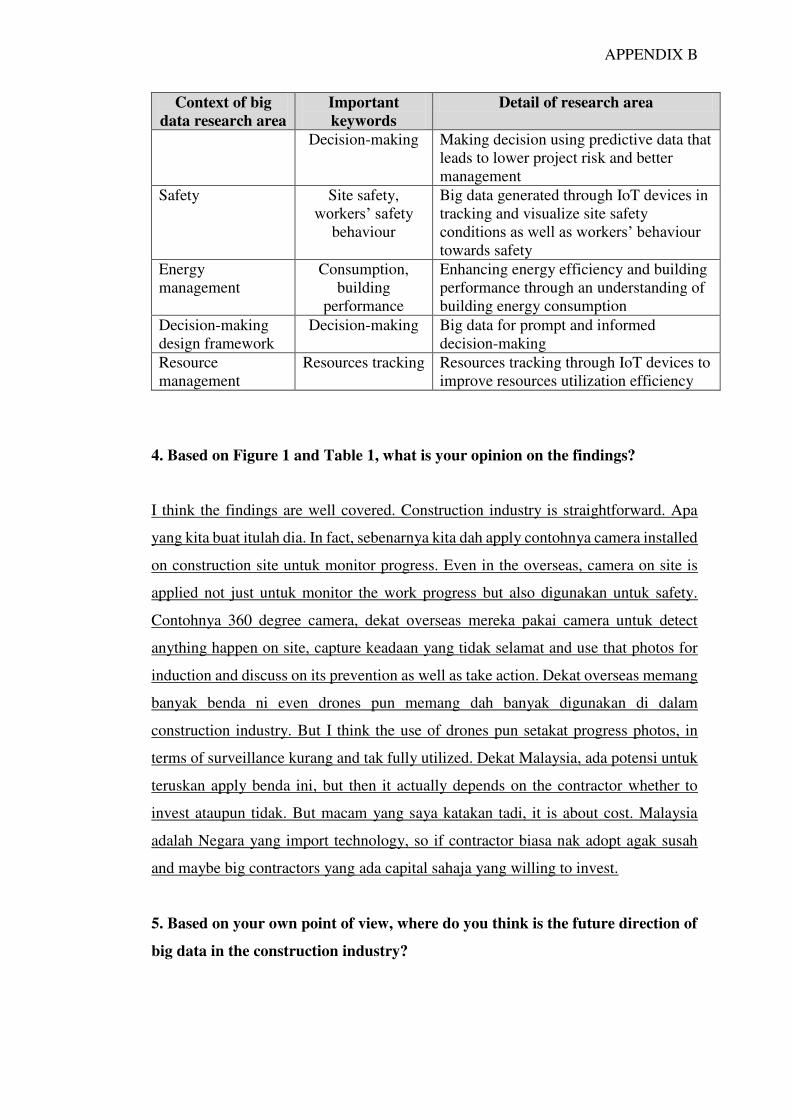
APPENDIX B
Context of big
data research area
Important
keywords
Detail of research area
Decision-making Making decision using predictive data that leads to lower project risk and better management
Safety Site safety, workers’ safety
behaviour
Big data generated through IoT devices in tracking and visualize site safety conditions as well as workers’ behaviour towards safety
Energy management
Consumption, building
performance
Enhancing energy efficiency and building performance through an understanding of building energy consumption
Decision-making design framework
Decision-making Big data for prompt and informed decision-making
Resource management
Resources tracking Resources tracking through IoT devices to improve resources utilization efficiency
4. Based on Figure 1 and Table 1, what is your opinion on the findings?
I think the findings are well covered. Construction industry is straightforward. Apa
yang kita buat itulah dia. In fact, sebenarnya kita dah apply contohnya camera installed
on construction site untuk monitor progress. Even in the overseas, camera on site is
applied not just untuk monitor the work progress but also digunakan untuk safety.
Contohnya 360 degree camera, dekat overseas mereka pakai camera untuk detect
anything happen on site, capture keadaan yang tidak selamat and use that photos for
induction and discuss on its prevention as well as take action. Dekat overseas memang
banyak benda ni even drones pun memang dah banyak digunakan di dalam
construction industry. But I think the use of drones pun setakat progress photos, in
terms of surveillance kurang and tak fully utilized. Dekat Malaysia, ada potensi untuk
teruskan apply benda ini, but then it actually depends on the contractor whether to
invest ataupun tidak. But macam yang saya katakan tadi, it is about cost. Malaysia
adalah Negara yang import technology, so if contractor biasa nak adopt agak susah
and maybe big contractors yang ada capital sahaja yang willing to invest.
5. Based on your own point of view, where do you think is the future direction of
big data in the construction industry?

APPENDIX B
Saya rasa if daripada findings yang you dapat, saya merasakan memang banyak
tertumpu kepada construction project management sebab kalau kita nak memastikan
sesebuah projek itu berjaya, the management of the project itself kena bagus. Selain
itu, safety and decision-making design framework. Safety macam yang saya katakan
tadi, instead of just gunakan camera dan drones untuk kegunaan project progress
monitoring, utilize it more untuk monitor safety. Design pula sebab Malaysia sekarang
is getting familiarized with BIM, so sedikit sebanyak dia menyumbang kepada
decision making untuk design. But if BIM is been taking to the next level macam 5D,
6D or 7D, secara tidak langsung application big data itu sendiri pun akan berkembang
beyond design.
6. Do you have any suggestion on the potential application of big data in the
construction industry?
Dalam construction industry banyak guna data untuk past analysis. Contohnya, detect
semua masalah dalam model, resolve dekat situ then baru start construction. So benda
tu dah termasuk dalam data, dimana benda tu boleh digunapakai untuk next project.
Contoh macam government sebenarnya dah start guna pakai data yang diaorang ada
untuk learn from past project so that next project takkan buat kesalahan yang sama lagi
and dalam pada masa yang sama dari situ kita dapat kurangkan risiko. Risiko mesti
ada, sebab apa-apa pun mesti ada risiko. Tetapi if benda ni is applied, dia dapat bantu
untuk kurangkan risiko sebab less mistakes means less risks. Dari segi property pula,
contohnya untuk market diaorang kumpul data ni dalam bentuk keinginan pembeli
tidak kira samaada dari electronic survey ke, facebook ke, semua akan dikumpulkan.
Information macam pembeli nak rumah macammana, katmana, design, environment,
open spaces, facilities – data-data ni dikumpul untuk create market untuk property
macam development, data tu digunapakai untuk cater for certain-certain demand. Ini
dalam context property lah tapi benda ni sebenarnya merangkumi construction juga
macam lepas kita analyse all the data kita akan dapat tahu the demand so construction
have to follow it in terms of the design, material semua will be various. Selain monitor
guna camera atau drones, boleh juga pakai teknologi wearable devices. Wearable
device sekarang ni dah dapat perhatian juga. Tapi yang kita nampak harini mungkin
banyak guna untuk personal use macam smart watch tu. Kalau untuk construction
industry, wearable device ni boleh jadi safety boot kita, safety hat di mana kita boleh

APPENDIX B
track pekerja kita samaada apa yang mereka sedang buat ataupun monitor safety
behaviour mereka. So, pihak atas dapat monitor secara langsung and tindakan pun
boleh diambil dengan cepat sebab information tu dapat cepat. Also, kalau boleh adopt
yang lebih advanced, mungkin boleh guna teknologi macam masa saya pergi satu talk,
orang tu share dekat Australia, excavator tu dia kawal pakai iPad. Contohnya plot
tempat yang kita nak excavate tu, depth dia atau data-data lain berkenaan excavation
tu semua masukkan dalam iPad then dengan teknologi geo-location juga, excavator tu
boleh bekerja sendiri. But this needs a big capital lah. Dekat Australia, labour cost
diaorang boleh cecah 60% dari construction cost that is why diaorang go for
technology. Construction industry is labour intensive, if labour tu still cheap, compare
to technology, the industry will choose labour instead of technology sebab dia murah.
---- End of questions. Thank you ----

APPENDIX B
QUANTITY SURVEYING DEPARTMENT
FACULTY OF BUILT ENVIRONMENT
UNIVERSITI TEKNOLOGI MALAYSIA
SEMI-STRUCTURED INTERVIEW FORM FOR
AN APPRAISAL INTO THE POTENTIAL APPLICATION OF
BIG DATA IN CONSTRUCTION INDUSTRY
Objective of Interview:
1. To seek opinions on the direction of big data in the construction
industry.
2. To seek opinions and suggestions on the potential application of
big data in the construction industry.
Prepared by; Siti Aisyah binti Ismail (A13BE0148) 941101-08-6232 4SBEQ (Bachelor of Quantity Surveying) Email : [email protected] / [email protected]
Tel: 018-9714460
Supervisor : Dr Shamsulhadi bin Bandi
NOTES: This interview session is used to collect data for the above study. All the
information given will be kept as PRIVATE & CONFIDENTIAL and for the use of
academic purposes only. The interview will only be recorded with the consent of the
interviewees.

APPENDIX B
SECTION A: INTERVIEW SESSION DETAILS
Date 16th April 2018, 10.00AM
Day Monday
Venue
Ministry of Works
Level 10, Menara Usahawan,
Persiaran Perdana, Presint 2,
62652 Putrajaya Malaysia
SECTION B: INTERVIEWEE DETAILS
Name Encik Hamidon Bin Sajari
Designation Chief Assistant,
Division of Contractors and Entrepreneur Development
Background
- Working experience : 11 years
- Knowledge on big data : Moderate but is well aware of the
technologies in the construction industry that trigger big data
- Currently trying to propose the extensive usage of drone for
construction site and working on developing a platform to
assist the selection of the best contractor for construction
projects.
SECTION C
Big data concept is normally based on the 3Vs (volume, variety and velocity) where
according to Gartner IT Glossary, big data is ‘a high-volume, high-velocity and/or
high-variety information assets that demand cost-effective, innovative forms of
information processing that enable enhanced insight, decision making, and process
automation’.
1. How do you think the concept is being practiced in the context of construction
industry?
Kita dalam industri pembinaan memang banyak data and memang kita sedia tahu data
yang banyak ni bukan dari satu sumber sahaja tapi dari pelbagai sumber dan dalam
pelbagai bentuk. Value data-data ini sebenarnya sangat diperlukan untuk pelbagai
kegunaan terutamanya dalam meningkatkan industri pembinaan. Setiap agensi
samaada Kerajaan ataupun swasta ada data-data sendiri. JKR ada data sendiri, CIDB
ada data dia sendiri, tapi data-data ni walaupun semuanya data yang berkaitan dalam
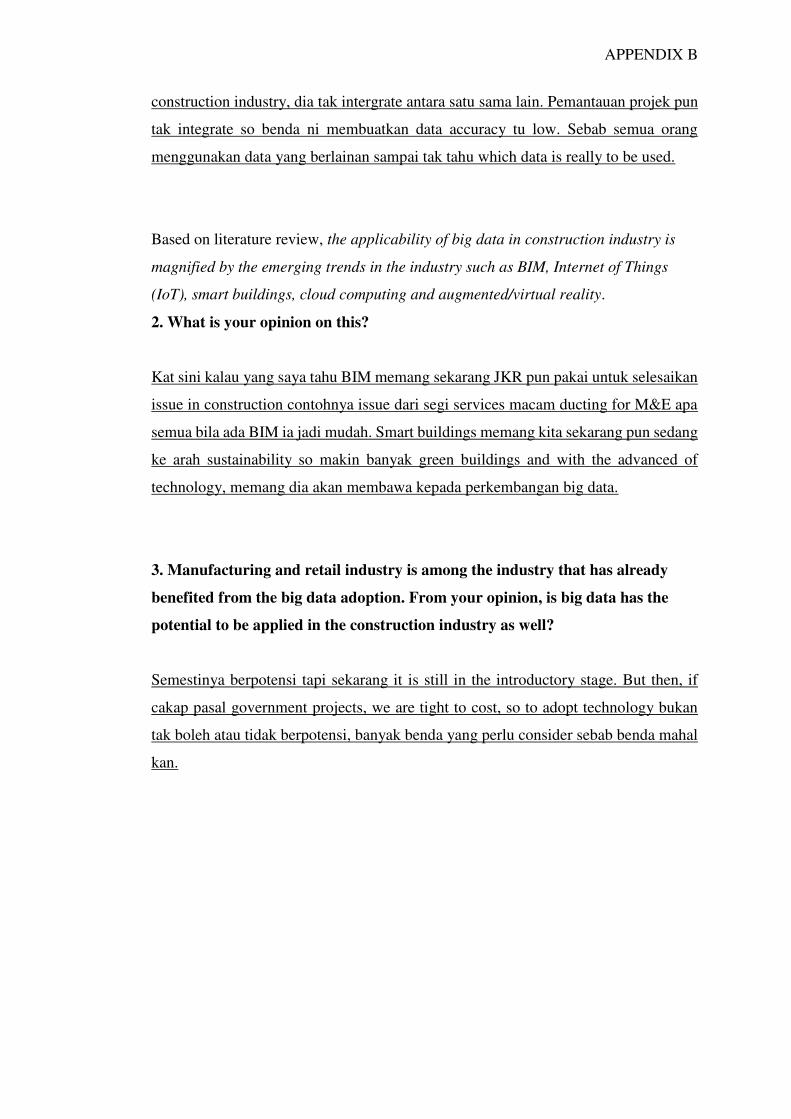
APPENDIX B
construction industry, dia tak intergrate antara satu sama lain. Pemantauan projek pun
tak integrate so benda ni membuatkan data accuracy tu low. Sebab semua orang
menggunakan data yang berlainan sampai tak tahu which data is really to be used.
Based on literature review, the applicability of big data in construction industry is
magnified by the emerging trends in the industry such as BIM, Internet of Things
(IoT), smart buildings, cloud computing and augmented/virtual reality.
2. What is your opinion on this?
Kat sini kalau yang saya tahu BIM memang sekarang JKR pun pakai untuk selesaikan
issue in construction contohnya issue dari segi services macam ducting for M&E apa
semua bila ada BIM ia jadi mudah. Smart buildings memang kita sekarang pun sedang
ke arah sustainability so makin banyak green buildings and with the advanced of
technology, memang dia akan membawa kepada perkembangan big data.
3. Manufacturing and retail industry is among the industry that has already
benefited from the big data adoption. From your opinion, is big data has the
potential to be applied in the construction industry as well?
Semestinya berpotensi tapi sekarang it is still in the introductory stage. But then, if
cakap pasal government projects, we are tight to cost, so to adopt technology bukan
tak boleh atau tidak berpotensi, banyak benda yang perlu consider sebab benda mahal
kan.

APPENDIX B
Based on my theoretical analysis of various literature, the results of the big data
research orientation are as follows;
Table 1: Detail context of big data research area
Context of big
data research area
Important
keywords
Detail of research area
Construction Project Management
monitoring Progress/performance monitoring through IoT devices
time, cost Better time and cost management Decision-making Making decision using predictive data that
leads to lower project risk and better management
Safety Site safety, workers’ safety
behaviour
Big data generated through IoT devices in tracking and visualize site safety conditions as well as workers’ behaviour towards safety
Energy management
Consumption, building
performance
Enhancing energy efficiency and building performance through an understanding of building energy consumption
Decision-making design framework
Decision-making Big data for prompt and informed decision-making
Resource management
Resources tracking Resources tracking through IoT devices to improve resources utilization efficiency
1 5
2
3
4
Figure 1: Generated model by NVivo software representing the
frequency of big data research area

APPENDIX B
4. Based on Figure 1 and Table 1, what is your opinion on the findings?
Memang bagus sebab memang kita mengharap benda ni akan ada. JKR memang dh
lead dalam project management di mana JKR ada system sendiri untuk pemantauan
projek yang dipanggil sebagai sistem kawal dan lapor (SKALA). It is based on the
system where all the JKR punya projects will be in the system start from planning until
penyerahan kepada client and up to defect liability period. Costing, time, decision
making all can be made through the system. Tapi, sistem ni still direkod secara manual,
maksudnya menggunakan kertas atau report form. So, government memang perlu
benda macamni yang boleh meningatkan sistem pemantauan project.
5. Based on your own point of view, where do you think is the future direction of
big data in the construction industry?
Sistem pemantauan projek. JKR ada client dia so pelaporan tu nak cepat and nak
maklumat yang tepat dan sama. Agensi lain takde sistem so proses pelaporan adalah
manual iaitu melalui report then submit manually jadi proses tu lambat sedikit.
Resource management dari segi penghantaran materials yang cepat. Kalau sekarang,
we have IBS di mana sedikit sebanyak membantu dalam mempercepatkan proses
penghantaran dan pemasangan. Tapi in big data context, materials lain yang biasa if
kita adopt the technology, proses penghantaran dia juga boleh jadi cepat.
6. Do you have any suggestion on the potential application of big data in the
construction industry?
Untuk meningkatan sistem pemantauan projek sebenarnya kita ada juga berbincang
berkenaan drones adoption but ia perlu melalui beberapa procedure, kena diluluskan
oleh MoF (Ministry of Finance) sebab drones mahal, so untuk investment terhadap
technology usually need to be reviewed dulu kepentingan dia, how big the impact is if
we adopt it. Tapi sebenarnya drones kalau digunakan pun mesti on progress photo. It
should be more than that, contohnya drones boleh provide real-time punya site
visualisation to the office so that the upper management or client may monitor the
construction site themselves. Selain itu, kita ada juga nak wujudkan satu program

APPENDIX B
untuk cari the best contractor so we need the data. For now, sumber kita adalah
maklumat kontraktor daripada sistem CIDB. If the contractors can provide the
information on the system, benda ni akan memudahkan untuk menilai setiap kontraktor
dan mempercepatkan proses pemilihan kontraktor. Sistem ini boleh menggantikan
sistem manual untuk evaluate semua contractors dan secara tidak langsung dapat
mengelakkan atau mengurangkan keputusan pemilihan kontraktor yang biased. Untuk
materials delivery, penggunaan sensors technology atau IoT devices yang diletakkan
dengan materials atau its transporter dapat membantu untuk memantau pergerakan
resources dan meningkatkan proses penghantaran.
---- End of questions. Thank you ----

APPENDIX B
QUANTITY SURVEYING DEPARTMENT
FACULTY OF BUILT ENVIRONMENT
UNIVERSITI TEKNOLOGI MALAYSIA
SEMI-STRUCTURED INTERVIEW FORM FOR
AN APPRAISAL INTO THE POTENTIAL APPLICATION OF
BIG DATA IN CONSTRUCTION INDUSTRY
Objective of Interview:
1. To seek opinions on the direction of big data in the construction
industry.
2. To seek opinions and suggestions on the potential application of
big data in the construction industry.
Prepared by; Siti Aisyah binti Ismail (A13BE0148) 941101-08-6232 4SBEQ (Bachelor of Quantity Surveying) Email : [email protected] / [email protected]
Tel: 018-9714460
Supervisor : Dr Shamsulhadi bin Bandi
NOTES: This interview session is used to collect data for the above study. All the
information given will be kept as PRIVATE & CONFIDENTIAL and for the use of
academic purposes only. The interview will only be recorded with the consent of the
interviewees.

APPENDIX B
SECTION A: INTERVIEW SESSION DETAILS
Date 22nd March 2018, 2.30PM
Day Thursday
Venue
Public Private Partnership Unit
Department of Prime Minister
Level 7, Menara Usahawan,
Persiaran Perdana, Presint 2,
62652 Putrajaya Malaysia
SECTION B: INTERVIEWEE DETAILS
Name Sr Rodziah Ismail
Designation
Principal Assistant Director,
Quantity Surveying Department,
Public Private Partnership Unit
Background
- Working experience : 16 years
- Previously worked with JKR as a quantity surveyor
- Knowledge on big data : Moderate but is well aware of the
technologies in the construction industry that trigger big data
- Has involved in construction project that employ visual
cameras on site for project monitoring by the upper
management
SECTION C
Big data concept is normally based on the 3Vs (volume, variety and velocity) where
according to Gartner IT Glossary, big data is ‘a high-volume, high-velocity and/or
high-variety information assets that demand cost-effective, innovative forms of
information processing that enable enhanced insight, decision making, and process
automation’.
1. How do you think the concept is being practiced in the context of construction
industry?
Big data kalau ikutkan memang the big volume of the data lah that makes it a big data
dan juga sumber-sumber data yang pelbagai tak kira lah samaada data in different
forms maksudnya macam dari different software atau format dan juga data yang datang
dari different organization. Tapi sebenarnya data-data yang banyak ni is not

APPENDIX B
synchronize with each other. Selalu je dalam construction mesti ada
miscommunication and the main problem is sebab information yang sampai tu tak
sama. Sama juga macam penggunaan software. Setiap stakeholders sometime will be
using different software and at last the information from each stakeholders tu susah
nak intergrate sebab tak compatible.
Based on literature review, the applicability of big data in construction industry is
magnified by the emerging trends in the industry such as BIM, Internet of Things
(IoT), smart buildings, cloud computing and augmented/virtual reality.
2. What is your opinion on this?
Kedatangan BIM actually membantu in the data integration. Sebab using BIM, semua
data tu will be on the model and semua stakeholders will be connected to that one
particular platform maksudnya dia guna data yang sama. Benda ni memang boleh
overcome the miscommunication problem. BIM juga boleh mengatasi problem during
construction, planning, dimana kita boleh nampak dalam design process. Tapi,
investment that has to be made is high and most of the industry players couldn’t afford.
3. Manufacturing and retail industry is among the industry that has already
benefited from the big data adoption. From your opinion, is big data has the
potential to be applied in the construction industry as well?
If talk about the potentiality memang ada potensi but maybe we’re not ready in terms
of infrastructure. Sebab the cost will be high to adopt new technology. If in terms of
talent, saya rasa memang we are moving there. Sebab generasi Y sekarang ni memang
towards the technology so rasanya in terms of talent tiada masalah but maybe boleh
diasah lebih lagi.

APPENDIX B
Based on my theoretical analysis of various literature, the results of the big data
research orientation are as follows;
Table 1: Detail context of big data research area
Context of big
data research area
Important
keywords
Detail of research area
Construction Project Management
monitoring Progress/performance monitoring through IoT devices
time, cost Better time and cost management Decision-making Making decision using predictive data that
leads to lower project risk and better management
Safety Site safety, workers’ safety
behaviour
Big data generated through IoT devices in tracking and visualize site safety conditions as well as workers’ behaviour towards safety
Energy management
Consumption, building
performance
Enhancing energy efficiency and building performance through an understanding of building energy consumption
Decision-making design framework
Decision-making Big data for prompt and informed decision-making
Resource management
Resources tracking Resources tracking through IoT devices to improve resources utilization efficiency
1 5
2
3
4
Figure 1: Generated model by NVivo software representing the
frequency of big data research area

APPENDIX B
4. Based on Figure 1 and Table 1, what is your opinion on the findings?
Dari pengalaman saya for now memang ke arah construction project management. Ada
juga few JKR projects yang memang kita apply the use of visual camera on site untuk
capture the construction work progress. The idea datang sebab bos JKR masa tu nak
monitor sendiri the progress from his office. But then benda ni tak berterusan. Ada
projek yang dah stop gunakan camera untuk real-time punya project monitoring. So,
ia nampak macam tak efficient and membazir sebab tak diguna pakai. Selain itu,
penggunaan camera untuk safety pun penting sebab dah banyak dah kes-kes berkenaan
safety di tapak bina. So, dengan adanya big data ni, maybe it can help to lower down
the figures.
5. Based on your own point of view, where do you think is the future direction of
big data in the construction industry?
Bagi saya mungkin untuk cost atau rates iaitu untuk predict construction cost dan juga
untuk bidding process. Potential sangat besar and in fact before this CIDB ada initiate
nak buat data centre untuk collect data dari industry but then tiada yang ready to share.
Even CIDB bersedia untuk finance the project pun still the readiness is low.
6. Do you have any suggestion on the potential application of big data in the
construction industry?
Potential application mungkin boleh teruskan dengan penggunaan visual camera sebab
actually it helps untuk kurangkan masa to report the progress to the upper management.
Senang, diaorang monitor sendiri. Cepat dan efficient sebab action can be taken
immediately. Kalau conventional way, project manager kena pergi tangkap gambar
progress then report pula, then tunggu the upper management review and only then
decision or any action can be taken. It’s a bit old school and time consuming. Sama
juga kalau kita apply for safety monitoring. Workers punya safety behaviour kita boleh
detect real-time so tindakan boleh diambil segera and secara tidak langsung membantu
mengurangkan kes keselamatan dekat site. If boleh and mampu nak adopt technology
untuk improve the efficiency why not kita buat. Lagipun, not just progress and safety

APPENDIX B
monitoring, data dari visual camera ni pun can be used for the upper management atau
client untuk assess performance contractors and data ni boleh digunakan untuk
membuat keputusan pemilihan kontraktor. Untuk cost atau rates tadi, maybe a system
can be developed untuk set price benchmark. Dengan adanya benchmark ni, kontraktor
akan letak harga yang berpatutan semasa menender. Maksudnya penentuan harga tu
tansparent and benda ni boleh elak kontraktor untuk letak harga sesuka hati samaada
terlalu rendah ataupun terlalu tinggi. Harga-harga tender tu juga boleh dinilai and
compare melalui sistem tu untuk memilih kontraktor yang layak.
---- End of questions. Thank you ----

APPENDIX B
QUANTITY SURVEYING DEPARTMENT
FACULTY OF BUILT ENVIRONMENT
UNIVERSITI TEKNOLOGI MALAYSIA
SEMI-STRUCTURED INTERVIEW FORM FOR
AN APPRAISAL INTO THE POTENTIAL APPLICATION OF
BIG DATA IN CONSTRUCTION INDUSTRY
Objective of Interview:
1. To seek opinions on the direction of big data in the construction
industry.
2. To seek opinions and suggestions on the potential application of
big data in the construction industry.
Prepared by; Siti Aisyah binti Ismail (A13BE0148) 941101-08-6232 4SBEQ (Bachelor of Quantity Surveying) Email : [email protected] / [email protected]
Tel: 018-9714460
Supervisor : Dr Shamsulhadi bin Bandi
NOTES: This interview session is used to collect data for the above study. All the
information given will be kept as PRIVATE & CONFIDENTIAL and for the use of
academic purposes only. The interview will only be recorded with the consent of the
interviewees.

APPENDIX B
SECTION A: INTERVIEW SESSION DETAILS
Date 20th March 2018, 2.30PM
Day Tuesday
Venue Ampang, Kuala Lumpur
SECTION B: INTERVIEWEE DETAILS
Name Puan Hajah Rauzah Zainal Abidin
Designation
Director,
Productivity & Competitiveness Development,
Malaysia Productivity Corporation (MPC)
Background
- Working experience : 28 years
- Currently is retired in April 2018
- Has been given talk during several conferences regarding
the possibility of having big data in Malaysia
- Made survey on the openness of data sharing by different
organizations as she described open data as big data.
- Main focus of big data in the construction industry is on
how big data would be useful in improving the industry’s productivity.
SECTION C
Big data concept is normally based on the 3Vs (volume, variety and velocity) where
according to Gartner IT Glossary, big data is ‘a high-volume, high-velocity and/or
high-variety information assets that demand cost-effective, innovative forms of
information processing that enable enhanced insight, decision making, and process
automation’.
1. How do you think the concept is being practiced in the context of construction
industry?
Government memang encourage big data because all over the world are talking about
big data, about open government so memang it was encouraged all over the world.
When talks about open data means it talks about big data. Kalau nak big data or open
data semua agencies has to be open in sharing data. Tapi, big data bukan sahaja
government yang park the database. Big data can come from google, internet and

APPENDIX B
bukan Malaysia construction only, all over the world. Tu concept big data tu which is
the availability of internet, google, technology and the possibility of getting database
tu mudah dan cepat. However, big data comes in structured and unstructured. So the
data may be used or not.
Based on literature review, the applicability of big data in construction industry is
magnified by the emerging trends in the industry such as BIM, Internet of Things
(IoT), smart buildings, cloud computing and augmented/virtual reality.
2. What is your opinion on this?
Ya, betul. Big data tak datang stand alone. It actually came from these trends yang
push kewujudan big data ni.
3. Manufacturing and retail industry is among the industry that has already
benefited from the big data adoption. From your opinion, is big data has the
potential to be applied in the construction industry as well?
Yes, possibility of having big data in Malaysia’s construction industry memang ada.
Tapi sejauhmana pihak-pihak di dalam industri itu sendiri untuk data sharing, how
open they are kita tidak tahu.

APPENDIX B
Based on my theoretical analysis of various literature, the results of the big data
research orientation are as follows;
Table 1: Detail context of big data research area
Context of big
data research area
Important
keywords
Detail of research area
Construction Project Management
monitoring Progress/performance monitoring through IoT devices
time, cost Better time and cost management Decision-making Making decision using predictive data that
leads to lower project risk and better management
Safety Site safety, workers’ safety
behaviour
Big data generated through IoT devices in tracking and visualize site safety conditions as well as workers’ behaviour towards safety
Energy management
Consumption, building
performance
Enhancing energy efficiency and building performance through an understanding of building energy consumption
Decision-making design framework
Decision-making Big data for prompt and informed decision-making
Resource management
Resources tracking Resources tracking through IoT devices to improve resources utilization efficiency
1 5
2
3
4
Figure 1: Generated model by NVivo software representing the
frequency of big data research area

APPENDIX B
4. Based on Figure 1 and Table 1, what is your opinion on the findings?
Project management dari segi decision making on cost and time dan juga resource
management. As I am focusing dekat produktiviti industri, dua perkara ini jika diberi
perhatian dapat membantu dalam memperbaiki produktiviti construction industry.
5. Based on your own point of view, where do you think is the future direction of
big data in the construction industry?
Bagi saya, big data can help in decision making especially untuk time and cost decision
dan secara tidak langsung contribute to the productivity. Contohnya, producivity
adalah output over input. Output must be bigger. When you have big data sebagai
contoh nak buat rumah satu tingkat seluas 20 x 20 we know that the material, labour
cost berapa per square feet so all those information should be available on the net so
that you can make decision on how much you should spend so that kita ada benchmark
or senang kata bajet. That’s the use of big data then you can make decision on how to
improve in reducing cost so that it meets the benchmark. So dari situ kita akan evaluate
lah workflow, tengok cara buat kerja, employment – people that are well trained or not
well trained to reduce input dan juga kita tengok process flow atau time. Next, untuk
increase output first we can add value to the product so that you can sell at high price.
Contoh design rumah, IBS – boleh jual RM5k but with IBS you can jual at 3k but
market share besar thus output increased.
So, that is how you can improve productivity which is by improve the efficiency or
the value. Selain itu, resource management pun penting especially dalam materials
delivery sebab one of the problems yang menyebabkan produktiviti tu low is because
the long wait of the materials delivery.
6. Do you have any suggestion on the potential application of big data in the
construction industry?
Untuk decision making on cost, macam saya cerita tadi, if nak buat sebuah rumah kita
mesti tahu the price untuk tentukan harga. So, maybe all the data regarding price ni

APPENDIX B
can be gathered on a single platform to assist the decision making for construction
cost. Actually, information tu ada CIDB dah compiled to help contractor in project
planning. But then, dia tak menyeluruh sebab macam saya cakap tadi, big data means
open data. If the data is not being open or shared, penggunaan dia pun tak berapa
efficient. But if can be done, it’s good di mana di dalam sistem tu nanti will be a
benchmark on the material or labour cost and make it available to be used. Selain itu,
decision making such as google extract our information, park it in a database and use
it to predict the consumer pattern. This concept boleh pakai untuk gather buyers’
information extract dari internet on buat satu predictive model di mana ia dapat
membantu in making decision untuk construction type apa yang boleh dibina dan
dibeli di mana ia termasuk lah the design, cost and other related information that
reflects the buyers’ property demand. As for materials delivery, ia boleh
dipertingkatkan dengan penggunaan sensors and geo-tagging technology. Overseas
dah start pakai dah technology macam ni. Kita je still lag behind but probably it is
because of the cost. Penggunaan sensor ni contohnya kita boleh track location
materials tu ada dimana, so secara tidak langsung, it will help to reduce the risk of
materials delay, sebab setiap kali detect any problem, action can be taken immediately.

APPENDIX C PUBLISHED ARTICLE
IN IJBES

International Journal of Built Environment and Sustainability
IJBES
E-ISSN:2289-8948 ISSN: 1511-1369
Volume 5, Issue 2, 2018 May 2018
Published by
Faculty of Built Environment Universiti Teknologi Malaysia
In collaboration with
Penerbit UTM Universiti Teknologi Malaysia
81310, Johor Bahru, Malaysia

ii
IJBES International Journal of Built Environment and Sustainability
http://ijbes.utm.my
EDITORIAL BOARD
Roslan Amirudin, Chief Editor, Universiti Teknologi Malaysia Ariva Sugandi Permana, Managing Editor, Universiti Teknologi Malaysia Shamsul Hadi Bandi, Assistant Managing Editor, Universiti Teknologi Malaysia
International Editorial Board
ATM Nurul Amin, Northsouth University, Bangladesh Anoma Kumarasuriayar, Queensland University of Technology, Australia Ansar-Ul-Haque Yasar, Hasselt University, Belgium Awais Piracha, University of Western Sydney, Australia Bhishna Bajracharya, Bond University, Australia Chandrasekar Parsuvanathan, Velammal Engineering College, India Jayant K. Routray, Asian Institute of Technology, Thailand Jung-Geun Ahn, Gyeongsang National University, Korea Kwon Tae Ho, Semyung University, Korea Ludovic Lacrosse, Executive Chairman of Full Advantage Company, Thailand Michail Kagioglou, University of Huddersfield, United Kingdom Michihiko Shinozaki, Shibaura Institute of Technology, Japan Mohammed A. Husain, Modibbo Adama University of Technology, Nigeria Muhammad Abu Yusuf, Asian Institute of Technology, Thailand Ranjith Perera, Sultan Qaboos University, Oman Roos Akbar, Bandung Institute of Technology (ITB), Indonesia Shahed Khan, Curtin University of Technology, Australia Soheil Sabri, University of Melbourne, Australia Sudaryono Sastrosasmito, Gadjah Mada University, Indonesia Tetsu Kubota, Hiroshima University, Japan Vilas Nitivattananon, Asian Institute of Technology, Thailand
National Editorial Board
Mansor Ibrahim, International Islamic University, Malaysia Shamsul Hadi Bandi, Universiti Teknologi Malaysia Julaihi Wahid, Universiti Sains Malaysia Zalina Shari, Universiti Putra Malaysia Zahid Sultan, Universiti Teknologi Malaysia Ariva Sugandi Permana, Universiti Teknologi Malaysia Ismail Said, Universiti Teknologi Malaysia M. Rafee Majid, Universiti Teknologi Malaysia Kherun Nita Ali, Universiti Teknologi Malaysia Hamidah Ahmad, Universiti Teknologi Malaysia Hasanuddin Lamit, Universiti Teknologi Malaysia Mahmud Mohd Jusan, Universiti Teknologi Malaysia Raja Nafida bt Raja Shahminan, Universiti Teknologi Malaysia Tareef Hayat Khan, Universiti Teknologi Malaysia Khairul Anwar Khaidzir, Universiti Teknologi Malaysia Gurupiah Mursib, Universiti Teknologi Malaysia Wan Hashimah Wan Ismail, Universiti Teknologi Malaysia Fadhlin Abdullah, Universiti Teknologi Malaysia Nur Emma Mustapa, Universiti Teknologi Malaysia Razali Adul Hamid, Universiti Teknologi Malaysia Muzani Mustaffa, Universiti Teknologi Malaysia

iii
Mail Address:
International Journal of Built Environment and Sustainability Faculty of Built Environment Universiti Teknologi Malaysia 81310, Johor Bahru, Malaysia Telephone: +60-7-5537382
Email: [email protected] and [email protected]
Copyright © FAB, UTM, 2017 Cover Design and Type-set by: AS Permana/S Bandi
DISCLAIMERS: This publication is intended to enrich the knowledge in the field of built environment and
sustainability. Therefore, you may use the materials contained herein for free as long as for the use of academic purpose. However, you must cite this scientific material properly
The views expressed in this publication do not necessarily reflect the views of the Faculty of Built
Environment, Universiti Teknologi Malaysia.
The IJBES is an international peer-reviewed Journal Published in collaboration between Faculty of Built Environment and Penerbit UTM
E-ISSN: 2289-8948 ISSN: 1511-1369

iv
IJBES Volume 5, Issue 2, 2018
Table of Contents
1. Evaluating the Critical Success Factors of Industrialised Building System Implementation in
Nigeria: The Stakeholders’ Perception Edo OO, MH Osman, AB Abdul Rahman, N Bakhary
3. Facility Management of Nigerian Universities: Case of University of Lagos, Lagos and the
Bells University of Technology, Ota, Nigeria Oyedeji, Joseph Oyewale
4. An Appraisal into the Potential Application of Big Data in the Construction Industry
SA Ismail, S Bandi, ZN Maaz
5. Investigation of the Use of Energy Efficient Bulbs in Residential Buildings in Ile-Ife, Osun State, Nigeria
Wahab Akeem Bolaji
127-133
134-144
145-154
155-162

145
1. Introduction
Big data has been buzzing among many industries around the world on its potential in dissolving most of the industries’ common issues and transform them into a smarter way of operating. The advent of big data era is initiated by the data explosion resulted from the presence of advanced technology in today’s world. According to Waal-Montgomery (2015) prediction, the world’s data volume will rise at approximately 40% per year, and will continue to intensify fifty times from the current volume by the year 2020. The pace in which data is being generated has lead towards data explosion hence big data gain its traction. Basically, big data is often termed based on the 3Vs namely (i) Volume - amount of the data itself, (ii) Velocity – the speed where the data is generated and (iii) Variety – the diversity and complexity of data sources. The construction industry is known to deal with enormous amount of data that reflects the 3Vs and the utilization of these data could be the next frontier for construction industry development.
Peiffer (2016) asserted big data as one of the significant driving factor in configuring the direction which should lead towards improving the industry’s efficiency. Though the construction industry is acknowledged as one of the indicator for economic wellbeing, productivity and
efficiency are at an all-time low which Harenberg (2017) sorely contended in comparison to when it was in the year 1993. This inefficiency, according to Santiago Castagnino, Christoph Rothballer, and Gerbert (2016) was the result of the slow movement made by the industry in adopting new technologies. This is supported by the MGI’s digitization index that put construction sector as the least digitized industry in the world. Santiago Castagnino et al. (2016) added the deliberate changes made by the industry is caused by the insufficient data-driven decision making.
Data is said to be the poster child in enhancing the industry’s productivity. This follows as a real-time data exchange could lead to a broadened insight into the industry’s operational performance thus making way for a smarter working (Peiffer, 2016). However, albeit of the massive amount of data that is generated in the construction industry, the big data is usually siloed and not being fully utilized for a bigger picture. According to Burger (2017), the inefficiencies of data usage is due to the limited ability in dealing with unstructured data such as free text, images or sensors reading. This is where big data could be the saviour in improving the utilization of data.
INTERNATIONAL JOURNAL OF BUILT ENVIRONMENT AND SUSTAINABILITY Published by Faculty of Built Environment, Universiti Teknologi Malaysia
Website: http://www.ijbes.utm.my
IJBES 5(2)/2018, 145-154
An Appraisal into the Potential Application of Big Data in the Construction Industry Siti Aisyah Ismail; Shamsulhadi Bandi and Zafira Nadia Maaz Department of Quantity Surveying, Faculty of Built Environment, Universiti Teknologi Malaysia Email: [email protected]
ABSTRACT The volume of data generated by the construction industry has increased exponentially following an intense use of modern technologies. The data explosion thus lead towards the big data phenomenon which is envisioned to revolutionize the construction like never before. Like any other technologies, big data is a disruptive paradigm and inevitably will give impact to the construction industry. As the industry is refocusing towards an improved productivity, the appeal to embrace big data is certain given the value it offers. This certainly will benefit construction akin to the manufacturing and the retail industry alike. Nevertheless, a review of the literature suggested a limited coverage on the potential application of big data in construction as compared to other industries. This limits understanding of its potential, where the industry is seemingly unaware thus could not relate and extract its real value. Hence, this study aims to draw insights on the specific areas of construction big data research. The research objectives include: (1) to analyse the current extent of construction big data research; (2) to map out the orientation of the current construction big data research; and (3) to suggest the current directions of construction big data research. The qualitative method through a desk study approach has been carried out to attain the first two objectives. It involved a structured review process which covered articles from the online databases assisted by the Nvivo software. This resulted in the theoretical orientation which was conceptualized as: (1) project management; (2) safety (3) energy management; (4) decision making design framework and (5) resource management. The theoretical orientation discovered from the review process will form the basis to suggest the prospective directions of research on big data in construction. This exploration is substantial as a precursor to a much deeper study on big data. As big data is set to influence the industry, the finding made would be a catalyst for creating an awareness to support the development of big data for the construction industry.
History:
Received: 5 April 2018 Accepted: 26 April 2018 Available Online: 31 May 2018 Keywords:
Big Data, Construction Industry, Disruptive Technology, Nvivo, Qualitative research. Corresponding Author Contact: +607-5537378 DOI:
10.11113/ijbes.v5.2.274

146
According to the Construction Industry Development Board Malaysia (CIDB), reliable and quality big data is currently in demand to align with the board’s initiatives under the aspiration of the Construction Industry Transformation Programme (CITP). In conjunction with this, it is essential to identify the level of big data needs for the industry. The current move by CIDB is justified as the most typical error made by organizations was to utilize big data without assessing whether their needs could be satisfied by the use of the technology (Portela, Lima, & Santos, 2016). Likewise, Addo-Tenkorang and Helo (2016), added that there appear to be a limited understanding on the value and the potential of big data for construction. This had resulted in a consequential discouragement in the progress for the adoption of big data in construction industry as compared to other industries. Data and the construction industry are indivisible as the industry are dealing with a huge amount of heterogeneous data. This follows as data related to construction industry has been predicted by Bilal, Oyedele, Qadir, et al. (2016) to rise exponentially with the advancement of technologies and the Internet of Things (IoT). According to Addo-Tenkorang and Helo (2016), new opportunities in the form of valuable insights can be developed by excerpting the huge amount of data obtained. Despite, a study that focuses on the potential application of big data particularly in the construction industry has not been comprehensively undertaken (Bilal, Oyedele, Qadir, et al., 2016). This limits understanding of its potential, where the industry is seemingly unaware thus could not relate and extract its real value. Hence, this study aims to draw insights on the specific areas of construction big data research. The research objectives include: (1) to analyse the current extent of construction big data research; (2) to map out the orientation of the current construction big data research; and (3) to suggest the current directions of construction big data research. As big data is set to influence the industry, the research findings would be a catalyst for creating the much-needed awareness to support the development of big data for the construction industry. This would further lead the industry to gear up in developing their capabilities in harnessing the potential of big data as well as encouraging talent and infrastructure development to engage in the forthcoming wave of big data technology in the construction industry.
2. Literature Review 2.1 An overview of Big Data The renowned 3Vs characteristics which form the big data concept were established by one of the Gartner analyst named Laney Doug in 2001. Respectively, the Gartner’s IT Glossary defined big data as a high-volume, high-velocity and/or high-variety information assets that demand cost-effective, innovative forms of information processing that enable enhanced insight, decision making and process automation (Gartner, 2014). With the arrival of big data, data will no longer be viewed as stagnant whose worth is limited to the accomplishment of its gathering purposes (Viktor & Kenneth, 2013). Whereas, in order to cross the boundary of data collecting purposes, the data need to be handled by means of advanced technologies and human skills as well as data entry base. However, according to Akbar (2017), the current amount of digital information had surpassed the ability of the present tools to process it. This situation is described as “The Industrial Revolution of Data” by Joe Hellerstein, a computer scientist at the University of California in Berkeley and it has affected various public and private sectors (Cukier,
2010). Definition of big data might varies in different literature, but the domain of the concept is the 3Vs characteristics. Volume is the most important characteristic that represents the extent of big data magnitude. According to C. P. Chen and Zhang (2014) volume is epitomized as the size of the data itself that are generated by the advanced technologies, networks and human interactions especially on the nets (Hammer, Kostroch, & Quiros, 2017). On the other hand, velocity signifies that data is produced at a remarkably high speed which outstrips the conventional systems (Zikopoulos, Parasuraman, Deutsch, Giles, & Corrigan, 2012). Data velocity is regarded as a supplementary to data volume as greater data volume requires the data processing to
be winged (Özköse, Arı, & Gencer, 2015). As Gartner (2015) has
profoundly predicted, there will be as much as 20.8 billion connected devices by the year 2020 as compared to 6.4 billion as reported in 2016. This shows that the pace of data velocity will continue to speed up following the connected devices’ enhanced features for data streaming (Lee, 2017). Last is variety which means the diversity and complexity of data categories and sources (Zikopoulos et al., 2012). According to Özköse et al. (2015), data may be derived from various resources both internally and externally. Similarly, O'Reilly (2014) emphasized in his book that these data come from an assortment of structures and it is often hard to obtain an impeccably, processing-ready data. Such data can be categorized into structured, semi-structured or unstructured data. This classification of data is derived from the existence of the social network, sensors, mobile devices, GPS and other technological appliances (Portela et al., 2016). 2.2 Current Big Data application in other sectors In recent times, big data has been discussed across various sectors and is considered as a game changer in major industries (Gaitho, 2017). For this reason, many organizations have taken steps to change their plan of action in utilizing the big data value effectively (Akbar, 2017). A survey made by Gartner in 2015 proved that companies have incrementally increased their investment in big data to 75% from 58% recorded by the same survey in 2012. The extensive scope of big data has provided a massive scale of potential and value that can be generated across different sectors such as retail sector, manufacturing as well as the upstream industry. Retail sector is among the earliest to recognise the potential of big data. This follows from the upsurge of e-commerce during the big data 1.0 era (Laney, 2001). During that time retail businesses leveraged the power of basic internet technologies to establish a strong web presence followed by building their capacity to process a large data which was conducive to their efficiency improvements (Provost & Fawcett, 2013). The potential was further extended in analysing the vast amount of data to support decision to expand businesses, improve cost efficiency and revenue forecasting (Meneer, 2015). Manufacturing is another leading sector that has moved towards big data exploration in enhancing their product quality, and at the same time reducing the operational costs (Oracle, 2015). External data especially from social networks and suppliers’ data combined with data from sensors and machines has given valuable insights to the existing information. In this respect, big data was utilized to analyse varieties in enhancing the efficiency of manufacturing and the operational process by providing the bird’s eye view of the processes which led to a better decision making. Apart from that, big data technologies also assist in improving the product quality and reducing the overall cost through production and quality data analysis

147
along with customers’ returning data, capacity consumption as well as machinery efficiency (Oracle, 2015). The oil and gas industry has also gained a lot from big data. According to B. Mathew (2016), in the current situation, data collected particularly in the operational process is used mainly for detection and control purposes. Big data’s advanced analytics assisted in the decision making where big data insights were used to plan for predictive maintenance. In this case, it was reported that the technology has managed to bring the maintenance cost down to about 13% (Choudhry, Mohammad, Tan, & Ward, 2016). The benefits of digital monitoring and predictive maintenance extends towards detecting errors on equipment and performing maintenance before they are entirely damaged. It was reported by analytics firm, Kimberlite that an approximately $49 million annually were wasted due to an unplanned downtime (Choudhry et al., 2016). Hence, big data in this respect helped to enhance production and addressed the financial impacts before it eventually occurs. 2.3 Big Data and the Construction Industry Construction is one of the major industry that is responsible towards a country development. The construction works to be carried out in a project is dynamic (Wood, 2016) and involve a high volume of data exchange from various stakeholders to be gathered and processed (Shrestha, 2013). Shrestha (2013) added that data is generated throughout the various phases of construction projects from planning phase to completion. As shown in Table 1, the stream of data includes design and financial data, sensors and equipment data, photos and videos and others. This data is often large in volume, highly diverse in format and dynamic. The multi faceted data reflects the multitude characteristics of data streaming from construction activities thus sits in comformity with the 3V’s concept of big data.
Further, Table 1 shows that the advancement of construction processes through the widespread utilization of these data shall be the next frontier of construction industry innovation and productivity. This is supported by Harenberg (2017) who mentioned real-time data processing as the future booster of productivity in construction. 2.4 Triggering Constituents of Big Data in the Construction
Industry The digitalized revolution has impacted the construction industry rather significantly as the industry is dealing with heterogeneous amount of data (Bilal, Oyedele, Qadir, et al., 2016). These triggering contituents to big data are identified and discussed as the following:
Characteristics Contributors Examples
Volume Large volume of data from different sources
Design data, cost data, financial data, contractual data, Enterprise Resource Planning (ERP) system, etc
Variety Diversity in the content format
DWG (drawing), DXF (drawing exchange format), DGN (design), RVT (revit), ifcXML, ifcOWL, DOC/XLS/PPT (Microsoft format), RM/MPG (videos), JPEG (images)
Velocity Dynamic nature of data sources
Sensors, RFIDs, Building Management System (BMS)
Table 1 Big Data context in Construction Industry
Source : Aouad, Kagioglou, Cooper, Hinks, and Sexton (1999); Bilal, Oyedele, Qadir, et al. (2016)
2.4.1 Building Information Modelling (BIM) BIM is anticipated to capture the multi-dimensional CAD data to deliberately support the multidisciplinary and coordinated working environment among the stakeholders involved in a project (Eadie, Browne, Odeyinka, McKeown, & McNiff, 2013). As BIM involves with capturing the additional layers of information throughout the entire building lifecycle, BIM is perceived to transform the construction industry across various perspectives (Azhar, 2011). Though data volume has been the characteristic of BIM, yet Humphreys (2016) argued that this data are not precisely big data. This follows as the huge files of BIM with the combination of the numerous models is still promptly prepared only to be processed by BIM applications. Likewise, the arrival of built-in devices and sensors has increased the amount of data generated where it eventually leads to the wellsprings of Big BIM Data (Bilal, Oyedele, Qadir, et al., 2016). Thus, this triggers the construction industry to penetrate the big data era. 2.4.2 Cloud Computing Cloud computing is an internet computing trend which on request, give access to the merge of configurable resources (Bughin, Chui, & Manyika, 2010). The main purpose is to provide multiple users with access to data storage and computation without each having to resort for an individual license. The acceleration of cloud computing technology has contributed to the evolution of big data (Qubole, 2017). As cloud computing is supporting the coordination of errands in the BIM-based application, it has been broadly applied in the construction industry and big data performance in this revolution is astounding (Bilal, Oyedele, Qadir, et al., 2016). In addition, cloud computing and big data are said to be an ideal combo that contributes to the cost efficiency and extensible infrastructure in supporting Big Data and Business Analytics (Ferkoun, 2014). 2.4.3 Internet of Things (IoT) The Internet of Things (IoT) has been the main pillar that triggers the big data 3.0 era. Basically, IoT is a system of Internet-connected devices that gather and transfer data through installed sensors (Meola, 2016). IoT application frequently conveyed a substantial number of sensors devices for data accumulation. As the industry presents boundless big data utilization cases for IoT, big data is inalienably the subject of intrigue (Bilal, Oyedele, Qadir, et al., 2016). Among the prominent areas of IoT applications includes logistics, transport, asset recording, intelligent homes and buildings, energy and agriculture. Bilal, Oyedele, Qadir, et al. (2016) claimed that IoT and big data are interdependent trends where a huge amount of data is created, accessed and analysed in real-time in construction applications. Additionally, Pal (2015) suggested that during the selection of big data processing technology, huge flood of information produced by IoT triggers big data on a reciprocal basis following the selection of big data processing technology. 2.4.4 Smart Buildings Smart Building technology assimilates the contemporary technologies with existing building systems to attract the economical trade-off between comfort maximization and energy reduction (Khan & Hornbæk, 2011). Often, these systems will produce an enormous volume of data and the greater part of this information often stay undiscovered and eventually disposed of. According to Bilal, Oyedele,

148
Qadir, et al. (2016), this data needs to be interpreted to truly reflect smart buildings hence gives big data analytics a significant role to play. The information and communication technology (ICT)-based integration and development systems, particularly Internet of Things is an important catalyst for various applications, both industry and the general population in realizing the smart buildings (Perera, Zaslavsky, Christen, & Georgakopoulos, 2014). In this sense, Moreno et al. (2016) opined that big data and IoT are an impeccable combination in enhancing energy efficiency for Smart Buildings. 2.4.5 Augmented Reality (AR) Augmented Reality is a technology that coordinates virtual object images into real-world images. These images can be taken from the camera or, by using a live view, the audience can be added directly to the world (Reiners, Stricker, Klinker, & Müller, 1998). According to Jiao, Zhang, Li, Wang, and Yang (2013) AR comes from ‘Virtual Reality’ (VR) and provides a half-depth environment that highlights the exact alignment between actual scenes and virtual world images in real time. It is also broadly recognized as an assuring technology to improve human viewpoint. Additionally, the means to enhance prevailing big data visualization techniques is correlated with AR and VR where it is relevant for human limited perception capabilities (Olshannikova, Ometov, Koucheryavy, & Olsson, 2015). Consequently, AR and big data are certainly unavoidable where the complexity related with big data in construction is tremendous and must be overcome by advanced visualization methods, specifically AR and VR (Bilal, Oyedele, Qadir, et al., 2016). 2.4.6 Social Networking Services Social media is one of the exciting trends that could assist the construction industry to improve the communication among project teams (Jiao, Wang, et al., 2013). Yet, one of the main challenge is to accede the value and exploring ways of analysing it (H. Chen, Chiang, & Storey, 2012). This follows from the enormous volume of heterogeneous data produced by the social networks. Hence, to properly analyse data from social media, the analytical techniques of data analysis need to be modified and incorporated into the new enormous data for enormous information processing (Bello-Orgaz, Jung, & Camacho, 2016). In relation to this, big data can be utilized in developing appealing domain applications through the high volume, velocity, and variety of social network data to improve stakeholders’ productivity. 2.5 Current Big Data research in the Construction Industry Big data has begun to set foot in the construction industry in sync with other sectors that have long benefited from big data. In this regard, the construction industry could exploit big data in the same manner as anticipated by the other sectors or industries. As discussed earlier, this includes enhancing efficiency, decision making, and sensors monitoring. Bilal, Oyedele, Qadir, et al. (2016) maintained that the outlook on the applicability of big data in construction could be magnified as the triggering contituents discussed in section 2.4 advanced. Thus, the surge of these contituents and trends could be the factors to propel the construction industry to the next level of data driven initiatives. The current big data research or application excerpted from various literature is summarized in Table 2 with the important concepts identified from the review process are aggregated and accentuated in brackets. The findings will become the basis to map the orientation of
big data research in construction and subsequently suggesting the probable direction for research to ensue.
3. Research Methodology The qualitative research design was adopted for this study. According to Bryman (2008), qualitative research is a research strategy that typically emphasizes on words rather than the computation of data. In this regard, the aim is to provide a thick explanation about a phenomena following the specific issue identified from the the literature (Elo & Kyngas, 2008; Fellows & Liu, 2008). The decision for adopting to the strategy was also guided by the objectives of the study. As the research objectives include analysing the current extent of big data research and mapping out its orientation and potential application, these are better achieved by going deep through an analytical explanation of the existing research (Creswell, 2005). Desk study method was used to collect the data required for attaining the first and the second objectives. According to Travis (2016) desk study relied on the researcher’s skill to review the previous research findings in order to obtain an expansive comprehension of the study area. This method was adopted as it provides the fastest and inexpensive method in understanding the realm of the research, where a thorough review was made to obtain a cross sectional insights on big data in the construction industry. As the study is currently on going, a series of interviews are planned to consolidate and validate the insights that are to be gained from the desk study. The interviews are planned to be administered with personnel who have experienced big data and is aimed to identify the potential application of big data in construction. According to Rubin and Rubin (2011), the qualitative interview is a discussion where the researcher aides a conversational accomplice in a broadened exchange. The interviews will allow the researcher to expand the questions to the extent that they are willing to share. Accordingly, the desk study is important in this regard as it gives the researcher a gist of the previous research findings before the interviews are carried out. For this reason, this paper is organised to highlight the analytical method employed in the desk study and the findings derived therein. These are concurently presented and discussed in the ensuing sections.
4. Findings and Discussion The important concepts on big data excerpted from the review were structurally analysed by following the steps in the framework known as SALSA. The acronym stands for Search, Appraisal, Synthesis, and Analysis and was introduced by Booth, Sutton, and Papaioannou (2016). A complete application of the SALSA framework was illustrated in a study by Shamsulhadi, Fadhlin, and Hamimah (2015) and was further methodologically discussed by Shamsulhadi and Fadhlin (2016) and Zafira, Shamsulhadi, and Roslan (2018). In the studies mentioned, it was observed that the Nvivo software was predominantly deployed to assist in the analytical process. Part of the analytical outcomes as presented in Table 2 had followed the processes as outlined by the previous studies and include the usage of the Nvivo software as well. This approach was intentional to maintain the rigour as justified in the illustrated research. Details of the processes carried out for the study are further explained in the following sections. 4.1 Searching The exploratory nature of this study had naturally required the

149
researcher to search the relevant literature concerning big data in construction. For this purpose, the researcher had first established the search parameter and subsequently drawn the relevant keywords from the aim and objectives of the study. A snowballing technique was then exercised where literatures were identified through the backward and forward approaches (Webster & Watson, 2002). To achieve this, the UTM Library Online Database which contained access to academic journals from Emerald, Science Direct, IEEE Xplore Digital Library, and Springerlink was searched. The main keywords used
in searching the literature were “big data” and “construction industry”. Additionally, the Boolean operators, truncation characters and wildcards were also used in selecting the relatable journal articles. Based on the search results, a large numbers of big data articles were displayed from both construction as well as other domains. However, the results were again filtered where only the content that portrays the presence of big data in the construction industry was of particular interest.
No Big Data research area from the literature review Authors
1 BD with Visual Analytics used for (building performance) comparison that leads to renovation and construction with low (energy) consumption.
(Ioannidis et al., 2015)
2 LEED uses actual data to verify the (building performance) (Davis, 2015)
3 Improve (project management) by using technologies or sensors for (performance) monitoring and tracking (Wood, 2016), (Bleby, 2015), (Yang, Park, Vela, & Golparvar-Fard, 2015)
4 Cost efficiency (design) through a real-time, data-focused predictive model. (Sadhu, 2016)
5 BD assist in (project management) to ensure the project is delivered on (time) and (minimize delays) (Sadhu, 2016), (Rijmenam, 2015), (Faure, 2016), (Augur, 2016), (Akbar, 2017)
6 Real-time data sharing to improve (communication) between stakeholders (Rijmenam, 2015), (Augur, 2016)
7 Resource tracking through sensors-equipped assets or machineries. (resource management) (Rijmenam, 2015), (Augur, 2016), (Azzeddine Oudjehane & Moeini, 2017), Akhavian and Behzadan
8 Deriving information from stakeholders to improve the (planning) process and (project management) (Caron, 2015)
9 Integration of information technologies with data handling in facilitating (decision-making) for (project man-agement)
(Martínez-Rojas, Marín, & Vila, 2015)
10 BD generate (prediction) system for construction businesses bankruptcy (Hafiz et al., 2015)
11 Drones use for construction progress monitoring for (project management) (Azzeddine Oudjehane & Moeini, 2017), Knight (2015)
12 Geospatial/geo-location data for (resources optimization) and (resource management) (Akbar, 2017)
13 Data simulation tool in reducing project (risk). (Akbar, 2017)
14 BD for construction (cost management) through tender price assessment system (project management) (Y. Zhang, Luo, & He, 2015)
15 Visual BD to improve (communication) among project stakeholders. (K. K. Han & Golparvar-Fard, 2017)
16 Assess (Construction waste management) performance using BD (Lu, Chen, Ho, & Wang, 2016), (Lu, Chen, Peng, & Shen, 2015)
17 Developing (waste) simulation tool using BD for (Construction waste management) (Bilal, Oyedele, Akinade, et al., 2016)
18 Social network analysis and (energy) usage analyses as sources in establishing an integrated green building (design) model
Redmond, El-Diraby, and Papagelis (2015)
19 BD algorithms to accurately reduce the design space and enabled generative (design) tool (Bilal, Oyedele, Qadir, et al., 2016)
20 BD and VR for better building (design) decision (Bernstein, 2017), (Barista, 2014)
21 BD helps in generating a predictive model for (energy) consumption (Moreno et al., 2016)
22 BD algorithm for (building performance) in terms of (energy) consumption (P. A. Mathew et al., 2015)
23 Implementing prototype software called Project Dasher for (energy) data visualization and real-time monitoring. (Khan & Hornbæk, 2011)
24 BD analysis used to understand energy consumption behavior thus help to improve (energy efficiency) in build-ing
(Koseleva & Ropaite, 2017), (Janda et al., 2015)
25 Real-time (energy) consumption data monitoring and control to improve energy efficiency (Wei & Li, 2011)
26 BD-based platform to visualize workers’ unsafe (safety) act in real-time (SY Guo, Ding, Luo, & Jiang, 2016), (Shengyu Guo, Luo, & Yong, 2015)
27 Use wearable to track worker proximity to rolling (safety) exclusionary zones (Wood, 2016)
28 Use drones to check on site (safety) (Oudjehane & Moeini, 2017)
29 Real-time (safety) tracking and data visualization technologies improve (safety) understanding. (Teizer, Cheng, & Fang, 2013) (Hampton, 2015)
30 Application of BD-driven BIM system in improving construction (safety) (S. Zhang, Teizer, Lee, Eastman, & Venugopal, 2013)
31 Integrating BIM data with external data such as Linked Open Data (LOD) for better (project management) and reduce project (risk)
(Curry et al., 2013)
32 Sensor based fire-fighting system for skyscraper building in associate with the authorities help in fire detecting as well as evacuation process (safety)
(Stankovic, 2014)
33 Predicting site injury and workers’ behavior towards (safety) through 3D skeleton motion model from videos. (S. Han, Lee, & Peña-Mora, 2012)
34 Data from robotics and automated equipment has the potential to improve job (safety) and enhance construction (productivity).
(Skibniewski & Golparvar-Fard, 2016)
35 Capturing (safety), quality and performance data for real-time analysis in improving site (safety) and construction work (productivity).
(Bleby, 2015)
36 Big Data from mobile apps for contractor to track (resource) and document schedule changes to enhance (resource management).
(Sadhu, 2016)
37 (Energy) consumption prediction through computational models developed based on user behavior for better (energy management).
(C. Chen & Cook, 2012)
38 BD in (design) model comprises of architectural, structural, and building services data to enhance (design)
efficiency (Porwal & Hewage, 2013)
39 Past project data-driven (design) to improve (design) decision and efficiency. (Barista, 2014)
Table 2 Big Data research from various literature
Source: As shown

150
4.2 Mapping Ideas and Analysis Mapping involves putting together different strands that make up the topic to enable analysis and synthesis to be undertaken. The process involves accumulating the literature content from the review and sorting the list into categories for the purpose of establishing connections (Hart, 1998). According to Hart (1998), the aim of this process is to dynamically reduce the huge amount of information extracted from the review with due emphasized given to extract the main points of the argument. For this study, a featured map, in a form of a table proposed by Hart (1998) was developed and showed in Table 2. The table showed the results of the analysis which has taken place by reflecting the words (or terms) derived from the extracted data. These were reflected as the features which had characterised the literature and a structural form of recognition of the leading concepts. Despite, at this stage, it appears that the concepts derived were rather disjointed and had followed the individual reflection from the sources. This necessitates the next step in the process - synthesis. 4.3 Synthesis, Mapping and Discussion of the Outcomes Concepts that arised from the analysis were synthesized through the aggregative approach in which the concepts were grouped into relatable themes or area. This process was carried out by using the Nvivo software where apart from its ability in mapping out the outcome, proved to be useful in espousing the weightage which could exaggerated certain number of concepts. The frequently mentioned concepts were mapped out through the word frequency command. It counts the frequency of a particular word or phrase or a set of alternative words fed from the analysis. In relation to this study, the ‘Word Frequency Query’ in Nvivo was used to reveal a specified concepts of big data that have been mentioned the most. Hence, the predilections of big data in construction were obtained thus attaining the second objective. A model which was developed from the synthesis is presented in Figure 1. It shows that prior research on big data in construction had centered around ‘management’ especially ‘project’ management, ‘energy’ management and ‘resource’ management. In this context, big data in ‘project management’ involves those linked-construction data in cloud base that provides broad understanding on complex project. It was submitted that big data leads to a better ‘project management’, especially in ensuring that cost efficiency was achieved as well as minimizing delays. Likewise, big data initiated by the IoT devices such as drones, sensors or smartphones aid in recording construction work progress and monitoring work performance. It was postulated that a real-time data was able to be provided so that actionable actions could be
taken in enhancing the project productivity. Additionally, the IoT devices also generates data on the ‘safety’ aspect such as workers’ safety behaviour on site and site safety conditions through sensors, automated equipments, tracking devices as well as visualization technologies. Big data also contribute to a better project management through data wise enhancing ‘decision-making’ process especially in predicting the project orientation that leads to lower project risk. On the other hand, ‘energy management’ encompasses the integration of IoT or BIM with big data analytics in understanding the building energy consumption to increase energy efficiency and add to building performance. Energy analyses further assist in decision making ‘design’ framework where the results could be the determinant in generating integrated models for building design. Also, big data provide an aerial view on all aspects of the built environment that facilitates a better decision-making design framework. Correspondingly, resources tracking and monitoring through sensors or mobile apps helped to enhance the decision-making for ‘resources management’ and ensure resource optimization. Other big data potential application reviewed from the literature includes construction waste management as well as data-sharing efficiency to improve communication. Based on the discussion, the theoretical orientations obtain from the analytical processes could be summarised as: (1) project management; (2) safety; (3) energy management; (4) decision making design framework and (5) resource management. Table 3 recapitulates the interpretative context of the most frequent big data research area in relation to the findings previously presented in Table 2. The findings from this study had revealed five current directions of construction big data research. Despite being bounded with the number of articles that were obtainable from the search, the findings nevertheless had shed some lights on the areas currently being pursued by researchers in construction domain. This information could be harnessed by the current and future researcher in charting their path and further justifying the significance of their research.
5. Conclusion and Recommendation The study has managed to draw important insights on the specific areas in construction big data research. These were achieved through the accomplishment of the following objectives: (1) to analyse the current extent of construction big data research; (2) to map out the orientation
Figure 1: Generated model representing the frequency of big data research area

151
of the current construction big data research; and (3) to suggest the current directions of construction big data research. As the foregoing discussions have shown, a structured analytical framework has been employed to analyse the resources obtained, assisted by the used of NVivo. This has permitted a wider inclusion of resources, thus had broadened the base for the qualitative analysis to take place. As the study has shown, the current extent and orientation of the present construction big data research covers a diverse research area. It reflects from the analysis that big data research on monitoring, tracking and decision making are intensively being pursued by researcher in construction. Apparently, this suggests the rapid pace of big data development in construction and the on-going interest to harness the technology for common good. Besides, the study had also suggested that the current directions of construction big data research could be translated into five specific areas. This covers construction project management; safety; energy management; decision making design framework and resource management. Of the five areas mentioned, big data for construction project management was identified as the area which research is really intensified. This follows as the construction industry is a data-dependent industry hence data must be managed efficiently with the right tool to ensure the success of a project. As the study has shown, construction big data research offers a potentially good prospect to improve the industry. It is a step ahead of the current digitalisation effort and bring a new wave in obtaining insights from the voluminous amount of data. As the study reported in this paper is still on-going, it is interesting to contemplate the industry’s views on the findings discussed here. This shall include what and how would the industry profit from the adoption of big data. The authors recommend a study to be conducted on the challenges impeding the adoption of big data in construction as well as readiness in embracing to big data. This effort shall increase the depth and breadth of the current knowledge which could further bolster the industry’s understanding on big data.
Acknowledgements: The authors wish to thank the anonymous reviewers for their constructive comments and effort to review this paper. References Addo-Tenkorang, R., & Helo, P. T. (2016). Big data applications in operations/supply-chain management: A literature review. Computers & Industrial Engineering, 101, 528-543.
Akbar, S. (2017). Is Big Data The Most Trending Thing In Construction Now. Retrieved from https://geniebelt.com/blog/big-data-in-construction
Akhavian, R., & Behzadan, A. H. (2015). Construction Equipment Activity Recognition for Simulation Input Modeling using Mobile Sensors and Machine Learning Classifiers. Advanced Engineering Informatics, 29(4), 867-877. doi:10.1016/j.aei.2015.03.001
Aouad, G., Kagioglou, M., Cooper, R., Hinks, J., & Sexton, M. (1999). Technology management of IT in construction: a driver or an enabler? Logistics Information Management, 12(1/2), 130-137.
Augur, H. (2016). Big Data is Transforming Commercial Construction. Retrieved from http://dataconomy.com/2016/07/big-data-is-transforming-commercial-construction/
Azhar, S. (2011). Building information modeling (BIM): Trends, benefits, risks, and challenges for the AEC industry. Leadership and management in engineering, 11(3), 241-252.
Azzeddine Oudjehane, & Moeini, S. (2017). Big Data in Construction Projects Risk and Opportunity Management.
Barista, D. (2014). The Big Data revolution: How data-driven design is transforming project planning. Building Design+Construction.
Bello-Orgaz, G., Jung, J. J., & Camacho, D. (2016). Social big data: Recent achievements and new challenges. Information Fusion, 28, 45-59.
Bernstein, P. (2017). How Big Data and VR in Architecture Will Greatly Improve Design. Retrieved from https://www.autodesk.com/redshift/big-data-vr-in-architecture/
Bilal, M., Oyedele, L. O., Akinade, O. O., Ajayi, S. O., Alaka, H. A., Owolabi, H. A., . . . Bello, S. A. (2016). Big data architecture for construction waste analytics (CWA): A conceptual framework. Journal of Building Engineering, 6, 144-156.
Bilal, M., Oyedele, L. O., Qadir, J., Munir, K., Ajayi, S. O., Akinade, O. O., . . . Pasha, M. (2016). Big Data in the construction industry: A review of present status, opportunities, and future trends. Advanced Engineering Informatics, 30(3), 500-521. doi:10.1016/j.aei.2016.07.001
Bleby, M. (2015). Big Data boosts construction. Retrieved from http://www.afr.com/real-estate/commercial/big-data-boosts-constrcution-20150109-12l8xx
Booth, A., Sutton, A., & Papaioannou, D. (2016). Systematic approaches to a successful literature review: Sage.
Bryman, A. (2008). Mixed methods research: combining quantitative and qualitative research. Social research methods, 3, 608-626.
Bughin, J., Chui, M., & Manyika, J. (2010). Clouds, big data, and smart assets: Ten tech-enabled business trends to watch. McKinsey Quarterly, 56(1), 75-86.
Burger, R. (2017). How the Construction Industry is Using Big Data. Retrieved from https://www.thebalance.com/how-the-construction-industry-is-using-big-data-845322
Context of big data research
Important key-words
Detail of research area
Construction Pro-ject Management
monitoring Progress/performance monitoring through IoT devices
time, cost Better time and cost management
Decision-making Making decision using predictive data that leads to lower project risk and
Safety Site safety, work-ers’ safety behav-
iour
Big data generated through IoT devices in tracking and visualize site safety conditions as well as workers’ behav-iour towards safety
Energy management Consumption, building perfor-
mance
Enhancing energy efficiency and build-ing performance through an under-standing of building energy consump-tion
Decision-making design framework
Decision-making Big data for prompt and informed decision-making
Resource manage-ment
Resources tracking Resources tracking through IoT devices to improve resources utilization effi-ciency
Table 3 The context of big data research area and details
Source : Researcher

152
Caron, F. (2015). Data management in project planning and control. International Journal of Data Science, 1(1), 42-57.
Chen, C., & Cook, D. J. (2012). Behavior-Based Home Energy Prediction. IEEE Internet of Things Journal.
Chen, C. P., & Zhang, C.-Y. (2014). Data-intensive applications, challenges, techniques and technologies: A survey on Big Data. Information Sciences, 275, 314-347.
Chen, H., Chiang, R. H., & Storey, V. C. (2012). Business intelligence and analytics: From big data to big impact. MIS quarterly, 36(4).
Choudhry, H., Mohammad, A., Tan, K. T., & Ward, R. (2016). The next frontier for digital technologies in oil and gas. Retrieved from https://www.mckinsey.com/industries/oil-and-gas/our-insights/the-next-frontier-for-digital-technologies-in-oil-and-gas
Creswell, J. (2005). Planning, conducting, and evaluating quantitative and qualitative research: Educational research: Prentice Hall: Upper Saddle River, NJ Creswell, JW (2007). Research method: Qualitative, quantitative and mixed methods approaches (2nd ed.). Thousand Oaks, CA: Sage.
Cukier, K. (2010). Data, data everywhere: A special report on managing information: Economist Newspaper.
Curry, E., O’Donnell, J., Corry, E., Hasan, S., Keane, M., & O’Riain, S. (2013). Linking building data in the cloud: Integrating cross-domain building data using linked data. ADVANCED ENGINEERING INFORMATICS, 27(2), 206-219.
Davis, D. (2015). How Big Data is Transforming Architecture.
Eadie, R., Browne, M., Odeyinka, H., McKeown, C., & McNiff, S. (2013). BIM implementation throughout the UK construction project lifecycle: An analysis. Automation in Construction, 36, 145-151.
Elo, S., & Kyngas, H. (2008). The qualitative content analysis process. Journal of Advanced Nursing, 62(1), 107-115.
Faure, A. (2016). Big data is revolutionizing business: the construction industry in general and building sites in particular. Retrieved from https://blog.serenacapital.com/big-data-is-revolutionizing-business-the-construction-industry-in-general-and-building-sites-in-de7a53a20516
Fellows, R., & Liu, A. (2008). Research Methods for Construction (3rd. ed.). Oxford: Wiley-Blackwell.
Ferkoun, M. (2014). Cloud Computing and Big Data: An ideal combination. Retrieved from https://www.ibm.com/blogs/cloud-computing/2014/02/cloud-computing-and-big-data-an-ideal-combination/
Gaitho, M. (2017). How Applications of Big Data Drive Industries. Retrieved from https://www.simplilearn.com/big-data-applications-in-industries-article
Gartner. (2014). Glossary.(2013). Big Data.
Gartner. (2015). 6.4 billion connected “Things” will be in use in 2016, up 30 percent from 2015. Gart. Inc.
Guo, S., Ding, L., Luo, H., & Jiang, X. (2016). A Big-Data-based platform of workers’ behavior: Observations from the field. Accident Analysis & Prevention, 93, 299-309.
Guo, S., Luo, H., & Yong, L. (2015). A big data-based workers behavior observation in China metro construction. Procedia Engineering, 123, 190-197.
Hafiz, A., Lukumon, O., Muhammad, B., Olugbenga, A., Hakeem, O., & Saheed, A. (2015). Bankruptcy prediction of construction businesses: towards a big data analytics approach. Paper presented at the Big Data Computing Service and Applications (BigDataService), 2015 IEEE First International Conference on.
Hammer, C., Kostroch, D. C., & Quiros, G. (2017). Big Data; Potential, Challenges and Statistical Implications. Retrieved from
Hampton, T. V. (2015). Big Data Boosts Safety in Brazil. Retrieved from https://www.enr.com/articles/9640-big-data-boosts-safety-in-brazil?v=preview
Han, K. K., & Golparvar-Fard, M. (2017). Potential of big visual data and building information modeling for construction performance analytics: An exploratory study. Automation in Construction, 73, 184-198.
Han, S., Lee, S., & Peña-Mora, F. (2012). A machine-learning classification approach to automatic detection of workers' actions for behavior-based safety analysis Computing in Civil Engineering (2012) (pp. 65-72).
Harenberg, M. (2017). 5 ways to boost construction productivity. Retrieved from https://www.planradar.com/construction-productivity/
Hart, C. (1998). Doing a literature review: Releasing the social science research imagination: Sage.
Humphreys, R. (2016). How Big Data Complements Information Management. Retrieved from https://sourceable.net/how-big-data-complements-information-management/
Ioannidis, D., Fotiadou, A., Krinidis, S., Stavropoulos, G., Tzovaras, D., & Likothanassis, S. (2015). Big Data and Visual Analytics for Building Performance Comparison. Paper presented at the IFIP International Conference on Artificial Intelligence Applications and Innovations.
Janda, K. B., Patrick, J., Granell, R., Bright, S., Wallom, D., & Layberry, R. (2015). A WICKED approach to retail sector energy management. Paper presented at the Proceedings of ECEEE Summer Study.
Jiao, Y., Wang, Y., Zhang, S., Li, Y., Yang, B., & Yuan, L. (2013). A cloud approach to unified lifecycle data management in architecture, engineering, construction and facilities management: Integrating BIMs and SNS. Advanced Engineering Informatics, 27(2), 173-188.
Jiao, Y., Zhang, S., Li, Y., Wang, Y., & Yang, B. (2013). Towards cloud augmented reality for construction application by BIM and SNS integration. Automation in Construction, 33, 37-47.
Khan, A., & Hornbæk, K. (2011). Big data from the built environment. Paper presented at the Proceedings of the 2nd international workshop on Research in the large.
Knight, W. (2015). New boss on construction sites is a drone: MIT Technology review.
Koseleva, N., & Ropaite, G. (2017). Big Data in Building Energy Efficiency: Understanding of Big Data and Main Challenges. Procedia Engineering, 172, 544-549.
Laney, D. (2001). 3D data management: Controlling data volume, velocity and variety. META Group Research Note, 6, 70.
Lee, I. (2017). Big data: Dimensions, evolution, impacts, and challenges. Business Horizons, 60(3), 293-303.
Lu, W., Chen, X., Ho, D. C., & Wang, H. (2016). Analysis of the construction waste management performance in Hong Kong: the public and private sectors compared using big data. Journal of Cleaner Production, 112, 521-531.
Lu, W., Chen, X., Peng, Y., & Shen, L. (2015). Benchmarking construction waste management performance using big data. Resources, Conservation and Recycling, 105, 49-58.

153
Martínez-Rojas, M., Marín, N., & Vila, M. A. (2015). The role of information technologies to address data handling in construction project management. Journal of Computing in Civil Engineering, 30(4), 04015064.
Mathew, B. (2016). How Big Data is reducing costs and improving performance in the upstream industry. Retrieved from http://www.worldoil.com/news/2016/12/13/how-big-data-is-reducing-costs-and-improving-performance-in-the-upstream-industry
Mathew, P. A., Dunn, L. N., Sohn, M. D., Mercado, A., Custudio, C., & Walter, T. (2015). Big-data for building energy performance: Lessons from assembling a very large national database of building energy use. Applied Energy, 140, 85-93.
Meneer, D. (2015). How Big Data is Transforming Construction Businesses. Retrieved from https://www.constructionmonitor.com/blog/2015/06/26/how-big-data-is-transforming-construction-businesses/
Meola, A. (2016). What is the Internet of Things (IoT)? Retrieved from http://www.businessinsider.com/what-is-the-internet-of-things-definition-2016-8/?IR=T
Moreno, M. V., Dufour, L., Skarmeta, A. F., Jara, A. J., Genoud, D., Ladevie, B., & Bezian, J.-J. (2016). Big data: the key to energy efficiency in smart buildings. Soft Computing, 20(5), 1749-1762.
O'Reilly. (2014). Big data now: 2014 Edition: O'Reilly Media, Incorporated.
Olshannikova, E., Ometov, A., Koucheryavy, Y., & Olsson, T. (2015). Visualizing Big Data with augmented and virtual reality: challenges and research agenda. Journal of Big Data, 2(1), 22.
Oracle. (2015). Improving Manufacturing Performance with Big Data: Architect’s Guide and Reference Architecture Introduction. Retrieved from http://www.oracle.com/us/technologies/big-data/big-data-manufacturing-2511058.pdf
Oudjehane, A., & Moeini, S. (2017). Big data in construction projects: Risk and opportunity management.
Özköse, H., Arı, E. S., & Gencer, C. (2015). Yesterday, today and tomorrow of big data. Procedia-Social and Behavioral Sciences, 195, 1042-1050.
Pal, K. (2015). The Impact of the Internet of Things on Big Data. Retrieved from http://data-informed.com/the-impact-of-internet-of-things-on-big-data/
Peiffer, E. (2016). 3 concepts that will shape the future of construction. Retrieved from https://www.constructiondive.com/news/3-concepts-that-will-shape-the-future-of-construction/417049/
Perera, C., Zaslavsky, A., Christen, P., & Georgakopoulos, D. (2014). Sensing as a service model for smart cities supported by internet of things. Transactions on Emerging Telecommunications Technologies, 25(1), 81-93.
Portela, F., Lima, L., & Santos, M. F. (2016). Why Big Data? Towards a Project Assessment Framework. Procedia Computer Science, 98, 604-609.
Porwal, A., & Hewage, K. N. (2013). Building Information Modeling (BIM) partnering framework for public construction projects. Automation in Construction, 31, 204-214.
Provost, F., & Fawcett, T. (2013). Data science and its relationship to big data and data-driven decision making. Big Data, 1(1), 51-59.
Qubole. (2017). Big Data Cloud Database & Computing. Retrieved from https://www.qubole.com/resources/big-data-cloud-database-and-computing/
Redmond, A., El-Diraby, T., & Papagelis, M. (2015). Employing an Exploratory Research Stage to Evaluate Green Building Technologies for Sustainable Systems. Submitted to international journal; under review.
Reiners, D., Stricker, D., Klinker, G., & Müller, S. (1998). Augmented reality for construction tasks: Doorlock assembly. Proc. IEEE and ACM IWAR, 98(1), 31-46.
Rijmenam, M. v. (2015). Big Data Can Help Construction Companies Deliver Projects On Time. Retrieved from https://datafloq.com/read/big-data-construction-companies-deliver-projects-t/143
Rubin, H. J., & Rubin, I. S. (2011). Qualitative interviewing: The art of hearing data: Sage.
Sadhu, R. (2016). Big Data For Construction: How It Can Help You Deliver Your Project On Time. Retrieved from https://www.planacademy.com/big-data-construction/
Santiago Castagnino, Christoph Rothballer, & Gerbert, P. (2016). What's the future of the construction industry? Retrieved from https://www.weforum.org/agenda/2016/04/building-in-the-fourth-industrial-revolution/
Shamsulhadi, B., & Fadhlin, A. (2016). Documenting its application in Quantity Surveying research: A Review. International Journal of Built Environment and Sustainability, 3(1), 10-17. doi:10.11113/ijbes.v3.n1.105
Shamsulhadi, B., Fadhlin, A., & Hamimah, A. (2015). Research into the Bills of Quantities: Where can it be focused. The Malaysian Surveyor Journal, 50(3), 15-24.
Shrestha, J. (2013). Big Data, Predictive Analytics, and Data Visualization in The Construction Engineering. CCEE Graduate Student Research Showcase and Poster Competition.
Skibniewski, M., & Golparvar-Fard, M. (2016). Toward a Science of Autonomy for Physical Systems: Construction. arXiv preprint arXiv:1604.03563.
Stankovic, J. A. (2014). Research directions for the internet of things. IEEE Internet of Things Journal, 1(1), 3-9.
Teizer, J., Cheng, T., & Fang, Y. (2013). Location tracking and data visualization technology to advance construction ironworkers' education and training in safety and productivity. Automation in Construction, 35, 53-68.
Travis, D. (2016). Desk research: the what, why and how. Dostupno na http://www. userfocus. co. uk/articles/desk-research-the-what-why-and-how. html, pristupljeno, 10, 2017.
Viktor, M.-S., & Kenneth, C. (2013). Big data: A revolution that will transform how we live, work, and think. Houghton Mifflin Harcourt.
Waal-Montgomery, M. d. (2015). World's data volume to grow 40% per year & 50 times by 2020: Aureus. Retrieved Syyskuu, 28, 2016.
Webster, J., & Watson, R. T. (2002). Analysing the past to prepare for the future: writing a literature review. MIS Quarterly, 26(2), 1-11.
Wei, C., & Li, Y. (2011). Design of energy consumption monitoring and energy-saving management system of intelligent building based on the Internet of things. Paper presented at the Electronics, Communications and Control (ICECC), 2011 International Conference on.
Wood, C. (2016). Betting on big data: How construction firms are leveraging digitized job sites. Retrieved from https://www.constructiondive.com/news/betting-on-big-data-how-construction-firms-are-leveraging-digitized-job-si/431047/
Yang, J., Park, M.-W., Vela, P. A., & Golparvar-Fard, M. (2015). Construction performance monitoring via still images, time-lapse photos, and video streams: Now, tomorrow, and the future. ADVANCED ENGINEERING INFORMATICS, 29(2), 211-224.

154
Zafira, N. M., Shamsulhadi, B., & Roslan, A. (2018). Potential opportunities and future directions of big data in the construction industry. Paper presented at the The 12th SEATUC Symposium 2018, Universitas Gadjah Mada, Yogyakarta.
Zhang, S., Teizer, J., Lee, J.-K., Eastman, C. M., & Venugopal, M. (2013). Building information modeling (BIM) and safety: Automatic safety checking of construction models and schedules. Automation in Construction, 29, 183-195.
Zhang, Y., Luo, H., & He, Y. (2015). A system for tender price evaluation of construction project based on big data. Procedia Engineering, 123, 606-614.
Zikopoulos, P., Parasuraman, K., Deutsch, T., Giles, J., & Corrigan, D. (2012). Harness the power of big data The IBM big data platform: McGraw Hill Professional.