an application of stochastic model checking in the ...fmt.isti.cnr.it/~mtbeek/fmics_ch9.pdf · 182...
TRANSCRIPT

CHAPTER 9
AN APPLICATION OF STOCHASTIC MODEL CHECKING IN THE INDUSTRY: USER-CENTERED MODELING AND ANALYSIS OF COLLABORATION IN thinkteam ®
MAURICE H. TER BEEKISTI-CNR, Pisa, Italy
9.1 INTRODUCTION
In this chapter, we describe a general methodology for modeling and analyzing industrial software systems in their design phase, that is, prior to their imple-mentation, by means of (stochastic) model checking [1–3].
One of the difficulties in the domain of formal modeling and verification is that detailed models tend to generate very large state spaces, due to, for example, many interleaving activities. Our approach is therefore of a different
179
Formal Methods for Industrial Critical Systems: A Survey of Applications, First Edition. Edited by Stefania Gnesi and Tiziana Margaria. © 2013 IEEE. Published 2013 by John Wiley & Sons, Inc.
STEFANIA GNESI
DIEGO LATELLA
MIEKE MASSINK
MAURIZIO SEBASTIANIS
GIANLUCA TRENTANNI
ISTI-CNR, Pisa, Italy
ISTI-CNR, Pisa, Italy
ISTI-CNR, Pisa, Italy
Focus PLM srl, Ferrara, Italy
ISTI-CNR, Pisa, Italy
180 AN APPLICATION OF STOCHASTIC MODEL CHECKING IN THE INDUSTRY
nature. We develop and study rather limited, abstract formal models that are intended to address specific issues, and use these models to verify properties that provide insight in the dependencies of various aspects of the models and their effect on system performance from an easy to understand user perspec-tive. This way of using model checking is in support of a prototyping-like modeling technique. The focus is on obtaining in a relatively fast way an informed, but perhaps somewhat approximate, understanding of the consequences— both qualitative and quantitative—of adding specific features to an existing system (design). This is quite different from the traditional use of model check-ing as a technique to develop rather complete specifications, with the aim of reaching a maximal level of confidence in the correctness of complicated distributed algorithms. In this sense, our proposed use of model checking is somewhat resembling the idea of extreme programming [4]: generating simple ad hoc models of new features that are meant to be added to a system (design). In close cooperation with our industrial partner think3, we have used our methodology to model and analyze proposed extensions of their product data management (PDM) system thinkteam. Our approach thus implicitly forms a hands-on practical experience to illustrate the potential of (stochastic) model checking for the analysis of user aspects of software systems in the industry and also of its current limitations. The challenge is to introduce this technique in the industry, where model checking is currently not part of software engi-neering practice.
Product life cycle management (PLM) is the activity of managing a com-pany’s product across its life cycle—from conception, through design and manufacturing, to service and disposal—in the most effective way [5]. think3’s PLM is a suite of integrated PLM applications built on thinkteam, which is think3’s PDM application catering the document management needs of design processes in the manufacturing industry. thinkteam allows enterprises to capture, organize, automate, and share engineering information in an efficient way. The thinkteam setting, on which our research was performed, consisted of a number of users that all interact with one centralized relational database management system (RDBMS). This RDBMS controls the storage and retrieval of data (like CAD files) in a file-system-like repository, called the vault, with a file’s editing rights being exclusive. The adopted file access mecha-nism by designers is based on a retry policy: There is no queue (or reservation system) handling the user’s requests for editing rights on a file.
In previous works [6, 7], our focus was on qualitative model checking to verify the properties of thinkteam extended with a notification system for users based on a publish/subscribe paradigm. We analyzed a number of qualitative correctness properties addressing concurrency control, correctness, usability, and user awareness. This research has led to the inclusion of a notification mechanism in thinkteam. Some usability issues, influenced more by a system’s performance than by its functional behavior, however, cannot be analyzed by qualitative model checking alone. One such issue was raised in References 6 and 7: We showed that a user can be excluded from obtaining a file simply

INTRODUCTION 181
because competing users are more “lucky” in their attempts to obtain the same file. Such behavior is explained by the fact that users are only provided with a retry-based file access mechanism. User satisfaction depends both on qualita-tive and quantitative aspects. For instance, frequent retrying could be very frustrating and should therefore be avoided.
Analyses with qualitative model checking can show a problem exists, but not quantify its effect on usability. In our case, the number of retries (i.e., of repeated requests) a user has to perform before obtaining a file is an important usability measure. If the number is high, a waiting list policy should be con-sidered rather than the simpler retry policy. We analyzed the trade-off between these design options in Reference 8 by means of stochastic model checking, an extension of qualitative model checking allowing the analysis of qualitative and performance- and dependability-related—that is, quantitative—system properties [3, 9–12].
One of the problems of model-based approaches is that of scalability: how to deal with the state explosion that arises through attempts to model the interleaving activity that comes with many asynchronously operating clients. In Reference 13, we explored a recently proposed scalable model-based tech-nique, fluid flow analysis [14]. This technique supports the analysis of many replicated entities with autonomous behavior that collaborate by means of forms of synchronization. It builds upon a process algebraic approach and adds techniques for quantitative analysis to those for behavioral analysis. Formally, the technique consists of deriving automatically a set of ordinary differential equations (ODEs) from a specification defined using the Performance Evalu-ation Process Algebra (PEPA) [15]. The solution of the set of ODEs, by means of standard numerical techniques, provides insight into the dynamic change over time of aggregations of components that are in particular states. The approach abstracts away from the identity of the individual components. The derivation of sets of ODEs from PEPA specifications, the algorithms to solve ODEs, and the generation of the numerical results are supported by the PEPA workbench [16].
In Reference 17, finally, we used qualitative and quantitative model check-ing to evaluate thinkteam, and three proposed extensions, to assist the design phase of this industrial collaborative system. In this chapter, we illustrate the general methodology underlying all of the aforementioned experiences. To illustrate this methodology, we also revisit one of the analyses reported in Reference 17, namely the one using stochastic model checking to verify an extension with multiple replicated vaults. This verification is meant to quantify the time (which is not logged) that designers waste on down/uploading and on retrying in the presence of multiple replicated vaults. To do so, we will use the same structure of the stochastic model as in Reference 17, but vary the parameters. More in particular, we use the realistic parameter values that we obtained from analyzing the thinkteam log file of the actual usage of thinkteam by one of think3’s clients. The analysis was performed using the statistical software package SPSS [18]. As the values are obtained from real data, this
182 AN APPLICATION OF STOCHASTIC MODEL CHECKING IN THE INDUSTRY
chapter thus presents an improvement of the part of Reference 17 in which rather generic assumptions on editing and down/uploading times were made. Our contribution thus shows that model checking can be of great help in an exploratory design phase, both for comparing different design options and for refining and improving the description of the proposed extensions.
This chapter starts with detailed descriptions of thinkteam in Section 9.2 and of the log-file analysis in Section 9.3. In Section 9.4, we describe the pro-posed thinkteam extension and its stochastic model, after which relevant cor-rectness and performance properties are formalized and verified, and the outcome is interpreted. Section 9.5 contains the lessons we learned from this industrial case study. Finally, we draw some conclusions in Section 9.6.
9.2 thinkteam
This section contains an overview of think3’s PDM application thinkteam. For details, see http://www.think3.com.
Design activities produce and consume information—both documental (CAD drawings, models, and manuals) and nondocumental (bill of materials, reports, and workflow trails). The composition of this information eventually activates the process that produces a physical object. Information misman-agement can—and often does—have direct impact on the cost structure of the manufacturing phase. An important part of the design office’s work is to main-tain and update projects that have been previously released: A historical view of past information is an absolute must for this. This is where PDM applica-tions come into play.
9.2.1 Technical Characteristics
thinkteam is a three-tier data management system running on Wintel plat-forms. A typical installation scenario is a network of desktop clients interacting with one centralized RDBMS server and one or more file servers. In this setting, components resident on each client node supply a graphical interface, metadata management, and integration services. Persistence services are achieved by building on the characteristics of the RDBMS and file servers. In the following, we provide a brief overview of the operations of the (logical) thinkteam subsystems relevant to the purpose of this chapter.
9.2.1.1 Metadata Management thinkteam allows its users to manage rep-resentations of concrete entities (e.g., documents and components). These representations (often called business items or business objects) are described using an object model or meta-object model that can be customized by the end users, for example, by changing the attributes pertaining to various types of objects or by adding object types. Metadata management refers to opera-tions on object instances and to the rules these operations obey to, as they are
thinkteam 183
implemented in thinkteam. Typical operations are creation, attribute editing (e.g., adding/changing description, price), revising, changing state, connecting with other objects, and deletion. thinkteam uses an RDBMS to persist and retrieve both its object model and the objects that are created during opera-tion. RDBMS interactions are fairly low level in nature and are completely transparent to end users.
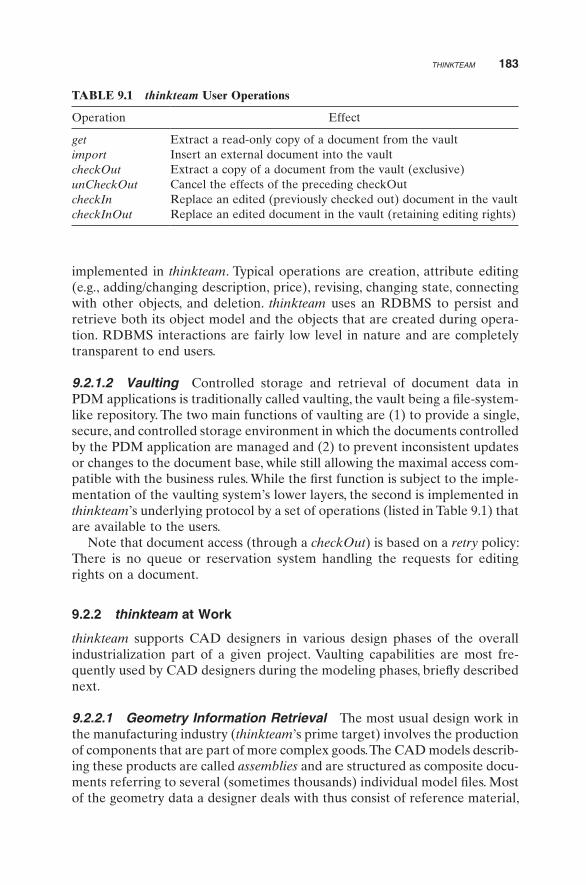
9.2.1.2 Vaulting Controlled storage and retrieval of document data in PDM applications is traditionally called vaulting, the vault being a file-system-like repository. The two main functions of vaulting are (1) to provide a single, secure, and controlled storage environment in which the documents controlled by the PDM application are managed and (2) to prevent inconsistent updates or changes to the document base, while still allowing the maximal access com-patible with the business rules. While the first function is subject to the imple-mentation of the vaulting system’s lower layers, the second is implemented in thinkteam’s underlying protocol by a set of operations (listed in Table 9.1) that are available to the users.
Note that document access (through a checkOut) is based on a retry policy: There is no queue or reservation system handling the requests for editing rights on a document.
9.2.2 thinkteam at Work
thinkteam supports CAD designers in various design phases of the overall industrialization part of a given project. Vaulting capabilities are most fre-quently used by CAD designers during the modeling phases, briefly described next.
9.2.2.1 Geometry Information Retrieval The most usual design work in the manufacturing industry (thinkteam’s prime target) involves the production of components that are part of more complex goods. The CAD models describ-ing these products are called assemblies and are structured as composite docu-ments referring to several (sometimes thousands) individual model files. Most of the geometry data a designer deals with thus consist of reference material,
TABLE 9.1 thinkteam User Operations
Operation Effect
get Extract a read-only copy of a document from the vaultimport Insert an external document into the vaultcheckOut Extract a copy of a document from the vault (exclusive)unCheckOut Cancel the effects of the preceding checkOutcheckIn Replace an edited (previously checked out) document in the vaultcheckInOut Replace an edited document in the vault (retaining editing rights)

184 AN APPLICATION OF STOCHASTIC MODEL CHECKING IN THE INDUSTRY
that is, parts surrounding the component he or she is actually creating or modifying. The designer needs to interact with this material in order to posi-tion, adapt, and mate to the assembly the part he or she is working on. Most reference parts are production items subjected to PDM, whose counterparts (model files) reside in the vault. The logical operation by which the designer gains access to them is the get operation, which is performed automatically when viewing a file. This is the most frequently used type of activity, and it is involved in all other activities listed below, as well as in many others not explicitly mentioned (e.g., visualization, printing).
9.2.2.2 Geometry Modification Modifying an existing part is the second most used operation a designer performs. As it is an already existing and managed part (i.e., present in the vault), the designer must express the intent to modify it with an explicit checkOut operation that prevents modification attempts by other users (exclusive lock). When ready to publish his or her work, the designer releases it to the system via the explicit checkIn operation, which makes the model available again for modification by other users. Were the designer to change his or her mind while modifying a model, then he or she may use the unCheckOut operation, which unlocks the model but discards any changes that occurred since the checkOut. Finally, he or she may use the checkInOut operation to release to the vault an intermediate version of the model, retaining exclusive modification rights.
9.2.2.3 Geometry Creation Lastly, a designer may create a completely new component model and insert it into the system. As the model will initially be created outside the system vault, an import operation is required to register it in thinkteam.
9.3 ANALYSIS OF THE thinkteam LOG FILE
thinkteam handles a few hundred thousand files for some 20–100 users. To obtain realistic data on the particular use that clients make of thinkteam, think3 provided us with a cleaned-up log file to analyze, comprising all activity (in terms of the operations listed in Section 9.2.1.2) of one of the manufactur-ing industries using thinkteam from 2002 to 2006. In order to fine-tune certain parameters of the model of thinkteam that we will present in the next section, we are interested in the following usage-centered info: the average duration of editing sessions, the average duration of periods during which files are not used for editing sessions, and the average number of times users unsuccessfully retry to obtain files for editing sessions. The aim of the analysis we describe in this section is thus to obtain some insight on the timing issues concerning the duration of editing sessions and the occupancy of files.
Even though this log file was cleaned up (i.e., logged information that was not related to the aforementioned operations was removed), for our specific

ANALYSIS OF THE thinkteam LOG FILE 185
purposes, it has been necessary to perform some further “cleaning.” Due to the huge amount of data, the particular format used, and the specific kind of usage-centered quantitative information we were interested in, it turned out that developing specialized scripts was the most efficient way to perform this “cleaning” (most multirelational data mining methods require loading the entire data in the main memory, which makes them unsuitable for mining a log file with a huge amount of data). Developing these scripts also helped to spot a number of irregularities in the log and automatically correct them. These mainly consisted of incorrect orderings of some of the operations that were caused by the log’s granularity with an accuracy in seconds. A higher precision (e.g., up to the nearest millisecond) would have been needed to avoid having to correct these orderings. We used the same scripting technique to simplify the log file (e.g., filtering useless user actions and so on) and to trans-form it into a format accepted by the statistical analysis software package SPSS [18].
The resulting log file contains, for each operation, its time stamp (in the format day-month-year and hour-minute-second), the name of the user who performed it, and the file in the vault the operation refers to. In this way, each line in the log file represents an atomic access to the vault. The format of the log file is easy to handle, but it contains a really huge amount of data (792,618 vault accesses by 104 users with respect to 183,492 files). Moreover, think3 has improved its logging mechanism during the years, meaning that different years are difficult to compare and also that 2006 is the most complete. For these reasons, we restricted our analysis to the year 2006.
The data of 2006 concerns 83 users collaborating on a total of 181,535 files, 23,134 of which were checked out at least once during the year. The remaining files were used exclusively as reference material, for example, downloaded in read-only fashion by means of get operations. A total of 65 users were found to be involved in editing sessions. We present the analysis of a subset of the data that has direct relevance for the model analyzed in the next section. These concern the duration of editing sessions (i.e., the time that passes between a checkOut and a checkIn of a file by the same user) and the duration of periods in which files were not locked (i.e., the time that passes between a checkIn and checkOut of the same file by possibly different users). Instead, the number of times a user unsuccessfully tries to checkOut a locked file (i.e., checked out by another user) is not explicitly logged, so little can be said about that in a direct way. It is however possible to obtain an indirect approximation of the number of users that compete for access to the same file by analyzing the number of users that modify the same file during the investigated period. To give an idea, Figure 9.1 shows 1 week of editing activity on a particular file. We see that four users are responsible for 20 editing sessions that week to the same file.
Figures 9.2 and 9.3 present data obtained after removing irrelevant opera-tions from the log file, like numerous get operations (recall that this is the most frequently used operation), operations originating from system administrator interventions, and several anomalous log operations. The graphs were drawn

186 AN APPLICATION OF STOCHASTIC MODEL CHECKING IN THE INDUSTRY
FIGURE 9.2 Duration of edit sessions.
00
2.000
4.000
Freq
uenc
y
6.000
5,000 10,000 15,000
Mean =2657.13Std. Dev. =3802.913
N =37,524
Trimmed Mean 40%
20,000 25,000
FIGURE 9.1 A week of checkOut sessions on a file.
08/09/20060
1
2
3
4
5
6
7
Ses
sion
s pe
r da
y fo
r F
ile F
09/09/2006 10/09/2006 11/09/2006 12/09/2006 13/09/2006 14/09/2006
User 1
User 2
User 3
User 4
by SPSS v15.0 [18] after computing the mean trimmed 40% (i.e., discarding the lower and higher 20% scores and taking the mean of the remaining scores). In statistics, the trimmed mean is known to be a more robust estimator than the mean in the presence of outliers in the data (i.e., extreme scores), because it is less sensitive to outliers but will still give a reasonable estimate of central tendency or mean. Figure 9.2 shows a histogram of the distribution of the
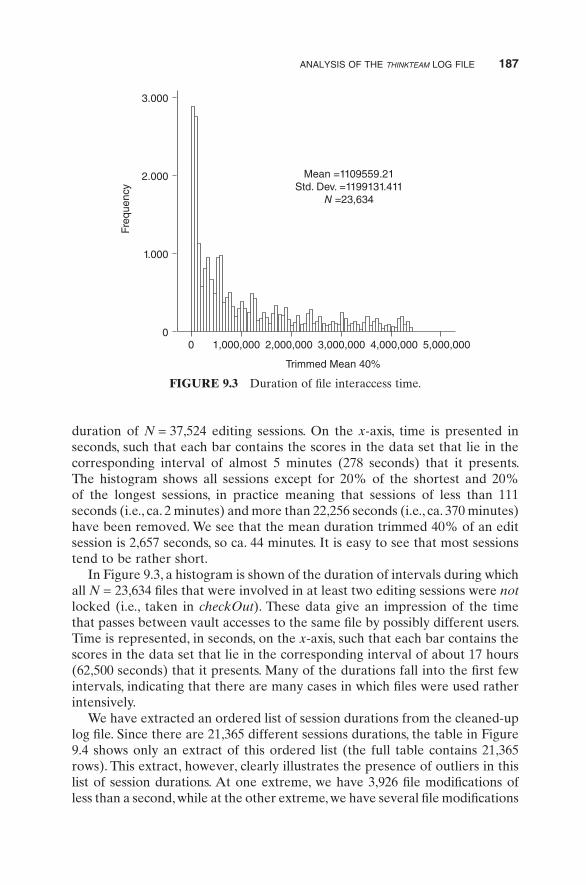
duration of N = 37,524 editing sessions. On the x-axis, time is presented in seconds, such that each bar contains the scores in the data set that lie in the corresponding interval of almost 5 minutes (278 seconds) that it presents. The histogram shows all sessions except for 20% of the shortest and 20% of the longest sessions, in practice meaning that sessions of less than 111 seconds (i.e., ca. 2 minutes) and more than 22,256 seconds (i.e., ca. 370 minutes) have been removed. We see that the mean duration trimmed 40% of an edit session is 2,657 seconds, so ca. 44 minutes. It is easy to see that most sessions tend to be rather short.
In Figure 9.3, a histogram is shown of the duration of intervals during which all N = 23,634 files that were involved in at least two editing sessions were not locked (i.e., taken in checkOut). These data give an impression of the time that passes between vault accesses to the same file by possibly different users. Time is represented, in seconds, on the x-axis, such that each bar contains the scores in the data set that lie in the corresponding interval of about 17 hours (62,500 seconds) that it presents. Many of the durations fall into the first few intervals, indicating that there are many cases in which files were used rather intensively.
We have extracted an ordered list of session durations from the cleaned-up log file. Since there are 21,365 different sessions durations, the table in Figure 9.4 shows only an extract of this ordered list (the full table contains 21,365 rows). This extract, however, clearly illustrates the presence of outliers in this list of session durations. At one extreme, we have 3,926 file modifications of less than a second, while at the other extreme, we have several file modifications
FIGURE 9.3 Duration of file interaccess time.
00
1.000
2.000
Freq
uenc
y
3.000
1,000,000 2,000,000 3,000,000 4,000,000 5,000,000
Mean =1109559.21Std. Dev. =1199131.411
N =23,634
Trimmed Mean 40%
ANALYSIS OF THE thinkteam LOG FILE 187

FIG
UR
E 9
.4
Ord
ered
list
of
sess
ion
dura
tion
s.
1#S
essi
on
Du
rati
on
(Sec
on
ds)
Ses
sio
n D
ura
tio
n(d
d/h
h/m
m/s
s)Fr
equ
ency
Per
cen
tag
eC
um
ula
tive
Per
cen
tag
e
2 3 4 5 . . .10
6410
6510
6610
6710
6810
6910
7010
7110
72 . . .. . .
. . .. . .
. . .. . .
2136
121
362
2136
321
364
2136
5
10 2 3 4 . . .10
6310
6410
6510
6610
6710
6810
6910
7010
71
2373
3879
2478
7896
2515
0004
2548
4279
2590
0836
1553
3926
00d
00h
00′ 0
0′′
00d
00h
00′ 0
1′′
00d
00h
00′ 0
2′′
00d
00h
00′ 0
3′′
00d
00h
00′ 0
4′′
. . .00
d 00
h 17
′ 43′
′00
d 00
h 17
′ 44′
′00
d 00
h 17
′ 45′
′00
d 00
h 17
′ 46′
′00
d 00
h 17
′ 47′
′00
d 00
h 17
′ 48′
′00
d 00
h 17
′ 49′
′00
d 00
h 17
′ 50′
′00
d 00
h 17
′ 51′
′
274d
16h
44′
39′
′28
6d 2
1h 3
1′ 3
6′′
291d
02h
06′
44′
′29
4d 2
2h 5
7′ 5
9′′
299d
18h
40′
36′
′
248
98 64 . . . 8 4 9 4 9 12 4 8 12 1 1 1 1 1
2.48
22%
6.27
51%
0.39
63%
0.15
66%
0.10
22%
. . .0.
0127
%0.
0063
%0.
0143
%0.
0063
%0.
0143
%0.
0191
%0.
0063
%0.
0127
%0.
0191
%
0.00
15%
0.00
15%
0.00
15%
0.00
15%
0.00
15%
8.75
74%
6.27
51%
9.15
38%
9.31
04%
9.41
27%
. . .49
.960
%49
.966
%49
.980
%49
.987
%50
.001
%50
.020
%50
.027
%50
.039
%50
.059
%
99.9
93%
99.9
95%
99.9
96%
99.9
98%
100.
00%
188
thinkteam WITH REPLICATED VAULTS 189
that lasted for almost 300 days. The extremely short sessions in fact do not correspond to real user editing sessions, but rather to automatic system opera-tions that were also logged and that feature in the log file as very short checkOut–checkIn sessions. The extremely long sessions, on the other hand, are the result of files that have been unlocked by the intervention of a system administrator (for instance, due to users who forgot to checkIn a file). Both extremes clearly do not correspond to typical user operations, which justifies our choice for the trimmed mean.
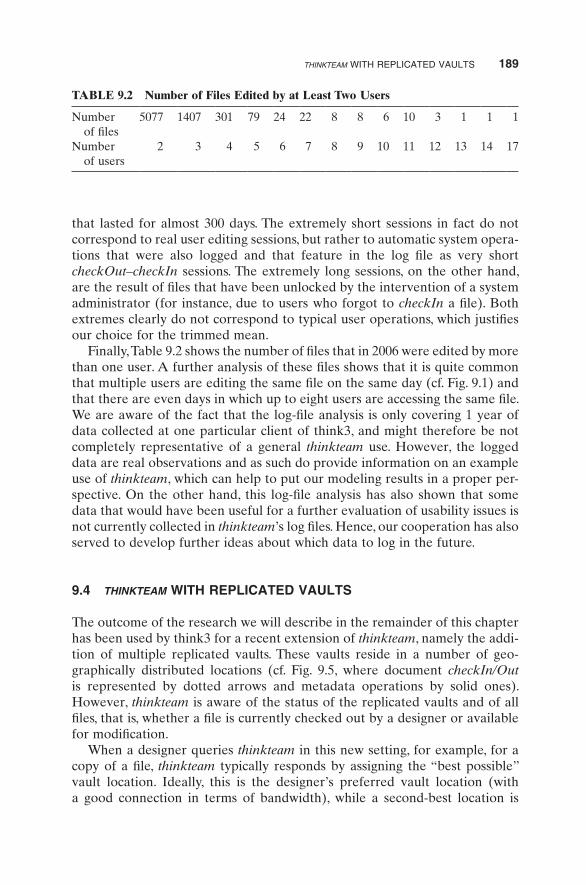
Finally, Table 9.2 shows the number of files that in 2006 were edited by more than one user. A further analysis of these files shows that it is quite common that multiple users are editing the same file on the same day (cf. Fig. 9.1) and that there are even days in which up to eight users are accessing the same file. We are aware of the fact that the log-file analysis is only covering 1 year of data collected at one particular client of think3, and might therefore be not completely representative of a general thinkteam use. However, the logged data are real observations and as such do provide information on an example use of thinkteam, which can help to put our modeling results in a proper per-spective. On the other hand, this log-file analysis has also shown that some data that would have been useful for a further evaluation of usability issues is not currently collected in thinkteam’s log files. Hence, our cooperation has also served to develop further ideas about which data to log in the future.
9.4 thinkteam WITH REPLICATED VAULTS
The outcome of the research we will describe in the remainder of this chapter has been used by think3 for a recent extension of thinkteam, namely the addi-tion of multiple replicated vaults. These vaults reside in a number of geo-graphically distributed locations (cf. Fig. 9.5, where document checkIn/Out is represented by dotted arrows and metadata operations by solid ones). However, thinkteam is aware of the status of the replicated vaults and of all files, that is, whether a file is currently checked out by a designer or available for modification.
When a designer queries thinkteam in this new setting, for example, for a copy of a file, thinkteam typically responds by assigning the “best possible” vault location. Ideally, this is the designer’s preferred vault location (with a good connection in terms of bandwidth), while a second-best location is
TABLE 9.2 Number of Files Edited by at Least Two Users
Number of files
5077 1407 301 79 24 22 8 8 6 10 3 1 1 1
Number of users
2 3 4 5 6 7 8 9 10 11 12 13 14 17

190 AN APPLICATION OF STOCHASTIC MODEL CHECKING IN THE INDUSTRY
assigned if the preferred location is down or has a too high workload. If, on the other hand, thinkteam notices that the most recent checkIn of the requested file was performed by the same designer, then he or she is told to use the local version of the file on his or her desktop (thus saving a checkOut).
When a designer has obtained a vault address, he or she may checkOut the file, edit it, and eventually checkIn the file, again with a strong preference for his or her preferred vault location. After each checkIn, the respective location informs thinkteam that the file has been uploaded. Afterward, thinkteam updates the file’s status, that is, removes the lock and makes it available for other designers. This communication also transfers the status information of the vault locations to thinkteam. Neither the communications between the vault locations needed to keep them consistent nor those between the vault locations and thinkteam are represented in Figure 9.5. In the model of think-team we will consider in this chapter, we do not explicitly address the com-munications between vaults but assume that they are kept consistent using suitable algorithms. The communication between the vaults and thinkteam will be modeled explicitly.
9.4.1 A Stochastic Model of thinkteam
We consider a model composed of three vault locations (Va, Vb, and Vc) containing identical file repositories, three explicitly modeled clients (CA, CB, and CC) competing for the same file, and the thinkteam application TT. Each vault location is connected to TT, and they communicate their status regularly to TT. Interesting aspects of a vault location’s status for performance analysis purposes are, for example, its workload, availability (i.e., being up or down), and the bandwidth offered to the various clients. TT keeps a record of the status of all files, like whether a file is locked (i.e., checked out by a client) or available for download and modification.
FIGURE 9.5 thinkteam with replicated vaults.
9.4.1.1 Assumptions The model is taken from Reference 17, and it is based on the following assumptions:
1. The bandwidth between a client and a vault is constant, and each client prefers down- and uploading files from the vault to which it has the best connection. At times, this connection may be down, however, in which case a client will use the next preferred vault.
2. Each client has a static preference list indicating the preferred vault order.
3. The three explicitly modeled clients do not influence significantly the overall performance of the full system (including many active clients modeled implicitly by the responsiveness characteristics of the various vaults). Our aim is to analyze a number of correctness and usability aspects of the system from these three clients’ viewpoint.
4. We only consider a subset of the operations available to thinkteam clients, namely the most important ones: checkOut and checkIn. This keeps the model relatively simple. Further operations could easily be added.
5. We currently do not enable TT to inform a client that he or she can use the local version of the file on his or her desktop if TT notices that the most recent checkIn of the requested file was performed by that client.
These assumptions originate from discussions with think3 on reasonable client behavior (1), from the need for modeling an abstract model of thinkteam (2, 4, and 5) and from rigorous and logically informed reasoning (3).
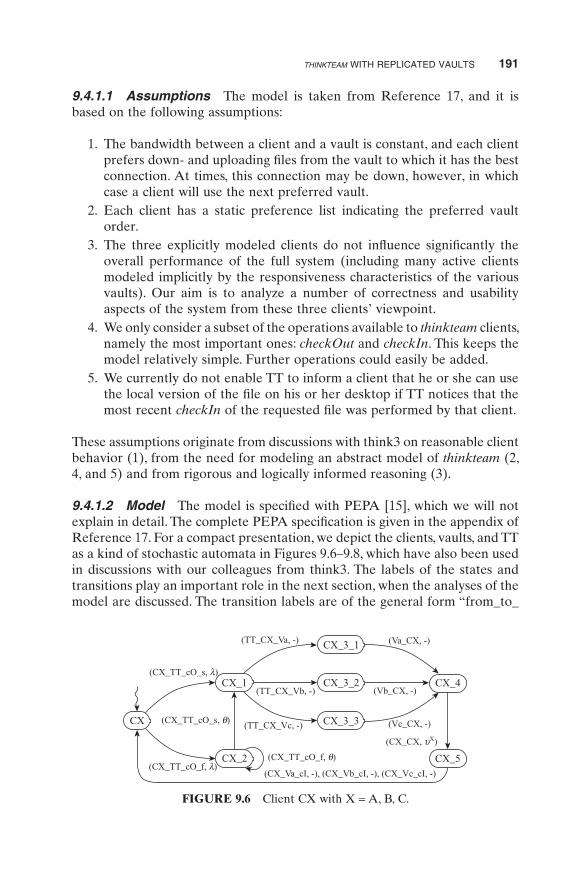
9.4.1.2 Model The model is specified with PEPA [15], which we will not explain in detail. The complete PEPA specification is given in the appendix of Reference 17. For a compact presentation, we depict the clients, vaults, and TT as a kind of stochastic automata in Figures 9.6–9.8, which have also been used in discussions with our colleagues from think3. The labels of the states and transitions play an important role in the next section, when the analyses of the model are discussed. The transition labels are of the general form “from_to_
FIGURE 9.6 Client CX with X = A, B, C.
CX
CX_1
CX_2
CX_3_1
(CX_TT_cO_s, λ)
(TT_CX_Va, -)
(TT_CX_Vb, -)
(TT_CX_Vc, -) (Vc_CX, -)
(Vb_CX, -)
(Va_CX, -)
(CX_CX, υX)
(CX_TT_cO_f, λ)(CX_Va_cI, -), (CX_Vb_cI, -), (CX_Vc_cI, -)
(CX_TT_cO_f, θ)
(CX_TT_cO_s, θ)
CX_3_2
CX_3_3
CX_4
CX_5
thinkteam WITH REPLICATED VAULTS 191

192 AN APPLICATION OF STOCHASTIC MODEL CHECKING IN THE INDUSTRY
action,” in which the “from_to” part indicates the direction of the information flow between processes (e.g., CA_TT denotes a communication from CA to TT), while the “action” part indicates a specific action (e.g., cO_s for successful checkOut, cO_f for unsuccessful checkOut, and cI for checkIn).
9.4.1.3 Client Process The behavior of a client CX, with X = A, B, C, is modeled as follows (cf. Fig. 9.6). Initially, in state CX, with rate* λ, client CX performs a request to TT to download a file for modification. This request to TT is successful when the file is available (CX_TT_cO_s, λ) and fails when the file is currently being edited by another client (CX_TT_cO_f, λ). If the request is successful, TT provides the address of the “best possible” vault location to the CX (e.g., TT_CX_Va means that CX receives the address of vault A).
The policy to assign a vault location is kept very simple in the current model: Each client receives the address of his or her preferred vault location (the first on his or her preference list) with highest static probability and the addresses of different vault locations with lower probabilities. This models the fact that the preferred vault location is not always available, be it due to a high work-load or due to temporary unavailability. These probabilities can be tuned so as to better match the performance characteristics of the system. Indications for such probabilities could, in theory, be obtained from an analysis of log files of the performance characteristics of the single vault currently used in
* A rate r of an action defines a duration Δt while the average duration is given by 1/r since, by definition, Δt is an exponentially distributed random variable with rate r.
FIGURE 9.7 Vault Vy with y = a, b, c.
(Vy_TT, δ)
(CA_Vy_cI, µy ), (CB_Vy_cI, µy ), (CC_Vy_cI, µy )
Vy_1Vy
A B C
(Vy_CA, γ y ), (Vy_CB, γ y ), (Vy_CC, γ y )A B C
FIGURE 9.8 TT with y = a, b, c.
(TT_CC_Vy, ε)
(TT_CB_Vy, ε)
(TT_CA_Vy, ε)
TT_2TT_1_2
TT_1_1
TT_1_3
TT
(CA_TT_cO_s, -)(CA_TT_cO_f, -),
(CB_TT_cO_s, -)
(CB_TT_cO_f, -),
(CC_TT_cO_s, -)
(CC_TT_cO_f, -)
(Vy_TT, -)
thinkteam. The specific log files that we have analyzed, however, did not reg-ister such information.
When client CX has obtained the address of a vault location, he or she can download (e.g., by (Va_CX, -) from Vault A) the requested file (which is usually part of a document composed of the file to be edited and of files of the parts surrounding the component that are not to be edited), then edit the file while in state CX_4, leaving that state (by (CX_CX, νX)) with rate νX cor-responding to an average time 1/νX for editing for this specific client and, finally, upload the file to a vault by means of a checkIn (e.g., by (CX_Va_cI, -) to Vault A), following a preference list as for downloading, and return to initial state CX. Actions with a rate indicated by “-” are passive, that is, the rate value is established during synchronization—in this case between the client and the vault process, the latter determining its value.
If the client’s request for a file fails, it starts a series of retry actions (in state CX_2) to obtain the file at a later moment. This essentially means that the client continues to make requests (by (CX_TT_cO_f, θ)) but at a higher rate θ. After a number of successive failed requests, the client eventually makes a successful request and moves to state CX_1.
9.4.1.4 Vault Process The behavior of a vault Vy, for y = a, b, c, is modeled as follows (cf. Fig. 9.7). A vault (location) can receive download operations from a client (by (Vy_CX,γ y
X)) with rate γ yX corresponding to the average
download time 1/ yXγ for that specific client and vault, alternated with checkIn
operations (CX_Vy_cI, µyX) with rate µy
X. After each checkIn, the vault informs TT (by (Vy_TT, δ)) that the file has been uploaded. In this way, TT can update the status of the file, that is, remove the lock and make it available for other clients. The same communication also models the transfer of status informa-tion of the vaults to TT.
9.4.1.5 TT Process The behavior of TT is modeled as follows (cf. Fig. 9.8). Initially, TT waits for file requests from clients to handle (e.g., from client A by action (CA_TT_cO_s, -)). In case of a successful file request, TT assigns a vault to the client, using the assignment policy described above.
This policy can be modeled stochastically by a race condition between the different assignments as follows. If client A should be assigned vault A on average in ca. 50% of the cases, vault B in ca. 33% and vault C in ca. 16% of the cases, one can choose suitable rates to reflect this. State TT_1_1, for example, has three outgoing transitions, labeled by (TT_CA_Va, 300), (TT_CA_Vb, 200), and (TT_CA_Vc, 100). The total exit rate from state TT_1_1 is thus 300 + 200 + 100 = 600 and the probability of client A being assigned vault A is then 300/600 = 0.5. Such relatively high exit rates model the fact that vault assignment is very fast compared with other activities. As a result, modeling preferences will not significantly influence the model’s performance analysis. (For reasons of space and readability, these details are abstracted from in Fig. 9.8: Only a nominal indication ε of the relevant rates is given.) Actions
thinkteam WITH REPLICATED VAULTS 193
194 AN APPLICATION OF STOCHASTIC MODEL CHECKING IN THE INDUSTRY
(TT_CX_Vy, ε) model assigning a vault, locking the file, and sending a client a vault address.
Any further request for the same file is explicitly denied (e.g., to client A by (CA_TT_cO_f, -)) until TT has received a message from a vault indicating that the file has been uploaded (e.g., for vault Y by (Vy_TT, -)). TT is then back in its initial state, ready to accept further requests for the file.
9.4.1.6 Full Specification The specification of thinkteam is completed by the parallel composition, by means of the PEPA cooperation operator (here denoted as ), of the three client processes, the three vault processes, and the TT process, as follows:
USERS SYSTEMCX TT cO z TT CX Vy CX Vy cI Vy CX|| _ _ _ , _ _ , _ _ , _
with USERS = CA CB CC, X = A, B, C, y = a, b, c, z = f, s and SYSTEM = TT Vy_TT (Va Vb Vc).
Note that the analysis is restricted to a model with three clients competing for the same file during approximately the same period. The model can easily be extended with a limited number of explicitly modeled clients, as in our earlier work addressing a thinkteam model with one centralized vault [8]. A larger number of clients could be analyzed using simulation-based model checking [19], but at a higher computational cost and producing less accurate results.
9.4.2 Analysis of the Stochastic Model
In this chapter, we use the probabilistic symbolic model checker PRISM [11, 20], which supports, among others, the verification of continuous stochastic logic (CSL) properties over continuous-time Markov chains (CTMCs) [21]. CTMCs can be generated by high-level description languages, among which PEPA, for which PRISM provides a front end. The complete PEPA specifica-tion with three clients (given in the appendix of Reference 17) leads to a CTMC with 104 states and 330 transitions. All analyses reported in this section were performed with PRISM v3.1.1 and took a negligible amount of CPU time. The iterative numerical method used for the computation of probabilities was Gauss–Seidel and the accuracy 10−6. See http://www.prismmodelchecker.org and Reference 20 for details.
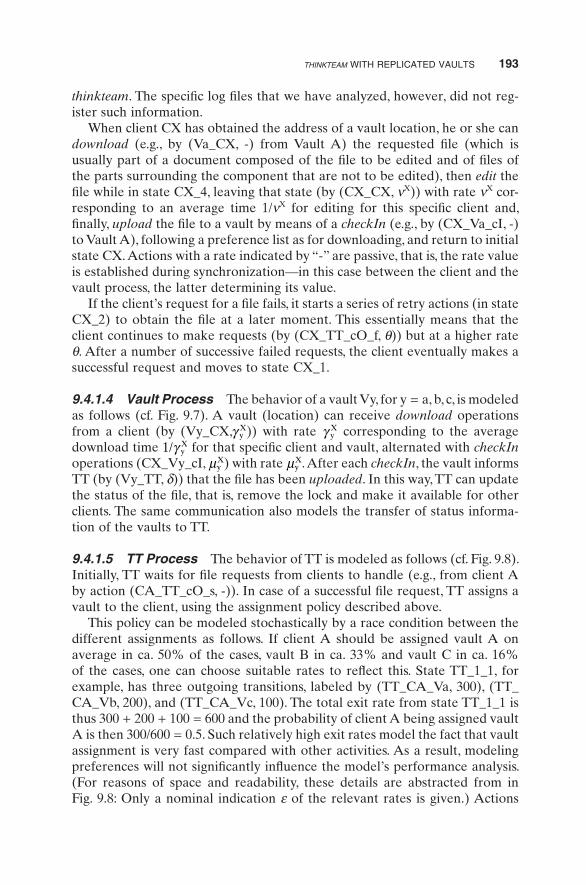
TABLE 9.3 Rate Values
λ γ µaA
aA= γ µa
BaB= γ µa
CaC= γ µb
AbA= γ µb
BbB= γ µb
CbC= νA = νB = νC θ δ = ε ε2 = 2ε ε3 = 3ε
0.1 8 4 6 6 8 4 4 6 8 1.35 6 100 200 300
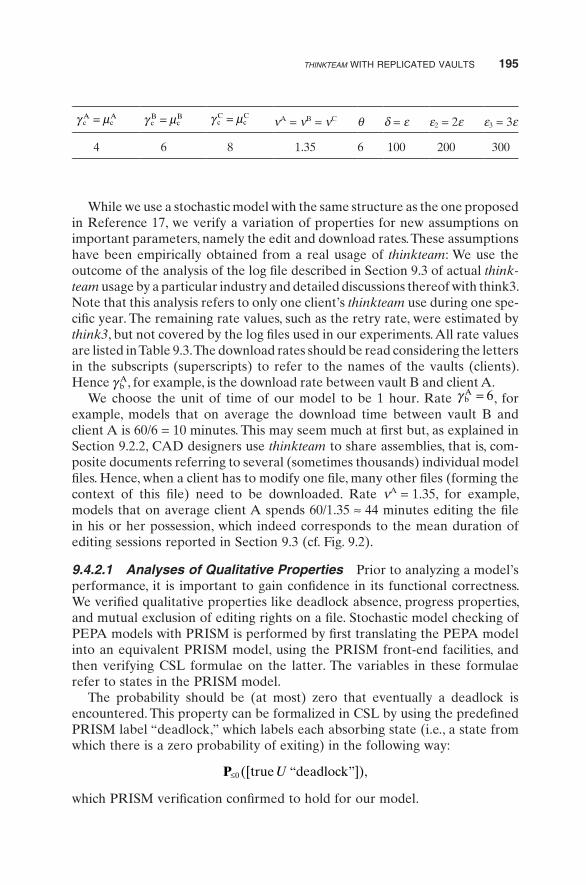
While we use a stochastic model with the same structure as the one proposed in Reference 17, we verify a variation of properties for new assumptions on important parameters, namely the edit and download rates. These assumptions have been empirically obtained from a real usage of thinkteam: We use the outcome of the analysis of the log file described in Section 9.3 of actual think-team usage by a particular industry and detailed discussions thereof with think3. Note that this analysis refers to only one client’s thinkteam use during one spe-cific year. The remaining rate values, such as the retry rate, were estimated by think3, but not covered by the log files used in our experiments. All rate values are listed in Table 9.3. The download rates should be read considering the letters in the subscripts (superscripts) to refer to the names of the vaults (clients). Hence γ b
A, for example, is the download rate between vault B and client A.We choose the unit of time of our model to be 1 hour. Rate γ b
A = 6, for example, models that on average the download time between vault B and client A is 60/6 = 10 minutes. This may seem much at first but, as explained in Section 9.2.2, CAD designers use thinkteam to share assemblies, that is, com-posite documents referring to several (sometimes thousands) individual model files. Hence, when a client has to modify one file, many other files (forming the context of this file) need to be downloaded. Rate νA = 1.35, for example, models that on average client A spends 60/1.35 ≈ 44 minutes editing the file in his or her possession, which indeed corresponds to the mean duration of editing sessions reported in Section 9.3 (cf. Fig. 9.2).
9.4.2.1 Analyses of Qualitative Properties Prior to analyzing a model’s performance, it is important to gain confidence in its functional correctness. We verified qualitative properties like deadlock absence, progress properties, and mutual exclusion of editing rights on a file. Stochastic model checking of PEPA models with PRISM is performed by first translating the PEPA model into an equivalent PRISM model, using the PRISM front-end facilities, and then verifying CSL formulae on the latter. The variables in these formulae refer to states in the PRISM model.
The probability should be (at most) zero that eventually a deadlock is encountered. This property can be formalized in CSL by using the predefined PRISM label “deadlock,” which labels each absorbing state (i.e., a state from which there is a zero probability of exiting) in the following way:
P≤0 ([ ]),true deadlockU “ ”
which PRISM verification confirmed to hold for our model.
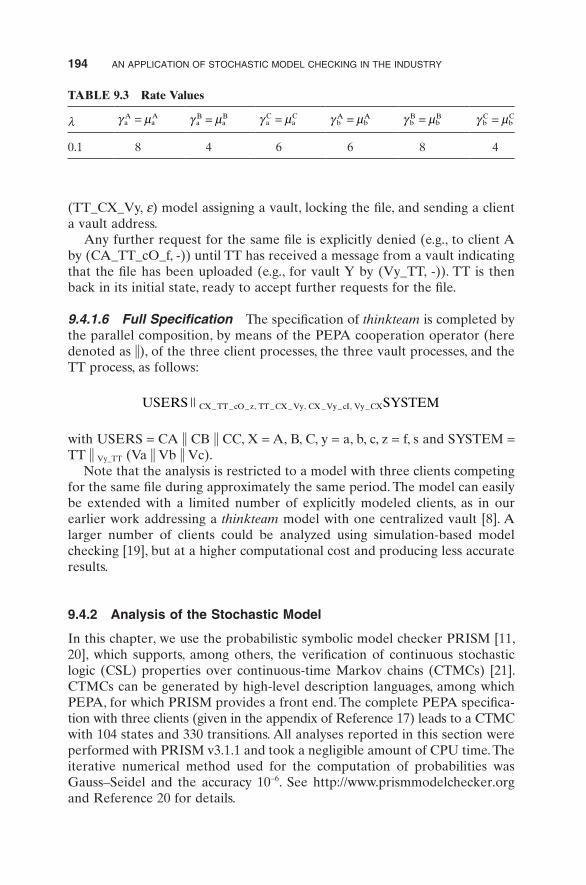
TABLE 9.3 Rate Values
λ γ µcA
cA= γ µc
BcB= γ µc
CcC= νA = νB = νC θ δ = ε ε2 = 2ε ε3 = 3ε
0.1 8 4 6 6 8 4 4 6 8 1.35 6 100 200 300
thinkteam WITH REPLICATED VAULTS 195
196 AN APPLICATION OF STOCHASTIC MODEL CHECKING IN THE INDUSTRY
Whenever client X succeeds to checkOut a file from vault A, he or she eventually performs a checkIn of that file. This property is captured by the following CSL formula:
P≥1 true CXcheckIn CXcheckOut([ { }]),U “ ” “ ”
where label “CXcheckIn” is defined as CX_STATE = CX_5 and “CXcheck-Out” as CX_STATE = CX_3_1. Verification with PRISM confirmed the above formula to hold for our model.
The probability should be (at most) zero that two clients will eventually obtain permission to modify the same file at the same time. This property can be formalized in CSL as
P≤0 ([ ( )]),true OkAB OR OkAC OR OkBCU “ ” “ ” “ ”
in which, for XY = AB, AC, BC, label
“ ”OkXY CX STATE CX 1 AND CY STATE CY 1≡ = =( _ _ ) ( _ _ ),
meaning that two clients (X and Y) have obtained permission to edit the file (i.e., are in state CX_1 and CY_1, respectively). PRISM confirmed that this formula holds for our model.
9.4.2.2 Analyses of Quantitative Properties In this section, we show performance issues of our model, in particular usability issues seen from a client’s perspective.
Swiftness of Releasing Files The second formula in the previous section only shows that a client eventually uploads the file (after downloading it). The following CSL formula can be used to quantify this issue:
P=≤
?([ { }]),true CXcheckIn CXcheckOut1U “ ” “ ”
that is, what is the probability that within 1 hour after downloading (by a checkOut) the file (state CX_3_1), client X is in state CX_5 ready to upload (by a checkIn) the file? The results are presented in Figure 9.9 for edit rate νX varying from 0.75 to 5, that is, from an average of 12–80 minutes editing the file (corresponding to values within half the standard deviation of the mean in the distribution in Fig. 9.2). As expected, the less time a client spends editing, the higher the probability that he or she returns it within 1 hour.
Behavior on the Long Run A parameter influencing the clients’ use of think-team, and thus also the time spent on different activities, is the average time that passes between accesses to the same file. The change in average time spent on different activities by a typical client when varying this interaccess time is

visualized in Figure 9.10: For each activity, we see the percentage of time client X spends on it, for various values of λ, which has a strong impact on the request rate.
We see that when λ is very low, most time is spent on activities other than editing, retrying and down/uploading. This pattern changes considerably as λ increases. The time spent waiting for the file (retrying) rapidly increases, and a client thus spends much less time on other activities. He or she also spends more time editing, but this increase is less rapid. It is interesting to note that from a certain point onward (when λ ≈ 0.45), a client spends more time retry-ing to obtain the file than he or she does actually editing it.
The properties analyzed to obtain the results of Figure 9.10 are simple steady-state properties formalized in CSL as
S=?([ ]),“ ”ClientXinStateZ
FIGURE 9.9 Probability for a client to checkIn a file within 1 hour after the checkOut.
00
0.10.20.30.40.50.60.70.80.9
1
1 2 3 4 5
Edit rate nu_X
Pro
babi
lity
FIGURE 9.10 Time a client spends on different activities for various file interaccess times.
Other activities
Editing
Retrying
Down/uploading
00 0.1 0.2 0.3 0.4 0.5 0.6 0.7 0.8 0.9 1
0.10.20.30.40.50.60.70.80.9
1
Request rate lambda
Ste
ady-
stat
e pr
obab
ility
thinkteam WITH REPLICATED VAULTS 197
198 AN APPLICATION OF STOCHASTIC MODEL CHECKING IN THE INDUSTRY
where label “ClientXinStateZ” is replaced by the state indicating the specific activity of interest, for example, CX_STATE = CX_2 to indicate that client X is retrying to obtain a file.
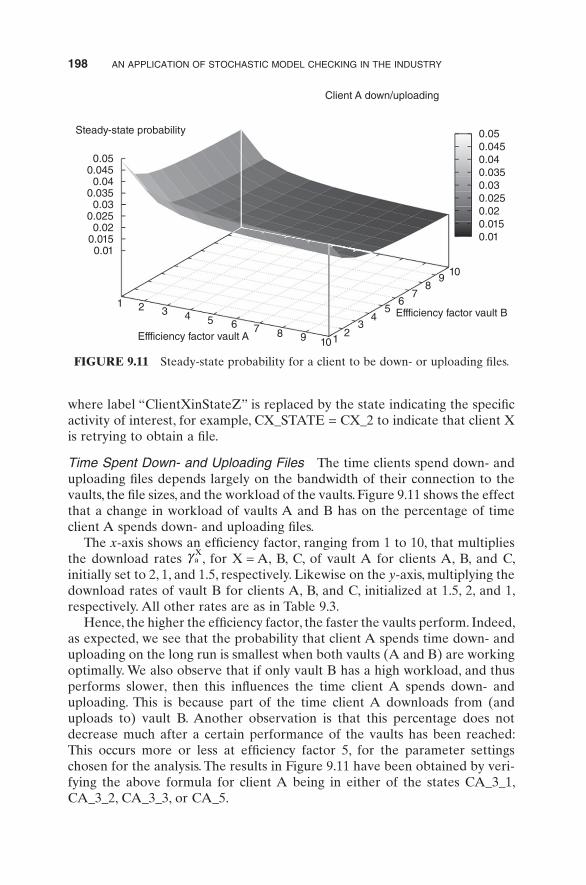
Time Spent Down- and Uploading Files The time clients spend down- and uploading files depends largely on the bandwidth of their connection to the vaults, the file sizes, and the workload of the vaults. Figure 9.11 shows the effect that a change in workload of vaults A and B has on the percentage of time client A spends down- and uploading files.
The x-axis shows an efficiency factor, ranging from 1 to 10, that multiplies the download rates γ a
X, for X = A, B, C, of vault A for clients A, B, and C,
initially set to 2, 1, and 1.5, respectively. Likewise on the y-axis, multiplying the download rates of vault B for clients A, B, and C, initialized at 1.5, 2, and 1, respectively. All other rates are as in Table 9.3.
Hence, the higher the efficiency factor, the faster the vaults perform. Indeed, as expected, we see that the probability that client A spends time down- and uploading on the long run is smallest when both vaults (A and B) are working optimally. We also observe that if only vault B has a high workload, and thus performs slower, then this influences the time client A spends down- and uploading. This is because part of the time client A downloads from (and uploads to) vault B. Another observation is that this percentage does not decrease much after a certain performance of the vaults has been reached: This occurs more or less at efficiency factor 5, for the parameter settings chosen for the analysis. The results in Figure 9.11 have been obtained by veri-fying the above formula for client A being in either of the states CA_3_1, CA_3_2, CA_3_3, or CA_5.
FIGURE 9.11 Steady-state probability for a client to be down- or uploading files.
1 2 3 4 5 6 7 8 9 10
10
12
34
56
78
9
Effficiency factor vault A
Effficiency factor vault B
Client A down/uploading
Steady-state probability
0.010.0150.02
0.0250.03
0.0350.04
0.0450.05
0.010.0150.020.0250.030.0350.040.0450.05
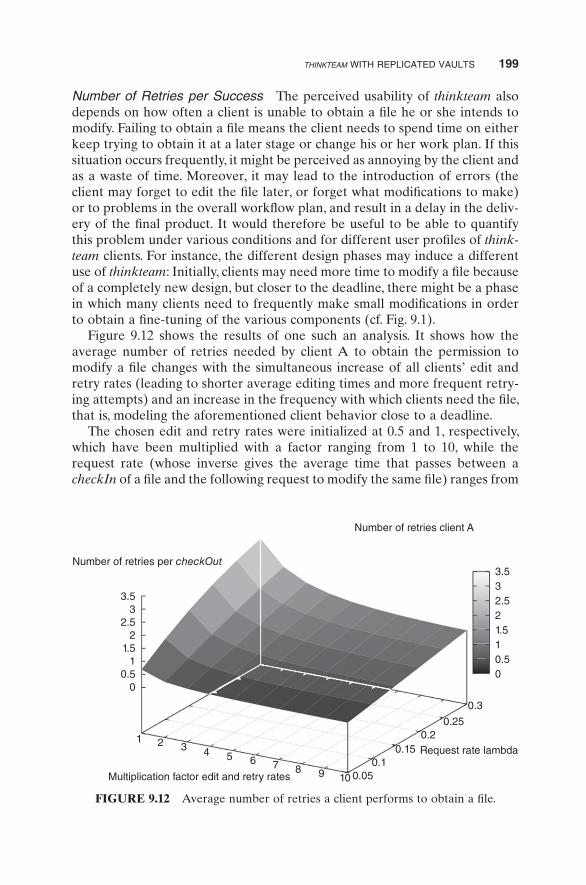
Number of Retries per Success The perceived usability of thinkteam also depends on how often a client is unable to obtain a file he or she intends to modify. Failing to obtain a file means the client needs to spend time on either keep trying to obtain it at a later stage or change his or her work plan. If this situation occurs frequently, it might be perceived as annoying by the client and as a waste of time. Moreover, it may lead to the introduction of errors (the client may forget to edit the file later, or forget what modifications to make) or to problems in the overall workflow plan, and result in a delay in the deliv-ery of the final product. It would therefore be useful to be able to quantify this problem under various conditions and for different user profiles of think-team clients. For instance, the different design phases may induce a different use of thinkteam: Initially, clients may need more time to modify a file because of a completely new design, but closer to the deadline, there might be a phase in which many clients need to frequently make small modifications in order to obtain a fine-tuning of the various components (cf. Fig. 9.1).
Figure 9.12 shows the results of one such an analysis. It shows how the average number of retries needed by client A to obtain the permission to modify a file changes with the simultaneous increase of all clients’ edit and retry rates (leading to shorter average editing times and more frequent retry-ing attempts) and an increase in the frequency with which clients need the file, that is, modeling the aforementioned client behavior close to a deadline.
The chosen edit and retry rates were initialized at 0.5 and 1, respectively, which have been multiplied with a factor ranging from 1 to 10, while the request rate (whose inverse gives the average time that passes between a checkIn of a file and the following request to modify the same file) ranges from
FIGURE 9.12 Average number of retries a client performs to obtain a file.
1 2 3 4 5 6 7 8 9 10 0.050.1
0.150.2
0.25
0.3
Request rate lambda
Multiplication factor edit and retry rates
Number of retries client A
Number of retries per checkOut
10.5
0
1.52
2.53
3.5
10.50
1.522.533.5
thinkteam WITH REPLICATED VAULTS 199

200 AN APPLICATION OF STOCHASTIC MODEL CHECKING IN THE INDUSTRY
0.05 to 0.3. We thus consider, on the one hand, average client behavior ranging from editing the file for 2 hours and retrying to checkOut the file once every hour (x-axis’ left end) to editing the file for only 12 minutes and retrying to checkOut the file as much as every 6 minutes (x-axis’ right end) and, on the other hand, the time that passes between a file’s checkIn and a subsequent request to checkOut that same file to range from only roughly once a day (y-axis’ left end) to as often as once every 3 hours (y-axis’ right end).
Figure 9.12 was obtained by extending the PRISM specification of our model with a reward structure to count the number of successful requests and another to count the number of retries. Reward structures defined over a CTMC define which actions need to be counted. The model can then be ana-lyzed with respect to a number of reward-based properties. We use the steady-state reward formula that calculates the average reward on the long run. This is formalized in PRISM as
R{ } ?[ ],“ ”label = S
in which “label” is a reward structure and S denotes that the steady-state reward is calculated. The number of repeated failed requests per successful request shown in Figure 9.12 was thus obtained by dividing the outcome of this formula for label = NrFailedRequestsClientA by that for label = NrSuccessfulRequestsClientA.
We see in Figure 9.12 that the number of retries a client needs to perform to obtain the file increases when, on average, clients spend a longer time editing the file while their attempts to retry to checkOut the file are not so frequent (toward the x-axis’ left end), in particular if the time between a file’s checkIn and subsequent checkOut request simultaneously decreases (toward the y-axis’ right end).
Having more detailed data on a particular usage context allows a more accurate stochastic analysis using the same model. The specific usage charac-teristics of thinkteam in the studied environment show that the number of retries per successful checkOut on average is quite acceptable, also when edit and retry rates go up close to a deadline period during which many clients need to frequently make small modifications to the file (toward the x-axis’ right end).
Analyses of the same model in Reference 17, for less favorable situations assuming much longer editing sessions (ca. 200 rather than 44 minutes) and much faster down/uploading (ca. 1 rather than 10 minutes), show that the number of retries per success may become unacceptably high (roughly a factor 10 worse than the number of retries presented in Fig. 9.12). In such cases, a waiting list policy can be shown more suitable than a retry policy, reducing the time clients waste retrying to obtain the files. A similar observation has been confirmed by the analysis performed in Reference 13 with a different analysis technique, allowing one to consider the dynamic effects of the presence of a much larger number of clients.

CONCLUSIONS 201
9.5 LESSONS LEARNED
During interactive design sessions with think3, which included both physical meetings and meetings by means of collaborative systems like teleconferenc-ing and electronic mail, think3 has acquired a basic knowledge of the main techniques and tools underlying our modeling and verification methodology. In fact, we have been able to use our formal models in various ways to discuss the behavior of thinkteam and its proposed extensions. Examples include simulations, message sequence charts, and counterexamples produced by model checkers. This has helped to detect a number of ambiguities and unclear aspects of the designs that think3 had in mind regarding the proposed think-team extensions. think3 furthermore has used our model of thinkteam extended with a publish/subscribe event notification service as a basis for their imple-mentation of this extension, which of course provided increased confidence on the usefulness of the system design. For think3, the experience with model-checking specifications of concurrent systems, before actually implementing them, has been a true eye opener. They have recognized the inherent concur-rency aspects of collaborative systems like thinkteam, as well as their intricate behavior. Furthermore, the relatively simple, lightweight, and abstract high-level models that we have developed during our cooperation have turned out to be of great help to focus on the key issues of the development of the inter-face aspects of thinkteam, before turning to the more detailed design and implementation issues.
9.6 CONCLUSIONS
We performed formal analyses of qualitative and quantitative properties of a small, yet relevant industrial case study concerning usability aspects of think3’s PDM application thinkteam. We modeled the added functionality of replicated vaults with the stochastic process algebra PEPA and verified prop-erties expressed in the stochastic temporal logic CSL over the model with the stochastic model checker PRISM. The verified properties include func-tional properties like vault assignment, mutual exclusion of editing rights and absence of deadlocks, and, in particular, performance properties providing information on the usability aspects of thinkteam under different assumptions on the quality of service of connections, vault availabilities, and work patterns of users.
Our graphical representation of the PEPA specification helped to develop and discuss the model with our think3 colleagues from the industry. Moreover, thinkteam is used by many important manufacturing industries that nowadays have several dislocated design departments, each of which needs reliable and efficient software systems to cooperate in an efficient way. The many inherent concurrency aspects that think3 needs to face when producing their software, and their awareness of the difficulties this implies when assessing the quality

202 AN APPLICATION OF STOCHASTIC MODEL CHECKING IN THE INDUSTRY
of their products, made it easier to raise their interest for the use of model-checking techniques in the early phases of software design.
The fact that we have developed the thinkteam model in close collaboration with think3 has shown that the activity was worthwhile to obtain precise and unambiguous specifications and has helped to provide better documentation of thinkteam. On the other hand, the model and the results have benefited considerably from the information that we have managed to obtain by analyz-ing the log file of the actual use of thinkteam. Still further analyses of such data can be of help to obtain models that can also be used to analyze thinkteam when used under different usage patterns. We believe this to be an interesting topic for further technology study. The models and results in their turn have also generated ideas for improved logging of thinkteam’s user activities, in order to get more insight into the usability aspects of thinkteam at work.
ACKNOWLEDGMENTS
The work described in this chapter was partially funded by the Italian projects TOCAI (MIUR/FIRB) and XXL (CNR/RSTL). thinkteam, think3, and think-PLM are registered trademarks of think3 Inc.
REFERENCES
1. E. Clarke, E. Emerson, and A. Sistla. Automatic verification of finite-state concur-rent systems using temporal logic specifications. ACM Transactions on Program-ming Languages and Systems, 8:244–263, 1986.
2. E. M. Clarke, Jr., O. Grumberg, and D. A. Peled. Model Checking. MIT Press, 1999. 3. M. Kwiatkowska, G. Norman, and D. Parker. Stochastic model checking. In Formal
Methods for the Design of Computer, Communication and Software Systems: Per-formance Evaluation, Lecture Notes in Computer Science 4486, pp. 220–270. Springer, 2007.
4. D. Wells. Extreme Programming: A Gentle Introduction, 2006. Available at: http://www.extremeprogramming.org
5. J. Stark. Product Lifecycle Management: 21st Century Paradigm for Product Realisa-tion. Springer, 2005.
6. M. H. ter Beek, M. Massink, D. Latella, S. Gnesi, A. Forghieri, and M. Sebastianis. Model checking publish/subscribe notification for thinkteam. In Proceedings FMICS’04, Electronic Notes in Theoretical Computer Science 133, pp. 275–294. Elsevier, 2005.
7. M. H. ter Beek, M. Massink, D. Latella, S. Gnesi, A. Forghieri, and M. Sebastianis. A case study on the automated verification of groupware protocols. In Proceedings ICSE’05, pp. 596–603. ACM Press, 2005.
8. M. H. ter Beek, M. Massink, and D. Latella. Towards model checking stochastic aspects of the thinkteam user interface. In Proceedings DSVIS’05, Lecture Notes in Computer Science 3941, pp. 39–50. Springer, 2006.

REFERENCES 203
9. P. Buchholz, J. Katoen, P. Kemper, and C. Tepper. Model-checking large structured Markov chains. Journal of Logic and Algebraic Programming, 56:69–96, 2003.
10. H. Hermanns, J.-P. Katoen, J. Meyer-Kayser, and M. Siegle. A tool for model-checking Markov chains. International Journal on Software Tools for Technology Transfer, 4(2):153–172, 2003.
11. M. Kwiatkowska, G. Norman, and D. Parker. Probabilistic symbolic model checking with PRISM: A hybrid approach. In Proceedings TACAS’02, Lecture Notes in Com-puter Science 2280, pp. 52–66. Springer, 2002.
12. H. Younes and R. Simmons. Probabilistic verification of discrete event systems using acceptance sampling. In Proceedings CAV’02, Lecture Notes in Computer Science 2404, pp. 223–235. Springer, 2002.
13. M. Massink, D. Latella, M. H. ter Beek, M. D. Harrison, and M. Loreti. A fluid flow approach to usability analysis of multi-user systems. In Proceedings HCSE’08, Lecture Notes in Computer Science 5247, pp. 166–180. Springer, 2008.
14. J. Hillston. Fluid flow approximation of PEPA models. In Proceedings QEST’05, pp. 33–43. IEEE Press, 2005.
15. J. Hillston. A Compositional Approach to Performance Modelling. Cambridge Uni-versity Press, 1996.
16. M. Tribastone. The PEPA Plug-In Project. In Proceedings QEST’07, pp. 53–54. IEEE Press, 2007.
17. M. H. ter Beek, S. Gnesi, D. Latella, M. Massink, M. Sebastianis, and G. Trentanni. Assisting the design of a groupware system—Model checking usability aspects of thinkteam. Journal of Logic and Algebraic Programming, 78:191–232, 2009.
18. R. Levesque. SPSS Programming and Data Management. SPSS, 2007. Available at: http://www.spss.com
19. T. Hérault, R. Lassaigne, F. Magniette, and S. Peyronnet. Approximate probabilistic model checking. In Proceedings VMCAI’04, Lecture Notes in Computer Science 2937, pp. 307–329. Springer, 2004.
20. D. Parker, G. Norman, and M. Kwiatkowska. PRISM 2.0—Users’ Guide, February 2004. Available at: http://www.cs.bham.ac.uk/∼dxp/prism
21. V. Kulkarni. Modeling and Analysis of Stochastic Systems. Chapman & Hall, 1995.