an application of citygreen to the cities of san luis obispo and lodi
DESCRIPTION
An Application of CITYgreen to the Cities of San Luis Obispo and Lodi. Dr. Brian Dietterick David Yun June 2000 Natural Resources Management Department Cal Poly University funded by the California Department of Forestry and Fire Protection. Overview. Introduction to CITYgreen - PowerPoint PPT PresentationTRANSCRIPT
Cal Poly CITYgreen Technology Transfer
An Application of An Application of CITYgreen to the Cities of CITYgreen to the Cities of San Luis Obispo and LodiSan Luis Obispo and Lodi
Dr. Brian DietterickDr. Brian Dietterick
David YunDavid YunJune 2000June 2000
Natural Resources Management DepartmentNatural Resources Management Department
Cal Poly UniversityCal Poly University
funded by the funded by the
California Department of Forestry and Fire ProtectionCalifornia Department of Forestry and Fire Protection

Cal Poly CITYgreen Technology Transfer
OverviewOverview• Introduction to CITYgreenIntroduction to CITYgreen
• Application of CITYgreen for San Luis Application of CITYgreen for San Luis Obispo and LodiObispo and Lodi
IntroductionIntroduction Data AcquisitionData Acquisition Data AnalysisData Analysis Summary of FindingsSummary of Findings Verification of FindingsVerification of Findings ConclusionConclusion

Cal Poly CITYgreen Technology Transfer
CITYgreen backgroundCITYgreen background
• Developed by American ForestsDeveloped by American Forests• A planning tool for mapping A planning tool for mapping
urban ecosystems and urban ecosystems and measuring their valuesmeasuring their values
• Quantifies the value of urban Quantifies the value of urban
treestrees

Cal Poly CITYgreen Technology Transfer
CITYgreen capabilitiesCITYgreen capabilities• CITYgreen evaluates urban ecosystem valuesCITYgreen evaluates urban ecosystem values
Summer Energy SavingsSummer Energy Savings Stormwater Management SavingsStormwater Management Savings Carbon Storage and SequestrationCarbon Storage and Sequestration Air Pollution RemovalAir Pollution Removal Urban Wildlife HabitatUrban Wildlife Habitat

Cal Poly CITYgreen Technology Transfer
What is required to run What is required to run CITYgreen?CITYgreen?
• Hardware & softwareHardware & software ArcView 3.1ArcView 3.1 Spatial AnalystSpatial Analyst Pentium processorPentium processor VGA or better graphicsVGA or better graphics > 32 MB RAM> 32 MB RAM Orthophotos (color preferred)Orthophotos (color preferred) Satellite ImageSatellite Image Landuse MapLanduse Map

Cal Poly CITYgreen Technology Transfer
Application of CITYgreen Application of CITYgreen forfor
San Luis Obispo & LodiSan Luis Obispo & Lodi

Cal Poly CITYgreen Technology Transfer
SLO backgroundSLO background• Located along the Central Coast midway Located along the Central Coast midway
between San Francisco and Los Angelesbetween San Francisco and Los Angeles• Mediterranean climateMediterranean climate
mild summers and wintersmild summers and winters Average annual rainfall = 24”Average annual rainfall = 24” morning and evening fogmorning and evening fog
• A coastal valley city A coastal valley city • Population: 43,000Population: 43,000• 2% growth rate2% growth rate

Cal Poly CITYgreen Technology Transfer
Lodi backgroundLodi background• Located in the Central Valley midway Located in the Central Valley midway
between Sacramento & Modesto between Sacramento & Modesto • Mediterranean climateMediterranean climate
Hot summers/cool wintersHot summers/cool winters Average annual rainfall = 17”Average annual rainfall = 17” morning and evening fogmorning and evening fog
• A inland valley city A inland valley city • Population: 55,000Population: 55,000• 1.3% growth rate1.3% growth rate

Cal Poly CITYgreen Technology Transfer
Data acquisitionData acquisition Satellite Image downloaded from Satellite Image downloaded from
TEALE Data Center or U.S. Geological TEALE Data Center or U.S. Geological SurveySurvey
color infrared images are used to color infrared images are used to categorize % vegetationcategorize % vegetation
desired data resolution <1 meterdesired data resolution <1 meter digital image size can be largedigital image size can be large
Large cities may require supplemental storage Large cities may require supplemental storage medium or large hard drive capacitymedium or large hard drive capacity
Cal Poly CITYgreen Technology Transfer
Data acquisitionData acquisition
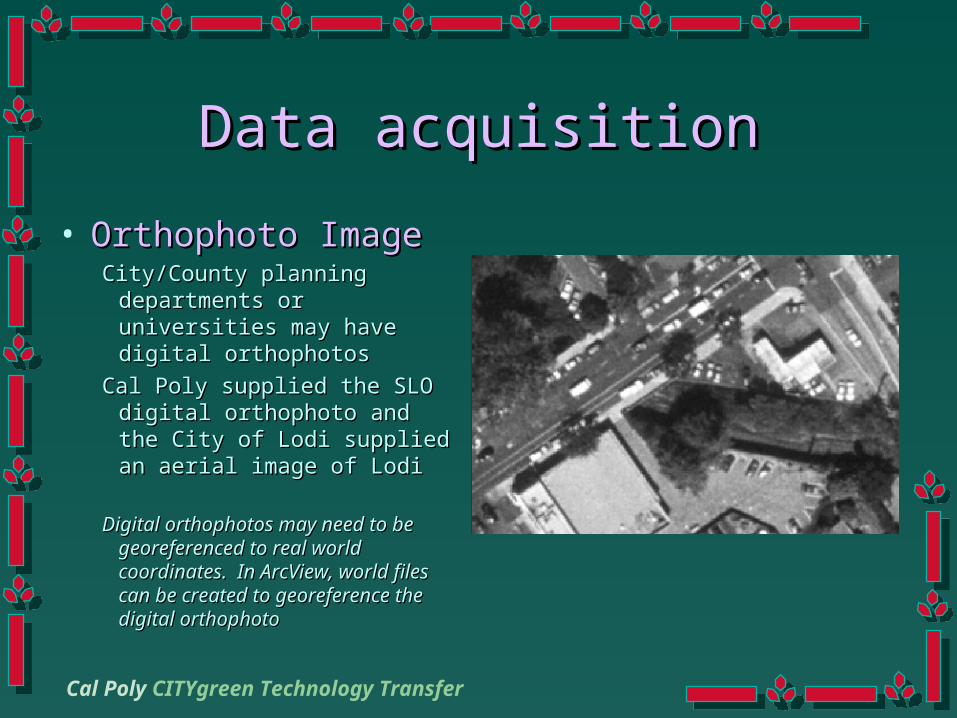
• Orthophoto ImageOrthophoto ImageCity/County planning City/County planning
departments or universities departments or universities may have digital orthophotosmay have digital orthophotos
Cal Poly supplied the SLO digital Cal Poly supplied the SLO digital orthophoto and the City of Lodi orthophoto and the City of Lodi supplied an aerial image of Lodisupplied an aerial image of Lodi
Digital orthophotos may need to be Digital orthophotos may need to be georeferenced to real world georeferenced to real world coordinates. In ArcView, world files coordinates. In ArcView, world files can be created to georeference the can be created to georeference the digital orthophotodigital orthophoto

Cal Poly CITYgreen Technology Transfer
Data acquisitionData acquisition
• Survey of TreesSurvey of TreesTrees in sample plots were Trees in sample plots were
field checked for:field checked for:• heightheight
• diameterdiameter
• healthhealth
• tree conflictstree conflicts
• speciesspecies
• ground coverground cover

Cal Poly CITYgreen Technology Transfer
Data acquisitionData acquisition
• Structure SurveyStructure SurveyStructures in sample plots field Structures in sample plots field
checked for:checked for:• building agebuilding age• roof & building colorroof & building color• height (story)height (story)• materialmaterial• overhangoverhang• location of windowslocation of windows
Cal Poly CITYgreen Technology Transfer
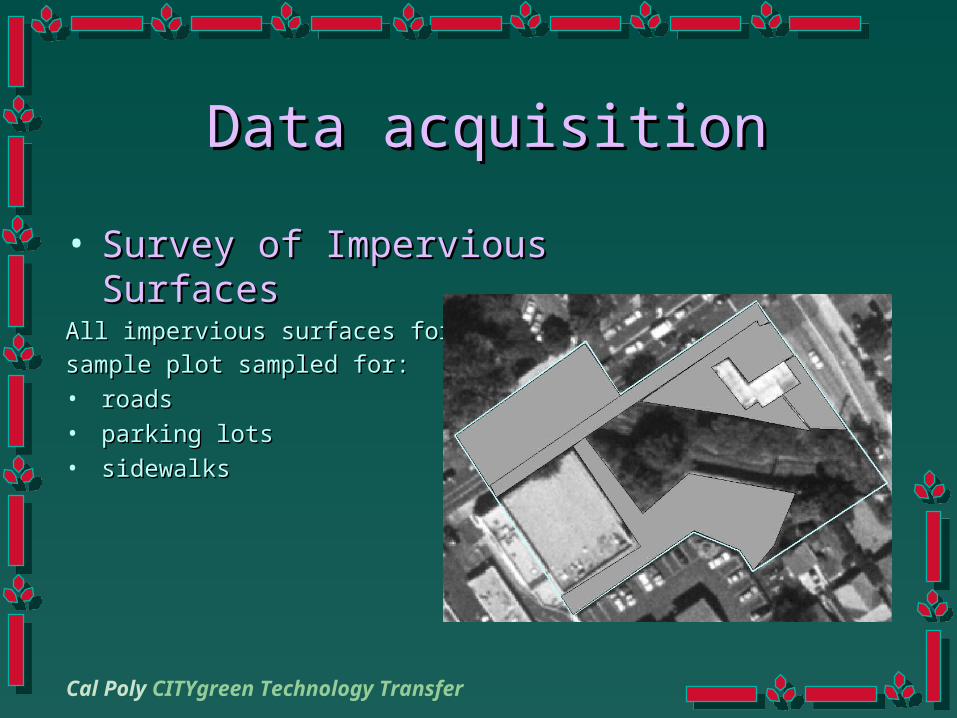
• Survey of Impervious Survey of Impervious SurfacesSurfaces
All impervious surfaces for eachAll impervious surfaces for eachsample plot sampled for:sample plot sampled for: • roadsroads• parking lotsparking lots• sidewalkssidewalks
Data acquisitionData acquisition
Cal Poly CITYgreen Technology Transfer
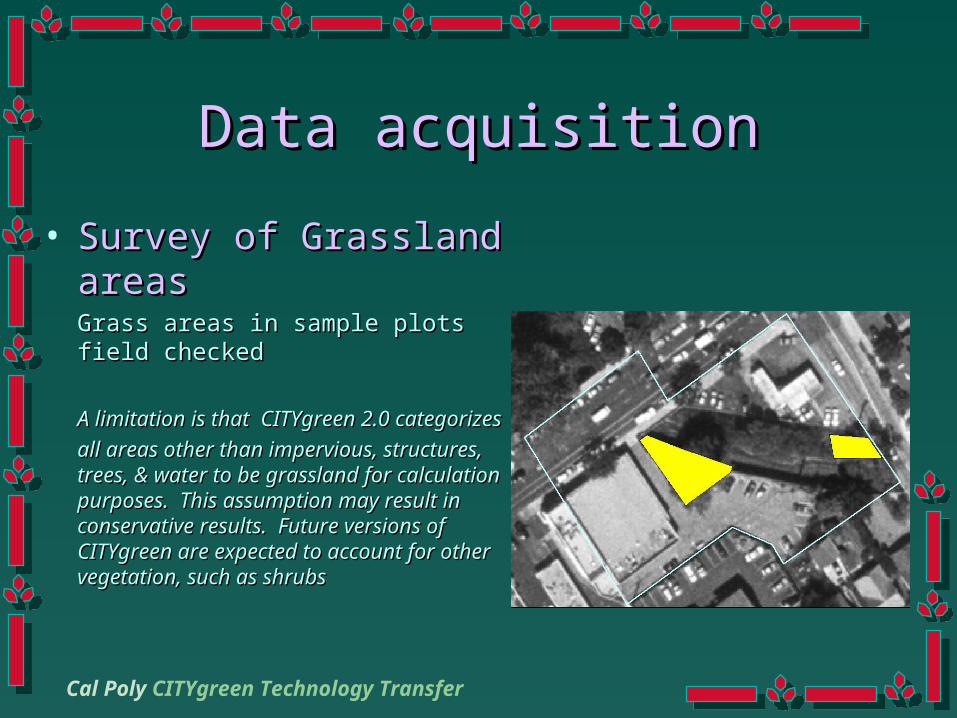
• Survey of Grassland Survey of Grassland areasareasGrass areas in sample plots field Grass areas in sample plots field checkedchecked
A limitation is that CITYgreen 2.0 A limitation is that CITYgreen 2.0 categorizes categorizes
all areas other than impervious, all areas other than impervious, structures, trees, & water to be structures, trees, & water to be grassland for calculation purposes. This grassland for calculation purposes. This assumption may result in conservative assumption may result in conservative results. Future versions of CITYgreen results. Future versions of CITYgreen are expected to account for other are expected to account for other vegetation, such as shrubsvegetation, such as shrubs
Data acquisitionData acquisition

Cal Poly CITYgreen Technology Transfer
Data acquisitionData acquisition
• Survey of water Survey of water bodiesbodies• StreamsStreams• LakesLakes
Cal Poly CITYgreen Technology Transfer
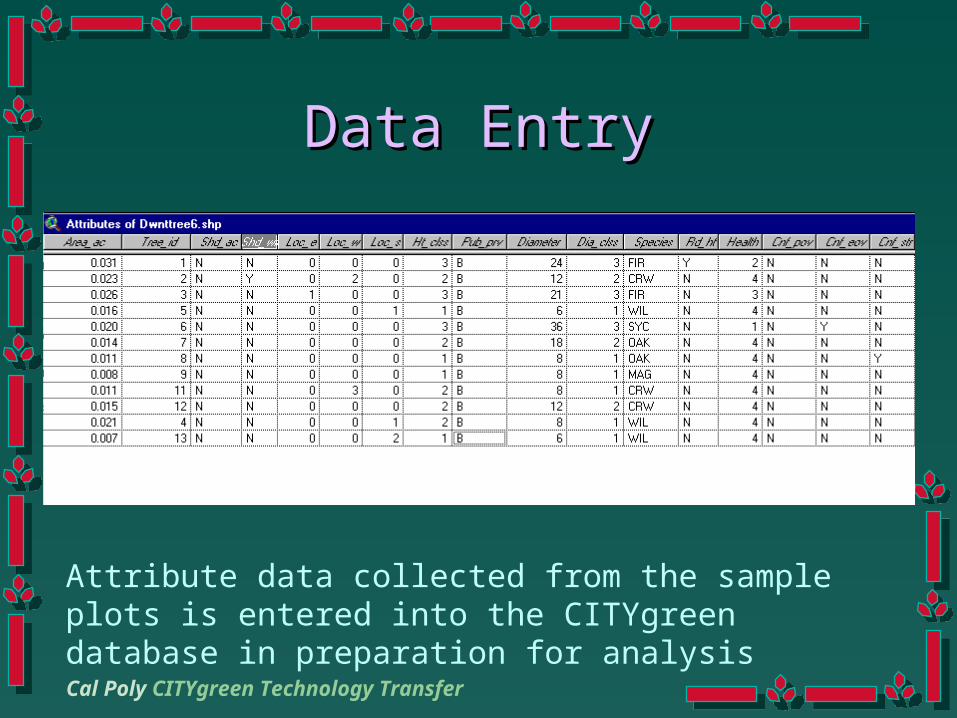
Data EntryData Entry
Attribute data collected from the sample plots is entered into the CITYgreen database in preparation for analysis
Cal Poly CITYgreen Technology Transfer
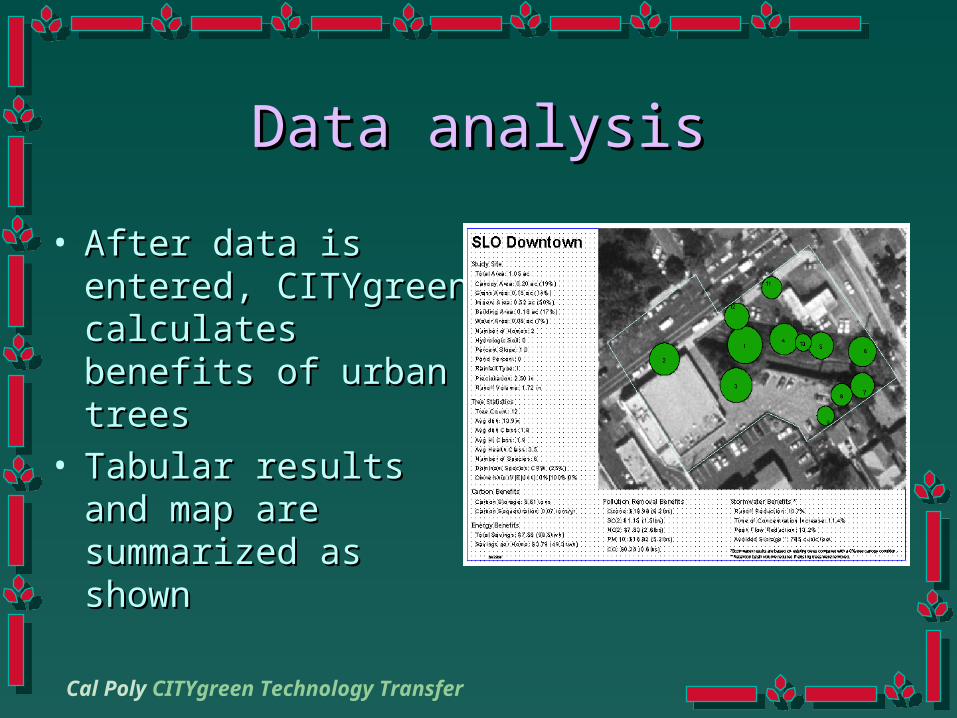
Data analysisData analysis
• After data is entered, After data is entered, CITYgreen calculates CITYgreen calculates benefits of urban treesbenefits of urban trees
• Tabular results and Tabular results and map are summarized map are summarized as shownas shown

Cal Poly CITYgreen Technology Transfer
SLO findingsSLO findingsCarbon Benefits Energy Benefits Stormwater Benefits Canopy Area
Site Carbon Carbon Total Saving per Runoff Time of Peak Flow Avoided Storage Sequestration Savings Home Reduction Concentration Reduction Storage *
(tons) (tons/yr.) ($) (kWh) ($) (kWh) (%) (%) (%) (ft3) (ac) (%)
slo downtown1 9.93 0.02 $30.32 393.8 $2.17 28.1 7.3 8.0 9.4 916 0.22 13
slo downtown2 0.30 0.00 $6.07 78.8 $6.07 78.8 2.1 3.0 2.6 33 0.01 4slo downtown3 1.75 0.00 $6.07 78.8 $3.03 39.4 7.6 8.3 9.1 161 0.04 13
slo downtown4 10.57 0.02 $9.10 118.1 $1.01 13.1 0.24 7slo downtown6 8.61 0.07 $7.58 98.5 $3.79 49.3 10.7 11.4 13.2 785 0.20 19
slo downtown7 0.13 0.00 $1.52 19.7 $0.76 9.8 1.1 1.2 1.3 17 0.00 2slo downtown9 0.09 0.00 $0.00 0.0 $0.00 0.0 0.2 0.1 0.2 11 0.00 0
Total 31.38 0.11 $60.66 787.70 $16.83 218.50 29.00 32.00 35.80 1923.00 0.71 58.00
Average 4.48 0.02 $8.67 112.53 $2.40 31.21 4.83 5.33 5.97 320.50 0.10 8.29Per Acre 4.11 0.01 251.70
laguna1 8.46 0.01 $3.03 39.4 $3.03 39.4 2.5 3.1 3.4 902 0.19 4
laguna2 1.64 0.00 $9.10 118.2 $2.27 29.6 2.5 2.2 3.1 138 0.04 4laguna3 0.38 0.01 $12.14 157.7 $1.10 14.3 0.6 0.7 0.8 49 0.01 1
laguna4 6.08 0.14 $104.63 1358.8 $5.23 67.9 2.9 2.3 3.4 631 0.19 5laguna5 8.06 0.18 $72.80 945.5 $4.55 59.1 4.7 4.2 6.0 894 0.25 8
Total 24.62 0.34 $201.70 2619.60 $16.18 210.30 13.20 12.50 16.70 2614.00 0.68 22.00
Average 4.92 0.07 $40.34 523.92 $3.24 42.06 2.64 2.50 3.34 522.80 0.14 4.40Per Acre 1.81 0.02 192.06
slo old1 22.81 0.51 $75.84 985.0 $1.46 18.9 7.5 7.1 9.7 2631 0.71 13
slo old2 9.73 0.22 $31.84 413.6 $1.45 18.8 6.3 5.3 7.9 1021 0.3 11slo old3 17.00 0.38 $156.20 2028.6 $3.19 41.4 4.2 4.0 5.6 1969 0.53 7
slo old4 44.58 1.00 $122.84 1595.3 $1.35 17.5 6.6 5.9 8.8 4812 1.38 11
Total 94.12 2.11 $386.72 5022.50 $7.45 96.60 24.60 22.30 32.00 10433.00 2.92 42.00Average 23.53 0.53 $96.68 1255.63 $1.86 24.15 6.15 5.58 8.00 2608.25 0.73 10.50

Cal Poly CITYgreen Technology Transfer
Lodi findingsLodi findingsCarbon Benefits Energy Benefits Stormwater Benefits Canopy Area
Site Carbon Carbon Total Saving per Runoff Time of Peak Flow Avoided StorageSequestration Savings Home Reduction Concentration Reduction Storage *
(tons) (tons/yr.) ($) (kWh) ($) (kWh) (%) (%) (%) (ft3) (ac) (%)
Sitenew1 10.76 0.24 $360.40 4680.5 $16.38 212.8 10.9 7.7 17.1 2073 0.33 7
Sitenew2 7.15 0.16 $409.37 5316.6 $14.62 189.9 6.8 4.7 10.9 1378 0.22 4Sitenew3 11.42 0.26 $196.56 2552.7 $5.62 72.9 9.0 6.0 14.2 2102 0.35 6
Total 29.33 0.66 $966.33 12549.80 $36.62 475.60 26.70 18.40 42.20 5553.00 0.90 17.00
Average 9.78 0.22 $322.11 4183.27 $12.21 158.53 8.90 6.13 14.07 1851.00 0.30 5.67Per Acre 1.81 0.04 341.93
Siteold1 85.95 0.24 $1,277.42 16589.9 $85.16 1106.0 45.5 29.1 67.7 5962 1.59 31
Siteold2 53.17 0.15 $507.87 6595.7 $39.07 507.4 37.2 23.9 55.6 4083 0.99 25Siteold3 45.48 0.08 $933.55 12124.0 $51.86 673.6 38.1 24.4 57.0 4205 1.03 26
Total 184.60 0.47 $2,718.84 35309.60 $176.09 2287.00 120.80 77.40 180.30 14250.00 3.61 82.00
Average 61.53 0.16 $906.28 11769.87 $58.70 762.33 40.27 25.80 60.10 4750.00 1.20 27.33Per Acre 14.24 0.04 1099.54
GrowSite1 108.46 0.19 $343.93 4466.6 $15.63 203.0 65.4 48.9 87.9 8166 2.45 51
GrowSite2 71.58 0.13 $835.22 10847.0 $29.83 387.4 43.9 30.9 63.4 6832 1.62 31GrowSite3 99.90 0.17 $425.74 5529.0 $12.16 158.0 49.7 34.4 71.5 8696 2.26 36
Total 279.94 0.49 $1,604.89 20842.60 $57.62 748.40 159.00 114.20 222.80 23694.00 6.33 118.00
Average 93.31 0.16 $534.96 6947.53 $19.21 249.47 53.00 38.07 74.27 7898.00 2.11 39.33Per Acre 17.24 0.03 1458.99
Cal Poly CITYgreen Technology Transfer
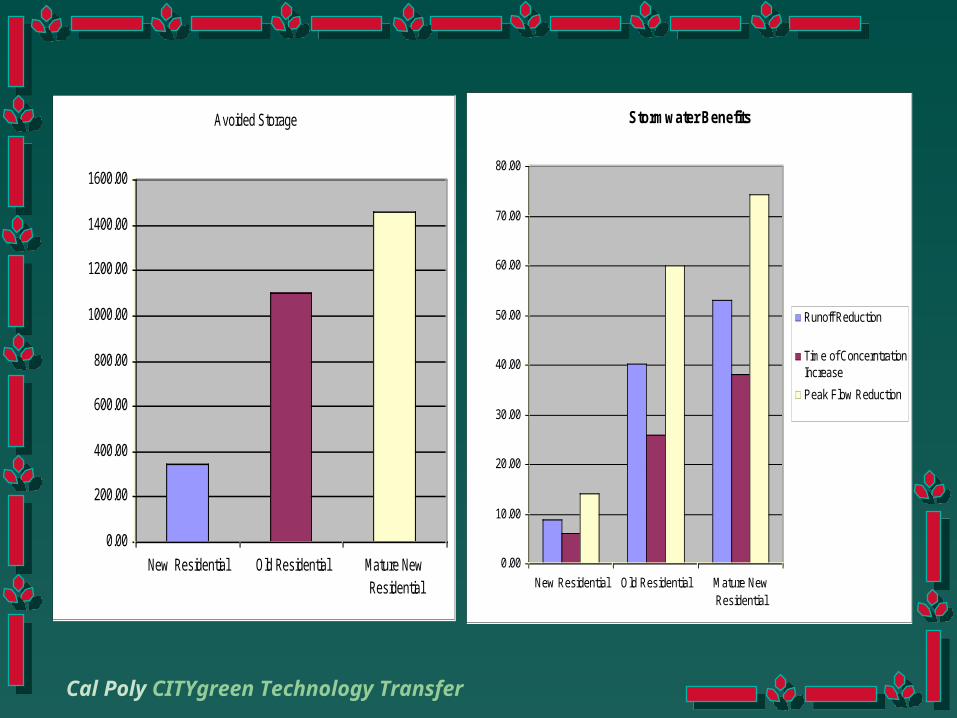
Stormwater Benefits
0.00
10.00
20.00
30.00
40.00
50.00
60.00
70.00
80.00
New Residential Old Residential Mature NewResidential
(%)
Runoff Reduction
Time of ConcerntrationIncrease
Peak Flow Reduction
Avoided Storage
0.00
200.00
400.00
600.00
800.00
1000.00
1200.00
1400.00
1600.00
New Residential Old Residential Mature NewResidential
(cuft)

Cal Poly CITYgreen Technology Transfer
Energy Savings
$0.00
$10.00
$20.00
$30.00
$40.00
$50.00
$60.00
$/year
New Residential Old Residential Mature New
Residential
Carbon Storage
0.00
2.00
4.00
6.00
8.00
10.00
12.00
14.00
16.00
18.00
20.00
Tons/Year
New Residential Old Residential Mature New
Residential

Cal Poly CITYgreen Technology Transfer
Summary of findingsSummary of findingsSLO findings:SLO findings:• The energy savings per home/year were low The energy savings per home/year were low
due to moderate weather resulting in low due to moderate weather resulting in low energy costsenergy costs
• Larger sample areas resulted in higher runoff Larger sample areas resulted in higher runoff volume reduction, peak flow reduction, volume reduction, peak flow reduction, carbon storage, & carbon sequestrationcarbon storage, & carbon sequestration

Cal Poly CITYgreen Technology Transfer
Summary of findings cont’Summary of findings cont’Lodi findings:Lodi findings:• The energy savings ($/home/year) were higher The energy savings ($/home/year) were higher
than SLO due to warmer summer temperatures than SLO due to warmer summer temperatures and higher energy costsand higher energy costs
• Older residential areas had higher energy savings Older residential areas had higher energy savings per home compared to newer residential areasper home compared to newer residential areas
• Growth model resulted in higher canopy coverage Growth model resulted in higher canopy coverage in new, but lower energy savings when compared in new, but lower energy savings when compared with the older residential areaswith the older residential areas
Cal Poly CITYgreen Technology Transfer
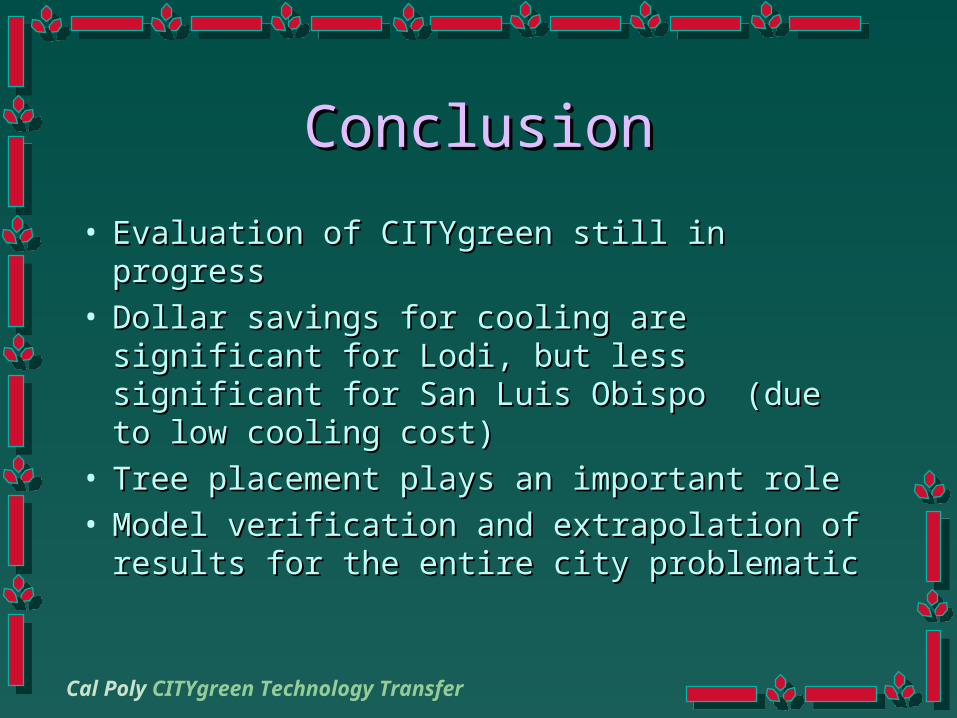
ConclusionConclusion
• Evaluation of CITYgreen still in progressEvaluation of CITYgreen still in progress• Dollar savings for cooling are significant for Dollar savings for cooling are significant for
Lodi, but less significant for San Luis Obispo Lodi, but less significant for San Luis Obispo (due to low cooling cost)(due to low cooling cost)
• Tree placement plays an important roleTree placement plays an important role• Model verification and extrapolation of results Model verification and extrapolation of results
for the entire city problematicfor the entire city problematic

Cal Poly CITYgreen Technology Transfer
For more infoFor more info Contact: Dr. Brian Dietterick Contact: Dr. Brian Dietterick
[email protected]@calpoly.edu
805-756-6155805-756-6155
David Yun David Yun
Natural Resources Management DepartmentNatural Resources Management Department
Cal Poly State UniversityCal Poly State University
San Luis Obispo, CA 93407San Luis Obispo, CA 93407