an analytic solution to the monod-wyman-changeux model and all parameters in this model
TRANSCRIPT

An analytic solution to the Monod-Wyman-Changeux model and allparameters in this model
G. Zhou, P. S. Ho, and K. E. van HoldeDepartment of Biochemistry and Biophysics, Oregon State University, Corvallis, Oregon 97331
ABSTRACT Starting from the Monod- maximum slope. From these results, lizing these equations to provide aWyman-Changeux (MWC) model we derive a set of formulas which allow "best fit" of the MWC model to the(Monod, J., J. Wyman, and J. P. determination of the parameters of the experimental data, and to obtain aChangeux. 1965. J. Mol. Biol. 12:88- MWC model (kR, c, and L) from the refined set of the parameters.118), we obtain an analytical expres- value of the Hill coefficient, nH, the Finally, we demonstrate the applica-sion for the slope of the Hill plot at any ligand concentration at the position of bility of the technique by analysis ofligand concentration. Furthermore, we maximum slope (1A10), and the value of oxygen binding data for Octopusderive an equation satisfied by the v/(n - v) at this point. hemocyanin.ligand concentration at the position of We then outline procedures for uti-
INTRODUCTION
A simple, yet versatile model for the cooperative bindingof ligands by macromolecules has been provided byMonod et al. (1965). According to this Monod-Wyman-Changeux (MWC) model, the average number of ligandsbound, at free ligand concentration [A], to an n-sitemolecule is given by
(1 + kR[AI)M 1- + Lc (I + ckR[AI)'-1v
= nkR[A]+ kR[A )n ckR[A])n (la)
c = kT/kR (Ib)
L = [T]/[R]. (Ic)
Here kR and kT are respectively the binding constants inthe "strong-binding" (R) state and "weak-binding" (T)states, and [R] and [T] are the concentrations of unli-ganded macromolecules in those two states. Thus, theMWC model involves three adjustable parameters, whichmay be taken to be either kR, c, and L, or kR, kT, and L.
In attempting to fit experimental data to this model,two approaches are obvious. First, one may use a nonlin-ear least squares fitting routine, and attempt to find thebest values of kR, c, and L to fit the data. This approachhas been employed, for example, by Miller (1985). Satis-factory fits can be obtained, but the method is laborious,especially if preliminary estimates of the parameters are
not available. An alternative precedure would be to obtainanalytic expressions for measurable quantities in the Hillplot (or some other graphical representation) that wouldenable direct computation of the parameters. Anapproach of this kind has been utilized by Dahlquist
(1978) for the much simpler variant of the MWC modelin which binding occurs only to the R state, the "R-exclusive" binding model. This corresponds to the specialcase where c = 0 in Eq. 1. In Dahlquist's analysis, theslope of the Hill plot (nh) was evaluated at the half-saturation point. This value, together with the concentra-tion of ligand at half-saturation, allowed both L and kR tobe evaluated from simple expressions. However, as isshown by Colosimo et al. (1974), the more general modeldescribed by Eq. 1 can easily yield Hill plots in which theslope at the half-saturation point is unity, even though themaximum Hill coefficient (nH) is much greater. There-fore it is apparent that the slope at half-saturation is not a
useful parameter in the more general case.
The "R-exclusive" model was also examined byKegeles (1974) who obtained an expression for the slopeat any value of [A], and an equation for the [A] value atthe position of maximum slope. However, most coopera-tive binding systems that have been examined exhibitsignificant binding to both R and T states, so that theutility of the "R-exclusive" model is limited.
Accordingly, we have carried out an analysis of thegeneral MWC model (Eq. 1) to yield analytical expres-sions for the Hill slope, nh, and the ligand concentration[A]o at the point of maximum slope (nH). We show thatthese can be combined with the value of [iv/(n - v)] at thepoint of maximum slope to yield equations which allow ananalytical determination of L, c, and kR.
Since these values are dependent upon a single point inthe Hill plot, their determination does not, in itself,provide a test as to whether the model fits the data.Therefore, we utilize these values (nH, [A]O, and [v/(n -
i)]O as initial parameters in a nonlinear least squares
Biophys. J. e Biophysical SocietyVolume 55 February 1989 275-280
0006-3495/891021275106 $2.00 2750006-3495/89/02/275/06 $2.00 275
fitting of the data, to arrive at a "best set" of L, c, and kR.Such a directed fitting procedure can be much moreefficient than one which initially chooses parameter val-ues at random. To demonstrate the utility of this proce-dure, we have reanalyzed oxygen binding data for Octo-pus hemocyanin.
RESULTS
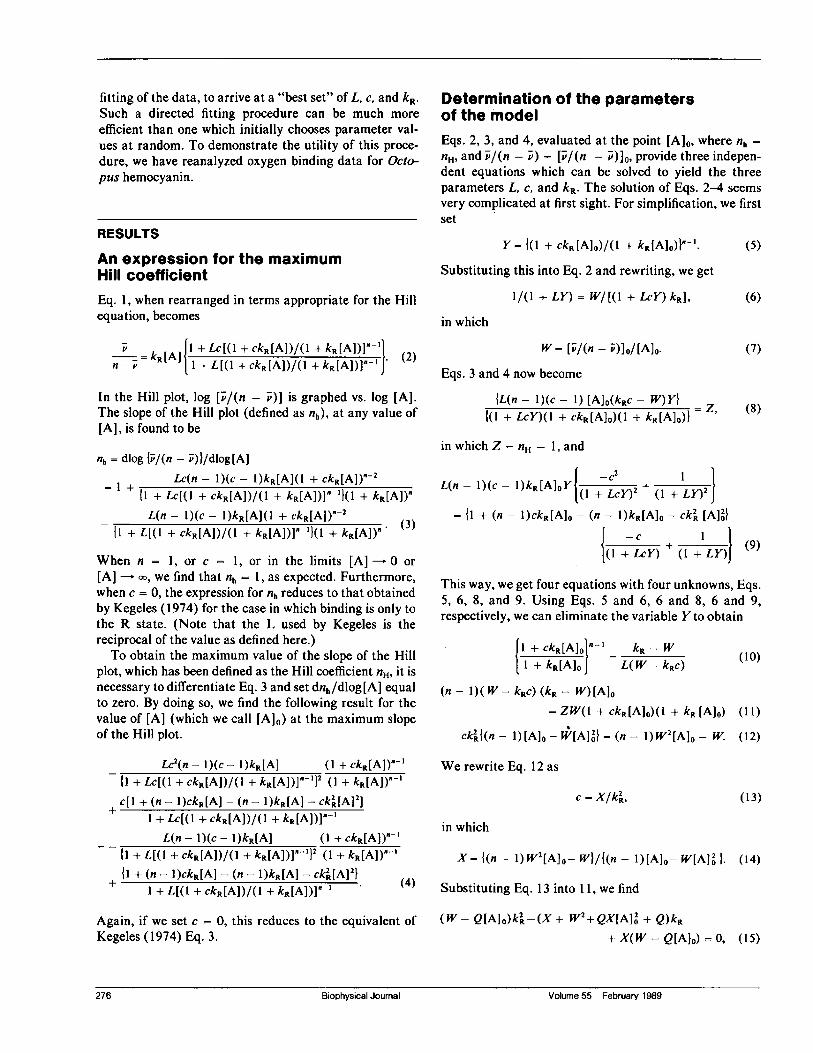
An expression for the maximumHill coefficientEq. 1, when rearranged in terms appropriate for the Hillequation, becomes
v I[+ Lc[(l + ckR[A])/(l + kR[A])]l (n k-jA]j+ L((I + ckR[A]I)(l + kR[A])IM1n 2
In the Hill plot, log [v;/(n - v)] is graphed vs. log [A].The slope of the Hill plot (defined as nh), at any value of[A], is found to be
nh = dlog {I;/(n -iv)I/dlog [A]-
1 + Lc(n - 1)(c - I)kR[A](I + ckR[A])n-2{1 + Lc[(l + ckR[A])/(l + kR[A])]n-II(1 + kR[A])nL(n - 1)(c I)kR[A](1 + ckR[A] )n-2 (3)
{1 + L[(1 + ckR[A])/(l + kR[A])]n-lI(I + kR[A])n
When n 1, or c 1, or in the limits [A] or
[A] -. 0, we find that nh = 1, as expected. Furthermore,when c = 0, the expression for nh reduces to that obtainedby Kegeles (1974) for the case in which binding is only tothe R state. (Note that the L used by Kegeles is thereciprocal of the value as defined here.)To obtain the maximum value of the slope of the Hill
plot, which has been defined as the Hill coefficient nH, it isnecessary to differentiate Eq. 3 and set dnh/dlog[A] equalto zero. By doing so, we find the following result for thevalue of [A] (which we call [A]o) at the maximum slopeof the Hill plot.
Lc2(n- 1)(c- I)kR[A] (1 + ckR[A])n'{1 + Lc[(l + ckR[A])/(l + kR[A])]n-1}2 (1 + kR[A])"-1c[1 + (n - I)ckR[A]- (n- I)kR[A] -ck2[A]2]
1 + Lc[(l + ckR[A])/(l + kR[A])]n-L(n-1)(c-I)kR[A] (1 + ckR[A])n-
{1 + L[(1 + ckR[A])/(l + kR[A])]n-12 (1 + kR[A])n-{1 + (n - I)ckR[A]- (n- I)kR[A] - ck2[A]2I
1 + L[(1 + ckR[A])/(l + kR[A])]I -(
Again, if we set c = 0, this reduces to the equivalent ofKegeles (1974) Eq. 3.
Determination of the parametersof the modelEqs. 2, 3, and 4, evaluated at the point [A]O, where nh =
nH, and v/(n -vP) = [iv/(n - i)]O, provide three indepen-dent equations which can be solved to yield the threeparameters L, c, and kR. The solution of Eqs. 2-4 seemsvery complicated at first sight. For simplification, we firstset
Y= {(1 + ckR[A]O)/(1 + kR[AIo)In-'.
Substituting this into Eq. 2 and rewriting, we get
1/(1 + LY) = W/[(1 + LcY) kRI,
in which
W= [v/(n -)]o/[A]o
Eqs. 3 and 4 now become
{L(n - 1)(c - 1) [A]O(kRC- W)YI z{(1 + LcY)(I + ckR[A]o)(I + kR[A]o)-
(5)
(6)
(7)
(8)
in which Z = nH- 1, and
L(n - 1)(c - I)kR[A]oYI(l + ycY)2 + (1 + LY)2
= {1 + (n - I)ckR[A]o- (n - 1)kR[A]o - ck2 [A]2I
1(1 + LcY) (1 + LY)}(9)
This way, we get four equations with four unknowns, Eqs.5, 6, 8, and 9. Using Eqs. 5 and 6, 6 and 8, 6 and 9,respectively, we can eliminate the variable Y to obtain
I + ckR[A]o4'1 + kR[A]o J
kR - W
L(W- kRC)
(n - 1)(W- kRc) (kR -W)[A]o= ZW(1 + ckR[A]O)(1 + kR [A]o)
ck1{(n 1) [A]o- W[A]A = (n )W2[A]o- W.
We rewrite Eq. 12 as
c = X/k2.,
in which
X = {(n [)2[A] -W/{(n 1) [A]o-W[A] 0.
(10)
(1 1)
(12)
(13)
(14)
Substituting Eq. 13 into 1 1, we find
(W- Q[A]O)k2-(X+ W2+QX[A]o + Q)kR
+ X(W-Q[A]o) = 0, (15)
276 Biophysical Journal Volume276 Biophysical Journal Volume 55 February 1989
in which
Q=ZW/{(n- 1)[A]o}. (16)
Eq. 15 is a simple quadratic equation. The solutions are
(X+ w2 QX[A] + Q)
kR1, 2 = 2( WQX[A]o)2(W -Q[A]0)
+ {(X + W2+ QX[A]g2 + Q)2 - 4X(W - Q[AO]211/22(W- Q[A]o)
All quantities in Eq. 17 are calculable from the experi-mental data, since, as defined above,
W= [v'/(n -)]O/ [A]0
Z= nH -1
X= {(n -1) W2[A]o -
Q= ZW/(n- 1)[A]o.Wl/{(n- 1)[A]o- W[A] }
The values kRl and kR2 correspond to the + and -
solution of Eq. 17, respectively.If we substitute Eq. 17 into 13 and 10, we find,
respectively,
C1,2 = {(n -1) W2 [A]o- WIl{{(n - 1)[A]o - W[A]2}k212} (18)
and
LI,2 = {(kR,2 - W)/(W -kRl,2cl 2)}{(1 + kR1,2 [A]o)/
(1 + cl,2 kRl,2[A]o)In- 1. (19)
Thus, we have obtained analytic solutions for the threeparameters. We can show that
cl =kRI/kR2; C2 = 1/cl; L2 =1/ Ll.
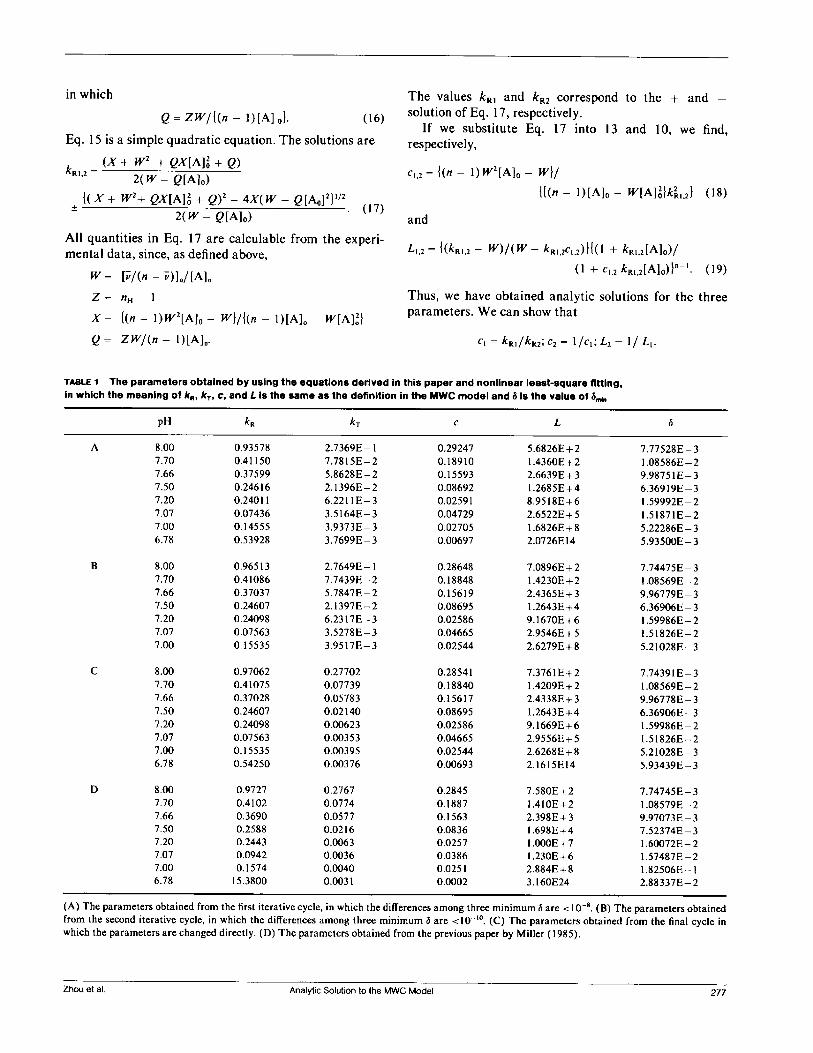
TABLE 1 The parameters obtained by using the equations derived in this paper and nonlinear least-square fitting,in which the meaning of kR, kT, c, and L is the same as the definition in the MWC model and 5 is the value of Smkn
pH kR kT c L 6
A 8.00 0.93578 2.7369E- 1 0.29247 5.6826E+2 7.77528E-37.70 0.41150 7.7815E-2 0.18910 1.4360E+2 1.08586E-27.66 0.37599 5.8628E-2 0.15593 2.6639E + 3 9.98751E-37.50 0.24616 2.1396E-2 0.08692 1.2685E+4 6.36919E-37.20 0.24011 6.2211E-3 0.02591 8.9518E+6 1.59992E-27.07 0.07436 3.5164E- 3 0.04729 2.6522E+5 1.51871E-27.00 0.14555 3.9373E-3 0.02705 1.6826E+8 5.22286E- 36.78 0.53928 3.7699E-3 0.00697 2.0726E14 5.93500E-3
B 8.00 0.96513 2.7649E- 1 0.28648 7.0896E+2 7.74475E-37.70 0.41086 7.7439E-2 0.18848 1.4230E+2 1.08569E-27.66 0.37037 5.7847E-2 0.15619 2.4365E+3 9.96779E- 37.50 0.24607 2.1397E-2 0.08695 1.2643E+4 6.36906E-37.20 0.24098 6.2317E-3 0.02586 9.1670E+ 6 1.59986E-27.07 0.07563 3.5278E- 3 0.04665 2.9546E+5 1.51826E-27.00 0.15535 3.9517E- 3 0.02544 2.6279E+8 5.21028E-3
C 8.00 0.97062 0.27702 0.28541 7.3761E+2 7.74391E-37.70 0.41075 0.07739 0.18840 1.4209E+2 1.08569E-27.66 0.37028 0.05783 0.15617 2.4338E+3 9.96778E-37.50 0.24607 0.02140 0.08695 1.2643E+4 6.36906E-37.20 0.24098 0.00623 0.02586 9.1669E+6 1.59986E-27.07 0.07563 0.00353 0.04665 2.9556E+5 1.51826E-27.00 0.15535 0.00395 0.02544 2.6268E+8 5.21028E- 36.78 0.54250 0.00376 0.00693 2.1615E14 5.93439E-3
D 8.00 0.9727 0.2767 0.2845 7.580E+2 7.74745E-37.70 0.4102 0.0774 0.1887 1.410E+2 1.08579E-27.66 0.3690 0.0577 0.1563 2.398E+3 9.97073E-37.50 0.2588 0.0216 0.0836 1.698E+4 7.52374E-37.20 0.2443 0.0063 0.0257 1.OOOE+ 7 1.60072E- 27.07 0.0942 0.0036 0.0386 1.230E + 6 1.57487E-27.00 0.1574 0.0040 0.0251 2.884E+8 1.82506E-16.78 15.3800 0.0031 0.0002 3.160E24 2.88337E-2
(A) The parameters obtained from the first iterative cycle, in which the differences among three minimum S are < 10-8. (B) The parameters obtainedfrom the second iterative cycle, in which the differences among three minimum 6 are <10-1°. (C) The parameters obtained from the final cycle inwhich the parameters are changed directly. (D) The parameters obtained from the previous paper by Miller (1985).
Zhou et al. Analytic Solution to the MWG ModelZhou et al. Analytic Solution to the MWC Model 277

This simply means that mathematically the T and Rstates in the MWC model are indistinguishable. Byconvention, it is usually assumed that c = kT/kR < 1.Thus, after obtaining parameters, we choose only the setcorresponding to c < 1. If, for example, cl > 1, then kR =kRl, L = LI, and kT is defined as kT = kR2.
Analysis of data
To deduce the MWC parameters from an experimentalligand binding curve, using the above equations, twoapproaches can be taken. The first is to evaluate thenumerical derivative of the Hill plot as a function oflog [A], and find its maximum value and the value of [A]and v/(n - T) at which this occurs. Eqs. 17-19 can thenbe used directly.
However, a better procedure, which makes full use ofthe experimental data, and also provides a test of theappropriateness of the MWC model, is the following.
First, use numerical drift to find approximate valuesfor nH, [A]O, and (v/(n -v))0. Then, varying theseparameters independently over a narrow range, calculatethe corresponding values for the MWC parameters fromEqs. 17-19, use these to compute binding curves, and seeka best fit.We have applied this method to published data on
oxygen binding by Octopus dofleini hemocyanin at 200C(Miller, 1985). In that study, oxygen binding curves weredetermined at a number of pH values, under conditions inwhich the hemocyanin retained its native structure.' Themeasure of "goodness of fit" employed was
b= (1{log [1/(n - iJ)]e,p - log [i;/(n iDItbcj2)"2/N, (20)
where N is the number of experimental points.Analysis proceded as follows: First we used a 9-points
linear least-square fitting to get the approximate slope ofthe Hill plot so that we could determine the appropriaterange of values of [A]0o nH, and [vP/(n -v)]. We thenfixed [A]o and nH, and allowed [vi/(n - ')]0 to change,calculating L, c, and kR at each value. From these wecalculated log [v/(n - v)] corresponding to each point,and by comparison with the observed values, 6 wasobtained. This was continued until 6 reached a minimum.Then, using this value of [v/(n - i)]b, we fixed it and nH,and changed [A]o until 6 was again minimized. Finally,nH was varied. This cycle was repeated until the differ-ence among the three 63mi, values were <10-8. The cyclewas then repeated until the difference among the three6min values was <10-10. At this point, we expected theparameters to have five significant figures, so kR, c, and Lwere changed independently at the fifth figure until a
'It should be noted that in the Miller (1985) paper, the Hill plots of thebinding data were accidentally printed upside down.
minimum value of 6 was found. The parameters obtainedat each step are shown in Table 1A-C. The parametersobtained by a previous nonlinear least squares fitting(Miller, 1985) are shown in Table ID. The parametersobtained by the new method yield curves in excellentagreement with the experimental data (Fig. 1), and give asomewhat better fit (according to the 6 values) than theprevious analysis.
There is one other check which should be made whenone is analyzing data from a multi-site binding proteinlike hemocyanin. Since the subunit of Octopus hemo-cyanin contains seven oxygen binding sites, we expectedthe allosteric domain to be of this size, and hence used n =
7 in our analyses. Once approximate values for kR and c
3.0
2.0 I
Lx-I'11
asJ
1.0 '
0.0 P
-1.01'
-2.0 I
-3.0 I.
a
4Jca-0.1s
JLxa
X-I
CL
Lx5
l
-I
J
m wo
-2.0 -1.0 0.0 1.0 2.0 3.0 4.0
Log EP021
r I0.2 t b
0.1 F
0.0 I
-0.1 1
-0.2L.-2.0 -1.0 0.0 1.0 2.0 3.0 4.0
Log p023
FIGURE 1 (a) Hill plots of oxygenation of hemocyanin at several pHvalues. The points are experimental, the curves are from the best fit (seeTable IC). All data obtained at 200C, in 0.1 M ionic strength Tris buffercontaining 370 mM NaCl, 45 mM MgCl2, 10 mM K2SO4, and 8 mMCaCl2. pH values are (from left to right) 8.00, 7.70, 7.66, 7.50, 7.20,7.07, 7.00, 6.78. (b) A plot of the difference between experimental valueof log [i/(n -)] and the theoretical value at different log [A] valuesfor various pH conditions. A, pH 8.00; A, 7.00; El, 7.66; *, 7.50; 0, 7.20;*, 7.07; 0, 7.00; *, 6.78.
278 Biophysical Journal Volume 55 February 1989
a
a0 *
0o * *0
278 Biophysical Journal Volume 55 February 1989

have been obtained, the method of Decker et al. (1983)can be employed to test the value of n. According to thismethod, a linear graph of slope (n - 1) should beobtained when log (1 - s/a)/(S/a - c) is plotted versus
log [(1 + ca)/(l + a)], where S = O/(1 - 0) and a =
kR[A]. Here 0 is the fraction saturation, and for 02
binding kR[A] = PO2/P5O,R- Such graphs are shown in Fig.2. Their linearity reaffirms the applicability of the MWCmodel, and the slopes range from 5.3 to 5.9, correspond-ing to n = 6.3-6.9, in good accord with expectation.
It should be noted that this procedure is, to a certaindegree circular, since the value of n was first assumed (ona structural basis) to be 7, and the parameters calculatedfrom this then used in constructing the graphs in Fig. 2.However, the fact that data sets taken over a wide pHrange give in each case a straight line with slope consis-tent with n = 7 we take to be strong evidence that theassumption is correct. Such problems will not be encoun-
tered with most smaller allosteric proteins, where n isusually identifiable with the number of binding sites. Itmay become a serious problem in cases like those found insome arthropod hemocyanins, where the apparent valueof n is not only smaller than the number of subunits, butseemingly changes with conditions. In such cases we
would expect that n would have to be systematicallyvaried in order to obtain good fits to the data, or a more
general nonlinear fitting scheme, with n a floating param-eter, would have to be employed.
4.0
3.0
Ic
2.0O
1.0 U.
15.0
12.0
0l9.0
6.0
3.0
0.0DISCUSSION
This paper provides what is, to our knowledge, the firstanalytic solution for the parameters of the general MWC
4.5
2.5
-
t
N
"-.laN
VI
aa
0.5
-1.5
-2.5 -2.0 -1.5 -1.0 -0.5 0.0
Log (C(14CO / (I+aO)
0.0
-0.5
Y -1.0
0
-1.5
-2.0
-2.5
6.5 7.0 7.5 8.0 8.5
pH
b
6.5 7.0 7.5 8.0 8.5
pH
c
I
6.5 7.0 7.5
pH
8.0 8.5
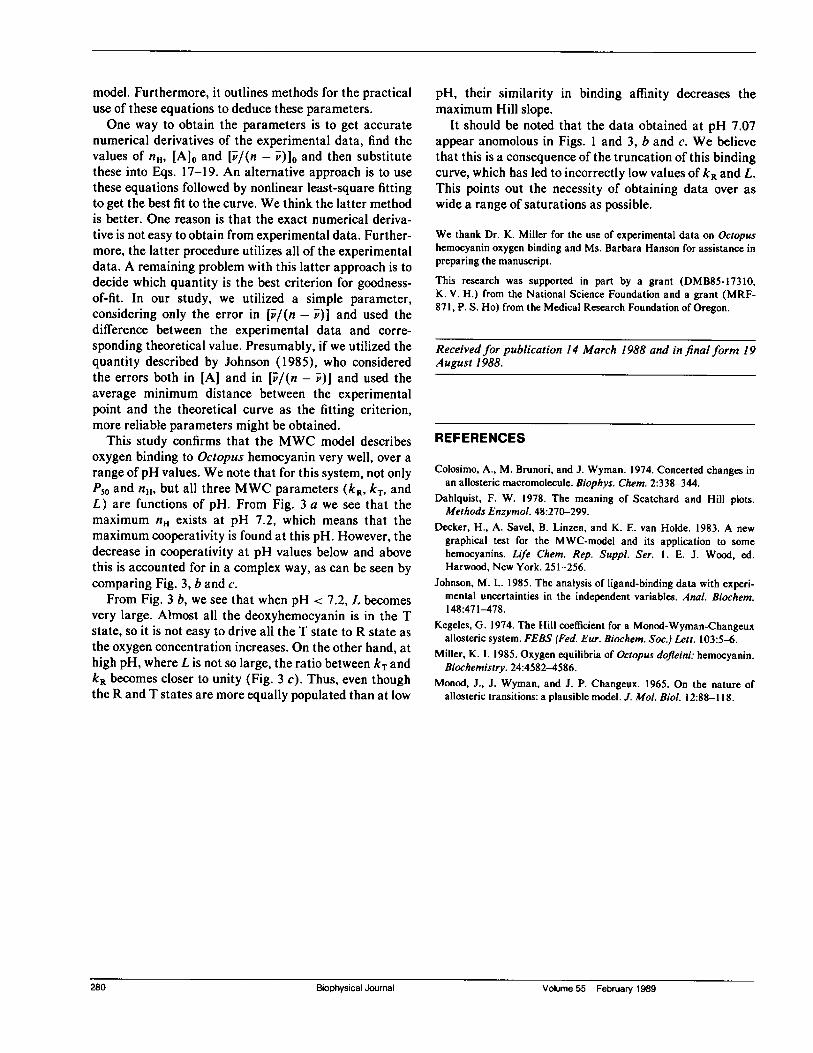
FIGURE 3 (a) The maximum Hill slope as a function of pH; (b)Logarithm of L as a function of pH; (c) Logarithm of kR (-) and kT (A)as a function of pH.
Analytic Solution to the MWC Model 279
.
FIGURE 2 Data plotted according to the methods of Decker et al.(1983). Symbols are as in Fig. 1 b.
.. Ea a a a m
Zhou et al. Analytic Solution to the MWC Model 279
model. Furthermore, it outlines methods for the practicaluse of these equations to deduce these parameters.One way to obtain the parameters is to get accurate
numerical derivatives of the experimental data, find thevalues of nH, [A]0 and [is/(n - v)] and then substitutethese into Eqs. 17-19. An alternative approach is to usethese equations followed by nonlinear least-square fittingto get the best fit to the curve. We think the latter methodis better. One reason is that the exact numerical deriva-tive is not easy to obtain from experimental data. Further-more, the latter procedure utilizes all of the experimentaldata. A remaining problem with this latter approach is todecide which quantity is the best criterion for goodness-of-fit. In our study, we utilized a simple parameter,considering only the error in [v/(n -i)] and used thedifference between the experimental data and corre-sponding theoretical value. Presumably, if we utilized thequantity described by Johnson (1985), who consideredthe errors both in [A] and in [v/(n - i})] and used theaverage minimum distance between the experimentalpoint and the theoretical curve as the fitting criterion,more reliable parameters might be obtained.
This study confirms that the MWC model describesoxygen binding to Octopus hemocyanin very well, over arange of pH values. We note that for this system, not onlyP50 and nH, but all three MWC parameters (kR, kT, andL) are functions of pH. From Fig. 3 a we see that themaximum nH exists at pH 7.2, which means that themaximum cooperativity is found at this pH. However, thedecrease in cooperativity at pH values below and abovethis is accounted for in a complex way, as can be seen bycomparing Fig. 3, b and c.From Fig. 3 b, we see that when pH < 7.2, L becomes
very large. Almost all the deoxyhemocyanin is in the Tstate, so it is not easy to drive all the T state to R state asthe oxygen concentration increases. On the other hand, athigh pH, where L is not so large, the ratio between kT andkR becomes closer to unity (Fig. 3 c). Thus, even thoughthe R and T states are more equally populated than at low
pH, their similarity in binding affinity decreases themaximum Hill slope.
It should be noted that the data obtained at pH 7.07appear anomolous in Figs. 1 and 3, b and c. We believethat this is a consequence of the truncation of this bindingcurve, which has led to incorrectly low values of kR and L.This points out the necessity of obtaining data over aswide a range of saturations as possible.
We thank Dr. K. Miller for the use of experimental data on Octopushemocyanin oxygen binding and Ms. Barbara Hanson for assistance inpreparing the manuscript.
This research was supported in part by a grant (DMB85-17310,K. V. H.) from the National Science Foundation and a grant (MRF-871, P. S. Ho) from the Medical Research Foundation of Oregon.
Received for publication 14 March 1988 and in final form 19August 1988.
REFERENCES
Colosimo, A., M. Brunori, and J. Wyman. 1974. Concerted changes inan allosteric macromolecule. Biophys. Chem. 2:338-344.
Dahlquist, F. W. 1978. The meaning of Scatchard and Hill plots.Methods Enzymol. 48:270-299.
Decker, H., A. Savel, B. Linzen, and K. E. van Holde. 1983. A newgraphical test for the MWC-model and its application to somehemocyanins. Life Chem. Rep. Suppl. Ser. 1. E. J. Wood, ed.Harwood, New York. 251-256.
Johnson, M. L. 1985. The analysis of ligand-binding data with experi-mental uncertainties in the independent variables. Anal. Biochem.148:471-478.
Kegeles, G. 1974. The Hill coefficient for a Monod-Wyman-Changeuxallosteric system. FEBS (Fed. Eur. Biochem. Soc.) Lett. 103:5-6.
Miller, K. I. 1985. Oxygen equilibria of Octopus dofleini: hemocyanin.Biochemistry. 24:4582-4586.
Monod, J., J. Wyman, and J. P. Changeux. 1965. On the nature ofallosteric transitions: a plausible model. J. Mol. Biol. 12:88-118.
280 Biophysical Journal Volume 55 February 1989