an analysis of traffic congestion and policy … · 2020-02-05 · of indicators to measure traffic...
TRANSCRIPT
AN ANALYSIS OF TRAFFIC
CONGESTION AND POLICY
SOLUTIONS FOR CANADIAN
MUNICIPALITIES

[2]
TABLE of CONTENTS
AN ANALYSIS OF TRAFFIC CONGESTION AND POLICY
SOLUTIONS FOR CANADIAN MUNICIPALITIES
FOREWORD ........................................................................................................................................................ 4 Public Sector Digest .................................................................................................................................................................................................................... 4 City of Vancouver ......................................................................................................................................................................................................................... 5 City of Surrey .................................................................................................................................................................................................................................. 6 South Coast British Columbia Transportation Authority (TransLink) .......................................................................................................... 7 INTRODUCTION ................................................................................................................................................ 8
DEFINING CONGESTION ................................................................................................................................ 11 MEASURING CONGESTION ........................................................................................................................... 14 ANALYZING TRAFFIC CONGESTION MEASUREMENT AND MITIGATION FROM THE PERSPECTIVE OF CANADIAN MUNICIPALITIES .................................................................. 16 Research Methodology ............................................................................................................................................................................................................16 Observations ................................................................................................................................................................................................................................. 17 Discussion ....................................................................................................................................................................................................................................... 31
INNOVATIVE SOLUTIONS .............................................................................................................................. 34 HOT Lanes .................................................................................................................................................................................................................................... 34 Road Charge Programs .......................................................................................................................................................................................................... 37 Smart Parking...............................................................................................................................................................................................................................41
APPENDICES .................................................................................................................................................... 46
REFERENCES ................................................................................................................................................... 52

[3]
REPORT AUTHORED BY THE PUBLIC SECTOR DIGEST, INC. Aleks Dzintars, Project Lead & Author Public Sector Digest
Tyler Sutton, Editor & Research Lead Public Sector Digest
This report is a consensus document representing Public Sector Digest’s analysis and interpretation of research conducted for this study. It does not necessarily reflect the views of the organizations referenced.
ACKNOWLEDGMENTS
Public Sector Digest acknowledges the insights provided by the following organizations: City of Brampton City of Burlington City of Burnaby City of Calgary City of Cambridge City of Guelph City of Halifax City of Hamilton City of Kelowna City of Kingston City of Kitchener City of London City of Los Angeles City of Mississauga Town of Oakville City of Oshawa City of Regina
City of Richmond Town of Richmond Hill City of Saskatoon City of Surrey City of Vancouver Metrolinx Middlesex County Ontario Ministry of Transportation Oregon Department of Transportation Region of Durham Region of Niagara Region of Waterloo Region of York Texas Department of Transportation TransLink Washington State Transportation Commission
We also acknowledge the support and contributions of the Public Sector Digest Research Team: Brittany Renken, Kelly Aarts, Deniz Temelli, and John Chiappetta. Public Sector Digest also recognizes the support of our partners:

[4]
Traffic congestion is a nearly ubiquitous challenge for residents of the world’s urban centres. As the great migration to cities continues across the globe, and the prevalence of the automobile as the primary form of transportation for urban residents continues to rise, traffic congestion will only increase in severity.
Canada, with its wide open spaces, is not immune to the challenge of traffic congestion. Our nation is one of the most urbanized in the world, with 82 percent of our population living in urban areas, compared to 53 percent of the world’s population. With less densely populated cities than many other developed nations, and a lack of foresight on the part of past governments to make strategic long-term investments in major public transit projects, reliance on the automobile for transportation is a Canadian standard.
As a result, traffic congestion has become a costly problem for many cities across the country. According to the Toronto Region Board of Trade, the cost of traffic gridlock to Toronto’s regional economy is valued at more than $6 billion per year. The additional costs of traffic congestion to the health and well-being of commuters is well-reported by any Canadian that spends several hours per week, or even per day, travelling to and from work.
Most would agree that traffic congestion is a problem for our cities. What’s far less certain is how severe the problem is, how the nature of the problem differs across communities, and what solutions are most effective in ameliorating the problem. One reason for the lack of clarity is the absence of a standardized way to measure traffic congestion and the effectiveness of various policy solutions. Canada’s largest municipalities have independently developed their own definitions of traffic congestion, sets of indicators to measure traffic congestion, and processes to capture data and report on those indicators. With such variance in the way traffic congestion is understood and measured across Canada’s cities, there is little hope that municipalities could work collaboratively to ascertain best practices in addressing traffic gridlock.
This PSD applied research study serves as one small step towards a better understanding of traffic congestion as it is experienced in different communities across Canada. In partnership with the City of Vancouver, the City of Surrey, and TransLink, PSD has dug into the literature and engaged municipal experts from coast to coast to determine how Canada’s largest cities are measuring traffic congestion and what innovative solutions they are exploring in response to the challenge.
The results are compelling. The trends in traffic congestion management across Canada’s urban centres indicate that although much work needs to be done in better defining and measuring traffic congestion, many communities are making headway in their planning. In order to garner buy-in for an innovative solution to any urban challenge, municipal staff must have a proper plan in place, supported by valid data and if possible, case studies. Luckily there are trailblazers who have taken the initiative to test new solutions to our most wicked problems. This study captures a few of the more promising solutions to traffic congestion, as tested by municipal leaders across North America.
We look forward to continuing the conversation with our partners and the broader municipal sector to help identify emerging best practices in the measurement and amelioration of traffic congestion. It is evident from this study that traffic congestion is not a challenge that we can eradicate from our communities any day soon, but rather something that we can learn to better control instead of allowing it to control us. Technological advancement is the great unknown factor that could solve many of our urban dilemmas in the future. Until then, thorough planning, analysis, and the sharing of best practices will have to do.
Tyler Sutton, Editor & Research Lead
Public Sector Digest

[5]
Traffic congestion is an issue that is top of mind for cities around the world and it is a challenge that is not easy to manage. Very few cities have implemented effective solutions for congestion problems. This may be the case because there is no concrete agreement on what the definition of congestion is. In simplistic terms, ‘congestion’ relates to the impacts of motor vehicle traffic and the increase in the number of vehicles on a roadway to a point that causes decreased speeds, longer travel times and vehicle queues. This definition may fit well in a freeway environment when speeds and queuing are top indicators of congestion. Alternatively, in an urban setting with an increasing number of traffic signals, pedestrians and cyclists crossing the street as well as additional turning and parking maneuvers, vehicle volume and speed are much less linked to congestion.
In the City of Vancouver, vehicle volumes in the core area of our road network have dropped by more than 15% over the last 15 years. Still, congestion is likely more top of mind now for Vancouverites than it was 15 years ago. The primary reason for this is the increase in activity that happens as a city grows. Since 2000, the City of Vancouver has grown by nearly 100,000 people and the downtown core saw an increase of over 5.5M sq ft of office space. Over this time period, more than 230 new traffic signals were added to the network with 70% of these specifically designed to facilitate the movement of pedestrians and cyclists. The lower vehicle volumes mean that there are significantly more people moving around on our transit system, on foot and by bike. Although fewer in number, anyone travelling by motor vehicle will see slower travel times than they did 15 years ago.
In an urban setting, defining roadway congestion is linked more closely to the experience of the road user. Pedestrians and cyclists are less affected by it as these networks are not yet at a point where their travel is slowed by volume. With that in mind, this still brings us to the largest segment of the travelling public. In Vancouver today, 50% of people get around by driving. Currently this is the largest travel mode but looking forward, we see this percentage dropping as more options for people to move around become more viable. By 2040, we expect that there will be equal numbers of people moving around our city by active modes, transit and motor vehicle due to investments targeted at walking, cycling and transit. Between 2015 and 2016, for example, the City expanded the cycling network and now has a total of 305 kilometers, with 75 kilometers designated for riders of all ages and abilities. Additionally, significant planning is underway to deliver the Millennium Line Broadway Extension. As we move closer to this outlook, slow moving traffic can be desirable in an urban setting. Slower moving vehicles reduce the risk of a serious injury or fatality in the event of a collision between a motor vehicle and a pedestrian or cyclist. However, we need to also be mindful of how slower moving traffic affects goods movement and transit travel times. Interventions targeted at these areas could help to reduce that impact.
In addition, a motorist’s perception of congestion in an urban environment may have nothing to do with speed, but rather consistency, reliability and the number of signal cycles that one has to wait for in order to get through an intersection. Finding ways to improve efficiency and safety on our road networks is getting more and more important as our city grows.
This study is important as it brings together the thoughts of various cities and transportation agencies across Canada to help come to a common definition of congestion for an urban environment. It will also create a consolidated source to explore what cities are doing to address congestion. This is only the beginning - sharing knowledge and strategies will be crucial as we move into the future.
Lon LaClaire, Director of Transportation
City of Vancouver

[6]
The City of Surrey is one of the fastest growing municipalities in Canada, which brings challenges to upgrading infrastructure to meet growing demand. Like any city of its size, congestion is not uncommon on certain high volume arterial road segments and signalized intersections during the typical morning and evening peak hours. There is a public perception of congestion during these times and as the City has grown residents are more frequently demanding time savings, predictability and convenience in their trips.
To address some of these concerns and establish a base for monitoring and improving traffic operations on our roads, the City of Surrey commissioned a Traffic Management Centre (TMC). Traffic personnel monitor hundreds of CCTV cameras on a daily basis to identify, among other things, congested road segments and intersections. Along our highest volume arterial corridors, the traffic signals operate in a coordinated mode throughout peak periods to maximize efficient throughput. Whether for regular updates of coordination plans or addressing unexpected incidents or collisions, staff members are capable of remotely modifying signal timing plans from the TMC in real time. At many of our most congested intersections we have exhausted the effects of traditional traffic signal optimization and road widening, therefore requiring additional measures to further improve traffic flow.
We are currently prioritizing more funds for infrastructure dedicated to non-automobile movement across the City to promote the use of other modes of travel by our residents. This includes the proposed Light Rail Transit System, bus queue jumping lanes and cycle tracks along some of our busiest arterials.
In a number of cases we are using technology to improve mobility and reduce congestion. We have implemented adaptive traffic control systems on a city corridor that automatically and continuously adjusts signal timing based on real-time demand. Next year, we will be deploying a Travel Time Information System that monitors vehicle travel times along several major corridors and displays this information on Dynamic Message Signs at strategic locations to provide relevant on-route information to the public. We also utilize computer applications like Twitter and Google Street view within the TMC to monitor and advise traffic conditions and alerts. The City is also posting information regarding road construction and closures on our website in advance to allow drivers to plan for potential delays.
Surrey’s goal from this study is to define congestion levels consistently across metro Vancouver so that cities and the public have a common understanding and perception of congestion.
Amer Afridi, Traffic Signal Team Leader
City of Surrey
[7]
Whether you are being passed up by an overcrowded bus or train or stuck in a traffic jam, congestion is a costly, frustrating and growing problem in Metro Vancouver as in most rapidly growing urban regions in North America. In previous generations, some planners might have adhered to the notion that “congestion is our friend” in reference to the fact that slower and less reliable driving conditions will make walking, cycling, and transit more attractive. This is certainly true. However, congestion is a blunt instrument that also slows down high-value couriers and commercial goods, emergency vehicles, and people on their way to urgent appointments. It also leads to weaker social and economic connections as people forego trips that they otherwise would have made – stifling the key benefits of living in a city: learning face-to-face, finding better jobs, and sharing services and infrastructure. In the 21st Century, Canadian cities can do better than to settle for perpetual gridlock. We know, mind you, that building more roads will only make the problem worse. True, at first the extra lanes or new highway does reduce congestion and shorten travel times. But reducing the “cost” of driving in this way only stimulates more demand and, very soon, more people are making more trips and travelling further – leading again to clogged up roads. It’s like trying to lose weight by loosening your belt. Even substantial new investment in transit can’t solve the congestion problem on its own. To tackle congestion and to make sure that any new road capacity isn’t soon gobbled up by traffic jams, there is only one tool that has a proven track record: pricing. By pricing roads and transit so that users pay less to travel on less busy routes and during less busy times of day, drivers and transit riders who have more flexibility can change when or where they decide to travel and free up valuable space for those who have no option but to travel at that time or on that route. The Mayor’s Council on Regional Transportation for Metro Vancouver adopted a 10-Year Vision last year that, if implemented, would see a 20% reduction in congestion in 30 years compared to a do-nothing scenario. Along with major new investments in walking, cycling and transit, a more comprehensive and coordinated approach to pricing usage of the region’s road system is the key ingredient to these dramatic gains. Access to ‘good data’ is also critical to conducting solid analyses of traffic congestion, and this renewed interest in congestion comes during a revolution of ‘Big Data Analytics’. Many new data sources provide the opportunity to analyse congestion across space and time with unprecedented granularity in a cost-efficient manner. But these data sources and their methods are still in their infancy, and they require careful investigation and validation prior to drawing any conclusions. To this end, TransLink is leading the charge by undertaking a Congestion Measurement Study. Once complete, it should facilitate regular reporting and a better understanding of congestion across space and time. Such reporting can also be used to evaluate the success of policy measures that aim to manage congestion. We’re happy to support this Public Sector Digest special report on congestion policy solutions for Canadian municipalities. And we’re especially happy to see the emphasis on pricing as the best tool to allocate scarce resources everywhere in the economy – including on our roadways.
Andrew McCurran, A/Director, Strategic Planning & Policy
TransLink

[8]
Introduction
Scholar D.J. Reynolds once wrote that “congestion has become an almost universal phenomenon in the
cities of the advanced world and few cities have escaped the problem and even fewer, if any, have as
yet solved it.”1 His work, titled “Congestion,” from which this excerpt is drawn, was written in 1963.
Little has changed since then. If anything, congestion has become even more of a universal
phenomenon, and has only increased in size, scope and complexity.
As per Collins Dictionary, (traffic) congestion is defined as “the state of being overcrowded, especially
with traffic or people.”2 These two factors, traffic and people, have increased exponentially since the
time of Reynolds’ writing, especially within a concentrated area, leading to an exacerbation of the
congestion challenge. In 1960, around the time of Reynolds’ published work, most of the world’s
population was situated in a rural setting; the urban population accounted for just 34 percent. By 2014,
that number had risen to 54 percent.3 The emergence of the automobile, meanwhile, has grown in
1 D.J. Reynolds. “Congestion,” The Journal of Industrial Economics 11:2 (1963): 132. 2 “Definition of congestion,” Collins Dictionary, accessed August 2016. http://www.collinsdictionary.com/dictionary/english/congestion 3 Global Health Observatory Data,” World Health Organization, accessed August 2016. http://www.who.int/gho/urban_health/situation_trends/urban_population_growth_text/en/

[9]
lockstep with the growth of the urban population. Since 1990, global car sales have risen by nearly 90
percent – a jump from 39 million cars sold in 1990 to 74 million in 2016.4
In 1963, congestion was just coming into the fore as a policy concern. In 2016, the continuing increase in
the number of automobiles, combined with the concentration of urban populations, has made
congestion a pre-eminent focus of many communities worldwide. In Ontario, commute times increased
by roughly 12 percent on average from 1994 to 2010.5 Across the country, a 2005 Statistics Canada
study found that Canadians, on average, spent 63 minutes each day commuting. This represents a rise
from 54 minutes in 1992, and 59 minutes in 1998.6 More recent data shows that the average Canadian
commuter spent 79 total hours in traffic in 2014, representing a two-percent increase from the year
before.7 South of the Canadian border, the United States is witnessing a similar rise in commuting
difficulties. According to a report from the Texas Transportation Institute, an affiliate of Texas A&M
University, Americans spent a total of 6.9 billion hours in traffic in 2014, up from 6.4 billion hours in
2010.8 Moreover, the U.S. Department of Transportation Federal Highway Administration has found that
congestion has risen in cities of all sizes in the United States since 1982, using a time travel index to
measure peak period congestion.9
Similar trends are found worldwide. TomTom, a GPS company, has found that global traffic congestion
has risen by 13 percent since 2008. They report that for 2016, the five most congested cities in the world
represent nearly every continent: Mexico City drivers face the longest average extra travel times in the
world, followed, in order, by Bangkok, Istanbul, Rio de Janeiro, and Moscow.10 In China, TomTom has
found that all cities have shown an increase in congestion between 1 percent and 5 percent.11 Other
data shows that in Europe, traffic congestion has risen less than in other regions, but has risen sharply in
4 “Number of cars sold worldwide from 1990 to 2016 (in million units),” Statista, http://www.statista.com/statistics/200002/international-car-sales-since-1990/ 5 Tess Kalinowski. “Toronto area commutes add to time crunch, study shows,” Toronto Star, last modified April 28 2014. https://www.thestar.com/news/gta/2014/04/28/toronto_area_commutes_add_to_time_crunch_study_shows.html 6 “Commuters spending more time in transit: Statistics Canada,” CBC News, last modified July 12 2006. http://www.cbc.ca/news/canada/commuters-spending-more-time-in-transit-statistics-canada-1.583900 7 “Canadians lose more hours in traffic: Report,” The Canadian Press, last modified March 31 2015. http://www.moneysense.ca/spend/real-estate/canadians-lose-more-hours-in-traffic-report/ 8 Joe Pinsker. “Yes, Rush-Hour Traffic Is Getting Worse,” The Atlantic, last modified August 26 2015. http://www.theatlantic.com/business/archive/2015/08/rush-hour-traffic-commute/402418/ 9 “Traffic Congestion and Reliability,” US Department of Transportation - Federal Highway Administration, Office of Operations, accessed August 2016. http://www.ops.fhwa.dot.gov/congestion_report_04/executive_summary.htm 10 “Report says Mexico City is now the most traffic congested city in the world,” UKIP Media and Events Ltd., last modified March 30 2016. http://www.traffictechnologytoday.com/news.php?NewsID=78555 11 Ibid.

[10]
certain areas.12 In the United Kingdom, people have purchased more automobiles and traveled more
than ever before: total vehicle kilometers increased from approximately 50 billion in 1950 to nearly 500
billion in 2005,13 representing a ten-fold increase. In comparison, the UK population has only increased
from approximately 50 million to 60 million over that same span.14 In London, although overall car traffic
is decreasing per an Inrix London Congestion Trends Report, travel times have increased annually each
year from 2012 to 2015.15 Congestion, as can be seen, is a global challenge that has only continued to
escalate in severity and importance since the 1960s.
The following report will explore the problem of congestion and will demonstrate how Canadian
communities specifically identify, measure, and act in response to the congestion challenge. The first
section of the report will attempt to define congestion using a literary scan of definitions that have been
published by various traffic organizations. The second section will explain how congestion is measured,
and how those measurements are dependent on the environment. In the third section, findings will be
presented from our traffic congestion survey completed by 29 municipalities and organizations across
Canada. The future implications of these findings for Canada’s communities will then be explored. Lastly,
we will showcase innovative solutions that leading North American communities are implementing in
order to address the congestion challenge.
Mexico City drivers face the longest average travel times in the world (TomTom 2016) Photo: Carlos Van Vegas
12 “TomTom Traffic Index 2016 – The Results are in! Mexico City Takes Crown of ‘Most Traffic Congested City’ in World from Istanbul,” TomTom International BV, last modified March 22 2016. http://corporate.tomtom.com/releasedetail.cfm?ReleaseID=961546 13 “Transport Statistics Bulletin – Road Statistics 2008: Traffic, Speeds and Congestion,” UKRoadsLtd., accessed August 2016. http://www.ukroads.org/ukroadsignals/articlespapers/roadstats08tsc.pdf 14 “UK Population,” Worldometers, accessed November 2016. 15 “London: Why Car Traffic is Down, but Congestion is Up,” INRIX, Inc., accessed August 2016. http://inrix.com/londoncongestion/
[11]
Defining Congestion
To begin addressing the phenomenon of congestion, the problem needs to be defined. Note that the
examples and statistics mentioned in the preceding section measure congestion differently. From time
spent in traffic, to total cars being purchased and driven, each metric describes a different aspect of
congestion. As a result, there is no obvious single definition. Rather, there are two main sub-definitions
– as agreed upon by multiple traffic and municipal organizations – that address different dimensions of
the term ‘congestion.’
These organizations have identified that not only is traffic congestion an inherently challenging issue to
define,16 but that it has more than one dimension. The State of Victoria’s Auditor-General’s Office in
Australia,17 and the UK Federal Government Department for Transport18 each identify congestion as a
term that has two specific aspects: a physical and a relative one. The Joint Transport Research Centre
(JTRC), made up of 50 members from the Organisation for Economic Co-operation and Development
(OECD) and the European Conference of Ministers of Transport (ECMT), echoes a similar stance,
summarizing this duality concisely in its Managing Urban Traffic Congestion Summary Document:
There is no single, broadly accepted definition of traffic congestion. One of the principle reasons for this lack of consensus is that congestion is both: a physical phenomenon relating to the manner in which vehicles impede each other’s’ progression as demand for limited road space approaches full capacity and; a relative phenomenon relating to user expectations about road system performance. Both operational and user perspectives are important in understanding congestion and its impacts.19
The physical nature of congestion, as defined by the limits of traffic on a given roadway, is referenced by
many organizations. The United Kingdom Federal Government Department for Transport has written
that “at its simplest, [traffic congestion] can be explained in physical terms as the way in which vehicles
16 “An introduction to the Department for Transport’s road congestion statistics,” United Kingdom Department for Transport, last modified August 25 2016. https://www.gov.uk/government/uploads/system/uploads/attachment_data/file/527880/an-introduction-to-dft-congestion-statistics.pdf 17 “Managing Traffic Congestion,” Victorian Auditor-General’s Office, last modified April 2013. http://www.audit.vic.gov.au/publications/20130417-Managing-Traffic-Congestion/20130417-Managing-Traffic-Congestion.html 18 “Department for Transport’s road congestion statistics.” 19 “Managing Urban Traffic Congestion,” Transport Research Centre, European Conference of Ministers of Transport, last modified 2007. http://www.transportstrategygroup.com/persistent/catalogue_files/products/07CongestionSummary.pdf

[12]
interact to impede each other’s’ progress.”20 Other organizations specifically address the physical
limitations of roadways as the number of vehicles increase when defining congestion. The U.S.
Department of Transportation Federal Highway Administration offers that: “In the transportation realm,
congestion usually relates to an excess of vehicles on a portion of roadway at a particular time resulting
in speeds that are slower – sometimes much slower – than normal or “free flow” speeds.”21 The Victoria
Transport Policy Institute (VTPI) based in Victoria, BC reinforces this concept: “traffic congestion refers
to the incremental delay caused by interactions among vehicles on a roadway, particularly as traffic
volumes approach a roadway’s capacity.”22
20 “Department for Transport’s road congestion statistics.” 21 “Traffic Congestion and Reliability: Trends and Advanced Strategies for Congestion Mitigation,” US Department of Transportation - Federal Highway Administration, Office of Operations, accessed August 2016. http://www.ops.fhwa.dot.gov/congestion_report/chapter2.htm 22 Todd Litman. “Smart Congestion Relief: Comprehensive Evaluation of Traffic Congestion Costs and Congestion Reduction Strategies,” Victoria Transport Policy Institute, last modified September 15 2016. http://www.vtpi.org/cong_relief.pdf
DEFINING CONGESTION
Physical “The state of being overcrowded, especially with traffic or people.”
Collins Dictionary
“The way in which vehicles interact to impede each other’s’ progress”
UK Federal Government Department of Transportation
“A physical phenomenon relating to the manner in which vehicles impede each other’s’ progression as demand for limited road space approaches full capacity.”
Joint Transport Research Centre
“An excess of vehicles on a portion of roadway at a particular time resulting in speeds that are slower…than normal or ‘free flow’ speeds.”
US Department of Transportation Federal Highway Administration
“The incremental delay caused by interactions among vehicles on a roadway, particularly as traffic volumes approach a roadway’s capacity.”
Victoria Transport Policy Institute
Relative “The difference between users’ expectations of the road network and how it actually performs.”
UK Federal Government Department of Transportation
“Difference between the roadway system performance that users expect and how the system actually performs.”
Joint Transport Research Centre
“The level at which transportation system performance is no longer acceptable due to traffic interference.”
Southwestern Pennsylvania Commission (US)

[13]
The other aspect that is cited among traffic organizations when defining congestion is that it is a relative
phenomenon. The Joint Transport Research Centre23 and UK Federal Government Department for
Transport24 both emphasize the difference between users’ expectations of the road system and how it
actually performs is indicative of congestion. The Southwestern Pennsylvania Commission (SPC)
personalizes this aspect, defining traffic congestion as “the level at which transportation system
performance is no longer acceptable due to traffic interference (emphasis added).”25 The argument here
is that congestion cannot exist in purely physical terms; the vehicle user’s experience defines congestion
as a problem if he or she deems it to be so. If there is a delay in traffic, it is the driver who remarks that
congestion is a problem. Taken together, traffic congestion, as a definition, takes into account both how
marginal increases in vehicle numbers on roadways impact each other, and how drivers of those
vehicles perceive to be affected.
23 “Managing Urban Traffic Congestion.” 24 “Department for Transport’s road congestion statistics.” 25 “Transportation Operations & Safety,” Southwestern Pennsylvania Commission, accessed August 2016. http://www.spcregion.org/trans_ops_cong.shtml

[14]
Measuring Congestion
The first step to address congestion in any given community is to define the problem. The next step is to
assess and measure its impact. Before this is possible, one must consider the vast differences in types of
congestion such as rural, urban, bridge, arterial, etc. Congestion is, after all, not only a measure relative
to vehicle user expectations, but also relative to the environment and location of the user. The reason
for differentiating between types of congestion based on location is because it allows us to measure
congestion more effectively. Should such a differentiation not be made, average traffic flow
measurements would point to a skewed mean, and traffic alleviation measures would not have the
intended effects. The National Cooperative Highway Research Program highlights the importance of
emphasizing location when measuring congestion:
A measure designed to assess performance at an individual location may not be suited to assess congestion along a route or within an area…It is essential, therefore, that performance measures be consistent with the goals and objectives of the process in which they are being employed.
The same argument is taken one step further by Todd Litman of the VTPI who argues that congestion
reduction strategies may be “ineffective and harmful” if used in the improper scenario. He invokes the
following example to illustrate his point:
Compact, multi-modal cities such as New York, Boston, and Philadelphia tend to have more intense congestion (greater peak-period speed reductions), but lower congestion costs (fewer annual hours of delay per capita) due to lower auto mode shares and shorter trip distances, which reduces congestion exposure (the amount residents must drive during peak periods).
Different traffic congestion measurements are more applicable to different scenarios. The location and
scope of the congestion activity must therefore be derived before measuring congestion.
Once the geographic focus is determined, there are numerous methods and measurements for
measuring impeded traffic flows. The most comprehensive list of common congestion indicators can be
found in Todd Litman’s Transportation Cost and Benefit Analysis II – Congestion Costs published in 2009.
An updated table from 2016 can be found below:

[15]
Source: Smart Congestion Relief (Litman, 2016)
The emphasis here is not to evaluate the validity of each measurement. Rather, it is to show that there
is a multitude of indicators and measurements available to analyze congestion. Some indicators
measure congestion intensity, some measure travel time, others measure fuel consumption statistics
and multi-modal delays across a wider transportation network. As can be derived, there is no one
congestion measurement that comprehensively addresses every challenge. For some communities,
there will inevitably be more focus on urban-related measurements such as average traffic speed during
intense peak periods. Conversely, more rural or less-compact communities may, for example, hone their
efforts on indicators relating to commute duration. Each indicator may be of some value to any given
community, some may be more applicable than others. As will be demonstrated in the following
sections, how congestion is measured varies widely across Canada.
COMMON INDICATORS TO MEASURE CONGESTION
Indicator Description Comprehensive? Multi-Modal?
Roadway LOS Congestion intensity at a particular location No No
Multi-modal LOS Congestion delays to various modes, rated A to F No Yes
Travel time index Ratio of peak period to free-flow speeds No No
Average Traffic Speed Average vehicle traffic speeds at a particular location
No Yes if for all modes
Commute Duration Average time per commute trip No Yes if for all modes
Per capita travel time Total average time residents devote to travel Yes if for all modes
Yes if for all modes
Percent travel time in congested conditions
Portion of peak-period vehicle congestion that occurs under congested conditions
No Yes if for all modes
Congestion duration Average duration of congested conditions No No
Congested Lane Miles Number of lane-miles congested during peak periods
No No
Annual hours of delay Hours of extra travel time due to congestion Yes if for all modes
Yes if for all modes
Annual delay per capita Hours of extra travel time divided by area population
Yes if for all modes
Yes if for all modes
Excess fuel consumption Total additional fuel consumption due to congestion
No No
Congestion cost per capita
Hours of delay times monetized value of travel time, plus additional fuel costs, divided by area population
Yes Yes if for all modes
Planning Time Index Earlier departure required when traveling during peak periods
No No
Barrier effect Walking and cycling delay caused by wider roads No No

[16]
It is important to note that Mr. Litman’s table above is not an exhaustive list. There are many other,
perhaps less common, congestion indicators. For example, congestion cost per capita only takes into
account monetized delay times and fuel costs. There are other studies that have explored total cost with
reference to social and other environmental costs. Benjamin Dachis of the C.D. Howe Institute has found
that when congestion “stifles” the key benefits of living in a city like Vancouver, such as meeting
individuals face to face, there is a cost attached: “On top of the cost of congestion due to slower travel,
these wider, hidden costs of congestion are between $500 million and $1.2 billion per year for the
Metro Vancouver area.”26 Metrolinx, a regional transportation arm of the Province of Ontario,
undertook a congestion study in 2007, uncovering that the annual excess cost of congestion totaled $3.3
billion in the Greater Toronto and Hamilton Area (GTHA) in 2006. Of these total costs, vehicle emissions
accounted for $29,000,000, in addition to time, accident, and vehicle operating costs.27 The point of
emphasis here is that there are numerous ways of measuring congestion, although some may be more
applicable to certain scenarios than others.
Analyzing Traffic Congestion Measurement and Mitigation from
the Perspective of Canadian Municipalities
Research Methodology
In this study, we attempt to capture the challenge of congestion in communities across Canada through
both a comprehensive survey and in qualitative interviews. In all, 26 Canadian municipalities with a
population over 100,000 inhabitants were surveyed in addition to three regional transportation bodies:
The Ontario Ministry of Transportation, Metrolinx, and TransLink. The minimum population size of
100,000 was selected as a cut-off for the survey on the assumption that congestion is more prevalent in
municipalities with a larger population.
The 26 municipal respondents are located in the following provinces:
Ontario: 17 respondents
26 Benjamin Dachis. “Tackling Traffic: The Economic Cost of Congestion in Metro Vancouver,” C.D. Howe Institute, last modified March 9 2015. https://www.cdhowe.org/sites/default/files/attachments/research_papers/mixed/e-brief_206.pdf 27 “Costs of Road Congestion in the Greater Toronto and Hamilton Area: Impact and Cost Benefit Analysis of the Metrolinx Draft Regional Transportation Plan,” Greater Toronto Transportation Authority, accessed August 2016. http://www.metrolinx.com/en/regionalplanning/costsofcongestion/ISP_08-015_Cost_of_Congestion_report_1128081.pdf

[17]
British Columbia: 5 respondents
Saskatchewan: 2 respondents
Alberta: 1 respondent
Nova Scotia: 1 respondent
The medium SurveyMonkey was used to craft the survey and a hyperlink was sent to each respondent.28
The survey is comprised of ten questions: four are closed question and 6 are open-ended. The complete
list of the survey questions and responses can be found in Appendix I.
Observations
Four closed questions were asked of survey respondents. Three of the four are listed below:
Is congestion a problem in your community?
Does your community measure traffic congestion?
Does your community have a plan for reduction?
28 Each survey completion was submitted by one respondent, primarily from either the municipality’s transportation or engineering departments. In several cases, survey responses were completed by multiple people from multiple departments, reflecting the cross-sectional nature of the congestion problem.

[18]
0
5
10
15
20
25
Yes No N/A
Nu
mb
er o
f R
esp
on
den
tsFigure 1: Is congestion a problem in your community?
0
2
4
6
8
10
12
14
16
18
20
Yes No
Nu
mb
er o
f R
esp
on
den
ts
Figure 2: Does your community measure traffic congestion?

[19]
We found that a large percentage (76%) of respondents felt that congestion is a challenge within their
community (see Figure 1). This validates our methodological assumptions that communities over
100,000 inhabitants will be more likely to perceive congestion as a challenge. A smaller percentage of
respondents (66%) say that they are active in measuring congestion in their respective communities (see
Figure 2). Interestingly, the same number of respondents (14) indicated that they have a plan for
reducing congestions as those that indicated that they do not have a plan (see Figure 3).
The fourth closed question posed to respondents focused on two aspects of congestion reduction: what
types of congestion reduction measures have been implemented in their communities, and to what
degree have the measures been implemented. For this survey, 12 of the most common measures for
reducing traffic congestion in Western communities, as identified through the literature review, were
presented to respondents. Of these 12 measures, we asked each respondent to identify the degree of
0
2
4
6
8
10
12
14
16
Yes No N/A
Nu
mb
er o
f R
esp
on
den
tsFigure 3: Does your community have a plan for congestion
reduction?
AN EXAMPLE WHERE CONGESTION IS MEASURED, BUT IS NOT CONSIDERED A PROBLEM: “From the indicators point of view, you have to know about being able to manage what you measure. If you measure congestion, you’ll know where your problem spots are.”
- Geoffrey Keyworth, Senior Transportation Planning Engineer, Region of Waterloo

[20]
implementation for each along a chronological scale, ranging from “Initiative has not been considered”
to “Initiative has been used successfully/unsuccessfully.” Figure 4 shows the number of the surveyed
communities by degree of implementation for each traffic congestion reduction measure.
These findings were then condensed to illustrate more clearly whether or not these measures have
been implemented. To do this, the six listed degrees of implementation (have not considered this
initiative; initiative is being discussed; initiative is being implemented as a pilot; initiative is currently in
use; initiative has been used successfully; initiative has been used unsuccessfully) were separated into
two categories: 1) initiative has been implemented and; 2) initiative has not been implemented. Of the
six degrees, two (‘have not considered this initiative;’ and ‘initiative is being discussed’) were grouped
into the ‘initiative has not been implemented’ category, while the other four degrees of implementation
were grouped into the ‘initiative has been implemented’ category. Essentially, if the initiative is still
0
5
10
15
20
25
30
35
40
HOV/HOTlanes
Expansion tonew public
transit routes
Increasingfrequency of
service onexisting
transit routes
Upgradingpublic transit
to a rapidtransit system
Bike facilityexpansion
Roadwayexpansion
Pricingmechanisms
Intelligentsystems
(signal re-timing,
alternativeroutes fortravelers,
etc.)
Incident andevent
response
Constructioncoordination
Smart parking Urbanplanning/land
use
NU
MB
ER O
F R
ESP
ON
DEN
TS
Figure 4: What measures have you implemented to address your congestion challenges?
Have not considered this initiative Initiative is being discussed Initiative is being implemented as a pilot
Initiative is currently in use Initiative has been used successfully Initiative has been used unsuccessfully

[21]
being discussed, while having been considered, it has not been implemented in practice. Conversely, an
initiative that is being tested as a pilot is still being implemented, albeit it in a crude and rudimentary
way.
CATEGORIES FOR DEGREE OF IMPLEMENTATION
Initiative has not been implemented
Initiative has been implemented
Have not considered this initiative
Initiative is being discussed
Initiative is being implemented as a pilot
Initiative is currently in use
Initiative has been used successfully
Initiative has been used unsuccessfully
0
5
10
15
20
25
30
HOV/HOTlanes
Expansion tonew public
transit routes
Increasingfrequency of
service onexisting
transit routes
Upgradingpublic transit
to a rapidtransitsystem
Bike facilityexpansion
Roadwayexpansion
Pricingmechanisms
Intelligentsystems
(signal re-timing,
alternativeroutes fortravelers,
etc.)
Incident andevent
response
Constructioncoordination
Smart parking Urbanplanning/land
use
Nu
mb
er o
f R
esp
on
den
ts
Figure 5: What measures have you implemented to address your congestion challenges?
Implemented Not Implemented

[22]
The most commonly implemented measures for reducing congestion among the respondents were bike
facility expansions and installation of intelligent systems, while some of the least commonly
implemented strategies included smart parking techniques and other pricing measures.
From Figures 4 and 5, we can derive a few observable trends. Both graphs depict that pricing-related
strategies such as pricing measures, smart parking and high-occupancy vehicle/high-occupancy toll
(HOV/HOT) lanes were found to be less commonly implemented than other strategies for congestion
reduction. Conversely, according to both figures, measures that appeared to be less pricing-related were
most-widely implemented. In Figure 4, we can also see that while a few communities reported to have
installed pricing-related measures, even fewer (four respondents) reported that they had either been
used successfully or unsuccessfully. This suggests that perhaps enough time hasn’t passed to effectively
measure their efficacy.
Data from Figure 5 was combined with data from the 2011 Census to determine if there is a correlation
between municipal population size and the number of congestion reduction measures implemented,
and between municipal population density and number of measures implemented. The total number of
congestion reduction measures implemented was calculated – combining ‘implemented as a pilot’, ‘in
use’, and ‘used un/successfully’ responses – per measure per respondent. Figures 6 and 7 demonstrate
A NOTE ON INTELLIGENT SYSTEMS Intelligent system implementation is a broad category that can refer to a variety of ways that municipalities use automated or intelligent controls to guide traffic flow. This can encompass the use of traffic signals as well as dynamic message boards that allow travelers to plan alternate routes. Some found the use of these systems to be more useful than others. Traffic Signal Team Leader Amer Afridi at the City of Surrey describes Surrey’s Traffic Management Centre as a boon for traffic flow: “It [does definitely] help [in] reducing congestion…We look at the traffic platoons through…cameras [and consequently] make adjustments to the signal timing sequence.” Others find intelligent systems focusing on dynamic message boards to be less valuable. Steve Brown, Manager of Traffic and Data Management at the City of Vancouver, points to the abilities of everyday citizens: “In an urban setting with a grid network, we have found it best to allow people to find their best route…If we start directing them in one way, then you can pretty easily overwhelm another route. So that’s why we don’t really use dynamic message boards that measure volume and tell people to go in a certain direction. If we have a detour required, we won’t tell them the specific route to take because there’s usually about 3-4 options or more that [people] can take. So if you give one, you’re overloading that one. If you just let them find their way, they spread out a lot more.”

[23]
the intersections between total measures implemented and population size, and total measures
implemented and population density respectively. Each dot represents a single respondent.
Figures 6 and 7 depict similar correlations. Figure 6 shows that there is a positive correlation between
the size of a municipality and the number of measures implemented, while Figure 7 shows a positive
correlation between population density (number of individuals per square kilometre) and number of
measures implemented. In other words, we observe that as both population size and/or population
density increases, communities are more likely to introduce a wider number of congestion reduction
measures.
0
200,000
400,000
600,000
800,000
1,000,000
1,200,000
0 2 4 6 8 10 12 14
Figure 6: Number of Congestion Reduction Measures Implemented and Total Municipal Population
0
1000
2000
3000
4000
5000
6000
0 2 4 6 8 10 12 14
Figure 7: Number of Measures Implemented and Municipal Population Density

[24]
Respondents that Identify Congestion as a Problem
0
1
2
3
4
5
6
7
Have notconsidered this
initiative
Initiative is beingdiscussed
Initiative is beingimplemented as a
pilot
Initiative iscurrently in use
Initiative has beenused successfully
N/A
Figure 8: Use of HOV/HOT lanes by respondents that identify/do not identify congestion as a problem
Congestion is a problem Congestion is not a problem N/A
0
2
4
6
8
10
12
Have not considered thisinitiative
Initiative is being discussed Initiative is currently in use N/A
Figure 9: Use of pricing mechanisms by respondents that identify/do not identify congestion as a problem
Congestion is a problem Congestion is not a problem N/A
0
2
4
6
8
10
Have notconsidered this
initiative
Initiative is beingdiscussed
Initiative iscurrently in use
Initiative has beenused successfully
Initiative has beenused unsuccessfully
N/A
Figure 10: Use of smart parking by respondents that identify/do not identify congestion as a problem
Congestion is a problem Congestion is not a problem N/A

[25]
Respondents that Measure Congestion
0
1
2
3
4
5
6
7
Have notconsidered this
initiative
Initiative is beingdiscussed
Initiative is beingimplemented as a
pilot
Initiative iscurrently in use
Initiative has beenused successfully
N/A
Figure 11: Use of HOV/HOT lanes by respondents that measure/do not measure congestion
Measures congestion Does not measure congestion
0
1
2
3
4
5
6
7
8
Have not considered thisinitiative
Initiative is being discussed Initiative is currently in use N/A
Figure 12: Use of pricing mechanisms by respondents that measure/do not measure congestion
Measures congestion Does not measure congestion
0
2
4
6
8
10
Have notconsidered this
initiative
Initiative is beingdiscussed
Initiative iscurrently in use
Initiative has beenused successfully
Initiative has beenused unsuccessfully
N/A
Figure 13: Use of smart parking by respondents that measure/do not measure congestion
Measures congestion Does not measure congestion

[26]
Respondents that have a Congestion Reduction Plan
0
1
2
3
4
5
6
7
Have notconsidered this
initiative
Initiative is beingdiscussed
Initiative is beingimplemented as a
pilot
Initiative iscurrently in use
Initiative has beenused successfully
N/A
Figure 14: Use of HOV/HOT lanes by respondents that have/do not have a congestion reduction plan
Has a plan Does not have a plan N/A
0
2
4
6
8
10
Have not considered thisinitiative
Initiative is being discussed Initiative is currently in use N/A
Figure 15: Use of pricing measures by respondents that have/do not have a congestion reduction plan
Has a plan Does not have a plan N/A
0
2
4
6
8
10
Have notconsidered this
initiative
Initiative is beingdiscussed
Initiative iscurrently in use
Initiative has beenused successfully
Initiative has beenused unsuccessfully
N/A
Figure 16: Use of smart parking by respondents that have/do not have a congestion reduction plan
Has a plan Does not have a plan N/A
[27]
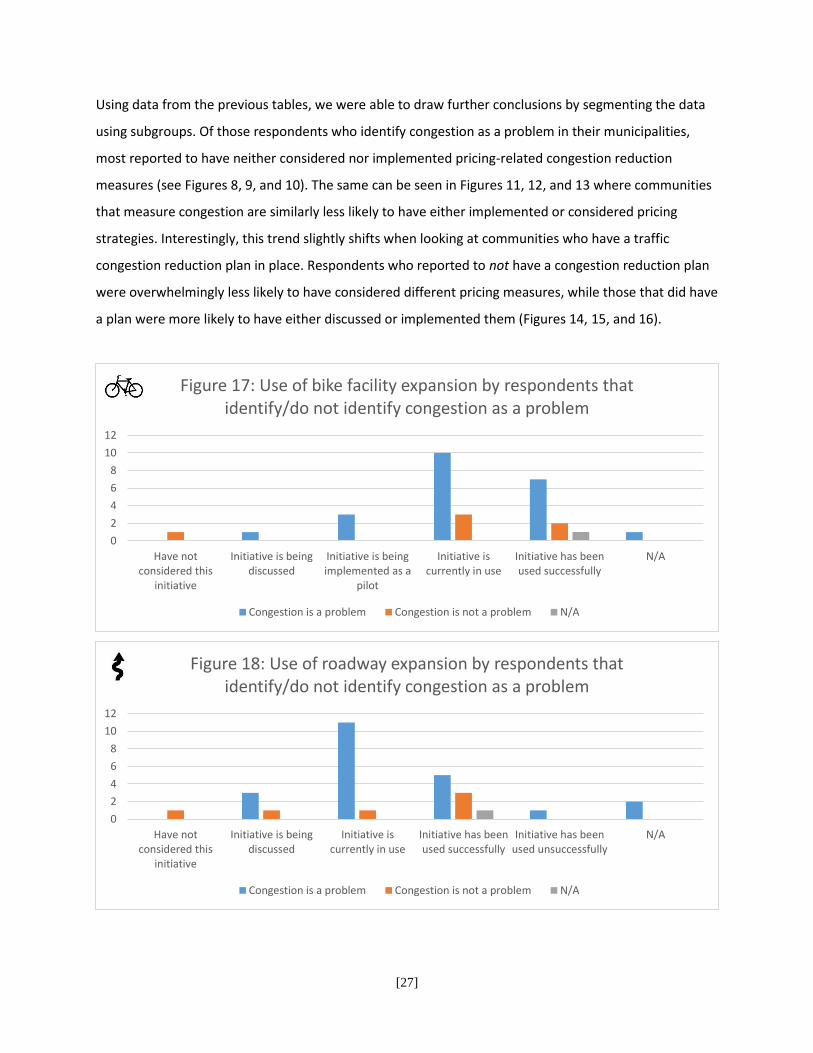
Using data from the previous tables, we were able to draw further conclusions by segmenting the data
using subgroups. Of those respondents who identify congestion as a problem in their municipalities,
most reported to have neither considered nor implemented pricing-related congestion reduction
measures (see Figures 8, 9, and 10). The same can be seen in Figures 11, 12, and 13 where communities
that measure congestion are similarly less likely to have either implemented or considered pricing
strategies. Interestingly, this trend slightly shifts when looking at communities who have a traffic
congestion reduction plan in place. Respondents who reported to not have a congestion reduction plan
were overwhelmingly less likely to have considered different pricing measures, while those that did have
a plan were more likely to have either discussed or implemented them (Figures 14, 15, and 16).
0
2
4
6
8
10
12
Have notconsidered this
initiative
Initiative is beingdiscussed
Initiative is beingimplemented as a
pilot
Initiative iscurrently in use
Initiative has beenused successfully
N/A
Figure 17: Use of bike facility expansion by respondents that identify/do not identify congestion as a problem
Congestion is a problem Congestion is not a problem N/A
0
2
4
6
8
10
12
Have notconsidered this
initiative
Initiative is beingdiscussed
Initiative iscurrently in use
Initiative has beenused successfully
Initiative has beenused unsuccessfully
N/A
Figure 18: Use of roadway expansion by respondents that identify/do not identify congestion as a problem
Congestion is a problem Congestion is not a problem N/A

[28]
0
2
4
6
8
10
Have notconsidered this
initiative
Initiative is beingdiscussed
Initiative is beingimplemented as a
pilot
Initiative iscurrently in use
Initiative has beenused successfully
N/A
Figure 19: Use of bike facility expansion by respondents that measure/do not measure congestion
Measures congestion Does not measure congestion
0
2
4
6
8
10
Have notconsidered this
initiative
Initiative is beingdiscussed
Initiative iscurrently in use
Initiative has beenused successfully
Initiative has beenused unsuccessfully
N/A
Figure 20: Use of roadway expansion by respondents that measure/do not measure congestion
Measures congestion Does not measure congestion
0
1
2
3
4
5
6
7
Have notconsidered this
initiative
Initiative is beingdiscussed
Initiative is beingimplemented as a
pilot
Initiative iscurrently in use
Initiative has beenused successfully
N/A
Figure 21: Use of bike facility expansion by respondents that have/do not have a congestion reduction plan
Has a plan Does not have a plan N/A

[29]
Regardless of whether respondents felt congestion was a challenge in their community or measured
traffic congestion, bike lane and roadway expansions were likely to have been implemented (Figures 17,
18, 19, 20). This trend shifts again slightly when taking into consideration whether these respondents’
communities have a congestion plan in place. Of those communities who have a plan, every respondent
reported to have implemented both bike facility expansion and roadway expansion measures (Figures
21 and 22).
Collecting Congestion Data
0
1
2
3
4
5
6
7
Have notconsidered this
initiative
Initiative is beingdiscussed
Initiative iscurrently in use
Initiative has beenused successfully
Initiative has beenused unsuccessfully
N/A
Figure 22: Use of roadway expansion by respondents that have/do not have a congestion reduction plan
Has a plan Does not have a plan N/A
0
2
4
6
8
10
12
14
Nu
mb
er o
f R
esp
on
ses
Methods of Measurement
Figure 23: If your community measures traffic congestion, how do you collect the corresponding data?
Travel Time Studies/Surveys
Traffic Counts
Traffic Recording Devices
GPS
Site/Field Observations
Modeling Analysis
Don't Measure

[30]
Answers to the survey’s qualitative questions were used to ascertain other trends across Canadian
communities. Under the second closed question ‘Does your community measure traffic congestion?’
Respondents were asked to elaborate on how traffic flow and congestion data are measured and
collected. A total of 22 respondents submitted responses to this question. Some respondents answered
with more than one type of data collection method. Certain responses that were worded similarly have
been grouped into like categories. As an example, the response ‘traffic surveys’ was grouped into the
‘Travel Time Studies/Surveys’ category. Moreover, each type of method has been grouped and
differentiated by colour.
Travel time studies and surveys were the most common response among those surveyed, but, as seen in
Figure 23, traffic counting and various traffic recording devices were almost as common once grouped
into similar categories. Other measures such as GPS tracking and field observations were also
mentioned.
A NOTE ON PRIVATE GPS MEASUREMENTS Respondents varied in their responses on the overall viability of using private GPS measurements to measure congestion – some in favour of, some more skeptical. A few respondents cited that private GPS measurements are their primary method of congestion measurement. Transportation Systems Engineer Zorana McDaniel at the City of Calgary remarked that, “We are using TomTom, a traffic congestion index, and we’re looking at where Calgary is through benchmarking with other cities. Using the TomTom Congestion Index, last year, compared to the previous year, it went in favour of [our city] having less congestion.” Other respondents dismissed the viability of this method. Said Lon LaClaire, Director of Transportation at the City of Vancouver: “TomTom, when you go to their website and look at how it’s calculated, you can see a whole bunch of additional information that might change your opinion about how they rank congestion. One of them is travel speed, as opposed to how much time people spend in traffic. The actual congestion number they publish is the percentage of additional time spent to do the same trip in a vehicle from the slowest hour of the day to the fastest hour of the day…It captures an inaccurate baseline…We wouldn’t use it at all. We’re not even sure how it’s sampling the individuals.”

[31]
Using Congestion Data
Respondents were then asked how the data they’ve collected has been used to improve traffic flow and
congestion in their respective communities. Twenty-three qualitative responses were generalized and
grouped into like categories (see Figure 24). Of the responses, traffic signal re-timing was one of the two
most common ways that communities made use of their data that had been collected. Although more
abstract, there was an equal amount of responses that indicated that communities use their data to
help plan for future and alternative measures of reducing congestion. Others commonly cited urban
design improvements, such as intersections and laneway designs, as a method informed by congestion
data, while a large segment remarked that they had either lacked the sufficient funding to measure/use
data or had not collected enough to make informed policy decisions.
Discussion
Across Canada, congestion is recognized as a challenge by many communities. Most survey respondents
representing different communities answered that congestion is a problem and most have a means of
measuring congestion in order to better grasp and tackle the challenge.
0123456789
Nu
mb
er o
f R
esp
on
den
ses
Figure 24: How has the data collected been used to alleviate congestion?
[32]
Consequently, every surveyed community reported to have implemented some type of method to
reduce congestion. The type of measures used, however, varied. A majority of respondents have
implemented nine of the twelve measures listed in our survey, while three of these measures have not
been as commonly implemented. These three – HOV/HOT lanes, pricing measures, and smart parking –
have not been widely considered or implemented. This may be a result of a common characteristic
shared between these three measures: they are relatively costly both financially and politically. In
contrast to other measures such as bike lanes expansion and implementation of public intelligent
systems, installing HOV/HOT lanes is not only more expensive to finance, but also less palatable to the
everyday voter. Crudely put, it is easier to paint lines on asphalt than it is to either charge citizens or not
allow single drivers to use the same roads they had previously used for free.
While these measures were unlikely to be implemented by the majority of respondents, their likelihood
of having considered these measures varied based on whether or not the respondents have a
congestion reduction plan in place. Interestingly, only half of respondents have a plan. Those who do not
are more likely to have never considered pricing strategies, and those that do are more likely to have at
least discussed them. Having a congestion reduction plan in place may indicate that communities have
concretely identified congestion as a challenge in their communities. Having a plan symbolizes a
thorough and formal approach to congestion management, meaning that most measures available to
minimize the problem would at least have been considered. Intuitively, communities with a formal plan
will be more likely to identify congestion as a problem, and are therefore more likely to consider each
possible reduction measure.
DOES ‘CONGESTION REDUCTION’ MISS THE POINT? THE CASE FOR ‘CONGESTION MANAGEMENT’ “If you improve one mode enough [like rapid transit] that it attracts significant demand, that’s great. But what also happens now is that you have reduced the demand side on, for example, private auto. [As a result, you’ve] also made that more competitive because now you’ve reduced the congestion side on that. It will achieve an equilibrium but it won’t shift all of the demand over to rapid transit or light rail. You can’t achieve a situation where you’re going to shift everyone away from private auto because there will be a point at which the calculation for private auto makes sense.”
- Geoffrey Keyworth, Senior Transportation Planning Engineer, Region of Waterloo
[33]
Among measures that were more likely to be considered, the implementation of bike lanes and roadway
expansion techniques were almost universal among respondents. Again, introducing the variable of
having a congestion plan elicits a notable trend. Every respondent who answered ‘yes’ to having a
congestion reduction plan had implemented both bike lane and roadway expansion techniques. We
believe this is because of an intersection of two factors listed previously in this section. First, bike lane
and roadway expansion techniques are relatively simple: they are significantly less costly financially and
politically. Second, those who have a plan are more likely to examine each measure. Those two factors
combined lends credence to the overall idea that implementing innovative and complex measures
requires financial and political capital, while also requiring a broader, concrete framework of reducing
traffic congestion. While not necessarily true for all cases, we find that there is a link between these
factors. Regarding implementation, we find that communities are more likely to implement traffic
congestion reduction measures if their population size is larger and if their population density is higher.
This seems to be intuitive: if there are more people, there is a greater need to improve traffic flow to be
able to move more of them from origin to destination. Moreover, if there are more people within a
smaller area, the likelihood for congestion is higher in both physical and relative terms: limited road
space will be increasingly taken up, and more people will recognize congestion as an issue relative to
what they expect. For measurement, most communities have used their traffic data to update and make
their traffic signal phasing more efficient. Interestingly, many communities also use the information they
gather to plan for future alternative measures to improve congestion in their communities.
In sum, traffic congestion has been identified as a problem by a majority of Canada’s communities with
over 100,000 inhabitants. Most communities do measure the effects of traffic congestion, while only
half of these communities have a formal plan in place. Many of them have installed measures to
alleviate the problem, and the measures that are less costly have been implemented more often.
However, those who have a formal congestion plan in place are more likely to have implemented or
discussed all measures listed. Communities that are larger and/or denser are more likely to have
implemented a higher number of traffic reduction measures. And while most communities who measure
congestion have implemented rudimentary measures, many also use their data to plan for alternative
measures.
[34]
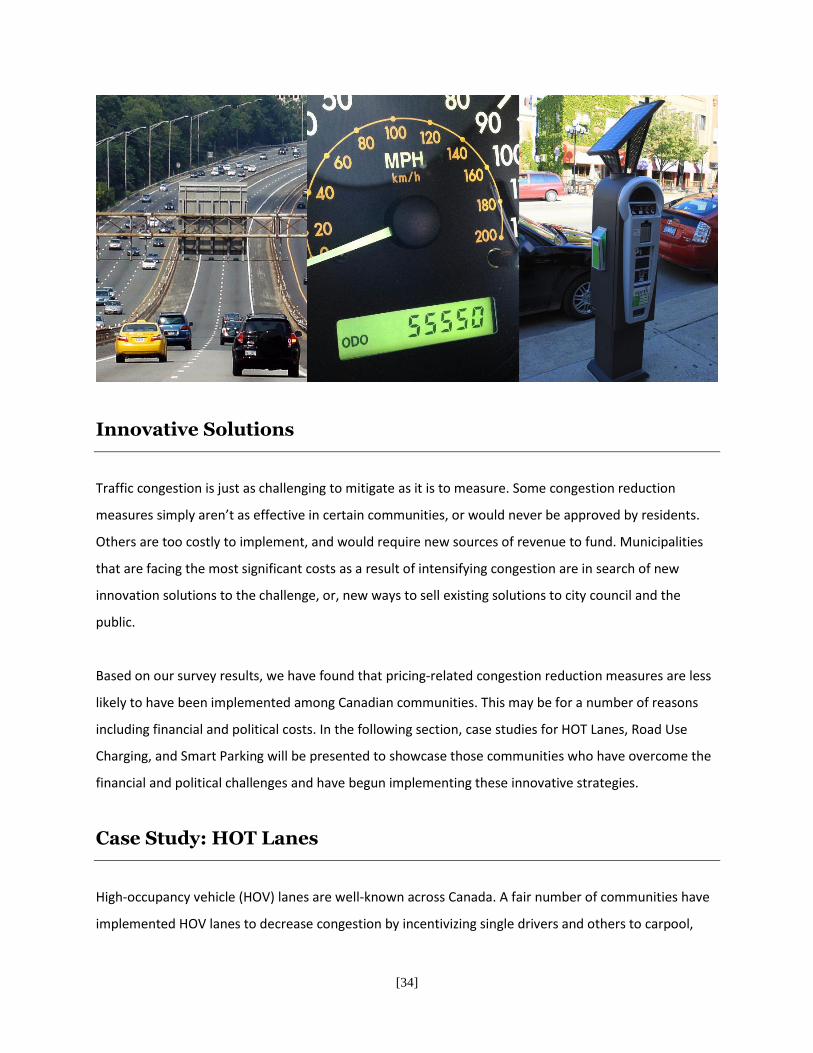
Innovative Solutions
Traffic congestion is just as challenging to mitigate as it is to measure. Some congestion reduction
measures simply aren’t as effective in certain communities, or would never be approved by residents.
Others are too costly to implement, and would require new sources of revenue to fund. Municipalities
that are facing the most significant costs as a result of intensifying congestion are in search of new
innovation solutions to the challenge, or, new ways to sell existing solutions to city council and the
public.
Based on our survey results, we have found that pricing-related congestion reduction measures are less
likely to have been implemented among Canadian communities. This may be for a number of reasons
including financial and political costs. In the following section, case studies for HOT Lanes, Road Use
Charging, and Smart Parking will be presented to showcase those communities who have overcome the
financial and political challenges and have begun implementing these innovative strategies.
Case Study: HOT Lanes
High-occupancy vehicle (HOV) lanes are well-known across Canada. A fair number of communities have
implemented HOV lanes to decrease congestion by incentivizing single drivers and others to carpool,
[35]
thereby decreasing the overall number of vehicles on the road. Ten out of the 29 respondents in our
survey had implemented these lanes as a measure to manage traffic flow. HOV lanes typically exist on
either side of a frequently-used, high-speed road network. Access is only given to those who either meet
or exceed the required number of individuals per vehicle. As an example, if an HOV lane signage reads
“2+”, vehicles are required to have an occupancy of at least 2 individuals in order to use the lane. If
vehicles use these lanes and do not meet the necessary requirements, they face financial and legal
consequences. In Ontario, a fine of $110 and 3 demerit points are administered to those who used these
lanes improperly.
Less well-known are high-occupancy toll (HOT) lanes. These lanes are commonly either built
independently of the existing road network in certain regions, or they utilize existing HOV lane
infrastructure. In the Dallas-Fort Worth area in Texas, along Interstate 820, HOT lanes (titled TEXpress
lanes) totaling 20.6 miles29 operate on an independent roadway adjacent to the main public freeway.
For a fee, drivers are able to use this stretch of road to avoid traffic and travel at a faster speed. The fees
are based on a dynamic pricing system, meaning they either increase or decrease depending on the level
of congestion.30 Similar to the 407 pricing system in the Greater Toronto Area (GTA), drivers are charged
electronically by a series of cameras instead of having to use manual tolling measures such as booths.
In Canada, the only HOT system that currently exists has been implemented as a pilot in Ontario. This
stretch of laneway, previously used for HOV traffic, runs between Oakville and Burlington. Launched on
September 15th 2016 under the Ontario Ministry of Transportation (MTO), the pilot is set to run for
between two and four years and will act as a learning tool for the Ministry in order to gauge the efficacy
of HOT lanes.
In both Texas and Ontario, a principle reason HOT lanes were introduced is to manage traffic flow.
According to the MTO website, “the HOT lanes are a pilot project aimed at reducing traffic congestion in
Ontario,”31 which was re-affirmed by Ontario Transportation Minister Steven Del Duca in late 2015, after
researching other HOT networks: “They have been effective in managing congestion by giving people
29 In conversation with PSD. 30 “How to Use TEXpress Lanes,” LBJ Infrastructure Group LLC and NTE Mobility Partners LLC,” last modified July 22 2016. https://www.youtube.com/watch?v=2vzG3siyeic 31 “High-Occupancy Toll (HOT) Lanes,” Ontario Ministry of Transportation, last modified September 15 2016. http://www.mto.gov.on.ca/english/highway-bridges/hot-lanes.shtml

[36]
options and incentives to change the way that they commute.”32 Similarly, the TEXpress website
highlights that this road network will “add additional capacity to accommodate more traffic to relieve
congestion.”33
With these statements in mind, have these networks been successful in achieving congestion reduction?
In Dallas-Fort Worth, travel speed via level of service (LOS) is used by the Texas Department of
Transportation (TxDOT) as an indicator of congestion. If more people travel slower for a longer amount
of time, then congestion is more of a problem, and vice versa. In conversation with PSD, Lisa Walzl,
Public Information Officer at the TxDOT, reported that the percentage of time that drivers spent driving
less than 50mph (80kmh) decreased significantly – from 24 percent of the time to 4 percent – after the
tolled lanes were completed. Other TxDOT documents point out that average speeds for commuters
have increased by approximately 15 percent.34 From a monetary perspective, Walzl asserts that drivers
saved $36 million annually in time savings. Businesses too, have benefitted. In an email to PSD, Walzl
wrote:
The individual cities along all of the [TEXpress] corridors have all seen an increase in economic development activity as companies jockey for position…What we have been told is that sales tax receipts are up as are new business start-ups because of the better access and mobility along the corridors.
In Canada, and in Ontario more specifically, HOT lanes are still in their infancy and the successes of the
program are less documented than in the Dallas-Fort Worth area. Even though the idea for this program
can be traced back through a number of previous provincial budgets, according to Scott Pegg, Director
of the Transportation Policy Branch at the MTO, the program really has only just begun.
And yet, the returns have been encouraging. From social media to public opinion, HOT lanes seem to be
gaining in both popularity and momentum in Ontario. Said Pegg in an interview with PSD:
I think that one of the things [the Ministry was] learning about this pilot is that there is a lot of interest and demand for [tolling]. One of our
32 “HOT lanes, derided as ‘Lexus lanes,’ inch ahead in Ontario,” CBC News, last modified December 7 2015. http://www.cbc.ca/news/canada/toronto/ontario-toll-lanes-1.3353546 33 “Frequently Asked Questions,” TEXpress Lanes, accessed August 2016. http://www.texpresslanes.com/faq-page#t32n29 34 “North Tarrant Express: Managing Traffic With Dynamic Pricing,” International Bridge, Tunnel and Turnpike Association, accessed August 2016. http://ibtta.org/sites/default/files/documents/2015/Oklahoma/Marcos_Belen.pdf

[37]
biggest initial questions was how much demand are we going to get from the consumer based on the price that was set for the service…What we saw out of this was that there was a huge demand for this service, so that tells us that there is an appetite amongst users to pay the fee and to get access to the lane. I think that the fact that HOT lanes are growing across America is giving governments a little more comfort that they are proven and they can work…It’s really early so we’re hesitant to make big proclamations at this point…But what I can say is, what we’re seeing so far is quite encouraging in terms of how the corridor is behaving…Participants are voluntarily tweeting or sending out messages saying they have a positive experience in terms of minutes saved to and from work.
Understanding that there has been positive momentum, Pegg acknowledges that public acceptance is of
the utmost importance to allow this project to continue from its early stages: “For me, where I sit as a
civil servant, I think the biggest challenge that we face is how to build out [a] network in a way that
matches people’s expectations.” If this is a challenge this Ministry is able to overcome and able to
continue the trend of public acceptance, examples of HOT success suggest that these lanes may indeed
be a contributing factor in reducing congestion in the future.
Case Study: Road Charge Programs
In the summer of 2016, the state of California introduced a road-usage fee pilot program. Five thousand
volunteers are to participate over a nine-month period to determine the viability of charging users per
mile driven in lieu of taxing each gallon purchased at the pump. There will be no cost to volunteers
participating in the program, and while GPS and odometer tracking may be used, the Department of
Transportation promises to employ strict privacy regulations to safeguard users’ privacy.
The reason for implementing a road-usage fee to drivers? As fuel-efficient vehicles grow in appeal, gas
taxes applied at the pump net less money for the state’s financial coffers because of how little gas fuel-
efficient cars require. And yet, these vehicles still travel the road network, deteriorating assets that
require maintenance and replacement by government agencies. Consequently, states are looking to
different forms of taxation to supplement their declining revenues. The California Department of
Transportation describes the current taxation scheme as “inadequate to preserve and maintain existing
road infrastructure,” and that “the gas tax cannot meet California’s current and long-term

[38]
transportation funding needs because it is ineffective and outdated, and will continue to generate less
revenue as cars become more fuel-efficient.”35
Washington, another state on the west coast, is implementing a similar model and has been developing
its program since early 2012. The hope is to have an implementation model ready and launched by the
summer of 2017. Similarly, their Department of Transportation has identified the unsustainable trend of
the current taxation system. Said Reema Griffith, Executive Director of the Washington State
Transportation Commission: “When you read the tea leaves of what’s happening in the auto industry,
it’s pretty clear it’s not a matter of if, but when the gas tax is no longer going to be a viable funding
source.
In order to pay for infrastructure and other public goods, both California and Washington have thus
taken a novel approach: have consumers of public goods, such as roadways, pay for the goods that they
use. Taxes are most efficient when they reflect the nature of the taxpayer’s behaviour. Although driving
eco-friendly cars may be a benefit to the environment, their drivers take advantage by paying
substantially less than other vehicles at the pump. By charging for each mile driven instead of each
gallon purchased, the proposed road-usage fee, or mileage tax, aims to make the playing field more
level for all drivers.
The inspiration for the road charge programs in both the California and Washington was drawn from
Oregon’s Department of Transportation – the first in the United States to implement such a project. In a
template similar to California’s model, 5000 volunteers are currently participating in a road charging
program that began on July 1, 2015. Participants pay 1.5 cents per mile for every mile driven, and while
they still pay gas taxes at the pump, the participants are given a rebate depending on the miles driven.
As an example, if Driver A pays $50 in gas taxes but only owes $30 in mileage taxes, he or she will be
given a $20 rebate at the end of the billing cycle. Conversely, Driver A will be taxed an additional $20 if
he or she owes $70 in mileage taxes. In short, drivers will be either rebated or charged the difference.
35 “Exploring A Road Charge for California – One Mile at a Time: Gas Tax Alternative for Funding Road Maintenance and Improvements,” State of California, accessed August 2016. http://www.dot.ca.gov/road_charge/documents/road_charge_fact_sheet_011216.pdf

[39]
Source: Oregon Department of Transportation
As is custom for new ideas, there are critics of the proposed program. A primary concern for advocates
of the environment suggest that the mileage tax dissuades individuals from buying cars that pollute less.
While potentially true, the increases that eco-friendly drivers will pay under the mileage tax may only
amount to marginal increases in taxes paid. As seen in the example in the table above, the driver of a
Toyota Prius will end up paying an approximate 16 percent increase in taxes under the road usage
charge. As a percentage, the jump in taxation seems like a leap, but when considering the relative costs
to that of the Ford F-150, the burden in cost remains less than half. Taken together, the disincentive to
purchase eco-friendly cars may be more hyperbole than fact – the Toyota Prius driver still saves
significantly in annual fuel costs.
The Oregon Department of Transportation also argues that individuals have to be accountable for the
infrastructure that they use. In an interview with PSD, Oregon’s Road Usage Charge Program’s Public
Information Officer Michelle Godfrey emphasized the principle of fairness and accountability:
Yes, it’s true that vehicles that get better gas mileage or use zero gas will pay more under this program, but the problem is that they’re not paying anything. Electric vehicles pay nothing for use of the road. That’s not a fair proposition either for drivers who are consuming the same amount of road but are paying very different levels towards the upkeep of those roads. This is an attempt to make it fair for everyone.
THE IMPACT OF FUEL EFFICIENT VEHICLES ON TAX REVENUE
Toyota Prius Ford F-150
Combined fuel economy 50 mpg 18 mpg
Fuel used annually 259.24 gallons 720.11 gallons
Total costs with fuel tax $745.57 ($77.77 fuel tax included)
$2071.04 ($216.04 fuel tax included)
Total costs with road usage charge
$862.23 $2049.43
Difference +$116.66 (The owner of the Prius pays a little more in road usage charge – $9.72 per month – which is offset by significant savings in fuel)
-$21.60 (If enrolled in the Road Usage Program, the owner of the F-150 would earn a rebate of $1.80 per month because fuels tax paid at the pump exceeds the road usage charge)

[40]
Other challenges that have surfaced include overall public support of the system and concerns regarding
privacy. In 2015, a Mason-Dixon poll revealed several key trends. Thirty-two percent of 625 registered
voters across Oregon were in favour of the proposed new tax system, while 56 percent were against.
Among groups, 82 percent of registered Republicans, 62 percent of men, and 64 percent of individuals
living in rural areas opposed the new tax.36 Put succinctly, the implementation of a road-usage fee faces
staunch public opposition. Yet Godfrey has found that among those who have volunteered, support has
never been higher: ninety percent of the individuals who began the program have stayed on, indicating
a very low drop-out rate.
In response to privacy apprehensions, the state of Oregon provides the option of using the vehicle’s
odometer to read mileage information without GPS tracking. For those apprehensive about the GPS
option, the state as well as private vendors have pledged to destroy collected data after 30 days.37
Godfrey further tempered privacy concerns with a caution about the pilot:
It’s a new technology. It’s not terribly new because it’s similar to GPS; it’s just using a different application in the vehicle. Privacy is protected by the law that established our program and the data does not identify actual coordinates for the program...Once we talk through some of the actual facts and realities of the program, people become more comfortable with it.
Ultimately, is this new policy able to impact traffic flow and congestion management? It is plausible that
drivers will consider driving less if there is a price attached to each trip that they make, which is an
anticipated outcome for any toll. But for now, states like Washington are keeping infrastructure funding
and congestion management separate, but have hope that both may be positively impacted in the
future: “From a traffic management standpoint, our congestion management approach [has]
intentionally separated tolling and pricing from our current work on the usage charging simply because
[that is the focus] of our legislature,” remarked Mrs. Griffith. “That’s how we’re approach is, but [we
recognize] that is has that potential [of reducing congestion] down the road.”
36 Joseph Rose. “Poll: Oregonians opposed planned mileage tax for future road funding,” The Oregonian, last modified June 3 2015. http://www.oregonlive.com/commuting/index.ssf/2015/06/oregon_mileage_tax_poll_shows.html 37 Gosia Wozniacka. “Oregon preps program to swap mileage tax for gas tax,” USA Today, last modified May 20, 2016. http://www.usatoday.com/story/money/2015/05/20/oregon-gas-tax-mileage/27676973/

[41]
Case Study: Smart Parking
Congestion has both a physical and relative aspect. Physically, it is a phenomenon where vehicles
impede each other’s’ progress. This impediment can occur both on rural roadways and on city streets. In
the city, traffic flow can be impacted by a wide number of variables from signal alignment, to lane
design, to overall volume of traffic. While perhaps understated, parking, too, can significantly impede
the progress of drivers.
The San Francisco Municipal Transportation Agency (SFMTA) cites research indicating that close to a
third of city traffic is caused by drivers circling while looking for a space.38 Drivers who look for a parking
space often circle city blocks until they come across one suitable for them. When there is sufficient
supply for parking spaces and enough demand from those looking for parking, there are very few delays
or inefficiencies. In reality, however, parking is very unevenly distributed. Different areas have higher
demand than others, and within those areas, certain streets are more desirable to park on than others.
In addition to increasing traffic congestion, parking inefficiencies can cause delays, increased traffic
volume, increased risk of accidents with pedestrians and cyclists, and cause an unnecessary amount of
excess pollution.
Examples of smart parking in both San Francisco and Los Angeles offer innovative solutions to some of
these challenges, SF Park, San Francisco’s pilot that ended in 2014, used smart, dynamic pricing so that
drivers were able to find parking more easily on both city streets and public garages managed by the
SFMTA. A combination of sensors and meters were installed in several mandated areas. These devices
captured the demand for parking in each area and consequently recalculated the costs for parking to
match the demand. For example, the SMFTA raised the cost of parking in areas with few parking spots
and higher traffic, and lowered the cost in areas where parking is more available. As per the SF Park
website, rates varied by block, time of day, and day of week, and the rates themselves were adjusted by
no more than 50 cents per hour down or 25 cents per hour up, and no more often than once per
month.39
38 “About,” San Francisco Municipal Transportation Authority, accessed August 2016. http://sfpark.org/about-the-project/ 39 “How it Works,” San Francisco Municipal Transportation Authority, accessed August 2016. http://sfpark.org/how-it-works/

[42]
The dynamic pricing model, however, was only one aspect of the SF Park pilot program. The other
significant feature was that the system as accessible by smartphone. Through the use of the SF Park app
via smartphones, drivers were able to identify the availability and cost of certain parking spaces within
the SF Park network. In connection with the sensors and meters, users were able to consult this data
using their smartphones and the SF Park app. In practice, drivers were therefore able to identify which
areas were available to them, and for what cost, when planning their trips. This in turn allowed them to
limit the time that they circled city blocks while looking for parking spaces that were available and those
that met their willingness to pay.
Source: SFMTA
In Los Angeles, a similar pilot program is still on-going. A significant 4.5 square-mile area in downtown
Los Angeles currently uses the LA Express program. Like SF Park, the LA Department of Transportation
has taken on this initiative “to realize its goals of increasing the availability of public parking spaces and
decreasing traffic congestion and pollution.”40 They, too, realize that delays in parking can also cause
40 “What is LA Express Park?” City of Los Angeles, accessed August 2016. http://www.laexpresspark.org/about-la-expresspark/

[43]
delays in overall travel times and congestion, and have implemented a pilot with innovate parking
meters, sensors, and a smartphone app to help address their challenges.
It is important to note that a significant difference between programs in both cities has been the use of
control areas. In San Francisco, three control areas were established in an attempt to mitigate
externalities and obtain a more accurate reading of the impact smart parking has on congestion. Under
SF Park’s Pilot Project Evaluation (2014) document, the SFMTA observed the following:
Most drivers can now find parking within 6.5 minutes (down from 11.5 minutes) in pilot areas,
which is a 43 percent reduction
Parking related vehicle miles traveled and associated greenhouse gases decreased by 30 percent
Traffic volume decreased by nearly 8 percent in areas with improved parking availability
Double parking reduced by 22 percent in pilot areas41
However, in Los Angeles, it has been difficult for the City to identify if their program has had the
intended effects of reducing congestion. In conversation with PSD, Peer Ghent, Senior Management
Analyst at the City of Los Angeles, offered positive but ultimately clouded observations of the program’s
success thus far:
We know that in the southern area – down in the South Park area – when we started this project, the minimum rate was $1 an hour. And in the southern portion of our downtown area close to the freeway and down to Adams St., those parking spaces weren’t utilized fully, so we lowered those parking spaces down to 50 cents an hour. And in the first year, we saw [that] in the South Park area [paid occupancy] went up 15 percent, so we [accomplished] a key objective and that was getting better utilization of the underutilized spaces…As we have seen in general since the start of the demonstration project to the start of the operational phase [until] now, is the demand for parking spaces or occupancy has gone up by about 5 percent, driven, I think, primarily by economic activity, not driven so much by what we have done with Express Park. So it is very difficult, since we don’t have a control zone…All we can look to is the trends within the parking which we do control…What we can’t and haven’t been able to figure out [sic] is how to identify specifically the impact on congestion…One of the challenges
41 “SFpark Pilot Project Evaluation,” San Francisco Municipal Transportation Authority, last modified June 2014. http://direct.sfpark.org/wp-content/uploads/eval/SFpark_Pilot_Project_Evaluation.pdf, pg. 90.

[44]
is demonstrating behaviour between parking and traffic congestion and that is hard to do because of the factors that are much greater.
Even after taking the uncertainty into account, LA’s program is set to continue to expand to other areas
like Hollywood and Venice Beach. Overall, Ghent is pleased with the progress of the project: “we haven’t
received major blowback from the citizens, in the business community, or those people [who are]
parking,” and “even those citizens that may not be aware of LA Express Park, their parking experiences
have improved…[At] about 35,000 parking spaces, you can pay by credit card at any one of those meters
– that’s a big deal.”
In sum, both smart parking programs have been successful to different degrees. San Francisco has found
noticeable congestion reduction benefits, but have yet to expand their services. Los Angeles,
meanwhile, continues to expand the LA Express Park, and is perhaps encouraged by the efficiency of
citizen parking experiences, rather than the measured effects on congestion.
Conclusion
Our survey has shown that an overwhelming number of respondents feel that congestion is a problem in
their communities, but very few have begun to discuss pricing measures such as HOT lanes, road charge
programs, and smart parking. Part of the reason may be attributed to the steep financial cost and
political costs. In our conversations with individuals at a variety of transportation departments, we
found that the latter certainly had an impact in the development of these measures: Scott Pegg of the
MTO, Michelle Godfrey, and Peer Ghent of the City of Los Angeles all attributed and forecasted the
success of their HOT, road charge, and smart parking projects respectively to public support. In other
words, for innovate solutions like these to be implemented widely, decision makers require the support
of the public.
Another tool to help drive these solutions is to have a congestion reduction plan. Our findings show that
those communities who have a formal plan in place are more likely to have both considered and
implemented these innovative pricing solutions. Communities facing financial and political barriers to
introducing more innovative solutions to traffic congestion might be served well by completing their first

[45]
(or a renewed) congestion reduction plan. The process of completing the plan builds buy-in from those
who are consulted, ensuring more support when the time comes to vote on new policy options.
These cases studies have shown that, when introduced with the proper foundation and support,
implementing new congestion reduction measures is possible. Through deliberate planning and
consultations, these projects and innovative solutions have gained significant momentum and have
demonstrated signs of reducing congestion. Admittedly, not each solution can be applied in every
context; congestion reduction solutions should be administered based on the needs and environment of
the community. The emphasis is not, however, to show the applicability of each solution, but rather to
demonstrate that measures exist beyond signal re-timing and roadway expansions, and that they have
been used successfully to reduce congestion.
It is important to note that more research is needed to determine the ultimate implications of these
pricing mechanisms, both in isolation and how they interact together to alleviate traffic congestion. Of
those respondents that had begun to implement new pricing strategies, very few of them had
responded that these initiatives had been implemented either successfully or unsuccessfully; it is likely
that not enough time has passed to accurately gauge their efficacy and future research is needed.
Similarly, these initiatives should also be analyzed as part of wider system in order to realize their true
benefits. Imagine a scenario where a driver encounters an HOT lane while already paying fees within a
road charge program. In this scenario, it becomes difficult to predict which program is of more benefit,
and whether two pricing measures can work in unison, or appeal to different segments of the
population.
These pricing measures have been introduced and examined to demonstrate effective and accessible
methods of reducing traffic congestion. Their true value has yet to be realized, but as congestion
continues to escalate in Canada and elsewhere in the world, innovative approaches like these should, at
the very least, be considered to address this growing challenge.
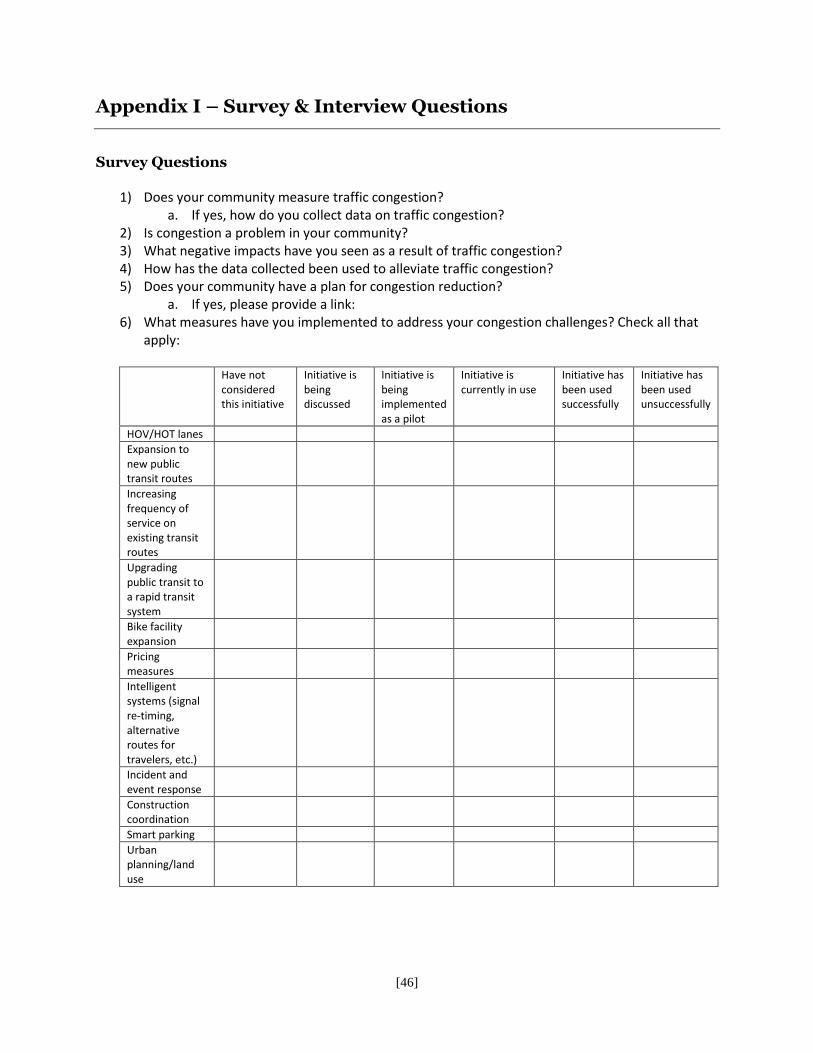
[46]
Appendix I – Survey & Interview Questions
Survey Questions
1) Does your community measure traffic congestion? a. If yes, how do you collect data on traffic congestion?
2) Is congestion a problem in your community? 3) What negative impacts have you seen as a result of traffic congestion? 4) How has the data collected been used to alleviate traffic congestion? 5) Does your community have a plan for congestion reduction?
a. If yes, please provide a link: 6) What measures have you implemented to address your congestion challenges? Check all that
apply:
Have not considered this initiative
Initiative is being discussed
Initiative is being implemented as a pilot
Initiative is currently in use
Initiative has been used successfully
Initiative has been used unsuccessfully
HOV/HOT lanes
Expansion to new public transit routes
Increasing frequency of service on existing transit routes
Upgrading public transit to a rapid transit system
Bike facility expansion
Pricing measures
Intelligent systems (signal re-timing, alternative routes for travelers, etc.)
Incident and event response
Construction coordination
Smart parking
Urban planning/land use

[47]
7) Of the options listed in Question 6, which has been the most effective in reducing congestion in your community?
8) Aside from the options listed in Question 6, what other measures has your community implemented to address congestion?
9) How has the reduction in congestion been measured? Interview Questions: Peer Ghent, City of Los Angeles
1) What are the biggest improvements in customer service as well as LA driver experience that ou have either observed or heard of?
2) Are there any agreements with private parking garages to bring them onto the LA Express Park system?
3) For the city-owned parking garages, is there a training or an information consultation for people who operate those garages for how LA Express Park works?
4) How has roadway congestion been reduced? 5) Relating back to the success of LA Express Park, how has it specifically been successful? 6) Are there plans for expansion? 7) Barring unforeseen obstacles, do you foresee LA Express Park being implemented citywide? 8) Are there certain conditions more favourable than others for a system like LA Express Park to
thrive in? Would you recommend it in bigger cities versus smaller ones, or congested cities versus non-congested cities?
Interview Questions: Michelle Godfrey, Oregon Department of Transportation
1) What was the impetus for the mileage tax, and why now? 2) What are the biggest challenges you’ve observed since the implementation of the tax one year
ago? 3) Have you seen any changes in the following areas:
a. Impacts on specific road corridors b. Overall accessibility of both drivers and people c. Fuel consumption d. Impact on businesses
4) Within the program, does the state continue to provide a rebate if the mileage tax is less than the gas tax? Does the state either rebate or charge drivers the difference between the fuel tax they paid and the proposed 1.5 cent-per-mile levy?
5) Doesn’t this program dissuade people looking to buy more environmentally-friendly cars? If all are taxed equally, there is no incentive for people to buy these types of cars.
6) Have you encountered obstacles, primarily privacy advocates? 7) How likely is the program in becoming mandatory? 8) Do you have any advice for individuals in other transportation departments looking to
implement a similar version of Oregon’s mileage tax program? Interview Questions: David Pritchard, Metrolinx
1) What is the goal or mission statement of your organization with relation to congestion? 2) What is the jurisdiction and area of Metrolinx? Which areas do you principally serve?

[48]
3) Do you measure the cost of traffic congestion? What metrics do you use to measure? To your knowledge, is the approach to measuring the cost of congestion similar to the approach used by equivalent regional transportation bodies across Canada?
4) Of the information and data you’ve collected, how does that influence your organization’s decisions? How do you put that data to use?
5) What strategies does Metrolinx employ to reduce traffic congestion? Pricing? Increases in train service?
6) Is road tolling an option in the short term? Would there be too much political resistance? Interview Questions: Amer Afridi, City of Surrey
1) Understanding that congestion is an issue, how is it measured at the City of Surrey? 2) Surrey has invested in a traffic management centre. Has its implementation been beneficial? 3) Now that congestion in Surrey is an issue, what are the visible negative effects of congestion on
the community? 4) Of the information and the data that you’ve collected, how does that influence your decisions in
reducing congestion? How has that impacted your decisions? 5) Jaime Boan (Manager of Transportation) said there hasn’t been enough transit put in place. Are
you confident that it will be addressed? 6) What other measures are being used successfully?
Interview Questions: Lon LaClaire and Steve Brown, City of Vancouver
1) Earlier this year, it was reported that Vancouver was Canada’s most congested city according to the TomTom Traffic Index. However, there has been a reduction of average time spent in traffic congestion in Vancouver for the first time since 2010.
a. What have been the reasons for this in your opinion? b. How is your congestion reduction planning informed? Do you take private data, such as
TomTom’s, into account? 2) After consulting your survey responses, is Vancouver waiting for a standardization to be
established before measuring? Have you considered using something as basic as time travel delays as a starting point?
3) Your survey results mention the approach of planning for construction work times with lower traffic volumes. What does this look like in practice and has it been effective?
a. Wouldn’t this measure only be impactful in the short run? 4) What types of smart parking technologies are being discussed at the City? Have looked to San
Francisco or Los Angeles? 5) Intelligent systems have been of great benefit to other communities in the Greater Vancouver
area. Your survey response indicates otherwise. Why have these measures not helped? 6) You’ve indicated that rapid transit expansion has helped your community most in alleviating
traffic congestion. Are there still improvements to be made in this area, or will each improvement only add marginal benefit?
7) Have you considered measuring congestion reduction in more multi-modal terms i.e. how long does it take the average commuter to get to work, whether it be by bike, car, or walking?
8) Mobility pricing has been proposed by Metro Vancouver’s Mayor’s Council – where is the discussion currently and what is a likely outcome?
[49]
Interview Questions: Geoffrey Keyworth, Region of Waterloo
1) According to your survey responses, if congestion is not a problem in your community, why measure it? Or does one precede the other i.e. do you believe these measures have helped prevent traffic congestion?
2) You mention in your survey responses that your organization has yet to comprehensively measure the effects of congestion alleviation measures, yet you consider them to be successful? How and why?
3) Your survey results mention that traffic congestion management should be the goal, not reduction. Can you expand on that?
Interview Questions: Reema Griffith, Washington State Transportation Commission
1) What was the impetus for implementing the road charge program in 2012? Was there a notable increase in people driving cars that are more environmentally-friendly? Where did the idea to do so come from?
2) Has your organization consulted with other states involved in similar projects? 3) Was any part of the decision to implement the project related to traffic congestion? Do you
think that having a road charge program in place will ease traffic flow because people will think twice about making trips and therefore reduce the number of vehicles?
4) How soon will the demonstration project be launched? What issues still need to be overcome in order to conduct a demonstration project?
5) Has the most difficult part of the process already been overcome? 6) What are the positives that you foresee when the project is launched? How do you foresee it
changing from both A) an infrastructure funding perspective and B) a driver behaviour perspective?
7) How will it work? Does the user pay the difference between the gas and mileage taxes? 8) Has this process taken longer than you have imagined? Can other states expect the process to
take as long if they’re looking to implement a similar project? 9) What advice do you have for other communities who are looking to implement a similar
program? Interview Questions: Zorana McDaniel, City of Calgary
1) You mention in your survey that your community measures congestion but doesn’t see it as a problem? Can you explain why that is?
2) You mentioned you see less vehicles on the road due in part to the economic downturn. Do you think that trend will continue, or is it just for the time being in light of the downturn alone?
3) You mentioned that HOV/HOT lanes have been used successfully. Can you speak to the success of the program? For example, have you installed both HOV and HOT lanes, and why do you think they’ve been successful?
4) You wrote that smart parking has been used successfully in Calgary as well. What types of smart parking programs have been used?
a. Is there any technology that you now use in relation to your parking system? 5) Were there challenges implementing these parking policies and smart parking programs?

[50]
Interview Questions: Scott Pegg and Bronwyn Cuthbertson, Ministry of Transportation of Ontario
1) Where did the impetus for the HOT lane program come from? Was congestion the primary driver to install a program like this? Was a lot of research done? Did you look to a lot of other communities as examples to follow, not necessarily in Canada, but maybe in the US or worldwide?
2) What did you learn most from the Pan Am Games that happened in Toronto and the utilization of those HOV lanes?
3) How long has the overall process taken? Was there a date where it was first proposed as a bill or as a pilot or as an idea?
4) Has it been difficult to obtain the support of the public for this project? 5) What outcome from this process are you hoping for more generally, and then what are you
hoping to learn most from the pilot project? 6) What do you foresee being the largest obstacle with regards to implementation in the future? 7) It says that the cost for a permit is currently $180 for three months or $60 per month. Is this
indicative of what it may cost in the future when implemented as a full-time project? 8) Is dynamic pricing something that is being considered or will be considered in order to increase
demand when necessary? 9) What advice would you have for communities who are looking to implement a similar program?
And would you specifically recommend it to those that have higher traffic congestion? Interview Questions: Chad Williams, City of Kelowna
1) Regarding your survey responses, you indicated that congestion is a challenge, but mentioned that your community doesn’t actively measure it. Can you explain why that is?
2) You mentioned construction coordination has been among the most effective measures for traffic reduction. Can you elaborate how this system works in Kelowna and why it’s been so effective?
3) You mention that smart parking is currently being discussed at the city. How far have the discussions gone and what systems are being considered?
4) Can you elaborate on the use of HOV/HOT lanes at the city? Are they exclusively HOV lanes?

[51]
Appendix II - Glossary
Bike facility expansion: building and expansion of new or existing roadways to accommodate lanes designated specifically for bicycles Construction coordination: coordination of city traffic networks and schedules together with private and public construction work schedules Incident and event response: detecting collisions and other incidents in expressway corridors, coordinating emergency response, and notifying motorists Intelligent systems: providing convenient access to current and reliable traveler information as well as network monitoring, CCTV cameras, and signal controls Loop sensors: an insulated, electrically conducting loop installed in pavement that detects presence of vehicles Modelling analysis: simulation of transportation systems Permanent count stations: stations at which continuous traffic counts are taken Pricing measures: tolling measures whereupon a fee is implemented on a public or private roadway or area Smart parking: a vehicle parking system, often through pay-by-phone, that helps drivers find a vacant spot, using sensors in each parking space that detect the presence of absence of a vehicle Traffic counts: a count of vehicular or pedestrian traffic, which is conducted along a particular road, path or intersection (Road) Tube Counters: portable devices used to count traffic Turning movement counts: square-shaped boxes used to quantify the movement of vehicles in an intersection Urban planning/land use: consideration of infrastructure design to better inform traffic management practices

[52]
References
“About,” San Francisco Municipal Transportation Authority, accessed August 2016. http://sfpark.org/about-the-project/ “An introduction to the Department for Transport’s road congestion statistics,” United Kingdom Department for Transport, last modified August 25 2016. https://www.gov.uk/government/uploads/system/uploads/attachment_data/file/527880/an- introduction-to-dft-congestion-statistics.pdf “Canadians lose more hours in traffic: Report,” The Canadian Press, last modified March 31 2015. http://www.moneysense.ca/spend/real-estate/canadians-lose-more-hours-in-traffic-report/ “Commuters spending more time in transit: Statistics Canada,” CBC News, last modified July 12 2006. http://www.cbc.ca/news/canada/commuters-spending-more-time-in-transit-statistics-canada- 1.583900 “Costs of Road Congestion in the Greater Toronto and Hamilton Area: Impact and Cost Benefit Analysis of the Metrolinx Draft Regional Transportation Plan,” Greater Toronto Transportation Authority, accessed August 2016. http://www.metrolinx.com/en/regionalplanning/costsofcongestion/ISP_08- 015_Cost_of_Congestion_report_1128081.pdf Dachis, Benjamin. “Tackling Traffic: The Economic Cost of Congestion in Metro Vancouver,” C.D. Howe Institute, last modified March 9 2015. https://www.cdhowe.org/sites/default/files/attachments/research_papers/mixed/e- brief_206.pdf “Definition of congestion,” Collins Dictionary, accessed August 2016. http://www.collinsdictionary.com/dictionary/english/congestion “Exploring A Road Charge for California – One Mile at a Time: Gas Tax Alternative for Funding Road Maintenance and Improvements,” State of California, accessed August 2016. http://www.dot.ca.gov/road_charge/documents/road_charge_fact_sheet_011216.pdf “Frequently Asked Questions,” TEXpress Lanes, accessed August 2016. http://www.texpresslanes.com/faq-page#t32n29 “Global Health Observatory Data,” World Health Organization, accessed August 2016. http://www.who.int/gho/urban_health/situation_trends/urban_population_growth_text/en/ “High-Occupancy Toll (HOT) Lanes,” Ontario Ministry of Transportation, last modified September 15 2016. http://www.mto.gov.on.ca/english/highway-bridges/hot-lanes.shtml “HOT lanes, derided as ‘Lexus lanes,’ inch ahead in Ontario,” CBC News, last modified December 7 2015. http://www.cbc.ca/news/canada/toronto/ontario-toll-lanes-1.3353546 “How it Works,” San Francisco Municipal Transportation Authority, accessed August 2016. http://sfpark.org/how-it-works/ “How to Use TEXpress Lanes,” LBJ Infrastructure Group LLC and NTE Mobility Partners LLC,” last modified July 22 2016. https://www.youtube.com/watch?v=2vzG3siyeic Kalinowski, Tess. “Toronto area commutes add to time crunch, study shows,” Toronto Star, last modified April 28 2014. https://www.thestar.com/news/gta/2014/04/28/toronto_area_commutes_ add_to_time_crunch_study_shows.html Litman, Todd. “Smart Congestion Relief: Comprehensive Evaluation of Traffic Congestion Costs and Congestion Reduction Strategies,” Victoria Transport Policy Institute, last modified September 15 2016. http://www.vtpi.org/cong_relief.pdf “London: Why Car Traffic is Down, but Congestion is Up,” INRIX, Inc., accessed August 2016. http://inrix.com/londoncongestion/
[53]
“Managing Traffic Congestion,” Victorian Auditor-General’s Office, last modified April 2013. http://www.audit.vic.gov.au/publications/20130417-Managing-Traffic-Congestion/20130417- Managing-Traffic-Congestion.html “Managing Urban Traffic Congestion,” Transport Research Centre, European Conference of Ministers of Transport, last modified 2007. http://www.transportstrategygroup.com/persistent/catalogue_files/products/07CongestionSu mmary.pdf “North Tarrant Express: Managing Traffic With Dynamic Pricing,” International Bridge, Tunnel and Turnpike Association, accessed August 2016. http://ibtta.org/sites/default/files/documents/2015/Oklahoma/Marcos_Belen.pdf “Number of cars sold worldwide from 1990 to 2016 (in million units),” Statista, http://www.statista.com/statistics/200002/international-car-sales-since-1990/ Pinsker, Joe. “Yes, Rush-Hour Traffic Is Getting Worse,” The Atlantic, last modified August 26 2015. http://www.theatlantic.com/business/archive/2015/08/rush-hour-traffic-commute/402418/ “Report says Mexico City is now the most traffic congested city in the world,” UKIP Media and Events Ltd., last modified March 30 2016. http://www.traffictechnologytoday.com/news.php?NewsID=78555 Reynolds, D.J. “Congestion,” The Journal of Industrial Economics 11:2 (1963): 132-140. Rose, Joseph. “Poll: Oregonians opposed planned mileage tax for future road funding,” The Oregonian, last modified June 3 2015. http://www.oregonlive.com/commuting/index.ssf/2015/06/oregon_mileage_tax_poll_shows.ht ml “SFpark Pilot Project Evaluation,” San Francisco Municipal Transportation Authority, last modified June 2014. http://direct.sfpark.org/wp-content/uploads/eval/SFpark_Pilot_Project_Evaluation.pdf, 1- 142. “TomTom Traffic Index 2016 – The Results are in! Mexico City Takes Crown of ‘Most Traffic Congested City’ in World from Istanbul,” TomTom International BV, last modified March 22 2016. http://corporate.tomtom.com/releasedetail.cfm?ReleaseID=961546 “Traffic Congestion and Reliability,” US Department of Transportation - Federal Highway Administration, Office of Operations, accessed August 2016. http://www.ops.fhwa.dot.gov/congestion_report_04/executive_summary.htm “Traffic Congestion and Reliability: Trends and Advanced Strategies for Congestion Mitigation,” US Department of Transportation - Federal Highway Administration, Office of Operations, accessed August 2016. http://www.ops.fhwa.dot.gov/congestion_report/chapter2.htm “Transport Statistics Bulletin – Road Statistics 2008: Traffic, Speeds and Congestion,” UKRoadsLtd., accessed August 2016. http://www.ukroads.org/ukroadsignals/articlespapers/roadstats08tsc.pdf “Transportation Operations & Safety,” Southwestern Pennsylvania Commission, accessed August 2016. http://www.spcregion.org/trans_ops_cong.shtml “What is LA Express Park?” City of Los Angeles, accessed August 2016. http://www.laexpresspark.org/about-la-expresspark/ Wozniacka, Gozia. “Oregon preps program to swap mileage tax for gas tax,” USA Today, last modified May 20, 2016. http://www.usatoday.com/story/money/2015/05/20/oregon-gas-tax- mileage/27676973/