an analysis of the softwood log trade between the united
TRANSCRIPT
An Analysis of the Softwood Log Trade Between the United States and Japan AGRICULTURAL EXPERIMENT STATION UNIVERSITY OF MINNESOTA Paul Gallagher
An Analysis of the Softwood Log Trade Between the United States and Japan
Summary
This study reports on market forces and governshyment policies that influence the softwood trade between Japan and North America The policy enshyvironment is described by a lumber import quota in Japan an embargo on log export in Canada and free log trade between the United States and Japan A stitistild model measures the influence of log proshy
and lumber consumption adjustments on the U apanese log trade and prins in both countries Thlt el11piri 1 study is basld on iIlnual data from the 19hO to 1976 period RlSlllts indicate that Japans excess demand and the lJnitltd States excess supply relation Ire price responsin in the log market Mean alul elasticitils an arollnd 0 for Japn and +07 (or the United States The findin of a price response 011 thl part of the Japanese qands in contrast to reshysearch b]sed on quarterly data from the 1950 to
C)h9 period and trade unit alues instcaci of wholcshy~ak L21)
The estimates indicate that changes in itollsin -tart amI domeltt1c log production in Japcn are nitishycal in nplaining past and future Ieveb of US log trade Oer the 196~ to I priod for example Japan incnasll1g lolltmction and dcllining dOlllesshytic hanest contribu1lo aboll equally to riing log purshychusls from the US Duri mo~t of the 1980 and 1990s J(clopments ill Japan I1wrKlt lould lIKOUrshyage a log track ncar the levels 01 the 111io-19705 Thi~ w(nilo be liKcly if brisk income growth foters a
residential construction 111ltlrk(1 and softwood harvests froll1 Japans (orlsts are comparable to those
Author Paul Callagher j a research ~pecia[iq in the College 01 Forestrv and the Department of Agricultural and Applied Economics University of Minnesota
The University of Minnesota including th Agriculshytural Experiment Station is lommitkd to the policy that all persons shall h3ve acclSS to it- proshygrams facilitie~ and employment without regard to race creed lolor sex national origin or handicap
of the mid-1970s However it is possible that Japan could drastically reduce its dependence on US log imports This might occur if stagnant income preshycludes strong demand for new housing and the output potential of Japans softwood forest is realized
Introduction
The US softwood log trade has fostered a highly publicized controversy that began with export expanshysions of the 111id-1960s (4826) At times Japans purchases of timber have approached 10 percent of US production in the highly inelastic softwood marshyket Its not surprising that lumber users have deshymanded export restriction or elimination in efforts to reduce domestic priLe~ On the west coast where about 25 percent of the timber harvest is shipped uhroad labor interests have been especially vocal ~orkers associated with shipping industries haw vvelshycomed the employment and income generated by foreign sales while those in the lumber economy deshycry th loss of domestic processing
This paper contains an analysis of the affecting the US-Japanese log trade and an assesshyment of the market forces in Japan that will influshyence trade in the future The analysis complements previolls work in two respects (21) First this study emphasizes the structure of Japans softwood market Second tl1l effeds of trade policies in Japan Canada and the Us are also taken into alxount The assessshyment or future trade is limited to meauring the effltcts of possible expansion in Japans lonstruction industry and domestic timber supply
The research in this report WlS partially funded under a co-op aid agreement with the Pacific Northwest Forest Experiment Station US Forest Servkc The author is grateful for the suggestions of many people at the University of MilllllSota and the Pacific Northwest Forest Experiment Station but remains responsible for the COIl ten ts of this publication David Darr Richard Hayne Richard Skok Hans Gregerson lame Houck and Edward Schuh were especially helpful Peter Pollak Kenji Takeuchi and Lennart Ljungman at the World Bank also read a draft of this report and offered many valuable suggestions
Japanese North American Trade Policies A Description
Tlll p~ltttTll Ji Tr~jdc amung L1P~1l1 tJlt l S allLi C~l11~da i~ undebtjnd~tblC pfu lded that lOlllparallt adantacre ~ll1d the arrav of tr~de restrictiolls are both l~d~ln il~to cillOUllf As c rule uf thumb culllparatit clclalltacrc dctlnnille~ the e~tlnl uf a COLlllTrv trade in rav Lllnkrial and procc~slc prudld while tr~Jlk pulicil (plain lhlt compositioll uf lug ~l11d lumulT trdck-s ~ill tlme countries haw dcvclojltd labor md capit] J11cirkd there no impluimcl1t [0 d()]1~llic proce~illg prmidd th~t1 it i~ profiLibk [miccd 11U[
rC51rillium are dttempts to retain domestic processing incoml by incrcasing lhc g~jp beTCCll dOl11esti l llllllshylwr 11 log pricls In thc CaSt of 111 importing cUllllshyIry lik~ Jpan policils rcqricL 11ll1lblr imports thus illlTldSing iUlnblr pricCs paid by CU11SUll1lrs Canacc is tile world ieddilH softwood eporter Ih policies prohibil lug epl)rh- and rcdull iog priCCS paid h proccsors In cUl1trJst tIll United SLte~ (ollov cl fret tradt policy in log and lumbel nnr]eh Till peculiar CS trJCk pattern - importing lumber tro111 Canada and exporting logs to Lipan n Cn though the C S j an importing lOUl1trv -- is F()~~lbl~ a direct result of polilil~ in hpan ~i11c1 CaJ1Llcl~i
The comparate cidlltdge yardstick ~m()Lnl k
~i cOlnp~~rison of~ Lountry~ dOn1(stiL~ l~Uret rl~OUrll~) it11 upuiatioll lt[lid hCiuing requiret1llllb Japan an il1l]Jlnlllg (OUl1lry ilt charalterizlcI by a smJII land basc a Lkn~l pupulation and a limber rlmiddot~UUrl tlidt was ndy cepkltd during orld J Ii Comcshyquently imports cxp~md(d lwyond h~ilt of dOl11estic suftuucl l()l1ul11ption when cunstruction lxpandcd during thl lLJ(iO ~1l1(1 carlv 197( But this countn i~ hl~ij fonslcd and forlsf replalllcj ~Iftll orlc ar II arlo lppro~iching llaturit so Japan could support
d(11l1e~til lUn~Ul11pllOn [ncb of the mid-l 970s with dlll11e~til iorlsb in thl~ ncar llillirl Projectiom of lontinucLi deplmknlL in softoud 1ll1ports hintt un ignificltln1 Lkm~ll1d lxpamiun~ (() i Thl uS has abunshyd~tnt oftw]Cicl rCSOUlLlS but nul cllnugh tu ati1y thl 1l1as~i t domcstic market L~ sawnwoud conshyQ 1ll1pti(iD (7J mil ]]i) eXClCCis tht combinld cunshyumptiun of Japan (~) mil n1 ) nd Canada (30 mil me i CunSlljuently lhe lS 1l11jwrh dbout ~5 pcrshyllnt of ih soflvoud lrom C~n~ida Thc timlxr imcnshy(my of the ~st Can~lliiall ilcltrl1cs has about threeshy[ourths 1h Ulllll1C of LS il1cntur~ but Canada is parscl y popLl~ttcd Cumequlnll~ tlle Canadians cshypurl nenly half or thlir domestic proliultion to thl lnttd SUhcgt
lr~idc flO in lUf ll1d lumbl l1l~lrkcts arc illusshytrated in Figurc 1 bIXin (iccounts lor ~illl1ost all tralk ll1 log b- pur-hasing 10 mi m3 frol11 the Lnitee SlJtl Lind l11ii m 3 from thc SOiet Union Sm~dl qLiLillitll 01 logs arc iliP1Xd from thc US to Cll1ac1a li i- Yiii 111 3 ) but llmost no lugs kac Canada (05 pcrceLl it (al1udi~n dOll1ctic pruductiun) LS imshyports frum emul arl till l1lajnr lumbr trade ( 130 1i1 1 3 ) 1 inul dlliUlil1h uj ~~iWijOOt are abo cxshypumiddotlC1 in)l11 urtil Al11eric1 10 J~[p~n the LS Inc C~dlld hoth hip 1t-Olll UIW 11illiun lutic l11eltr~
The Jap~Jwse-Jorth American lumber tracle is )W] Lmittd than Fiplrc I indicates Indeed subseshyqUcIH tcol1omic analysis builds on the assumption that all US lul11ber exports should be classified as iog cports Mure thll1 half of ~orth American lumshyber iIl1porh (5~ per~cnt during the 1968 to 1970 period) an b _-+ or 14 square timbers that are reshyproclsec in Japancsl mills Htmlock baby squares i+ I arl the lnaior procluct in tht ren1 iJiiJlg North -l11eric~n slwnwooc trade (60 perct]]t during thc i l)li to lenO plriod) (inc the Canadians cgtport most
Figure 1 ~bjor trade flows in softwood log~ and lumber- Japan United States and Canad~l
A Sawlogs and Veneer Logs
USSR I
e9 03
II Japal I Poductioi 168L Consumption 340
102
Canada I Production 693 Consumption 704 I
t L4 01
Un ited State Production 1528 Consumption 1413
B Sawnvvood
1O~
~ Japan 1
PlOduction 274 I I
Consumption 298 i I
12
[ 1 dcTd arE In ~nliion cubiC meter-so SourCE FPO VealbOOk (1976) 1975 dttc
3
-------------~
Canada Production 257 Consumption 118
130 I
t Ur ited States
Prod uction 631 Consumption 732
I
of these (13) Other data also confirm this hypothesis For example the bulk of US lumber exports origishynate in Alaska (93 percent during 1968-1970) and virtually all Alaskan lumber are squares larger than 41 in thickness
A number of trade barriers and cultural factors impede trade ill Japans lumber market (6 p 95) These restrktions add up to a quota although no such policy is formally stated First import of Russhysian lumber is discouraged by a 10 percent tariff on sawnwood smaller thal1 160 111m (630) in thickness on the major species (spruce pine and fir) The major Korth American species hemlock and Dougshyas-fir- ~Ire excluckd from this tariff but all illlshyported lUI11blr must be regraded in Japan The costs of regrad Jmoun t to 10 percent of the value of the lumber and 3 perlent of this cost is added to the lumber price A Hgrading scheme also has the potenshytial to serve as ii rationing device when lumber imshyports exceld a desirell lewl Finally Japanese conshyqruction methods favor metric lumber sizes A westshyern (platformframe) construction method was initishyated ill nlellt years and this method is compatible with Korth American lumber sizes However only 01 pacent of new hou~es feature this construction mdhod
The Canadians almost climinate log exports with a permit system (26 l Before a government permit for log cxport is granted domestic millers must refuse to
the timber and the governlllent must approve the log export
Free traue policies are followed where major US tr3de OCCllr~ The 1lS-Canadi~1l1 lumber exchange is a textbook C3S( of free trade In the log market the US does no aJloA export or logs harvested 1rom public lJnds Others have ~rgLled that this regulation guarll1tees 1 ~lIpply for domestk processors but does 110t inhibit foreign trade Also an upper limit has been placed on permissible log exports The upper limit on exports however is beyond observed levels of log Tracie (26)
IMPLICATIONS FOR PRICE VARIABILITY
It is imporuiI1t to verify that some softwood marshykets function as fret tr~lde markets while restrictions are effectivE in other markets Time series price data t1111 spans housing market cycles should aid this verishyfication In free trade markets example p11ce fluctuations for similar Loml110dities hould be posishytively correlated since origin and destination price~ differ only by a transportation margin However quotas and Lll1bargos insul3te domestic from foreign price SG correlations of price fluctuations should be low or eYen negatiye
Correlations of annual price changes over the 19(5 to 1975 period conform to expectation Price lhanges for US and Canadian lumber (Douglas-fir) arc highly correlated (1 094) but lower correlation for US and ClI1adian sawlogs ~r 058) were obshytained Correlations of price differences between the US and Japan were 10weL as a result of quality difshy
4
ferences in softwood species and adjustments in USshyJapanese exchange rates but the relative magnitude of log and lumber correlations are as expected Correshylations of log price changes compared US sawlog pnces for Douglas fir (expressed in yen) with an inshydex of log wholesale prices for cedar and pine in J~pan The simple correlation between annual price difterences IS 039 Correlations of price changes in the lumber market were based on the Japanese wholeshysale price for cedar lumber and US Douglas fir prices (expressed in yen) This coefficient is 006
A Model of Price Formation and Trade in Japanese and North American Softwood Markets
previous discussion of trade policy supports the argument that the log trade between the US and Japan serves as the focal point for all forces affectinO two independent lumber markets Japan does import small quantities of Canadian lumber but this trade is restricted Consequently adjustments in Japans lumshyber economy occur without the stabilizing benefits of trade In the second lumber market free trade occurs between the US and Canada The log trade between the US and Japan retlects developments in North American lumber economies on the supply side and Japans lumber market on the demand side However no connection between these two lumber market~ exists unless Japans trade restriction is relaxed
This section examines the effects of Japans trade restriction on prices and trade tlows in log and lumber markets It is shown that the lumber restriction has the following effects
(l) In the lumber market Canadian trade with the US increases but Canadian exports to Japan are reduced Prices increase in Japan and decrease in North America
(2) In the log market trade between the US and Japan increases Prices may either increase or decrease
The assumptions of this theoretical model are (] ) Canada is the sole exporter of softwood lumshy
ber to Japan Moreover Japans imports are restricted by trade policy and cultural factors these restrictions function as a quota on lumshyber imports
(2) Free trade prevails between Japan and the US in logs Moreover the supply of logs that the Soviet Union offers to Japan is perfectly inelastic Thus the US takes on the role of residual supplier for the Japanese market exshypanding and contracting exports as conditions in the Japanese market change
(3) Free trade prevails in the US and Canadian lumber market
(4) Canadian log export is prohibited (5) Domestic and foreign softwoods are perfect
substitutes
Figure 2 Price formation and trade in North American and Japanese lumber markets (free trade and quota)
q
ES~
(a) US domestic (b) US-Canada lumber trade IC) CanadamiddotJapan lumber trade [dl Japan domestic lumber
Figure 3 Price formation and trade in the united States and Japanese log markets (free trade and the indirect effects of a lumber quota)
Qi U
Ib) USmiddotJapan
PLOG
PLOG0
lal Japan domestic log supply and demand
Figure 2 depicts demand and supply fclations 111
the intlrnation~d lumbcr 111~lrkets under rather hed conditions The economic linkages ill 111
Figures mel 3 an not meant to eXllJllst the reality of these cOl1lpLx markers but to highlight the forces at work in the pricl determinatioJl ln)CLS~
First comiekr the lumber l11drktls in isolatiol1 Panel a of shovvs the uS dometic demand and supply fUlhtions for lumba The rUl1ction E[)~b in panel b IS the excess demand formed by interlctioJl of S~s ~ll1d D~lS in panel a The function in panel b is th excess supply of lumber offcred by CnClca on international markets The Japanese domestic lumshyber market i illustrated in panel d with Dmiddot1 mel S~ An excess demand relation for ILimber by Japan can be
I An gcbraic IrCJlOlcgtnt I prcsentcd in Applndix B
tade S domesic log supplmiddot and demand
deflved from t11lse 1unctions as is 110Wl1 J~ ED~ i-
panel e To c1osl this Systelll the exeess supply urve for lllmber facing Japan net of the US and C~ll1iLlian markets al1 he construlted is the hortshyWI1Ld ditfercI1e betHcn E Cilhl LS~ ES~ in
c If free trade prcvaih ill the lumber l11trKe the inkrnitiollal would be estlblished al PLUMe in all three markets
However free trade does not prejil in the iLllll shy
ber market III panicular Japan irnposeamp Wlllt ashymounts to J binding import quota on lumber shown in panel c as q The dIeet of this trade barrier is to raise Japan lumber price to PJLCP and to lOWer Canadian and CS lumber prices to PUSLUM Cmdshydin trade falls by amount but US purchaSeS from Canada incriase by - pl8te (b)
Now let L1~ introdule the log market into this cllsshycllS~ion Figure 3 illustrates equilibrium in the
Variable Description Units
()DSJ( srJtuoc lumber (sav ilmiddot 1000 middotiJod lpprcnr
OlSJ 1 sulwuud lumber (aVll 1000 voudt JUIllestic
r tljXlJ1 suttwooc 1000 venee
OIL and i 000
l1urkLt The Jj)vanhloping supply of logs L)fTcr~d
by tht (S (15() ill h i~ derild from tht Joshyme~tiL lo lipph (SIC) and demand (De) rtiatJons in
c Japall sf ckmancl (LD) is [ormed from thL dOllHtiL lippy (Sl ) ~llHI dLI11Cll1d (D I rliJtions in ~ SlllLe fret trade prtIIls till log l1larklt ticals at priLL PLOG nd tht amount QILT III logs is hipPtd from th~ LS to JIlan
Thlt lfkcts of the lumher on the kd II abo ~hcwl1 in Figure 3 re~llib 11 the iltnj1itJtl(in of till ckrivld lkmand
Dl aile fitaily these dowll~r(kloping Clntgt ir~ tOll~lnltted un the agtsllmption that proshytt~urs lkli(d dCillmd for lugs II1mt be satisfied
thimgc the profitability of doshyand art represented by movenwnt
dCIl1~llHj uns Changs in lumber prile~ abo I11f1Utl1ce the prorit~lblity of d011le~til prclssing but nPJ~tl1tld hifts in thl log ueml1d ~dltmiddotdl]- ( i) Imposition of thl lumbLr qUO I Ii iI1LT~ise L ILimbL and GIUSl
111 ottvd llt1 Jl1d tor (]) to D in (~ i I lorth Amaican lumber pnt(s I i billkvird Sllifr in llS prUCLur dcnnqit del1lC1l1d for logs I De to
DlS in ( I Shitt i 0 dlIT1Ulli lll-duk I re-llit III st r uillaml i EUL I lind murl ahundant SUPl liS ) on luI gn 11arkds in (31)) Thefl shyfore tll lurr qLiut~l dl iihT(ii trltk l indishyLaltt LJ III 1_ I IlovILlL pn either inLTtib 0 (kLTcccY dLjxnding lill ILL 11l
tudL )f the Ilitl in Jaliln t (lllllillid [mel r ll Tht LaC Ctl rewlihly strong shilt il]
JaPdiS ckllialld i llU j 13 the 1l1shy
LTeil( to P L 0(
An Econometric Model
A OVERVIEW
This ldion (Olltil [utiorical model ul the US-JapallLsl log tLlck It L1ll thl ddennlshynans of Jlpan r (kmand but illLOlll1ls for III in CS d Canddidl1 -oCtvmiddotood 111 a r Lct
T~I hie olltilin a cUllll11(ry c) the rllatiol1silips in thi -equcltion mudd
Jlpclll m~lrkd h dCLribed b~ thrcl ~tilllakd rllation~l1i Till iumblr citmdml equation i 1 ) lllcclshy
surL the u~tllllnts of mhtr LOnSllnkrS to ill lumber prill ~incl new Ii Till lumber production responst fUl1dion I ho- procssorsmiddot rltaction to hang6 in log ltlLl 1111llblr pricls wafcs and ldpacity l~quation (4) llWaSllrlS the tOIlcrSlOI1 logs te lumber Japans I() import deshymand Stilt-lillie is the nsuit of combinitH these estishymated relations with market dearing i(ftlltitilS toJ lumber (equation 3) and (equatiO 5)
6
Table 12
11 i Japand(Jlnestil lumber cunsumption QDSJ 1 (PJLL~11 HSJRt HSltHI
(~J Japan-d()tllelit lumber produlion QPSJ 1 = r(PlLlM r middot PlLOG t lilt CAPt PJLOG
1_1)
i ~
I Iapan-iulll[lcr Iliarlet identity QPSJ i QISlCAN t QDSJ r
( ) J Jpallmiddotiumber c())wcrsion hum OfS] (QDU QDU)t
( I JIJdil-lug lmpults frum Us (idelltiry ) QILlUS t = QDLJ QPU QIUSOV - QILJO
( ) ls-Ig expurts lu Japan OIUeS f(PUSLOC 1 PUSLUM QPLlSrt
DSTRI KE I l
(7) ( and U smiddotlogmiddotlumbtl prIce relatlllISilip PUSLlM t 1(PLOG 1 HSLSr HSCAN QPLCANt
QISJCANJ
US and Japall-lug prke linkage PLOG 1 = nPllSLOG EXtt
Endogenous Variables
us wholesale pIKe
edtl- hoards ( i
PJLOC lwes~lIc
S1 i
PlSLl~l United SIJles whOlesale p mb it 5 percen
to and btl rJlldum ho Lub
PUSLOC DUligias iir wmili log S1l1bL Csterll WisllinglOf] weStern
Exogenous Variables
Variable Description Units
HSJR t stans residential 1I1i11 llSJNR 1 Lman tdn~ lun- mi1l1ll 2
re~ide1tjal HSUS 1 Ulilled States hOllslIlg lttarts 1000 lJJ1tS
HSCAN 1 Canada housing slarts 1000 units
Table 12 (Cnn Exogenous Variables
Variable Description
Japan suft v (lOct saw logs and veneerlog~ ctomeslJc
QPLUS j lrited States soflwood domelic
QPLCA1 Can~lda softwuod v(neeriugs domliL
Jmm f oftu-d Ullber fron1 Callal1~t
QILJSOV 1
fro III
Ihe Sviet tnio11
QIUO j j OOU
WJ 1 000 r
CAP
EX
WPILS
DSTRIKE
The 11Otl noclet intentions (or the Notl Amrishyem supply side are to (1) ll1t3sure LS adjustments to chmging ccs aIld (_) acount for the fact that US processing adjustment alter the US-Canadian trade which in tvrL lIScS lcljltstshyment in the North Americm lUI1Jber prile Accordshyingly the log supply relation (equation ol is estimltecl directly This equa tion me aSlIres U S processors ddjustme nt to changing log tin d I UIll bel priles with given log produltion A second beh~ioral equation (n dcslTibts the rclation btween Korth American log and lumber prices The builds on the ~lssumption of equilibrium the LSshyCanadian IUllIber trade and accounts for thL Cillatiian log embdrgo
Eqliation 8 a dose relatiol1hip )x
twetn Us and prilCs Thi equa tion builds on the assumption frft track in lhL
market Log ~upplies are taken a- perfectly inelasti (nogshy
enous) in all three countries It reasonablt thlt to) supplies arc pusitively relakd to prit in the longest run of our theoretical exerLisf (Figure 3) a sllstJined price increase for example calls for increases If leat with rotations on a given ncl base mel mav also induLe an investment in more land uced for log production A thorough econometric
7
5 mue nf holale j U(O
A dUl1lcl variable w hieb (OUlil S
fortle1 effectsuf(liel West (ltlast dock rike t = I
I md l() ]q-= ncl otherwise)
Units
[000
i 000
1000
1000
1000
i1Olvltr must tilJi dh StlLl other probkms ~uLi1 CiS the short-run llonomk problel11 or marketing lutur timhf I ~7 I the fonls afflding ineTI11tl1t in future timber l reror~staiOl1L and the rules )ocrning management of pullic forest 1~II1(ls Such an tl1~1 IS the SLOP~ of this inVLstigltion
B JAPAN
lation oi ~[ll1dard lIltit)J1 ~illd guided othtr
11I1lt1ti0I1 to J1l~lrkd~ yielded ~ais-fesuJ ts
nspons es1 i mt tes SltllC1ltrd 11lCury In gll1trJ1 dLshy
middottput input priLcs for a facshyturs and quantitics cf fiJcd inpuh (11 In most forshyest ppliGitiul1s ) md abor ac Likcn igt lrilbll factors while proClssors capital lok 1 (1 ~ 22)
l~Timatcs llClr rlspOl1Sl 10110 [his get1Td its 11lClSSan to be war~ r ((lures of Japans w)od ing i rid pro Ltssing pandcd the I C)60s am no
I Illllsure ~ I~libbl( Thus a Pkil~ illtil ws d with Klcins 1r(I1J through rllaks metl1od Stcond lolinearit) among lumblr and Ce data made cqimatioll of (cetTishylIe]s dililllt In inincr lTlr(siol1s ali thrll
s bd 1ccorrlLl Sie~L but till ilillbcr C~PS)lbe d~ small r~lltil ro input pricl llatlli shy
tJl$middotmiddot ALLmdl in]ut pnccs vcr comhil1ld tll
Tlle hest Slt 01 v on WltfCS and thc log )lrl- II1dex WJ ubt]il1ed by l11inil11izine the ~111l1 01
1 T I ~ 1sc llrl( lrrors Ll 10 lOmg eq loa tlon lst Imake wilh Il~st squares wa~ the bcst of sClral similar
tions I) QPSJ 2r 147 -- 0 l8~533PJLU
(336) I ) 77)
(456 i 11584)
DW == 106 s=
u indlr prolil
or (1cgrC llfO in produl and inpu I j 2 ((jn-tyulntly al~ ~ontrailll dri1Cgt ~~pprup1JIl
ur produ-t ~Hd inVli~
gt 1= 1 cQPjmiddot lL r~
CQ the [qiclt) III OUlut le)1 wiligt r~pcct 10 th~ pri(C ()[ oulmiddot put rP h r nUlput Qi it11 rcpcc1 [() th price the j
th arJJbk llj In pril~ clastiil) eceeded the JUn
where Equation 2 below was the best of these formula-
CAP == a capa(ity index
CAP == (- 53532625 + 1246125T) 32750 if Tlt70
I ifT ~ 70
note QPSJ (1970) == 32750
PI clt prje index for variable eost items (1962 100
PJLOmiddot~ 03-~WJ== 065 G + ) 198
Dependent variable mean 28058 Historical period 1960 to 1976
Lumber demand origmates in the construction indllstn Thus lumber consumption should depend on prices of lumber substitute inputs and output Ii e hOUSlllQ or non-residential construction prics) Empirical st~ldies of lumber consumption typically relate consumption to prices of substitut inputs llovcer output quantity measure (building starts are used instead of building price Additionshy
some investigations account for the different lumber reqllinl11elts of commerlial and residential ~omtrucrion b the use of sllch ariabJes as separate residential and~ non-residential construction or ratios of tlwse Iaridbles
Attention to characteristics of Japans market should enhance the dna lysis of lumber consumption First it is low quality hardwoods (Juan) and non-wooden building methods both substitute for sotwood ll1 buildings Second the composition cf Japans blilding actiity switched during the midshy1960s In the early 1960s most building was intended for non-residential use but later credit for residential construclion was more plentiful and building favored residential construction Accordingly one should account for the effect of this change in building comshyposition on lumber consumption
Several sets of explanatory variables for explainshying historical yariation in apparent consumption wre considered Experiments involved comparison of n0111inal and real prices alternative responses to rcsiden tia I and 110n-residen tial construction and tests for substitutions between hardwood and softwood lumber consumption Regressions litl1 real prices had iovver explained variations than analogous specificashytions with nominal prices Also when luan lumber prices were included coefficients estimates were small relatin to standard errors It is difficult to conshyclude that this ~ub~titLition does not exist since the simple correlatlOl1 between cedar and Juan lumber
ces was around 096 Colinearity problems also precluded measurement of separate lumber responses to residential and non-residential construction HowshyeveL regressions with total building starts and the proportion of residential to total construction yielded reasonable results
8
tions (2) QDSJ t 12468047 - 02850614PJLUM t +
(165) (302) 028
8424076HST + 21974600 HSR (708) (1232) +045 039
R2 == 08238 DW 08693 S 184069
where
HST = HSJR + HSJNR
HSJR HSR == HSJR + HSJRNR
Dependent variable mean 888067 Historical period 1960 to 1976
Most statistical properties are acceptable Coefficient estimates have correct signs and t ratios indicate sigshynificame or contribution to explaining historical variation Also a high proportion (8 percent) of consumption vanation is explained However the Durbin Vatsoll Statistic suggests that unexplained variation ma not be due to random elements Several possibilities for exduded systematic effects exist First the pattern of residuals switched from positive to negalive in the mid-1960s and this change correshypol1cCed to a nev composition in residential and n011shyregtidential building Thus it is possible that some structural changc ccurred at this time Second the inlluence of lumber inventories is buried in apparent consumption data so cyclical inventory adjustments could account for the residual pattern
The relation between log and lumber markets is given by a simple regression of sawl1wood production on apparent sawlog consumption This approach is justified on the grounds that there is a fixed rate of conversion between logs and lumber The exact specishyfication presented here employs cUlTent and lagged values of sawlog consumption since it is likely that imported sawlogs are not processed until a later date When lagged log consumption was included with curshyrent consumption R2 improved slightly but the sum of current and lagged coefficients remained fixed around 085 Equation 3 belowshows the results
(3) QPSJ t = 27660964 + 060467347QDLt + (131) (652)
O24336772QDL t _1 (301)
R2 0942 DW 116 S 84041
Dependent variable mean 2888487 Historical period 1962 to 1976
B THE UNITED STATES
The US excess supply of logs is by definition the difference between domestic supply and demand
In general then log exports can be expressed in temlS of variables that influence domestic supply and deshymand functions In the statistical analysis of US log exports domestic log supply is taken as given Processhysors log demands depend on log and lumber prices wages and processing capital
Preliminary estimates showed that real prices exshyplained more of the historical variation in exports than similar regressions with nominal prices and that wage rates were not significant explanatory variables Additionally it seems that the prolonged west q)ast dock strike in 1971 had a substantial effect on US log exports This finding has been confirmed in other studies of trade between the US and Japan (7) Accordingly a dummy variable has been induded to account for the effect of the dock strike Equation 4 below shows the results of estimation (4) Q1LJUSt = 24716578 + 9736503PUSLOG t shy
(330) (373) WPIUS t 122
63801 66PUSLUMt + 017873QPLUS t shy
(104) 069
WPIUS t (304) 377
242494DSTRIKEt (195)
R2 0793 DW 151 ~
S = 1590
Dependent variable mean 74909 Historical period 1962 to 1976
C EQUILIBRIUM IN US AND CANADIAN LUMshyBER TRADE
Much empirical analysis of price behavior begins with the notion that supply (or cost) and demand (capacity utilization) forces both to playa role in market pricing 4 This principle is applied to the probshylem of estimating the relationship between log and lumber prices for North America The basic building blocks for the price equation are (1) lumber supply and demand relationships in Canada and the US (2) the assumption of free trade between the US and Canada in lumber and (3) an embargo on log trade between the US and Canada A linear relationship is developed with the North American lumber price as the dependent variable and the price of logs housshying starts in the US and Canada Canadian log proshyductiqn and the quantity of Canadian lumber shipped to- Japan as independent variables This relationship is applied to time series data for the 1960s and early 1970s
Suppose that (1) US and Canqdian processors face the same lumber price (PUSLUM) but (2) Canashydian log export embargo drives a wedge between US log price (PUSLOG) and Canadian log prices (PCNLOG) The lumber production (QPSUS) conshysumption (QDSUS) and import (lCND) relations of the US market are
4 Nordhaus provides a review of some of this literature 120 pp 34-42)
(i) QPSUSt = aj + 131 PUSLUMt 11 PUSLOGt
(ii) QDSUSt =ai PUSLUM t + Y~ HSUS t
(iii) ICND QDSUS QPSUS tt t
Similar production (QPSCN) consumption (QDSCN) and import supply (lCNS) relations are given for the Canadian market
(iv) QPSCN t Ct + ~T PUSLUM t YT PCNLOG t (v) QDSCN t PUSLUM t + 12 HSCN t
(vi) lCNr QPSCN t QDSCN t QISJCA
where QISJCAN is the level of Japanese imports Since the Canadians embargo log exporL domestic log consumption is to production Given that log supplies are assumed to be perfectly inelastic Canadian lumber production is determined by log production Thus equation (iv) can be rewritten as (ivr QPSCNt aQPLCNt
where QPLCN t Canadian sawlog production The lumber market equilibrium price relation is
obtained by developing lumber import supply and deshymand functions assuming tha t trade equilibrium occurs so that an c(pression that does not contain lumber Irade C211 be developed and rearranging The US import supply is obtained by substituting (i) and (ii) into (iii) to yield
(vii) lCN tD (a~ al) (pj + p~) PUSLUM l +
11 PUSLOG t + Y~ HSUS t
Similarly the Canadian excess supply funltion results from substituting (iy) and () into (vi)
(viii) ICN~ + QPLCN t + 135 PUSLUM l -
HSCN t QISJCANt
Assuming trJde equilibrium (lCN~ = lC1-Y) (vii) and (viii) can be combined to obtain
I I Ox) PUSLUM t K + 1 PUSLOGt + 12 HSUSt
12 S72
QPLCN t + 12 12 12
where S 12 til + ti1 + Equation Ox) gives the theoretical basis for anashy
lyzing log-lumber price relationships The relation sugshygests that sans shifts in market conditions log and lumber prices should be positively related Furthershymore given log prices lumber price should increase with demand expansions in either country (HSUS and HSCNJ or supply restrictions in Canadian markets (reductions in QPLCN or increases in QISJCAN)
Estimates of this price relationship yielded satisshyfactory results In equation (5) all coefficient estishymates have correct sign t-values for the explanatory variables indicate significance or contribute to eXshy
plained variation and a high proportion of historkal variation is explained
9
(5) PLSlUl1 ~4lt)h04 + 057 2~ 1 PLSLO(t + 18 C))
5 HSlSl + 0130093 HSCAN t (270) (120)
+ OOOk34x OISJ( ANt ooooqP ~lt)5 QPleAN) IjO()1 1~7 I
R2 = 7raquob DW 3 S 515
DependtlH variable mean 98 i l-Ibtorilal period 1962 to 1LJ7(1
E USmiddotJAPAN LOG PRICE LINKAGE
BeClllse or the Cree log tLlde pricl differtl1l~ bmiddotshytwecll Japan ~ll1d the US should rdlcLt transshyportation Lhargts exchangt rilles and qllltility diflershycntills This close rclltionship i approximated
of hpan ~ PIllC on the )lt11 eq~l tnt thL liS
Ihl PJLOC 1 4S25 -+shy
OOCJ3~25 3h (PUSLOC I Xi 11 CJ 1q I
DW = lh4 s 0
r-1 i~1 )ri ~(i I 19htolq7(
Impact Multipliers
~lujt IllClS11rl th o~ra (tTc r that de- out~idc the
the i1~ihsi section dcniOnstrdcd that n icrcdsc in Japans l(Jl1shy
strlcilC~ -I1cOuragl- dornestil iU[T1bc
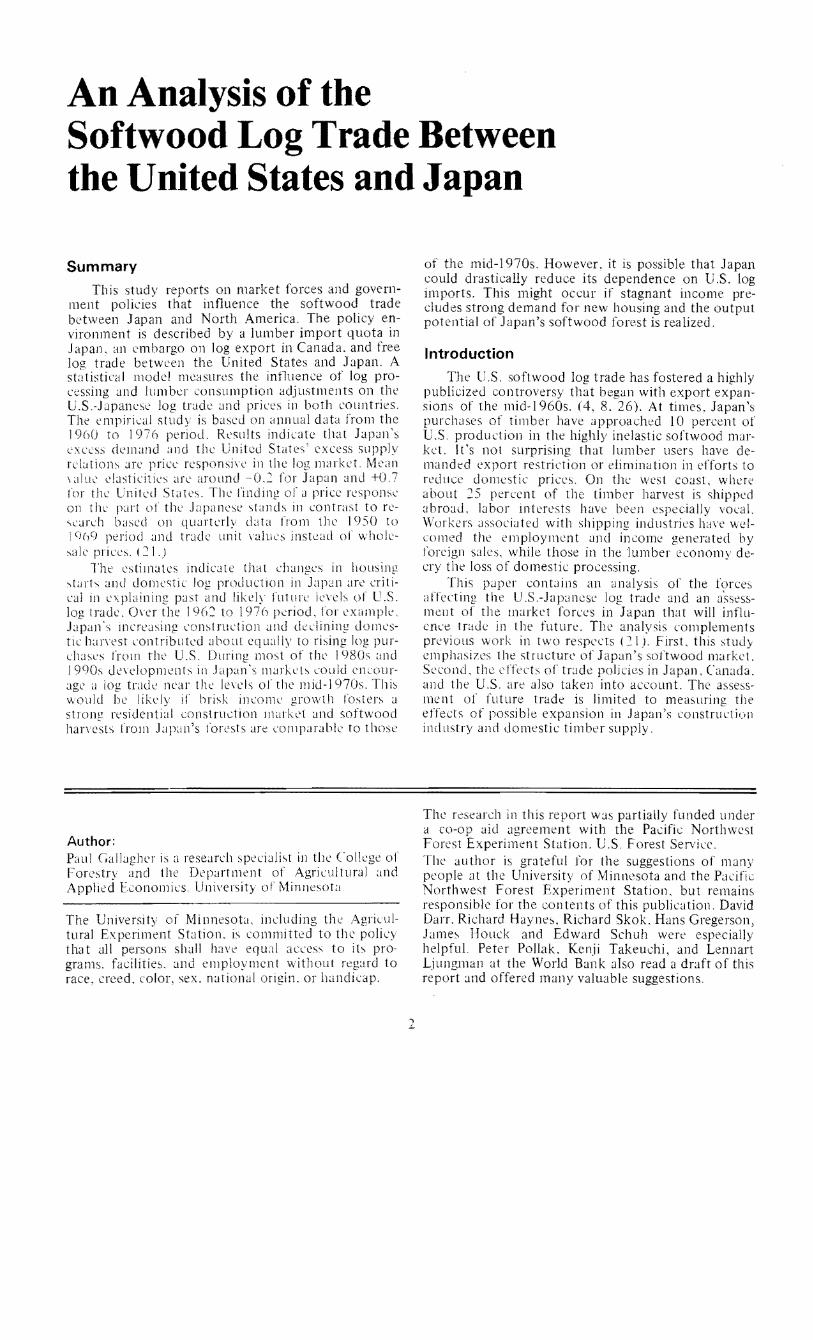
Table 2 Impact lHuitiplieTS
MuJipliers provide u method of accounting for u ~eries of stcondar) tffeLts in the eXdlll ex panshy~ions in dOtn(slic lumber consumption an lt1l(0111shy
pJIlicd higher lumber and productIOn In Turn log prices arc bid up and the US provides more
to Lpun at tht highcr prile Higher lumber prices vQuid [ISO oC~ur in rth America beldLlst logs arc dihrted from domegttj( markets shy
The uitiplin (imale of Table ir base(] on The srJtistical rdatiollShips of the previoLls sediol1 An initial al1d trade l(uilibrium is rtpre~ented
equation i I til (~I for 1 eve of variu bL A second level is
ror the ast where one lxoenous t~ tlLm in the iir sOiution
(iatil tiut tillre J
ion (i nd
[nilS )f trllk hmn The lorr(~poncl
shy ~Hbuattd il
td ILlmlllf il JJpal1 II ~ s domestic lUllshy
r lnlding cOLlltries To the riyc r~hiticn betvvtt71
ti1C)- lstlllla tes icuLr prIce
quan
U(shy
J ltLll1
1972 base olution
QDU QILJUS PUSLOG PUSLUM PJLOG QPSJ aOSJ PJLUM
Units 1000 m 1000 m S mbf S rnb i 1962=100 1000 m 1000 m vim Exogenous value variable Units 1972 value Change 1972 421870 111870 1191 11748 1440 323440 33309 339580
-------~----- --~-~--~-------~~-- shy --~
()I~J( I (JO( y65JI ~ )fll - I I
QILlS() I (l(I(1 n~ flU I ( i 0 2) ~f(J- lt (lfl)middot
1I1()(j I 701n ( h I I - np1 I ~lraquo iOPLi
()PI lS LOOO i IhlJL-l)J i i 04 I - (t+J (Ie I i o~~
IOPt( Ai I CtHI i 11 til I i~ UO( U(1 i ~ tH
HSJR ill 11 7
(j i 95 9(4 ~2
11IF Lll 1n 1091 i n I jJ i i~ 1~ i b2h
H s I t)(l U) ~Iil I -~j
HSC U(li 2411 h25 i J)~5 115 191 -I I
~ -1 1filiO lO middot-36 9(middot -](115 - 4 ~
Yen mp
I X Yln 3()3IU[I 10 ~I is 195 -1 -----------~--------~~~---~~
10
19hO O~51
iii
j l i IlJ2h
A THE NATURE OF ADJUSTMENTS TO CHANGES IN JAPANS MARKET CONDITIONS
il ItllS1Il ot nd trck l([just nol(ortl1 I past rspol1se to hmgec ill
economi llI1ditiullshy
il US~iOll
Th
1rb T of 4 than ILlf hi lldrL( r
Fililn non II is i1cn
Lstmenh In rIll dj~~
(rAIT n ilnnluh I
ltil11br will Her Lq)~tn 1 hr Til ~rilll 1 T lhk indiCik
lrk elir t~ 1 [11 l ll(-l s t tumshy
b[ 1rl(k 111 ral in t l S 111 ~ji]1S ~lLti I
1lldrkeh 1 0 mil]k 111 lllr i (QISJC i
t h__bull
ccn ~tn tP~lll dorIIliL COn~Ullplil of ~73 111il1 111 3 nld 1 1coudion citJl1ltic ltmhlr productiu (QPSJ i uC 4+ mill Rtdll(Td 00111shyti PW(i-ii1g il1lpEc~ mill ill III d(lllltq log ljjQm ll1d porh irul1l the ( S ((jIU I Japal1ee lu miltr (PJ L UM i la II ( 00 ~ 11 ~ 11
(1 jwrcn1 iUl W 11101( tiflll upph while (lr1 AnlCricm lumher (PliSLUM I (S7gt- 11m) I
~Thl~ (--tirn~ dnhHln~ wilh Lt1CHi~tiJn 1- l-uod rlquif-nhr t ()nd~~n houl tJk~ ~buUl I ill ltif lUintilr whiI h-e ralPv 1-11shy
~O fH[ liti1 (2J L in I 2 ~d--I~ r -1l Plshy
111il II] ~nld -(t11 i-pro~middot~--cd
in~r-middota~middot ]]1 (~ln~1dljn IttI11shy
TI t1mul
ur (1 perccnt) dUe tn lumber iupplies divCrted nrll1 AIllLTic~lll marktl fin lug would fall sligh (1 lernn hCllllse the shi in Ltpancse dlIlLl11d letd~ th log supply shift in orth Amtricll lultig 1)111 h cr [umber pnLC~
S WHY DID JAPANS LOG IMPORTS EXPAND DURING THE 1960s AND EARLY 1970s7
1( famiklr WIth the (ill oi1Cidcd ith nshy
dOllllstl proshyduction and nhrC fJurabk tcr1l~ trade b(1Icn
al1d lhe US Om Lctor that t 111e parshyotler this If(nd w~ llh xpansioll of
ClldJian lumher cport~ to Japan Th llli
pnvide ncii(ilicn of hem iI11POrt~ll1t (~ld1 ul tbc~e f r~ ctT Sllh~ the htIlgc in bltwcen
hCfc R
6QPLJ+4LJl()56HSJR+ 13714 95if-X 50()1 ISJCAN + R
llOUI ti ng tororrll in1trican sllppl hift~
111)2 ariJhk eriou L1Liors till lhange i q(~ and 1C)7() l~~Ul be lulcushy
(k~ over 1h is tillle
-GIUlS
and random fkcts and 6 indicates
= AmiddotllJ IOOC n3 I
1
gtO~( 11000 3rT ( lCJOOOOO m2 flcor reu I
43 A f 1000000 El ilcor IIllI) dcn~ll)
IUK 1 01 000 [113
16 pl~rCe~H
nect~
122 perCllt)
Possible Developments in Japans Market Conditions and Implications for US Softshywood Markets
Future traj(r bne~ depend critically 011 lonshylillr 1ion and clonwstic oftwoud harvest ill
JaPlI1 enario for tilt l1Ct 0 years rtngl from q markh fur new housing and ahu1JdanT riml1er l1inesl to ~trong COl1stnlLtion 111lt1rshyklt and tores1 lutPlI ntar the luw lcvels of tht ] )lk Thi~ SCdiO1 lolllains a di~llssion of faclOr~ that m I Ie in1utl1cc construction and timber hanest ESlimltes of reilsonabk bounds alsu afe preshycenkcl HOll~il1g start are based on preshyviolls research f 21) while ~peculations on future roundwood (1 ~lre basd on crude inventory irowth modd for LIpans priatcly-owl1cd forest The
11
sctmlrios suggest that at best US log trade wiII show a slight gradual decline over the next 20 years On the other hand Japan could stop importing logs from the US by 1990
A ROUNDWOOD OUTPUT
of long-run harvest potential start with tlh Japan Forestry Agencys position that by tIll 200 dOl11estil round wood rroduction will be t 25 time~ the levels of the mid-1970s (14) ~orth AJ11erican opinion seems to doubt the full magnitude of this production increase but not the fact that it will occur (0 25) The North American outlook ror the interim and the species-composition or future supplies seems less certain One author hlts stakd that the trough has been reached and that within the next fin yeJrs harvest from the domestic forest in] CI pa n will i n ~Tease Less has been said howeyer lbcllIt the factors that could influence the magnitude timing and species composition of these output incrcasLs over the next few decades
My intentioll is to present a preliminary discusshysion of ~onwood output potential for the interim pLrioc1 (prior tu 20 10) based on a rather casual intershypretition of thl available JapJI1esc data First some importnt lh~lrackristics of Japans po~t war reforestshyJtion m dislmiddotll~scd Then some plmtsible softwood hlrve~t ccl1lrios 101 the next few decades are preshyslntld I Lommen t 011 some economic forces that COllid in lienee timber harvest schedules In parshyticldar it i argued that future output potential will Lvor ofrwood at the tOxpense of hardwoods Also Japan softwood prod udion could work to displace Imporh hy tile (rly 1990s at the lower end or plausible harvcst ages Finally stand ages could deshypend 011 prilc prospects with f(llling prices encouragshying elrly hlrv~st and rising prices favoring the harvest of morc matur timber
1 History and Situation
Japans artifiLial forLsts are the source of fltture production potential These forests are planted with sekctively brcd seedlings krtilized and periodically thinned In 1976 thcse forests comprised about 40 percent or Japans forest area and contained about 35 percellt or national inventory volume Virtually all oj this roret is planted to softwood and the bulk of this and is privately owned 1975 data indicate that the privately owned artificial forest accounts for 30 perccilt of Japans total forest area
Historical data also indicate that Japans investshyment in artificial softwood forests has come at the expense of natural forest and future hardwood supply potential During the 1962 to 1976 period the total forest area has remained constant at about 25 million hectares However artificial forests increased by 23 million hectares and natural forests declined by an equal amount over the same period (Figure 4) Afforshyestation and cut da also confirm this tendency During the 1972 to 1977 period about 85 percent of
12
the reforested area was planted to artificial softwood forests Meanwhile 80 percent of clear cut area was natural hardwood forest
Figure 4 Forest area in Japan by ty~ 1962-1974
AREA (Mill HAl
~____~___~__~~_~ Total250
200
150
100
50
Artificial
62 63 64 65 66 67 68 69 70 71 72 73 74
Figure 5 Age distribution of non-national artificial
500
1400
1300
1200
1100
( 1000
c 9000
0 0 ~ 800
1i 700
0 laquo 600
500
400
300
200
100
forest in 1975
70 75 65-70 60-65 55-60 50-55 45middot50 40middot45 35440 30-35
Total Area 6915 tho ha
-- I I I
Cmiddot5 6-10 1-1516middot2021-2526-3031-3536middot4041middot4546-5051middot5556middot6061
Age (years)
Table 3 Japans softwood roundwood production - actual ( 1975) and projected (1975-2000)
Million cubic meters National harvested from
Actual forest non-national forest lands land Total
1975 3099 1777 2086
Natural Artificial Projected 35 Yr 40 Yr 45 Yr 50 Yr 35 Yr 40 Yr 45 Yr 50 Yr 35 Yr 40 Yr 45 Yr 50Yr
1975middot80 310 405 773 1054 1216 1681 1313 1032 1170 2086 2086 2086 2086 1981-85 310 405 773 1054 1216 2146 1681 1313 1032 2551 2454 2376 ~ 48 1986middot90 310 405
- I J 1054 1216 4771 2146 1681 1332 5176 2919 2735 2529
1991-95 310 405 7 7)bull 1) 1054 1216 8819 4771 2 46 681 9224 5544 320 2897
1996-2000 310 405 773 1054 1216 10943 8819 477 2146 11348 9592 5825 3362 2001-05 310 405 73 1054 1216 9815 10943 8819 47 I 1022 11716 9873 5UP 2006-10 310 405 73 1054 1216 7787 9815 10943 88 I 81 g~ 10588 11917 1003
The private and local government investment in artificial softwood forests is primarily ~1 post-war phenomellJ (Figure 5) Area planted before World War II h~ld timber that was at least 36 years old in 1975 This area comprises a modest 10 percent of the non-nationaL artificial forLst area Large investment began during the 1950s and early 1960s a period of increasing consumption and heavy domestic producshytion Timber between 11 and 25 years old accollnts for 479 percent of the forest area Substantial investshyments continued during the import expansion period (1965 to 1975) Timber in the 6-10 year age group accounts for about 35 percent of the area
2 Prospects
The prospects for increasing supplies during the next few decades hinge on future replunting Jctivity If the present conversions from hardwoods to soft shywoods cease the longest n~n softwood supply prosshypects will discourage heavy cutting from the Jrtificili forest that was less than 25 years old in 1975 If the conversion to softwood forests continues though it is likely that the area with forests presently less than 25 years old will be harvested as it nears maturity Furthermore plausible softwood rotations are beshytween 35 and 50 years (15) Consequently dramatic harvest expansion could begin in the late 19805 I assume that conversions to softwood will continue The estimates emphasize potential developments of artjficial forests Thus future roundwood production from natural and nationally owned forests are asshysumed to remain near 1975 levels
Future roundwood production on artificial forests is computed as the product of standyield and al1l111ai harvested area Annual harvested area estimates are developed from 1975 age distribution data (Figure 5) With an eye towards developing a lower-limit potenshytial for expansion three conservative assumptions were employed
(l) Annual harvest is evenly distributed within the five year age groups specified in age disshytribution data
13
C2) Area that is presently beyond harvest age will newr be harvested
(3) Softwood stand yields an hlld at avrages for the emly 1970 regardkss of the stand age lssum ptioll
This volume cstil11Cl te (3687 m 3 htc1are) is Lonshysistent with the emphasis on gauging the effects of changes ill harvestable ~lrea6 All other things being equal failure to accollnt for harvestld timber mashyturity will produce underestimates for older stands and overestimltes for younger stands On balance however this is probably a conservative yield eqiiJIate since part-cllt areJS and IlSS productive government land 3re indlldec1 in the computation
ROlndwood prollctiOllS based on this method LIre shown in Table 3 The levd of projected OLltput for the 19 5 to 1980 period is indicated for four mashyturity assumptions hetween 35 ~l1d 50 years Changes ill output arise only because of increased harvest on nOll-national artificial forests Production from nashytional forests is held at 1975 alucs Also harvest from nOI1-national forests is held at 1975 v~tllles which imply that 1975 actual output is equal to projected output for the 1975 to 1980 period These estimates indicate that increasing softwood supplies are plaushysible For 35 and 40-year rotations output doubles by the early 1990s Under longer rotations (45 or 50 years) however significant output expunsions would not occur until the late 1990s
The harvest age should depend on economic COI1shyditions especially 011 the private forests (27) The expectation of rising timber prices would increase the gain from holding timber for future sale This would tend to increase the 11arvest age for exampk to 45 or 50 years On the other hand the prospect of falling prices would make the postponement of sales less profitable This would encourage shorter rotation periods perhaps 35 to 40 years
6 The area induded is clear-cut lreu on all natural and artificial forshyests regardless of ownership The historical averages from the 1972 to 1977 period were used for area and roundwood prodlHion
B HOUSING
Residential construLtion in Japan expanded drlshymltieally in the I 060s and early I070s in response to I housing shortage tlcled by population growth rural-to-urhan migration mel househuld lIl1l1oubling A~ of the mid-I (nos hovvever the nLlmber 01 aaiJshybk lInih hl~ lome into line with the l1l1l1lb~r of hOllSLhold~ 118) Conscquently future inw-itl1lel1ts in llC houing wOLlld take th~ form 01 quality improvcshyl11lnts d Ilew hOllseholds For example therL is a high potultid for repbling cklapiciatcd housing that was Lumtructcd 1I1 thL ]950s Also the size of the typictl dwelling is small by Anwrican stanclards so average floor space coule cont111W to lllcrease Finally ltistorial trenes away from n10re than onL ti1llily in I dwlilillg LoLlle Lontinue
Uedls relfnt report on Japanlt housing requireshymcnts fclure~ projeltions of new housing investment based on demographic and eLonomic radors (24)
Thi study built on the premise thut increases in 111
hOLlsing (S) consist of three ~elarate Lmiddotompol1enL S1 = h1 + Yt + rt herc 11 increJst in thl numher of hOLlsehold~ ~f increlst in the number of vacant units rl illLTCdSC in the numbn uf remoyals
Incrcase~ in hOllSdlOld formations were projellld orl the Insis of Jel110gnphiL data and Y~lCanC) rates JSshy~llJned a (Cntilluation of past trcnds Increases in removals were considered responsive to per capita income (or GNP) and the interest rates chargee on
financing new housing Thus removal forecasts were lClsed on assumptions [ur GNP growth and intcrLst r~ltls Under a high growth assumption annual GNP increases were bctween 65 and 75 plTcent A low growth as~umption featured GNP increases between 45 1I1e 30 percent Interest rates were held cunstant 111 both Lases
Although Ueclcls studv emphasized the number of available units ~ targd Inel uf tloor spclLe from ~urVly data was cited and it WJS assumed that this floor arecl would bc rlalizecl by the end uf the I Q90s This assumption ~l1nOllnts to a 20 ~1LrLent inLTcase in ~lerage floor spaLl by 2000
Table 4 contains Uedas housing unit projections for hi[l1 and low [JOwth )cerarios assumptions Ibout the increase in jerage tluor spacc and shows tIll comTrsion of these projections into the total floor area for 11lW housing The low growth housing unit fOf(ast is combined with the aS~lmption of a 20 pershy(cnt increase in loor ~ma by 19RO The high growth Iwusll1g unit proiection is combined with a 1110re optimistic projccti01~ of averdge floor area (30 percent incrClse by 2000)
C LOG TRADE
The Ljf_t of dCicopnwnts in Japans log output inc new housing Lomtruction can be estimated with the impact multipliers of Table 4 Under the assumpshytion lilat no other ch~ll1gts occur the relation among
Table 4 Housing starts and floor area projections by growth assumption through 1980
Low growth High growth
Year
Housing starts (mill units)
Floor area (20 percent) (mhouse)
Total area millm
Housing starts (mill units)
Floor area (30 percent) (mhouse)
Total area millm
1980 1 5 i-no 13 2 165~ 870 1437 1981 1584 8785 1392 1676 886 1485 j 98 1644 8870 1458 I 761 9021 1589 J983 1638 8955 1467 1758 9182 161A 1984 1643 90AO 1485 1765 9343 1649 1985 1620 9125 1471 I ~ 5 7 9503 1669 1986 15 83 9210 14511 1 735 9664 1677 1987 1626 9295 1511 (mn 1 1795 9824 1763 ]988 I 549 9380 1453 1720 9985 1717 1989 1570 9465 1486 1761 10145 17 87 1990 1506 955 1438 1709 103 i 1762
1991 15 51 9635 1494 1768 1046 1849
1992 1516 9720 147 A 1745 1063 1855
1993 IA70 9805 1441 1712 1079 1847 1994 lA40 Y890 142A 1695 1095 1856 ]995 1413 9975 1409 168 I 11 i 1866 1996 1350 10060 1358 1631 1 127 1838 ]997 I 335 10145 135 A 1640 1143 1875 IlJ98 l 285 10230 131 5 (1111111 1603 1159 1858 ]999 1318 10315 ] 359 1650 1175 1938 2000 l~1l9 1040 1341 1636 1191 1948
14
Table 5 Japans housing construction roundwood production and US log trade
Under two scenarios
Low income growthhigh roundwood production Highmcome growthlow roundwood production
Roundwood Roundwood production US log production USlog
House construction (35- year exports House construction (50-year exports (3 percent income growth) rotation) to Japan 3 (6 percent income growth) rotation) to Japan mill m 1 floor area m1I m mill m 3 mill me floor area mill m 3 mill m
1976 Actucl 20lJ lOA ~O9 04 1) 1981-85 1456 255 86 1596 11 0
1986-90 1469 518 0 j 74 i 253 9 1991-95 2448 9~ 2 0 185 290 1996-2000 1345 tlU 0 1)91 336 53
1 SOurce T ace 4
SOJrce Table 3 Reducticns Jarans fmport demand C0r18 entirely at the expense of lS trde hecause of the resjd~al s-pplier assurnptior_ Thus zero trace
-lith US is consistert With several states of Japans tog trade If the assump~ion tlL27 exporting countries foreign suppies are perfect~v ifeastc s abandoned then expanded Japanese SLpply beycnd zeroUS trade levels trst mean lt reduction in trade vgtlth Fussia Nev Even more abundant supplies in Japan WOLJld suggest that Jaoan would tailte the role oi an exportng country
Jog tr~lJ~ (QIULSL (lUllChH10d udion through ti1( 19905 Lncler tl1i- ~(lnclrio tr3ck wolld (QRPJL dnd hOll~ji1g starts 15 tIl1uin stahle illcar i 0 mill 111 L t11l
]980s but would drop llally during Ih~ li~I~Q[U =0 - -i-66QPRJ + 0492LlHSJR bull oftwooJ Ilnll illlrCald Log tLlic at thl end ofUsing Il) ( lidta this ditlernct lquatioll Cli be the I()CIO would be hout ktlf thl 19 7 5 In ~l (53(Tko to lir(r relation ~lmOJlg rlKSe thrl ~irlk mill
QILJ j C) i III the sllolld s~nrio inLome g1ot11 is mor(
Tabk 5 iLustrates some llrtlllc OUkOlllCS of moJcLll perClDt) so rlplan~l11Lnt ckl1lal1u tor Japan dOI1l~sr_ lumber mClrkd and the log tl j()I IWllsing i llkc] Jnd ClOOI arl1 l do not the Ilext tW1 dmiddotcade offsd rroiLded dlLIiIh~ in ho
Under onl lln~ri() inco111l growth is brisk 6 COil qucn 11 LLlnstrudiol1 would l(I11) illld rllativclv mature (50-Ycltlrl timbr is through the 1 but lkdinl during the I Vehd In rlli [St d~)meti so Iwrvest wehde this l~kak sCl1ario w-[k lllmbr d(I1~~lnd ilt couplld
Ol1Y -Iighty through the 1980s bUl in the with the hanst of young timber i 3 L Cdtput ould e)llll til 1(nS 1c(llc~ it [cIt [n this middot~l~ cioll1lsril udioll mon than doubles
lW housing (Olhtrudion wl)uld (xjl~iI1d (518 mill 111 3 ) till mid-1 9sOs and mtI the j)lrIocL as trong rtplJz~- thrcughott the remaindn the =Otl1 (el1lliry
ment demand 101 homing 1I1c1 il1CrtC1sl~ lJl Ilour arL3 trad would delline slightly uliring thc early nffset the nUI1lbtT of 1011sehulJ formations and wish during the rtll1lindtf of ril( 20th ~l1tllry
CTlh lIHpal lllultiplltf uf Jal~in Iog production un t S log 1111 port~ is - Given JJ) 84 pllTLnt ~onv(r~ion of rotllld crod 10 akt [he cc llJl alen ( ro]ndwuud ll1ultipli1 -6439
15
Bibliography
(I) Adams Dariu M Effects of nation]] forest timshyber l]rvest on ~oftwood stumpage lumber and pJywood markets an econometric analysis Forest Research Laboratory Res Bull 15 Oregon State University 197i
(2) Adams Darius M and Richard W Haynes The 1990 Softwood Timber Assessment Market I10del Structure Projection and Policy Simulation Forest Service Monograph 22 September 1980
(3) Adlms Gerald F and John Blackwell An econshyometric model of the United States forest products industry FOII S(iellte Vol 19 No~ 1973
(4) Dlrr David R Softwood log exports the value and employment issues USDA For Servo Res PqJ P~i-OO I enS
(5) Floating exchange rates and log lxporr policy Jourlal oFoIltn Vol 5 02 February 1977
For--kr Robert B b panese forestry the 1eshy~Odrc(s industries ]lld markets Canadian Dept l)f til( Environment Info Rq)ort E-X-30 October 1()JS
f CdLigller PauL MauITY BndahL illd Michael Ll11LmiddotSkr Japan(se and Vl~t European deshyl11und lor Us wheat USDA Public WSshy4H Wbeat Situation iLy 1979
(8) Glcruln Rolf Why are our Lxported J
Porllalid lI1agoilll Nowl1ber 1979 ~9) HaynC Richlrd A derived demand approach to
cstill1ating the lin bdweell stumpage wd lumber l11Jrkets rJICI Sciellc() Vol 3 o~ Iln7
(J () I Price im padS of export reshystriction under alternative assumptions USDA For Sen Res Pap PNW-212 976
(11) Henderson James M and Richml E QUl1ldt Microlconomic thLory 1971
(I ) I10liLmiddotk James P and Paul Gallaglwr Till Price Rlspomivness of US Corn Yield A iIIcricoll UI1I11(1 of Agricillillral IC()III111shyleI Vol 58 0 4 November 19 7 0
(13) hpan Llnber Jouma Vol 12 No4 February 219 7 1
(14) JUJall LlIliberolllllal Vol 21 lo 11June20 I C)xO
(15) Japan Forestry Agency Forestry in Japan Dai Nippon Printing Co Ltd 1069
(16) White paper on Japans forest inshydustries 1977 (English edition) Japan Lumber Journal Inc April 1977
(17) White paper on Japans forest inshydustries 1965 (English editiol1) Japan Lumber JournaL Inc 1965
(18) Japan Ministry of Construction HOllsing in Japan 1975
(19) Kmenta Jan Elements of econometrics The MacM i1Ian Company 1971
(20) Nordhalls WD Recent Developments in Price Dynamics in The Ecol1ometrics of Price Determination Conference O Eckstein ed Board of Governors of the Federal Reserve System and the Social Service Research CounciL June 1972
(21) McKillop William Structural analysis of Japashynese-North American trade in forest prodshylIcts Forest Science Vol 19 No l March 1973
(1~ Mills Thomas J and Robert S Manthv An econometril analysis of market factors deshytermining supply and demand for softwood lumber Agric Exp Sta Rep No 238 Michigan State University February 1974
(23) Samuelson Paul Economics of forestry in an evolving society Ecullomic fllllliT 14440492 December 1976
(4) Uec1a Michihiko Japanese long-term housing outlook State of Washington Dept of Nat Res 1979_
(5) US Department of Agriculture Tht Outlook for Timber in the United States Forest Resource Report No 20 July 1974
(26) US House of Representatives US Trade with ] apan - Public Lands Timber Export BilL Hearings before the subcommittee on intershynational relations Ninety-fifth Congress April 4 ond 21 1978
(27) Walker John L ECHO Solution Technique tor a Non-Linear Economic Harvest Optishymization Model paper presented at the Society of American Foresters Workshop on Systems Analysis clild Forest Resource Managel11l1t Athens Georgia August 12 1975
16
Appendix A
Table 1
Endogenous variables
Year ODSJ(g) OPSJ(g) ODLJ(g) OILJ(g) PJLUMab) PJLOG(m) PUSLOG(k) PUSLUM(k)
1960 1961
212334 224810
2123340 2248100
155360 202860
8198 9630
630 630
67 7 ~ 65 72
1962 222420 2187000 293900 16870 201280 10000 611 66 7 ~ 1963 243460 2372400 313200 26360 205360 10215 62 67T2 1964 254030 248370 342370 32980 207610 9987 64Y 6658 1965 267550 262790 344650 35090 206110 10042 679 6672 1966 286220 279930 364870 45040 218530 J0403 700 6891 1967 312290 301390 394300 67670 245860 12852 734 bY73 1968 328140 314670 414040 91750 256750 13757 875 Y1] 2
1969 333970 324500 393500 85400 262500 13Y20 1078 9210 1970 338290 327500 413370 102380 255420 13692 1007 1413 1971 322920 313810 379410 77180 243330 12955 1001 Y777 1972 333090 323440 423730 111870 339580 14400 IIYI I 1741 1973 338490 325130 436430 118100 48167 0 20724 2070 15223 1974 307170 2951500 373600 98150 462500 23874 2097 1350 1975 283510 273620 359340 103830 440000 22 58 1976 13764 1976 301020 286490 377710 110970 475000 23260 2313 16798
Exogenous variables
Year OISJCANg) QILJSOV(g) QILJO(gl WJ(h) CAP EX(hj) WPIUS(j) DSTRIKE
1960 154 648 3Y60 Y49 0 1961 169 686 36180 945 0 1962 3720 11840 5520 198 724 359IJO 148 0 1963 6220 13610 5750 227 763 36240 145 0 1964 5660 17530 6240 649 80 I 35849 947 0 1965 4760 20350 6660 271 839 36149 166 0 1966 6290 25580 9000 304 877 36235 Y9S 0 1967 10900 39710 13150 352 915 36215 1000 0 1968 13470 49910 21290 411 953 36055 1025 0 1969 9470 53550 22820 480 991 35837 1065 0 1970 10790 61670 27020 548 1000 35815 1104 0 1971 9110 61650 27380 632 1000 34803 1140 1000 1972 9650 68010 25960 757 1000 303 1 1191 ~ 1000 1973 13360 78110 26030 985 1000 27122 1347 0 1974 12020 71740 19380 1188 1000 29151 1601 0 1975 9890 68950 10460 128 7 1000 29680 1749 0
Exogenous variables
Year HSJR(i) HSJNR(i) HSUS(I) HSCAN QPLJ(g) QPLUS(g) QPLCAN(gl
1960 28972 32489 12960 108858 245760 1961 35588 42281 13650 125577 260200 1312350 453690 1962 35757 40888 14920 130095 259670 1422800 512310 1963 42602 44602 16420 148624 267480 1421660 545990 1964 46930 58800 15610 165658 285620 1508040 571610 1965 53630 48670 15100 166565 282550 1537780 587410 1966 57810 51927 11960 134474 285250 1573180 592220 1967 70387 67011 13220 164123 273 7 70 1559020 589190 1968 83605 76865 15460 196878 251090 1703450 633680 1969 93971 88776 15000 210415 231730 1580250 697460 1970 104746 100288 14690 190528 222300 1564680 712730 1971 105796 91941 20840 233653 213200 1726110 735170 1972 134707 109132 23780 249914 217890 1628390 763270 1973 152421 129330 20580 268529 214190 1635000 918650 1974 114123 84430 13520 222123 184330 1570340 806490 1975 120402 75890 11710 23]456 176100 1527860 693220
Sources are listed following the data table The letter of the source is indicated immediately after each variable name n the table submiddotheading
17
Appendix A (Sources)
(a I ifiJl () ( he L ton ber 11a c [ J ~t pa n forttry -lil1Jstry No 33
1jlllhli RlJI)rT rlie Liil1hcr lJurkc LiPlII
Furcst~y li1istry 0 )95 l(f)ll(JJl(- Inkrnatiol1JI
Fdition fir P(f)duC[ Sililli( I Seri j
JJ Ln i ted -J ations Tim ber Bulkt i 1
Europe VeL 30 Sllppkmcnt ( 1111 P)(I un FOreiT
Lpctri Lumber Journal _1r)Jl ~5tari51[C uf -1
rcriL 1 Forestry ~1 ~lIlL
Y(frJilj iii F()re)f prncuc FAO U VJriOl lU(lt
~ll)UIl )flisrilai ~c([r~f)k BurC~tLl of Sl tisti~middot~
Office of tilt Prme 11111i~t (1) SI7i fics middotiI Fore i ( lriiUr F sr
PIeld cts Di~ltun ForcstnL ~usL qC
I i riiiti Finunetil Srailsfi f3 SLltiqjLS Inkrnaticllal fonltar FdlLl
~TllJCr 1978 i k) Fr dic ii Prin L
UrrIiH(sf 1(((1 Sec()l7d North(q F t Jl1U
plr imt1t Statjpl LSDA Ishy
( [he Dci))w lUI Priel SirWfi(1I Ii PI)(iilciS l)-(j 7 forest Senice lSD vli~~cilJll((ll~ Puhli_ario1 ie 135~
f Ill An nck~ of huln~L in Lpan i
LonstnhtecL LLL Cor du the
1970 DocnllCl1tatlun of dat nd The m(thoc1 Llsed in C()1l11V
index be ()bt~linlcl from urhor
Appendix B
The intention hlrc is 10 Hlutratc- tl1l~ Lffelt~ of d more restridiv juoU 011 il1c1 lumber prics The Llleds of ncting quota are tlllc]w clcl11onstrltccl as a Firll Ve Lonsickr ilk imm
in the graphical exposition of till p~lper Then the scconclan
dJlIst1l1Cnr t[1i1 lumber markets balk to ibriull1 lIh reduced form LqLlatitJ11
Two SllS )1 Lquation vllLh Ckllibe the dClI11CSshytiL softvood cLonomies Jnd North America r rht blocks for
1 f ODSJ f PHX~l 11 J QPSJ
-~PJLCl ) PLOG
(31 ) QDU Q J + J PJLLI1 J
1 PLOCr
(4J J QPU J PLOC
11 1 QPSJ (lIS
IL] = j
mil AmcriLC
Ai i PALL~1
i ~AJ QPSA A +C~PALt1
3A) QPL~ A A3 PA Lt vI
=ODSA QISJ
I hA) QPtA QDL + L
dOl11srlt QDSA a1 ood doncti~ (onslimptioL ort1
Allknl
QPSJ (1wn cod itiOIl J l~)an
QPSA d uod
QDLJ log dOllleSTic J dP~i1
QDLA j()l~ltStic Qrth Ameri(
QPUshy
PJLCM
PALL1l 1tun be- r onh Amerkd PLO( in Lipan ~imiddotd orth AmenD
sr S~i 1Clod ml)ortlt Japan I tog~ncuSl
The disctlSS oj pnL b([lavior IS Gist in term ccluatiom whith dltscribe eqllilibrium In (21)11 of
th three interrelated softwood markets Tile first rdatJonsllJp stite tint Japlttns Illlllbtl markeT is in Cq II i ibri Lim _r ro 111 I iJ L (2] I ~1l1 d (5 J ) it fo II 0 W s t lta t
18
1 ---QISJ 3 + 3~
Similarly North Americas lumber market is in equilibrium when
A A A (X]- CY 2 )2
(B) PALUM = + PLOG + QISJ 3~ + 3~ 3 + 3~ 3~ + 3~
from (lA) (2A) and (5A) Log market equilibrium depends on conditions in Japan [equations (3J) (4J) and (61)] and North America [equations (3A) (4A) and (6A)] It follows that
J J (A A 3 J 3A((X3 - (X4) - (X4 - (X 3) 3 3
(C) PLOG = L +TP JLUM +LP ALUM
where L =11 + Y~ + YI + YJ
INITIAL EFFECTS
First consider the lumber market in isolation From equation (A) above it follows that
6PJLUM = - 1 6QISJ iJ +3i
A more restrained quota or the imposition of a quota say 6QISJ = - 1 raises Japans lumber price by
_-1-_ Similarly the re13tion between the quota
pi + iJ~ mu North American lumber pricc is
6PALUM = I 6QISJp1 + iJ1
from equation (B I These lumber price changes correshyspond to Figure 2
In turn the lumber price adjustments alter the log 1113rket equilibrium as in Figure 3 From equation (C)
J A 6PLOG =lL 6PJLUM + ~6PALUML L
The log price ch3nge resulting from the quota is obshytained by substituting for the lumber pricc effect
6PLOG = lSA LSJ] 6QISJ
where SA =iJ1 (j3~ + 31) and SJ = iJsect(pl + 3J) Thus a more restrictive quota will increase log prices
6PLOG 0 I d I 1 h N I(6QISJ lt ) provlc e t 13f t 1e s Itt 111 art 1
American log demand sA is S111311 relative to the shift in Japanese log demand SJ
REDUCED FORM
A series of adjustments in log 3nd lumber markets must occur before all three markets arc in a consistent equilibrium For example the new log equilibrium adjusts lumber production plans in both countries thereby setting off more adjustment in lumber price In turn a new log equilibrium is established The
19
equilibrium that is consistent with equilibrium in all three markets is given by the simultaneous solution of (A) (B) and (C) Converting to first differences and substituting (A) and (B) into (C) yields
6PLOG = iJI [ JYi J 6PLOG - J 1 J 6QISJJ + L iJl + iJ2 iJl + iJ2
-iJ1~ 11 6PLOG + 1 6QISJ ]
L iJ1 + iJ1 iJ1 + iJ1
Rearranging gives
6PLOG = J J A A 6QISJ L - S 12 - S l 2
The denominator L - SJ Yi - sAY1 represents the sum of slopes for foreign log supply and demand schedules L gives the direct effects - the coefficients for log supply and demand schedules The terms
sAY1 and sJ11 give log market adjustment to log price that result from 3djustment in the lumber market It is reasonable to assume that the foreign log supply is upwards sloping and foreign log demand
curves are downward sloping ie th3t L - SAY~ shy
sJY1 gt O Thus log prices rise with the ql~ota
(~~igG lt 0) when SJ gt SA ie when the shift in
Japans log demand exceeds the shift in American log demand
Lumber price changes are obtained by 5ubstitutshying the expression for the log price change into (A)
or
f~(SA - Sl) J LQIS16PJLUM=~_SJ)~_SA)i -j $i + ~i
IAs before the term ----=-J-~ represents the lumber
PI + pi price change that follows from a change in the quanshytity of lumber The bracketed term shows that a more restrictive quota will increase J3panese lumber price
(6PJLUM)lt0 d d 1 I d f shy6QISJ prOVl e t 13t t 1e 111 lrect e teets at J A J
the quota on domestic production 12 (S - s ) SJ J SA AL - )2- 12
do not offset the direct effect of the quota in reshyducing domestic lumber supply (- 1) When SJ gt SA the lumber price will always increase and when SA gt SJ the price will still rise provided that the difference SA - SJ is small
C
An Analysis of the Softwood Log Trade Between the United States and Japan
Summary
This study reports on market forces and governshyment policies that influence the softwood trade between Japan and North America The policy enshyvironment is described by a lumber import quota in Japan an embargo on log export in Canada and free log trade between the United States and Japan A stitistild model measures the influence of log proshy
and lumber consumption adjustments on the U apanese log trade and prins in both countries Thlt el11piri 1 study is basld on iIlnual data from the 19hO to 1976 period RlSlllts indicate that Japans excess demand and the lJnitltd States excess supply relation Ire price responsin in the log market Mean alul elasticitils an arollnd 0 for Japn and +07 (or the United States The findin of a price response 011 thl part of the Japanese qands in contrast to reshysearch b]sed on quarterly data from the 1950 to
C)h9 period and trade unit alues instcaci of wholcshy~ak L21)
The estimates indicate that changes in itollsin -tart amI domeltt1c log production in Japcn are nitishycal in nplaining past and future Ieveb of US log trade Oer the 196~ to I priod for example Japan incnasll1g lolltmction and dcllining dOlllesshytic hanest contribu1lo aboll equally to riing log purshychusls from the US Duri mo~t of the 1980 and 1990s J(clopments ill Japan I1wrKlt lould lIKOUrshyage a log track ncar the levels 01 the 111io-19705 Thi~ w(nilo be liKcly if brisk income growth foters a
residential construction 111ltlrk(1 and softwood harvests froll1 Japans (orlsts are comparable to those
Author Paul Callagher j a research ~pecia[iq in the College 01 Forestrv and the Department of Agricultural and Applied Economics University of Minnesota
The University of Minnesota including th Agriculshytural Experiment Station is lommitkd to the policy that all persons shall h3ve acclSS to it- proshygrams facilitie~ and employment without regard to race creed lolor sex national origin or handicap
of the mid-1970s However it is possible that Japan could drastically reduce its dependence on US log imports This might occur if stagnant income preshycludes strong demand for new housing and the output potential of Japans softwood forest is realized
Introduction
The US softwood log trade has fostered a highly publicized controversy that began with export expanshysions of the 111id-1960s (4826) At times Japans purchases of timber have approached 10 percent of US production in the highly inelastic softwood marshyket Its not surprising that lumber users have deshymanded export restriction or elimination in efforts to reduce domestic priLe~ On the west coast where about 25 percent of the timber harvest is shipped uhroad labor interests have been especially vocal ~orkers associated with shipping industries haw vvelshycomed the employment and income generated by foreign sales while those in the lumber economy deshycry th loss of domestic processing
This paper contains an analysis of the affecting the US-Japanese log trade and an assesshyment of the market forces in Japan that will influshyence trade in the future The analysis complements previolls work in two respects (21) First this study emphasizes the structure of Japans softwood market Second tl1l effeds of trade policies in Japan Canada and the Us are also taken into alxount The assessshyment or future trade is limited to meauring the effltcts of possible expansion in Japans lonstruction industry and domestic timber supply
The research in this report WlS partially funded under a co-op aid agreement with the Pacific Northwest Forest Experiment Station US Forest Servkc The author is grateful for the suggestions of many people at the University of MilllllSota and the Pacific Northwest Forest Experiment Station but remains responsible for the COIl ten ts of this publication David Darr Richard Hayne Richard Skok Hans Gregerson lame Houck and Edward Schuh were especially helpful Peter Pollak Kenji Takeuchi and Lennart Ljungman at the World Bank also read a draft of this report and offered many valuable suggestions
Japanese North American Trade Policies A Description
Tlll p~ltttTll Ji Tr~jdc amung L1P~1l1 tJlt l S allLi C~l11~da i~ undebtjnd~tblC pfu lded that lOlllparallt adantacre ~ll1d the arrav of tr~de restrictiolls are both l~d~ln il~to cillOUllf As c rule uf thumb culllparatit clclalltacrc dctlnnille~ the e~tlnl uf a COLlllTrv trade in rav Lllnkrial and procc~slc prudld while tr~Jlk pulicil (plain lhlt compositioll uf lug ~l11d lumulT trdck-s ~ill tlme countries haw dcvclojltd labor md capit] J11cirkd there no impluimcl1t [0 d()]1~llic proce~illg prmidd th~t1 it i~ profiLibk [miccd 11U[
rC51rillium are dttempts to retain domestic processing incoml by incrcasing lhc g~jp beTCCll dOl11esti l llllllshylwr 11 log pricls In thc CaSt of 111 importing cUllllshyIry lik~ Jpan policils rcqricL 11ll1lblr imports thus illlTldSing iUlnblr pricCs paid by CU11SUll1lrs Canacc is tile world ieddilH softwood eporter Ih policies prohibil lug epl)rh- and rcdull iog priCCS paid h proccsors In cUl1trJst tIll United SLte~ (ollov cl fret tradt policy in log and lumbel nnr]eh Till peculiar CS trJCk pattern - importing lumber tro111 Canada and exporting logs to Lipan n Cn though the C S j an importing lOUl1trv -- is F()~~lbl~ a direct result of polilil~ in hpan ~i11c1 CaJ1Llcl~i
The comparate cidlltdge yardstick ~m()Lnl k
~i cOlnp~~rison of~ Lountry~ dOn1(stiL~ l~Uret rl~OUrll~) it11 upuiatioll lt[lid hCiuing requiret1llllb Japan an il1l]Jlnlllg (OUl1lry ilt charalterizlcI by a smJII land basc a Lkn~l pupulation and a limber rlmiddot~UUrl tlidt was ndy cepkltd during orld J Ii Comcshyquently imports cxp~md(d lwyond h~ilt of dOl11estic suftuucl l()l1ul11ption when cunstruction lxpandcd during thl lLJ(iO ~1l1(1 carlv 197( But this countn i~ hl~ij fonslcd and forlsf replalllcj ~Iftll orlc ar II arlo lppro~iching llaturit so Japan could support
d(11l1e~til lUn~Ul11pllOn [ncb of the mid-l 970s with dlll11e~til iorlsb in thl~ ncar llillirl Projectiom of lontinucLi deplmknlL in softoud 1ll1ports hintt un ignificltln1 Lkm~ll1d lxpamiun~ (() i Thl uS has abunshyd~tnt oftw]Cicl rCSOUlLlS but nul cllnugh tu ati1y thl 1l1as~i t domcstic market L~ sawnwoud conshyQ 1ll1pti(iD (7J mil ]]i) eXClCCis tht combinld cunshyumptiun of Japan (~) mil n1 ) nd Canada (30 mil me i CunSlljuently lhe lS 1l11jwrh dbout ~5 pcrshyllnt of ih soflvoud lrom C~n~ida Thc timlxr imcnshy(my of the ~st Can~lliiall ilcltrl1cs has about threeshy[ourths 1h Ulllll1C of LS il1cntur~ but Canada is parscl y popLl~ttcd Cumequlnll~ tlle Canadians cshypurl nenly half or thlir domestic proliultion to thl lnttd SUhcgt
lr~idc flO in lUf ll1d lumbl l1l~lrkcts arc illusshytrated in Figurc 1 bIXin (iccounts lor ~illl1ost all tralk ll1 log b- pur-hasing 10 mi m3 frol11 the Lnitee SlJtl Lind l11ii m 3 from thc SOiet Union Sm~dl qLiLillitll 01 logs arc iliP1Xd from thc US to Cll1ac1a li i- Yiii 111 3 ) but llmost no lugs kac Canada (05 pcrceLl it (al1udi~n dOll1ctic pruductiun) LS imshyports frum emul arl till l1lajnr lumbr trade ( 130 1i1 1 3 ) 1 inul dlliUlil1h uj ~~iWijOOt are abo cxshypumiddotlC1 in)l11 urtil Al11eric1 10 J~[p~n the LS Inc C~dlld hoth hip 1t-Olll UIW 11illiun lutic l11eltr~
The Jap~Jwse-Jorth American lumber tracle is )W] Lmittd than Fiplrc I indicates Indeed subseshyqUcIH tcol1omic analysis builds on the assumption that all US lul11ber exports should be classified as iog cports Mure thll1 half of ~orth American lumshyber iIl1porh (5~ per~cnt during the 1968 to 1970 period) an b _-+ or 14 square timbers that are reshyproclsec in Japancsl mills Htmlock baby squares i+ I arl the lnaior procluct in tht ren1 iJiiJlg North -l11eric~n slwnwooc trade (60 perct]]t during thc i l)li to lenO plriod) (inc the Canadians cgtport most
Figure 1 ~bjor trade flows in softwood log~ and lumber- Japan United States and Canad~l
A Sawlogs and Veneer Logs
USSR I
e9 03
II Japal I Poductioi 168L Consumption 340
102
Canada I Production 693 Consumption 704 I
t L4 01
Un ited State Production 1528 Consumption 1413
B Sawnvvood
1O~
~ Japan 1
PlOduction 274 I I
Consumption 298 i I
12
[ 1 dcTd arE In ~nliion cubiC meter-so SourCE FPO VealbOOk (1976) 1975 dttc
3
-------------~
Canada Production 257 Consumption 118
130 I
t Ur ited States
Prod uction 631 Consumption 732
I
of these (13) Other data also confirm this hypothesis For example the bulk of US lumber exports origishynate in Alaska (93 percent during 1968-1970) and virtually all Alaskan lumber are squares larger than 41 in thickness
A number of trade barriers and cultural factors impede trade ill Japans lumber market (6 p 95) These restrktions add up to a quota although no such policy is formally stated First import of Russhysian lumber is discouraged by a 10 percent tariff on sawnwood smaller thal1 160 111m (630) in thickness on the major species (spruce pine and fir) The major Korth American species hemlock and Dougshyas-fir- ~Ire excluckd from this tariff but all illlshyported lUI11blr must be regraded in Japan The costs of regrad Jmoun t to 10 percent of the value of the lumber and 3 perlent of this cost is added to the lumber price A Hgrading scheme also has the potenshytial to serve as ii rationing device when lumber imshyports exceld a desirell lewl Finally Japanese conshyqruction methods favor metric lumber sizes A westshyern (platformframe) construction method was initishyated ill nlellt years and this method is compatible with Korth American lumber sizes However only 01 pacent of new hou~es feature this construction mdhod
The Canadians almost climinate log exports with a permit system (26 l Before a government permit for log cxport is granted domestic millers must refuse to
the timber and the governlllent must approve the log export
Free traue policies are followed where major US tr3de OCCllr~ The 1lS-Canadi~1l1 lumber exchange is a textbook C3S( of free trade In the log market the US does no aJloA export or logs harvested 1rom public lJnds Others have ~rgLled that this regulation guarll1tees 1 ~lIpply for domestk processors but does 110t inhibit foreign trade Also an upper limit has been placed on permissible log exports The upper limit on exports however is beyond observed levels of log Tracie (26)
IMPLICATIONS FOR PRICE VARIABILITY
It is imporuiI1t to verify that some softwood marshykets function as fret tr~lde markets while restrictions are effectivE in other markets Time series price data t1111 spans housing market cycles should aid this verishyfication In free trade markets example p11ce fluctuations for similar Loml110dities hould be posishytively correlated since origin and destination price~ differ only by a transportation margin However quotas and Lll1bargos insul3te domestic from foreign price SG correlations of price fluctuations should be low or eYen negatiye
Correlations of annual price changes over the 19(5 to 1975 period conform to expectation Price lhanges for US and Canadian lumber (Douglas-fir) arc highly correlated (1 094) but lower correlation for US and ClI1adian sawlogs ~r 058) were obshytained Correlations of price differences between the US and Japan were 10weL as a result of quality difshy
4
ferences in softwood species and adjustments in USshyJapanese exchange rates but the relative magnitude of log and lumber correlations are as expected Correshylations of log price changes compared US sawlog pnces for Douglas fir (expressed in yen) with an inshydex of log wholesale prices for cedar and pine in J~pan The simple correlation between annual price difterences IS 039 Correlations of price changes in the lumber market were based on the Japanese wholeshysale price for cedar lumber and US Douglas fir prices (expressed in yen) This coefficient is 006
A Model of Price Formation and Trade in Japanese and North American Softwood Markets
previous discussion of trade policy supports the argument that the log trade between the US and Japan serves as the focal point for all forces affectinO two independent lumber markets Japan does import small quantities of Canadian lumber but this trade is restricted Consequently adjustments in Japans lumshyber economy occur without the stabilizing benefits of trade In the second lumber market free trade occurs between the US and Canada The log trade between the US and Japan retlects developments in North American lumber economies on the supply side and Japans lumber market on the demand side However no connection between these two lumber market~ exists unless Japans trade restriction is relaxed
This section examines the effects of Japans trade restriction on prices and trade tlows in log and lumber markets It is shown that the lumber restriction has the following effects
(l) In the lumber market Canadian trade with the US increases but Canadian exports to Japan are reduced Prices increase in Japan and decrease in North America
(2) In the log market trade between the US and Japan increases Prices may either increase or decrease
The assumptions of this theoretical model are (] ) Canada is the sole exporter of softwood lumshy
ber to Japan Moreover Japans imports are restricted by trade policy and cultural factors these restrictions function as a quota on lumshyber imports
(2) Free trade prevails between Japan and the US in logs Moreover the supply of logs that the Soviet Union offers to Japan is perfectly inelastic Thus the US takes on the role of residual supplier for the Japanese market exshypanding and contracting exports as conditions in the Japanese market change
(3) Free trade prevails in the US and Canadian lumber market
(4) Canadian log export is prohibited (5) Domestic and foreign softwoods are perfect
substitutes
Figure 2 Price formation and trade in North American and Japanese lumber markets (free trade and quota)
q
ES~
(a) US domestic (b) US-Canada lumber trade IC) CanadamiddotJapan lumber trade [dl Japan domestic lumber
Figure 3 Price formation and trade in the united States and Japanese log markets (free trade and the indirect effects of a lumber quota)
Qi U
Ib) USmiddotJapan
PLOG
PLOG0
lal Japan domestic log supply and demand
Figure 2 depicts demand and supply fclations 111
the intlrnation~d lumbcr 111~lrkets under rather hed conditions The economic linkages ill 111
Figures mel 3 an not meant to eXllJllst the reality of these cOl1lpLx markers but to highlight the forces at work in the pricl determinatioJl ln)CLS~
First comiekr the lumber l11drktls in isolatiol1 Panel a of shovvs the uS dometic demand and supply fUlhtions for lumba The rUl1ction E[)~b in panel b IS the excess demand formed by interlctioJl of S~s ~ll1d D~lS in panel a The function in panel b is th excess supply of lumber offcred by CnClca on international markets The Japanese domestic lumshyber market i illustrated in panel d with Dmiddot1 mel S~ An excess demand relation for ILimber by Japan can be
I An gcbraic IrCJlOlcgtnt I prcsentcd in Applndix B
tade S domesic log supplmiddot and demand
deflved from t11lse 1unctions as is 110Wl1 J~ ED~ i-
panel e To c1osl this Systelll the exeess supply urve for lllmber facing Japan net of the US and C~ll1iLlian markets al1 he construlted is the hortshyWI1Ld ditfercI1e betHcn E Cilhl LS~ ES~ in
c If free trade prcvaih ill the lumber l11trKe the inkrnitiollal would be estlblished al PLUMe in all three markets
However free trade does not prejil in the iLllll shy
ber market III panicular Japan irnposeamp Wlllt ashymounts to J binding import quota on lumber shown in panel c as q The dIeet of this trade barrier is to raise Japan lumber price to PJLCP and to lOWer Canadian and CS lumber prices to PUSLUM Cmdshydin trade falls by amount but US purchaSeS from Canada incriase by - pl8te (b)
Now let L1~ introdule the log market into this cllsshycllS~ion Figure 3 illustrates equilibrium in the
Variable Description Units
()DSJ( srJtuoc lumber (sav ilmiddot 1000 middotiJod lpprcnr
OlSJ 1 sulwuud lumber (aVll 1000 voudt JUIllestic
r tljXlJ1 suttwooc 1000 venee
OIL and i 000
l1urkLt The Jj)vanhloping supply of logs L)fTcr~d
by tht (S (15() ill h i~ derild from tht Joshyme~tiL lo lipph (SIC) and demand (De) rtiatJons in
c Japall sf ckmancl (LD) is [ormed from thL dOllHtiL lippy (Sl ) ~llHI dLI11Cll1d (D I rliJtions in ~ SlllLe fret trade prtIIls till log l1larklt ticals at priLL PLOG nd tht amount QILT III logs is hipPtd from th~ LS to JIlan
Thlt lfkcts of the lumher on the kd II abo ~hcwl1 in Figure 3 re~llib 11 the iltnj1itJtl(in of till ckrivld lkmand
Dl aile fitaily these dowll~r(kloping Clntgt ir~ tOll~lnltted un the agtsllmption that proshytt~urs lkli(d dCillmd for lugs II1mt be satisfied
thimgc the profitability of doshyand art represented by movenwnt
dCIl1~llHj uns Changs in lumber prile~ abo I11f1Utl1ce the prorit~lblity of d011le~til prclssing but nPJ~tl1tld hifts in thl log ueml1d ~dltmiddotdl]- ( i) Imposition of thl lumbLr qUO I Ii iI1LT~ise L ILimbL and GIUSl
111 ottvd llt1 Jl1d tor (]) to D in (~ i I lorth Amaican lumber pnt(s I i billkvird Sllifr in llS prUCLur dcnnqit del1lC1l1d for logs I De to
DlS in ( I Shitt i 0 dlIT1Ulli lll-duk I re-llit III st r uillaml i EUL I lind murl ahundant SUPl liS ) on luI gn 11arkds in (31)) Thefl shyfore tll lurr qLiut~l dl iihT(ii trltk l indishyLaltt LJ III 1_ I IlovILlL pn either inLTtib 0 (kLTcccY dLjxnding lill ILL 11l
tudL )f the Ilitl in Jaliln t (lllllillid [mel r ll Tht LaC Ctl rewlihly strong shilt il]
JaPdiS ckllialld i llU j 13 the 1l1shy
LTeil( to P L 0(
An Econometric Model
A OVERVIEW
This ldion (Olltil [utiorical model ul the US-JapallLsl log tLlck It L1ll thl ddennlshynans of Jlpan r (kmand but illLOlll1ls for III in CS d Canddidl1 -oCtvmiddotood 111 a r Lct
T~I hie olltilin a cUllll11(ry c) the rllatiol1silips in thi -equcltion mudd
Jlpclll m~lrkd h dCLribed b~ thrcl ~tilllakd rllation~l1i Till iumblr citmdml equation i 1 ) lllcclshy
surL the u~tllllnts of mhtr LOnSllnkrS to ill lumber prill ~incl new Ii Till lumber production responst fUl1dion I ho- procssorsmiddot rltaction to hang6 in log ltlLl 1111llblr pricls wafcs and ldpacity l~quation (4) llWaSllrlS the tOIlcrSlOI1 logs te lumber Japans I() import deshymand Stilt-lillie is the nsuit of combinitH these estishymated relations with market dearing i(ftlltitilS toJ lumber (equation 3) and (equatiO 5)
6
Table 12
11 i Japand(Jlnestil lumber cunsumption QDSJ 1 (PJLL~11 HSJRt HSltHI
(~J Japan-d()tllelit lumber produlion QPSJ 1 = r(PlLlM r middot PlLOG t lilt CAPt PJLOG
1_1)
i ~
I Iapan-iulll[lcr Iliarlet identity QPSJ i QISlCAN t QDSJ r
( ) J Jpallmiddotiumber c())wcrsion hum OfS] (QDU QDU)t
( I JIJdil-lug lmpults frum Us (idelltiry ) QILlUS t = QDLJ QPU QIUSOV - QILJO
( ) ls-Ig expurts lu Japan OIUeS f(PUSLOC 1 PUSLUM QPLlSrt
DSTRI KE I l
(7) ( and U smiddotlogmiddotlumbtl prIce relatlllISilip PUSLlM t 1(PLOG 1 HSLSr HSCAN QPLCANt
QISJCANJ
US and Japall-lug prke linkage PLOG 1 = nPllSLOG EXtt
Endogenous Variables
us wholesale pIKe
edtl- hoards ( i
PJLOC lwes~lIc
S1 i
PlSLl~l United SIJles whOlesale p mb it 5 percen
to and btl rJlldum ho Lub
PUSLOC DUligias iir wmili log S1l1bL Csterll WisllinglOf] weStern
Exogenous Variables
Variable Description Units
HSJR t stans residential 1I1i11 llSJNR 1 Lman tdn~ lun- mi1l1ll 2
re~ide1tjal HSUS 1 Ulilled States hOllslIlg lttarts 1000 lJJ1tS
HSCAN 1 Canada housing slarts 1000 units
Table 12 (Cnn Exogenous Variables
Variable Description
Japan suft v (lOct saw logs and veneerlog~ ctomeslJc
QPLUS j lrited States soflwood domelic
QPLCA1 Can~lda softwuod v(neeriugs domliL
Jmm f oftu-d Ullber fron1 Callal1~t
QILJSOV 1
fro III
Ihe Sviet tnio11
QIUO j j OOU
WJ 1 000 r
CAP
EX
WPILS
DSTRIKE
The 11Otl noclet intentions (or the Notl Amrishyem supply side are to (1) ll1t3sure LS adjustments to chmging ccs aIld (_) acount for the fact that US processing adjustment alter the US-Canadian trade which in tvrL lIScS lcljltstshyment in the North Americm lUI1Jber prile Accordshyingly the log supply relation (equation ol is estimltecl directly This equa tion me aSlIres U S processors ddjustme nt to changing log tin d I UIll bel priles with given log produltion A second beh~ioral equation (n dcslTibts the rclation btween Korth American log and lumber prices The builds on the ~lssumption of equilibrium the LSshyCanadian IUllIber trade and accounts for thL Cillatiian log embdrgo
Eqliation 8 a dose relatiol1hip )x
twetn Us and prilCs Thi equa tion builds on the assumption frft track in lhL
market Log ~upplies are taken a- perfectly inelasti (nogshy
enous) in all three countries It reasonablt thlt to) supplies arc pusitively relakd to prit in the longest run of our theoretical exerLisf (Figure 3) a sllstJined price increase for example calls for increases If leat with rotations on a given ncl base mel mav also induLe an investment in more land uced for log production A thorough econometric
7
5 mue nf holale j U(O
A dUl1lcl variable w hieb (OUlil S
fortle1 effectsuf(liel West (ltlast dock rike t = I
I md l() ]q-= ncl otherwise)
Units
[000
i 000
1000
1000
1000
i1Olvltr must tilJi dh StlLl other probkms ~uLi1 CiS the short-run llonomk problel11 or marketing lutur timhf I ~7 I the fonls afflding ineTI11tl1t in future timber l reror~staiOl1L and the rules )ocrning management of pullic forest 1~II1(ls Such an tl1~1 IS the SLOP~ of this inVLstigltion
B JAPAN
lation oi ~[ll1dard lIltit)J1 ~illd guided othtr
11I1lt1ti0I1 to J1l~lrkd~ yielded ~ais-fesuJ ts
nspons es1 i mt tes SltllC1ltrd 11lCury In gll1trJ1 dLshy
middottput input priLcs for a facshyturs and quantitics cf fiJcd inpuh (11 In most forshyest ppliGitiul1s ) md abor ac Likcn igt lrilbll factors while proClssors capital lok 1 (1 ~ 22)
l~Timatcs llClr rlspOl1Sl 10110 [his get1Td its 11lClSSan to be war~ r ((lures of Japans w)od ing i rid pro Ltssing pandcd the I C)60s am no
I Illllsure ~ I~libbl( Thus a Pkil~ illtil ws d with Klcins 1r(I1J through rllaks metl1od Stcond lolinearit) among lumblr and Ce data made cqimatioll of (cetTishylIe]s dililllt In inincr lTlr(siol1s ali thrll
s bd 1ccorrlLl Sie~L but till ilillbcr C~PS)lbe d~ small r~lltil ro input pricl llatlli shy
tJl$middotmiddot ALLmdl in]ut pnccs vcr comhil1ld tll
Tlle hest Slt 01 v on WltfCS and thc log )lrl- II1dex WJ ubt]il1ed by l11inil11izine the ~111l1 01
1 T I ~ 1sc llrl( lrrors Ll 10 lOmg eq loa tlon lst Imake wilh Il~st squares wa~ the bcst of sClral similar
tions I) QPSJ 2r 147 -- 0 l8~533PJLU
(336) I ) 77)
(456 i 11584)
DW == 106 s=
u indlr prolil
or (1cgrC llfO in produl and inpu I j 2 ((jn-tyulntly al~ ~ontrailll dri1Cgt ~~pprup1JIl
ur produ-t ~Hd inVli~
gt 1= 1 cQPjmiddot lL r~
CQ the [qiclt) III OUlut le)1 wiligt r~pcct 10 th~ pri(C ()[ oulmiddot put rP h r nUlput Qi it11 rcpcc1 [() th price the j
th arJJbk llj In pril~ clastiil) eceeded the JUn
where Equation 2 below was the best of these formula-
CAP == a capa(ity index
CAP == (- 53532625 + 1246125T) 32750 if Tlt70
I ifT ~ 70
note QPSJ (1970) == 32750
PI clt prje index for variable eost items (1962 100
PJLOmiddot~ 03-~WJ== 065 G + ) 198
Dependent variable mean 28058 Historical period 1960 to 1976
Lumber demand origmates in the construction indllstn Thus lumber consumption should depend on prices of lumber substitute inputs and output Ii e hOUSlllQ or non-residential construction prics) Empirical st~ldies of lumber consumption typically relate consumption to prices of substitut inputs llovcer output quantity measure (building starts are used instead of building price Additionshy
some investigations account for the different lumber reqllinl11elts of commerlial and residential ~omtrucrion b the use of sllch ariabJes as separate residential and~ non-residential construction or ratios of tlwse Iaridbles
Attention to characteristics of Japans market should enhance the dna lysis of lumber consumption First it is low quality hardwoods (Juan) and non-wooden building methods both substitute for sotwood ll1 buildings Second the composition cf Japans blilding actiity switched during the midshy1960s In the early 1960s most building was intended for non-residential use but later credit for residential construclion was more plentiful and building favored residential construction Accordingly one should account for the effect of this change in building comshyposition on lumber consumption
Several sets of explanatory variables for explainshying historical yariation in apparent consumption wre considered Experiments involved comparison of n0111inal and real prices alternative responses to rcsiden tia I and 110n-residen tial construction and tests for substitutions between hardwood and softwood lumber consumption Regressions litl1 real prices had iovver explained variations than analogous specificashytions with nominal prices Also when luan lumber prices were included coefficients estimates were small relatin to standard errors It is difficult to conshyclude that this ~ub~titLition does not exist since the simple correlatlOl1 between cedar and Juan lumber
ces was around 096 Colinearity problems also precluded measurement of separate lumber responses to residential and non-residential construction HowshyeveL regressions with total building starts and the proportion of residential to total construction yielded reasonable results
8
tions (2) QDSJ t 12468047 - 02850614PJLUM t +
(165) (302) 028
8424076HST + 21974600 HSR (708) (1232) +045 039
R2 == 08238 DW 08693 S 184069
where
HST = HSJR + HSJNR
HSJR HSR == HSJR + HSJRNR
Dependent variable mean 888067 Historical period 1960 to 1976
Most statistical properties are acceptable Coefficient estimates have correct signs and t ratios indicate sigshynificame or contribution to explaining historical variation Also a high proportion (8 percent) of consumption vanation is explained However the Durbin Vatsoll Statistic suggests that unexplained variation ma not be due to random elements Several possibilities for exduded systematic effects exist First the pattern of residuals switched from positive to negalive in the mid-1960s and this change correshypol1cCed to a nev composition in residential and n011shyregtidential building Thus it is possible that some structural changc ccurred at this time Second the inlluence of lumber inventories is buried in apparent consumption data so cyclical inventory adjustments could account for the residual pattern
The relation between log and lumber markets is given by a simple regression of sawl1wood production on apparent sawlog consumption This approach is justified on the grounds that there is a fixed rate of conversion between logs and lumber The exact specishyfication presented here employs cUlTent and lagged values of sawlog consumption since it is likely that imported sawlogs are not processed until a later date When lagged log consumption was included with curshyrent consumption R2 improved slightly but the sum of current and lagged coefficients remained fixed around 085 Equation 3 belowshows the results
(3) QPSJ t = 27660964 + 060467347QDLt + (131) (652)
O24336772QDL t _1 (301)
R2 0942 DW 116 S 84041
Dependent variable mean 2888487 Historical period 1962 to 1976
B THE UNITED STATES
The US excess supply of logs is by definition the difference between domestic supply and demand
In general then log exports can be expressed in temlS of variables that influence domestic supply and deshymand functions In the statistical analysis of US log exports domestic log supply is taken as given Processhysors log demands depend on log and lumber prices wages and processing capital
Preliminary estimates showed that real prices exshyplained more of the historical variation in exports than similar regressions with nominal prices and that wage rates were not significant explanatory variables Additionally it seems that the prolonged west q)ast dock strike in 1971 had a substantial effect on US log exports This finding has been confirmed in other studies of trade between the US and Japan (7) Accordingly a dummy variable has been induded to account for the effect of the dock strike Equation 4 below shows the results of estimation (4) Q1LJUSt = 24716578 + 9736503PUSLOG t shy
(330) (373) WPIUS t 122
63801 66PUSLUMt + 017873QPLUS t shy
(104) 069
WPIUS t (304) 377
242494DSTRIKEt (195)
R2 0793 DW 151 ~
S = 1590
Dependent variable mean 74909 Historical period 1962 to 1976
C EQUILIBRIUM IN US AND CANADIAN LUMshyBER TRADE
Much empirical analysis of price behavior begins with the notion that supply (or cost) and demand (capacity utilization) forces both to playa role in market pricing 4 This principle is applied to the probshylem of estimating the relationship between log and lumber prices for North America The basic building blocks for the price equation are (1) lumber supply and demand relationships in Canada and the US (2) the assumption of free trade between the US and Canada in lumber and (3) an embargo on log trade between the US and Canada A linear relationship is developed with the North American lumber price as the dependent variable and the price of logs housshying starts in the US and Canada Canadian log proshyductiqn and the quantity of Canadian lumber shipped to- Japan as independent variables This relationship is applied to time series data for the 1960s and early 1970s
Suppose that (1) US and Canqdian processors face the same lumber price (PUSLUM) but (2) Canashydian log export embargo drives a wedge between US log price (PUSLOG) and Canadian log prices (PCNLOG) The lumber production (QPSUS) conshysumption (QDSUS) and import (lCND) relations of the US market are
4 Nordhaus provides a review of some of this literature 120 pp 34-42)
(i) QPSUSt = aj + 131 PUSLUMt 11 PUSLOGt
(ii) QDSUSt =ai PUSLUM t + Y~ HSUS t
(iii) ICND QDSUS QPSUS tt t
Similar production (QPSCN) consumption (QDSCN) and import supply (lCNS) relations are given for the Canadian market
(iv) QPSCN t Ct + ~T PUSLUM t YT PCNLOG t (v) QDSCN t PUSLUM t + 12 HSCN t
(vi) lCNr QPSCN t QDSCN t QISJCA
where QISJCAN is the level of Japanese imports Since the Canadians embargo log exporL domestic log consumption is to production Given that log supplies are assumed to be perfectly inelastic Canadian lumber production is determined by log production Thus equation (iv) can be rewritten as (ivr QPSCNt aQPLCNt
where QPLCN t Canadian sawlog production The lumber market equilibrium price relation is
obtained by developing lumber import supply and deshymand functions assuming tha t trade equilibrium occurs so that an c(pression that does not contain lumber Irade C211 be developed and rearranging The US import supply is obtained by substituting (i) and (ii) into (iii) to yield
(vii) lCN tD (a~ al) (pj + p~) PUSLUM l +
11 PUSLOG t + Y~ HSUS t
Similarly the Canadian excess supply funltion results from substituting (iy) and () into (vi)
(viii) ICN~ + QPLCN t + 135 PUSLUM l -
HSCN t QISJCANt
Assuming trJde equilibrium (lCN~ = lC1-Y) (vii) and (viii) can be combined to obtain
I I Ox) PUSLUM t K + 1 PUSLOGt + 12 HSUSt
12 S72
QPLCN t + 12 12 12
where S 12 til + ti1 + Equation Ox) gives the theoretical basis for anashy
lyzing log-lumber price relationships The relation sugshygests that sans shifts in market conditions log and lumber prices should be positively related Furthershymore given log prices lumber price should increase with demand expansions in either country (HSUS and HSCNJ or supply restrictions in Canadian markets (reductions in QPLCN or increases in QISJCAN)
Estimates of this price relationship yielded satisshyfactory results In equation (5) all coefficient estishymates have correct sign t-values for the explanatory variables indicate significance or contribute to eXshy
plained variation and a high proportion of historkal variation is explained
9
(5) PLSlUl1 ~4lt)h04 + 057 2~ 1 PLSLO(t + 18 C))
5 HSlSl + 0130093 HSCAN t (270) (120)
+ OOOk34x OISJ( ANt ooooqP ~lt)5 QPleAN) IjO()1 1~7 I
R2 = 7raquob DW 3 S 515
DependtlH variable mean 98 i l-Ibtorilal period 1962 to 1LJ7(1
E USmiddotJAPAN LOG PRICE LINKAGE
BeClllse or the Cree log tLlde pricl differtl1l~ bmiddotshytwecll Japan ~ll1d the US should rdlcLt transshyportation Lhargts exchangt rilles and qllltility diflershycntills This close rclltionship i approximated
of hpan ~ PIllC on the )lt11 eq~l tnt thL liS
Ihl PJLOC 1 4S25 -+shy
OOCJ3~25 3h (PUSLOC I Xi 11 CJ 1q I
DW = lh4 s 0
r-1 i~1 )ri ~(i I 19htolq7(
Impact Multipliers
~lujt IllClS11rl th o~ra (tTc r that de- out~idc the
the i1~ihsi section dcniOnstrdcd that n icrcdsc in Japans l(Jl1shy
strlcilC~ -I1cOuragl- dornestil iU[T1bc
Table 2 Impact lHuitiplieTS
MuJipliers provide u method of accounting for u ~eries of stcondar) tffeLts in the eXdlll ex panshy~ions in dOtn(slic lumber consumption an lt1l(0111shy
pJIlicd higher lumber and productIOn In Turn log prices arc bid up and the US provides more
to Lpun at tht highcr prile Higher lumber prices vQuid [ISO oC~ur in rth America beldLlst logs arc dihrted from domegttj( markets shy
The uitiplin (imale of Table ir base(] on The srJtistical rdatiollShips of the previoLls sediol1 An initial al1d trade l(uilibrium is rtpre~ented
equation i I til (~I for 1 eve of variu bL A second level is
ror the ast where one lxoenous t~ tlLm in the iir sOiution
(iatil tiut tillre J
ion (i nd
[nilS )f trllk hmn The lorr(~poncl
shy ~Hbuattd il
td ILlmlllf il JJpal1 II ~ s domestic lUllshy
r lnlding cOLlltries To the riyc r~hiticn betvvtt71
ti1C)- lstlllla tes icuLr prIce
quan
U(shy
J ltLll1
1972 base olution
QDU QILJUS PUSLOG PUSLUM PJLOG QPSJ aOSJ PJLUM
Units 1000 m 1000 m S mbf S rnb i 1962=100 1000 m 1000 m vim Exogenous value variable Units 1972 value Change 1972 421870 111870 1191 11748 1440 323440 33309 339580
-------~----- --~-~--~-------~~-- shy --~
()I~J( I (JO( y65JI ~ )fll - I I
QILlS() I (l(I(1 n~ flU I ( i 0 2) ~f(J- lt (lfl)middot
1I1()(j I 701n ( h I I - np1 I ~lraquo iOPLi
()PI lS LOOO i IhlJL-l)J i i 04 I - (t+J (Ie I i o~~
IOPt( Ai I CtHI i 11 til I i~ UO( U(1 i ~ tH
HSJR ill 11 7
(j i 95 9(4 ~2
11IF Lll 1n 1091 i n I jJ i i~ 1~ i b2h
H s I t)(l U) ~Iil I -~j
HSC U(li 2411 h25 i J)~5 115 191 -I I
~ -1 1filiO lO middot-36 9(middot -](115 - 4 ~
Yen mp
I X Yln 3()3IU[I 10 ~I is 195 -1 -----------~--------~~~---~~
10
19hO O~51
iii
j l i IlJ2h
A THE NATURE OF ADJUSTMENTS TO CHANGES IN JAPANS MARKET CONDITIONS
il ItllS1Il ot nd trck l([just nol(ortl1 I past rspol1se to hmgec ill
economi llI1ditiullshy
il US~iOll
Th
1rb T of 4 than ILlf hi lldrL( r
Fililn non II is i1cn
Lstmenh In rIll dj~~
(rAIT n ilnnluh I
ltil11br will Her Lq)~tn 1 hr Til ~rilll 1 T lhk indiCik
lrk elir t~ 1 [11 l ll(-l s t tumshy
b[ 1rl(k 111 ral in t l S 111 ~ji]1S ~lLti I
1lldrkeh 1 0 mil]k 111 lllr i (QISJC i
t h__bull
ccn ~tn tP~lll dorIIliL COn~Ullplil of ~73 111il1 111 3 nld 1 1coudion citJl1ltic ltmhlr productiu (QPSJ i uC 4+ mill Rtdll(Td 00111shyti PW(i-ii1g il1lpEc~ mill ill III d(lllltq log ljjQm ll1d porh irul1l the ( S ((jIU I Japal1ee lu miltr (PJ L UM i la II ( 00 ~ 11 ~ 11
(1 jwrcn1 iUl W 11101( tiflll upph while (lr1 AnlCricm lumher (PliSLUM I (S7gt- 11m) I
~Thl~ (--tirn~ dnhHln~ wilh Lt1CHi~tiJn 1- l-uod rlquif-nhr t ()nd~~n houl tJk~ ~buUl I ill ltif lUintilr whiI h-e ralPv 1-11shy
~O fH[ liti1 (2J L in I 2 ~d--I~ r -1l Plshy
111il II] ~nld -(t11 i-pro~middot~--cd
in~r-middota~middot ]]1 (~ln~1dljn IttI11shy
TI t1mul
ur (1 perccnt) dUe tn lumber iupplies divCrted nrll1 AIllLTic~lll marktl fin lug would fall sligh (1 lernn hCllllse the shi in Ltpancse dlIlLl11d letd~ th log supply shift in orth Amtricll lultig 1)111 h cr [umber pnLC~
S WHY DID JAPANS LOG IMPORTS EXPAND DURING THE 1960s AND EARLY 1970s7
1( famiklr WIth the (ill oi1Cidcd ith nshy
dOllllstl proshyduction and nhrC fJurabk tcr1l~ trade b(1Icn
al1d lhe US Om Lctor that t 111e parshyotler this If(nd w~ llh xpansioll of
ClldJian lumher cport~ to Japan Th llli
pnvide ncii(ilicn of hem iI11POrt~ll1t (~ld1 ul tbc~e f r~ ctT Sllh~ the htIlgc in bltwcen
hCfc R
6QPLJ+4LJl()56HSJR+ 13714 95if-X 50()1 ISJCAN + R
llOUI ti ng tororrll in1trican sllppl hift~
111)2 ariJhk eriou L1Liors till lhange i q(~ and 1C)7() l~~Ul be lulcushy
(k~ over 1h is tillle
-GIUlS
and random fkcts and 6 indicates
= AmiddotllJ IOOC n3 I
1
gtO~( 11000 3rT ( lCJOOOOO m2 flcor reu I
43 A f 1000000 El ilcor IIllI) dcn~ll)
IUK 1 01 000 [113
16 pl~rCe~H
nect~
122 perCllt)
Possible Developments in Japans Market Conditions and Implications for US Softshywood Markets
Future traj(r bne~ depend critically 011 lonshylillr 1ion and clonwstic oftwoud harvest ill
JaPlI1 enario for tilt l1Ct 0 years rtngl from q markh fur new housing and ahu1JdanT riml1er l1inesl to ~trong COl1stnlLtion 111lt1rshyklt and tores1 lutPlI ntar the luw lcvels of tht ] )lk Thi~ SCdiO1 lolllains a di~llssion of faclOr~ that m I Ie in1utl1cc construction and timber hanest ESlimltes of reilsonabk bounds alsu afe preshycenkcl HOll~il1g start are based on preshyviolls research f 21) while ~peculations on future roundwood (1 ~lre basd on crude inventory irowth modd for LIpans priatcly-owl1cd forest The
11
sctmlrios suggest that at best US log trade wiII show a slight gradual decline over the next 20 years On the other hand Japan could stop importing logs from the US by 1990
A ROUNDWOOD OUTPUT
of long-run harvest potential start with tlh Japan Forestry Agencys position that by tIll 200 dOl11estil round wood rroduction will be t 25 time~ the levels of the mid-1970s (14) ~orth AJ11erican opinion seems to doubt the full magnitude of this production increase but not the fact that it will occur (0 25) The North American outlook ror the interim and the species-composition or future supplies seems less certain One author hlts stakd that the trough has been reached and that within the next fin yeJrs harvest from the domestic forest in] CI pa n will i n ~Tease Less has been said howeyer lbcllIt the factors that could influence the magnitude timing and species composition of these output incrcasLs over the next few decades
My intentioll is to present a preliminary discusshysion of ~onwood output potential for the interim pLrioc1 (prior tu 20 10) based on a rather casual intershypretition of thl available JapJI1esc data First some importnt lh~lrackristics of Japans po~t war reforestshyJtion m dislmiddotll~scd Then some plmtsible softwood hlrve~t ccl1lrios 101 the next few decades are preshyslntld I Lommen t 011 some economic forces that COllid in lienee timber harvest schedules In parshyticldar it i argued that future output potential will Lvor ofrwood at the tOxpense of hardwoods Also Japan softwood prod udion could work to displace Imporh hy tile (rly 1990s at the lower end or plausible harvcst ages Finally stand ages could deshypend 011 prilc prospects with f(llling prices encouragshying elrly hlrv~st and rising prices favoring the harvest of morc matur timber
1 History and Situation
Japans artifiLial forLsts are the source of fltture production potential These forests are planted with sekctively brcd seedlings krtilized and periodically thinned In 1976 thcse forests comprised about 40 percent or Japans forest area and contained about 35 percellt or national inventory volume Virtually all oj this roret is planted to softwood and the bulk of this and is privately owned 1975 data indicate that the privately owned artificial forest accounts for 30 perccilt of Japans total forest area
Historical data also indicate that Japans investshyment in artificial softwood forests has come at the expense of natural forest and future hardwood supply potential During the 1962 to 1976 period the total forest area has remained constant at about 25 million hectares However artificial forests increased by 23 million hectares and natural forests declined by an equal amount over the same period (Figure 4) Afforshyestation and cut da also confirm this tendency During the 1972 to 1977 period about 85 percent of
12
the reforested area was planted to artificial softwood forests Meanwhile 80 percent of clear cut area was natural hardwood forest
Figure 4 Forest area in Japan by ty~ 1962-1974
AREA (Mill HAl
~____~___~__~~_~ Total250
200
150
100
50
Artificial
62 63 64 65 66 67 68 69 70 71 72 73 74
Figure 5 Age distribution of non-national artificial
500
1400
1300
1200
1100
( 1000
c 9000
0 0 ~ 800
1i 700
0 laquo 600
500
400
300
200
100
forest in 1975
70 75 65-70 60-65 55-60 50-55 45middot50 40middot45 35440 30-35
Total Area 6915 tho ha
-- I I I
Cmiddot5 6-10 1-1516middot2021-2526-3031-3536middot4041middot4546-5051middot5556middot6061
Age (years)
Table 3 Japans softwood roundwood production - actual ( 1975) and projected (1975-2000)
Million cubic meters National harvested from
Actual forest non-national forest lands land Total
1975 3099 1777 2086
Natural Artificial Projected 35 Yr 40 Yr 45 Yr 50 Yr 35 Yr 40 Yr 45 Yr 50 Yr 35 Yr 40 Yr 45 Yr 50Yr
1975middot80 310 405 773 1054 1216 1681 1313 1032 1170 2086 2086 2086 2086 1981-85 310 405 773 1054 1216 2146 1681 1313 1032 2551 2454 2376 ~ 48 1986middot90 310 405
- I J 1054 1216 4771 2146 1681 1332 5176 2919 2735 2529
1991-95 310 405 7 7)bull 1) 1054 1216 8819 4771 2 46 681 9224 5544 320 2897
1996-2000 310 405 773 1054 1216 10943 8819 477 2146 11348 9592 5825 3362 2001-05 310 405 73 1054 1216 9815 10943 8819 47 I 1022 11716 9873 5UP 2006-10 310 405 73 1054 1216 7787 9815 10943 88 I 81 g~ 10588 11917 1003
The private and local government investment in artificial softwood forests is primarily ~1 post-war phenomellJ (Figure 5) Area planted before World War II h~ld timber that was at least 36 years old in 1975 This area comprises a modest 10 percent of the non-nationaL artificial forLst area Large investment began during the 1950s and early 1960s a period of increasing consumption and heavy domestic producshytion Timber between 11 and 25 years old accollnts for 479 percent of the forest area Substantial investshyments continued during the import expansion period (1965 to 1975) Timber in the 6-10 year age group accounts for about 35 percent of the area
2 Prospects
The prospects for increasing supplies during the next few decades hinge on future replunting Jctivity If the present conversions from hardwoods to soft shywoods cease the longest n~n softwood supply prosshypects will discourage heavy cutting from the Jrtificili forest that was less than 25 years old in 1975 If the conversion to softwood forests continues though it is likely that the area with forests presently less than 25 years old will be harvested as it nears maturity Furthermore plausible softwood rotations are beshytween 35 and 50 years (15) Consequently dramatic harvest expansion could begin in the late 19805 I assume that conversions to softwood will continue The estimates emphasize potential developments of artjficial forests Thus future roundwood production from natural and nationally owned forests are asshysumed to remain near 1975 levels
Future roundwood production on artificial forests is computed as the product of standyield and al1l111ai harvested area Annual harvested area estimates are developed from 1975 age distribution data (Figure 5) With an eye towards developing a lower-limit potenshytial for expansion three conservative assumptions were employed
(l) Annual harvest is evenly distributed within the five year age groups specified in age disshytribution data
13
C2) Area that is presently beyond harvest age will newr be harvested
(3) Softwood stand yields an hlld at avrages for the emly 1970 regardkss of the stand age lssum ptioll
This volume cstil11Cl te (3687 m 3 htc1are) is Lonshysistent with the emphasis on gauging the effects of changes ill harvestable ~lrea6 All other things being equal failure to accollnt for harvestld timber mashyturity will produce underestimates for older stands and overestimltes for younger stands On balance however this is probably a conservative yield eqiiJIate since part-cllt areJS and IlSS productive government land 3re indlldec1 in the computation
ROlndwood prollctiOllS based on this method LIre shown in Table 3 The levd of projected OLltput for the 19 5 to 1980 period is indicated for four mashyturity assumptions hetween 35 ~l1d 50 years Changes ill output arise only because of increased harvest on nOll-national artificial forests Production from nashytional forests is held at 1975 alucs Also harvest from nOI1-national forests is held at 1975 v~tllles which imply that 1975 actual output is equal to projected output for the 1975 to 1980 period These estimates indicate that increasing softwood supplies are plaushysible For 35 and 40-year rotations output doubles by the early 1990s Under longer rotations (45 or 50 years) however significant output expunsions would not occur until the late 1990s
The harvest age should depend on economic COI1shyditions especially 011 the private forests (27) The expectation of rising timber prices would increase the gain from holding timber for future sale This would tend to increase the 11arvest age for exampk to 45 or 50 years On the other hand the prospect of falling prices would make the postponement of sales less profitable This would encourage shorter rotation periods perhaps 35 to 40 years
6 The area induded is clear-cut lreu on all natural and artificial forshyests regardless of ownership The historical averages from the 1972 to 1977 period were used for area and roundwood prodlHion
B HOUSING
Residential construLtion in Japan expanded drlshymltieally in the I 060s and early I070s in response to I housing shortage tlcled by population growth rural-to-urhan migration mel househuld lIl1l1oubling A~ of the mid-I (nos hovvever the nLlmber 01 aaiJshybk lInih hl~ lome into line with the l1l1l1lb~r of hOllSLhold~ 118) Conscquently future inw-itl1lel1ts in llC houing wOLlld take th~ form 01 quality improvcshyl11lnts d Ilew hOllseholds For example therL is a high potultid for repbling cklapiciatcd housing that was Lumtructcd 1I1 thL ]950s Also the size of the typictl dwelling is small by Anwrican stanclards so average floor space coule cont111W to lllcrease Finally ltistorial trenes away from n10re than onL ti1llily in I dwlilillg LoLlle Lontinue
Uedls relfnt report on Japanlt housing requireshymcnts fclure~ projeltions of new housing investment based on demographic and eLonomic radors (24)
Thi study built on the premise thut increases in 111
hOLlsing (S) consist of three ~elarate Lmiddotompol1enL S1 = h1 + Yt + rt herc 11 increJst in thl numher of hOLlsehold~ ~f increlst in the number of vacant units rl illLTCdSC in the numbn uf remoyals
Incrcase~ in hOllSdlOld formations were projellld orl the Insis of Jel110gnphiL data and Y~lCanC) rates JSshy~llJned a (Cntilluation of past trcnds Increases in removals were considered responsive to per capita income (or GNP) and the interest rates chargee on
financing new housing Thus removal forecasts were lClsed on assumptions [ur GNP growth and intcrLst r~ltls Under a high growth assumption annual GNP increases were bctween 65 and 75 plTcent A low growth as~umption featured GNP increases between 45 1I1e 30 percent Interest rates were held cunstant 111 both Lases
Although Ueclcls studv emphasized the number of available units ~ targd Inel uf tloor spclLe from ~urVly data was cited and it WJS assumed that this floor arecl would bc rlalizecl by the end uf the I Q90s This assumption ~l1nOllnts to a 20 ~1LrLent inLTcase in ~lerage floor spaLl by 2000
Table 4 contains Uedas housing unit projections for hi[l1 and low [JOwth )cerarios assumptions Ibout the increase in jerage tluor spacc and shows tIll comTrsion of these projections into the total floor area for 11lW housing The low growth housing unit fOf(ast is combined with the aS~lmption of a 20 pershy(cnt increase in loor ~ma by 19RO The high growth Iwusll1g unit proiection is combined with a 1110re optimistic projccti01~ of averdge floor area (30 percent incrClse by 2000)
C LOG TRADE
The Ljf_t of dCicopnwnts in Japans log output inc new housing Lomtruction can be estimated with the impact multipliers of Table 4 Under the assumpshytion lilat no other ch~ll1gts occur the relation among
Table 4 Housing starts and floor area projections by growth assumption through 1980
Low growth High growth
Year
Housing starts (mill units)
Floor area (20 percent) (mhouse)
Total area millm
Housing starts (mill units)
Floor area (30 percent) (mhouse)
Total area millm
1980 1 5 i-no 13 2 165~ 870 1437 1981 1584 8785 1392 1676 886 1485 j 98 1644 8870 1458 I 761 9021 1589 J983 1638 8955 1467 1758 9182 161A 1984 1643 90AO 1485 1765 9343 1649 1985 1620 9125 1471 I ~ 5 7 9503 1669 1986 15 83 9210 14511 1 735 9664 1677 1987 1626 9295 1511 (mn 1 1795 9824 1763 ]988 I 549 9380 1453 1720 9985 1717 1989 1570 9465 1486 1761 10145 17 87 1990 1506 955 1438 1709 103 i 1762
1991 15 51 9635 1494 1768 1046 1849
1992 1516 9720 147 A 1745 1063 1855
1993 IA70 9805 1441 1712 1079 1847 1994 lA40 Y890 142A 1695 1095 1856 ]995 1413 9975 1409 168 I 11 i 1866 1996 1350 10060 1358 1631 1 127 1838 ]997 I 335 10145 135 A 1640 1143 1875 IlJ98 l 285 10230 131 5 (1111111 1603 1159 1858 ]999 1318 10315 ] 359 1650 1175 1938 2000 l~1l9 1040 1341 1636 1191 1948
14
Table 5 Japans housing construction roundwood production and US log trade
Under two scenarios
Low income growthhigh roundwood production Highmcome growthlow roundwood production
Roundwood Roundwood production US log production USlog
House construction (35- year exports House construction (50-year exports (3 percent income growth) rotation) to Japan 3 (6 percent income growth) rotation) to Japan mill m 1 floor area m1I m mill m 3 mill me floor area mill m 3 mill m
1976 Actucl 20lJ lOA ~O9 04 1) 1981-85 1456 255 86 1596 11 0
1986-90 1469 518 0 j 74 i 253 9 1991-95 2448 9~ 2 0 185 290 1996-2000 1345 tlU 0 1)91 336 53
1 SOurce T ace 4
SOJrce Table 3 Reducticns Jarans fmport demand C0r18 entirely at the expense of lS trde hecause of the resjd~al s-pplier assurnptior_ Thus zero trace
-lith US is consistert With several states of Japans tog trade If the assump~ion tlL27 exporting countries foreign suppies are perfect~v ifeastc s abandoned then expanded Japanese SLpply beycnd zeroUS trade levels trst mean lt reduction in trade vgtlth Fussia Nev Even more abundant supplies in Japan WOLJld suggest that Jaoan would tailte the role oi an exportng country
Jog tr~lJ~ (QIULSL (lUllChH10d udion through ti1( 19905 Lncler tl1i- ~(lnclrio tr3ck wolld (QRPJL dnd hOll~ji1g starts 15 tIl1uin stahle illcar i 0 mill 111 L t11l
]980s but would drop llally during Ih~ li~I~Q[U =0 - -i-66QPRJ + 0492LlHSJR bull oftwooJ Ilnll illlrCald Log tLlic at thl end ofUsing Il) ( lidta this ditlernct lquatioll Cli be the I()CIO would be hout ktlf thl 19 7 5 In ~l (53(Tko to lir(r relation ~lmOJlg rlKSe thrl ~irlk mill
QILJ j C) i III the sllolld s~nrio inLome g1ot11 is mor(
Tabk 5 iLustrates some llrtlllc OUkOlllCS of moJcLll perClDt) so rlplan~l11Lnt ckl1lal1u tor Japan dOI1l~sr_ lumber mClrkd and the log tl j()I IWllsing i llkc] Jnd ClOOI arl1 l do not the Ilext tW1 dmiddotcade offsd rroiLded dlLIiIh~ in ho
Under onl lln~ri() inco111l growth is brisk 6 COil qucn 11 LLlnstrudiol1 would l(I11) illld rllativclv mature (50-Ycltlrl timbr is through the 1 but lkdinl during the I Vehd In rlli [St d~)meti so Iwrvest wehde this l~kak sCl1ario w-[k lllmbr d(I1~~lnd ilt couplld
Ol1Y -Iighty through the 1980s bUl in the with the hanst of young timber i 3 L Cdtput ould e)llll til 1(nS 1c(llc~ it [cIt [n this middot~l~ cioll1lsril udioll mon than doubles
lW housing (Olhtrudion wl)uld (xjl~iI1d (518 mill 111 3 ) till mid-1 9sOs and mtI the j)lrIocL as trong rtplJz~- thrcughott the remaindn the =Otl1 (el1lliry
ment demand 101 homing 1I1c1 il1CrtC1sl~ lJl Ilour arL3 trad would delline slightly uliring thc early nffset the nUI1lbtT of 1011sehulJ formations and wish during the rtll1lindtf of ril( 20th ~l1tllry
CTlh lIHpal lllultiplltf uf Jal~in Iog production un t S log 1111 port~ is - Given JJ) 84 pllTLnt ~onv(r~ion of rotllld crod 10 akt [he cc llJl alen ( ro]ndwuud ll1ultipli1 -6439
15
Bibliography
(I) Adams Dariu M Effects of nation]] forest timshyber l]rvest on ~oftwood stumpage lumber and pJywood markets an econometric analysis Forest Research Laboratory Res Bull 15 Oregon State University 197i
(2) Adams Darius M and Richard W Haynes The 1990 Softwood Timber Assessment Market I10del Structure Projection and Policy Simulation Forest Service Monograph 22 September 1980
(3) Adlms Gerald F and John Blackwell An econshyometric model of the United States forest products industry FOII S(iellte Vol 19 No~ 1973
(4) Dlrr David R Softwood log exports the value and employment issues USDA For Servo Res PqJ P~i-OO I enS
(5) Floating exchange rates and log lxporr policy Jourlal oFoIltn Vol 5 02 February 1977
For--kr Robert B b panese forestry the 1eshy~Odrc(s industries ]lld markets Canadian Dept l)f til( Environment Info Rq)ort E-X-30 October 1()JS
f CdLigller PauL MauITY BndahL illd Michael Ll11LmiddotSkr Japan(se and Vl~t European deshyl11und lor Us wheat USDA Public WSshy4H Wbeat Situation iLy 1979
(8) Glcruln Rolf Why are our Lxported J
Porllalid lI1agoilll Nowl1ber 1979 ~9) HaynC Richlrd A derived demand approach to
cstill1ating the lin bdweell stumpage wd lumber l11Jrkets rJICI Sciellc() Vol 3 o~ Iln7
(J () I Price im padS of export reshystriction under alternative assumptions USDA For Sen Res Pap PNW-212 976
(11) Henderson James M and Richml E QUl1ldt Microlconomic thLory 1971
(I ) I10liLmiddotk James P and Paul Gallaglwr Till Price Rlspomivness of US Corn Yield A iIIcricoll UI1I11(1 of Agricillillral IC()III111shyleI Vol 58 0 4 November 19 7 0
(13) hpan Llnber Jouma Vol 12 No4 February 219 7 1
(14) JUJall LlIliberolllllal Vol 21 lo 11June20 I C)xO
(15) Japan Forestry Agency Forestry in Japan Dai Nippon Printing Co Ltd 1069
(16) White paper on Japans forest inshydustries 1977 (English edition) Japan Lumber Journal Inc April 1977
(17) White paper on Japans forest inshydustries 1965 (English editiol1) Japan Lumber JournaL Inc 1965
(18) Japan Ministry of Construction HOllsing in Japan 1975
(19) Kmenta Jan Elements of econometrics The MacM i1Ian Company 1971
(20) Nordhalls WD Recent Developments in Price Dynamics in The Ecol1ometrics of Price Determination Conference O Eckstein ed Board of Governors of the Federal Reserve System and the Social Service Research CounciL June 1972
(21) McKillop William Structural analysis of Japashynese-North American trade in forest prodshylIcts Forest Science Vol 19 No l March 1973
(1~ Mills Thomas J and Robert S Manthv An econometril analysis of market factors deshytermining supply and demand for softwood lumber Agric Exp Sta Rep No 238 Michigan State University February 1974
(23) Samuelson Paul Economics of forestry in an evolving society Ecullomic fllllliT 14440492 December 1976
(4) Uec1a Michihiko Japanese long-term housing outlook State of Washington Dept of Nat Res 1979_
(5) US Department of Agriculture Tht Outlook for Timber in the United States Forest Resource Report No 20 July 1974
(26) US House of Representatives US Trade with ] apan - Public Lands Timber Export BilL Hearings before the subcommittee on intershynational relations Ninety-fifth Congress April 4 ond 21 1978
(27) Walker John L ECHO Solution Technique tor a Non-Linear Economic Harvest Optishymization Model paper presented at the Society of American Foresters Workshop on Systems Analysis clild Forest Resource Managel11l1t Athens Georgia August 12 1975
16
Appendix A
Table 1
Endogenous variables
Year ODSJ(g) OPSJ(g) ODLJ(g) OILJ(g) PJLUMab) PJLOG(m) PUSLOG(k) PUSLUM(k)
1960 1961
212334 224810
2123340 2248100
155360 202860
8198 9630
630 630
67 7 ~ 65 72
1962 222420 2187000 293900 16870 201280 10000 611 66 7 ~ 1963 243460 2372400 313200 26360 205360 10215 62 67T2 1964 254030 248370 342370 32980 207610 9987 64Y 6658 1965 267550 262790 344650 35090 206110 10042 679 6672 1966 286220 279930 364870 45040 218530 J0403 700 6891 1967 312290 301390 394300 67670 245860 12852 734 bY73 1968 328140 314670 414040 91750 256750 13757 875 Y1] 2
1969 333970 324500 393500 85400 262500 13Y20 1078 9210 1970 338290 327500 413370 102380 255420 13692 1007 1413 1971 322920 313810 379410 77180 243330 12955 1001 Y777 1972 333090 323440 423730 111870 339580 14400 IIYI I 1741 1973 338490 325130 436430 118100 48167 0 20724 2070 15223 1974 307170 2951500 373600 98150 462500 23874 2097 1350 1975 283510 273620 359340 103830 440000 22 58 1976 13764 1976 301020 286490 377710 110970 475000 23260 2313 16798
Exogenous variables
Year OISJCANg) QILJSOV(g) QILJO(gl WJ(h) CAP EX(hj) WPIUS(j) DSTRIKE
1960 154 648 3Y60 Y49 0 1961 169 686 36180 945 0 1962 3720 11840 5520 198 724 359IJO 148 0 1963 6220 13610 5750 227 763 36240 145 0 1964 5660 17530 6240 649 80 I 35849 947 0 1965 4760 20350 6660 271 839 36149 166 0 1966 6290 25580 9000 304 877 36235 Y9S 0 1967 10900 39710 13150 352 915 36215 1000 0 1968 13470 49910 21290 411 953 36055 1025 0 1969 9470 53550 22820 480 991 35837 1065 0 1970 10790 61670 27020 548 1000 35815 1104 0 1971 9110 61650 27380 632 1000 34803 1140 1000 1972 9650 68010 25960 757 1000 303 1 1191 ~ 1000 1973 13360 78110 26030 985 1000 27122 1347 0 1974 12020 71740 19380 1188 1000 29151 1601 0 1975 9890 68950 10460 128 7 1000 29680 1749 0
Exogenous variables
Year HSJR(i) HSJNR(i) HSUS(I) HSCAN QPLJ(g) QPLUS(g) QPLCAN(gl
1960 28972 32489 12960 108858 245760 1961 35588 42281 13650 125577 260200 1312350 453690 1962 35757 40888 14920 130095 259670 1422800 512310 1963 42602 44602 16420 148624 267480 1421660 545990 1964 46930 58800 15610 165658 285620 1508040 571610 1965 53630 48670 15100 166565 282550 1537780 587410 1966 57810 51927 11960 134474 285250 1573180 592220 1967 70387 67011 13220 164123 273 7 70 1559020 589190 1968 83605 76865 15460 196878 251090 1703450 633680 1969 93971 88776 15000 210415 231730 1580250 697460 1970 104746 100288 14690 190528 222300 1564680 712730 1971 105796 91941 20840 233653 213200 1726110 735170 1972 134707 109132 23780 249914 217890 1628390 763270 1973 152421 129330 20580 268529 214190 1635000 918650 1974 114123 84430 13520 222123 184330 1570340 806490 1975 120402 75890 11710 23]456 176100 1527860 693220
Sources are listed following the data table The letter of the source is indicated immediately after each variable name n the table submiddotheading
17
Appendix A (Sources)
(a I ifiJl () ( he L ton ber 11a c [ J ~t pa n forttry -lil1Jstry No 33
1jlllhli RlJI)rT rlie Liil1hcr lJurkc LiPlII
Furcst~y li1istry 0 )95 l(f)ll(JJl(- Inkrnatiol1JI
Fdition fir P(f)duC[ Sililli( I Seri j
JJ Ln i ted -J ations Tim ber Bulkt i 1
Europe VeL 30 Sllppkmcnt ( 1111 P)(I un FOreiT
Lpctri Lumber Journal _1r)Jl ~5tari51[C uf -1
rcriL 1 Forestry ~1 ~lIlL
Y(frJilj iii F()re)f prncuc FAO U VJriOl lU(lt
~ll)UIl )flisrilai ~c([r~f)k BurC~tLl of Sl tisti~middot~
Office of tilt Prme 11111i~t (1) SI7i fics middotiI Fore i ( lriiUr F sr
PIeld cts Di~ltun ForcstnL ~usL qC
I i riiiti Finunetil Srailsfi f3 SLltiqjLS Inkrnaticllal fonltar FdlLl
~TllJCr 1978 i k) Fr dic ii Prin L
UrrIiH(sf 1(((1 Sec()l7d North(q F t Jl1U
plr imt1t Statjpl LSDA Ishy
( [he Dci))w lUI Priel SirWfi(1I Ii PI)(iilciS l)-(j 7 forest Senice lSD vli~~cilJll((ll~ Puhli_ario1 ie 135~
f Ill An nck~ of huln~L in Lpan i
LonstnhtecL LLL Cor du the
1970 DocnllCl1tatlun of dat nd The m(thoc1 Llsed in C()1l11V
index be ()bt~linlcl from urhor
Appendix B
The intention hlrc is 10 Hlutratc- tl1l~ Lffelt~ of d more restridiv juoU 011 il1c1 lumber prics The Llleds of ncting quota are tlllc]w clcl11onstrltccl as a Firll Ve Lonsickr ilk imm
in the graphical exposition of till p~lper Then the scconclan
dJlIst1l1Cnr t[1i1 lumber markets balk to ibriull1 lIh reduced form LqLlatitJ11
Two SllS )1 Lquation vllLh Ckllibe the dClI11CSshytiL softvood cLonomies Jnd North America r rht blocks for
1 f ODSJ f PHX~l 11 J QPSJ
-~PJLCl ) PLOG
(31 ) QDU Q J + J PJLLI1 J
1 PLOCr
(4J J QPU J PLOC
11 1 QPSJ (lIS
IL] = j
mil AmcriLC
Ai i PALL~1
i ~AJ QPSA A +C~PALt1
3A) QPL~ A A3 PA Lt vI
=ODSA QISJ
I hA) QPtA QDL + L
dOl11srlt QDSA a1 ood doncti~ (onslimptioL ort1
Allknl
QPSJ (1wn cod itiOIl J l~)an
QPSA d uod
QDLJ log dOllleSTic J dP~i1
QDLA j()l~ltStic Qrth Ameri(
QPUshy
PJLCM
PALL1l 1tun be- r onh Amerkd PLO( in Lipan ~imiddotd orth AmenD
sr S~i 1Clod ml)ortlt Japan I tog~ncuSl
The disctlSS oj pnL b([lavior IS Gist in term ccluatiom whith dltscribe eqllilibrium In (21)11 of
th three interrelated softwood markets Tile first rdatJonsllJp stite tint Japlttns Illlllbtl markeT is in Cq II i ibri Lim _r ro 111 I iJ L (2] I ~1l1 d (5 J ) it fo II 0 W s t lta t
18
1 ---QISJ 3 + 3~
Similarly North Americas lumber market is in equilibrium when
A A A (X]- CY 2 )2
(B) PALUM = + PLOG + QISJ 3~ + 3~ 3 + 3~ 3~ + 3~
from (lA) (2A) and (5A) Log market equilibrium depends on conditions in Japan [equations (3J) (4J) and (61)] and North America [equations (3A) (4A) and (6A)] It follows that
J J (A A 3 J 3A((X3 - (X4) - (X4 - (X 3) 3 3
(C) PLOG = L +TP JLUM +LP ALUM
where L =11 + Y~ + YI + YJ
INITIAL EFFECTS
First consider the lumber market in isolation From equation (A) above it follows that
6PJLUM = - 1 6QISJ iJ +3i
A more restrained quota or the imposition of a quota say 6QISJ = - 1 raises Japans lumber price by
_-1-_ Similarly the re13tion between the quota
pi + iJ~ mu North American lumber pricc is
6PALUM = I 6QISJp1 + iJ1
from equation (B I These lumber price changes correshyspond to Figure 2
In turn the lumber price adjustments alter the log 1113rket equilibrium as in Figure 3 From equation (C)
J A 6PLOG =lL 6PJLUM + ~6PALUML L
The log price ch3nge resulting from the quota is obshytained by substituting for the lumber pricc effect
6PLOG = lSA LSJ] 6QISJ
where SA =iJ1 (j3~ + 31) and SJ = iJsect(pl + 3J) Thus a more restrictive quota will increase log prices
6PLOG 0 I d I 1 h N I(6QISJ lt ) provlc e t 13f t 1e s Itt 111 art 1
American log demand sA is S111311 relative to the shift in Japanese log demand SJ
REDUCED FORM
A series of adjustments in log 3nd lumber markets must occur before all three markets arc in a consistent equilibrium For example the new log equilibrium adjusts lumber production plans in both countries thereby setting off more adjustment in lumber price In turn a new log equilibrium is established The
19
equilibrium that is consistent with equilibrium in all three markets is given by the simultaneous solution of (A) (B) and (C) Converting to first differences and substituting (A) and (B) into (C) yields
6PLOG = iJI [ JYi J 6PLOG - J 1 J 6QISJJ + L iJl + iJ2 iJl + iJ2
-iJ1~ 11 6PLOG + 1 6QISJ ]
L iJ1 + iJ1 iJ1 + iJ1
Rearranging gives
6PLOG = J J A A 6QISJ L - S 12 - S l 2
The denominator L - SJ Yi - sAY1 represents the sum of slopes for foreign log supply and demand schedules L gives the direct effects - the coefficients for log supply and demand schedules The terms
sAY1 and sJ11 give log market adjustment to log price that result from 3djustment in the lumber market It is reasonable to assume that the foreign log supply is upwards sloping and foreign log demand
curves are downward sloping ie th3t L - SAY~ shy
sJY1 gt O Thus log prices rise with the ql~ota
(~~igG lt 0) when SJ gt SA ie when the shift in
Japans log demand exceeds the shift in American log demand
Lumber price changes are obtained by 5ubstitutshying the expression for the log price change into (A)
or
f~(SA - Sl) J LQIS16PJLUM=~_SJ)~_SA)i -j $i + ~i
IAs before the term ----=-J-~ represents the lumber
PI + pi price change that follows from a change in the quanshytity of lumber The bracketed term shows that a more restrictive quota will increase J3panese lumber price
(6PJLUM)lt0 d d 1 I d f shy6QISJ prOVl e t 13t t 1e 111 lrect e teets at J A J
the quota on domestic production 12 (S - s ) SJ J SA AL - )2- 12
do not offset the direct effect of the quota in reshyducing domestic lumber supply (- 1) When SJ gt SA the lumber price will always increase and when SA gt SJ the price will still rise provided that the difference SA - SJ is small
C

Variable Description Units
()DSJ( srJtuoc lumber (sav ilmiddot 1000 middotiJod lpprcnr
OlSJ 1 sulwuud lumber (aVll 1000 voudt JUIllestic
r tljXlJ1 suttwooc 1000 venee
OIL and i 000
l1urkLt The Jj)vanhloping supply of logs L)fTcr~d
by tht (S (15() ill h i~ derild from tht Joshyme~tiL lo lipph (SIC) and demand (De) rtiatJons in
c Japall sf ckmancl (LD) is [ormed from thL dOllHtiL lippy (Sl ) ~llHI dLI11Cll1d (D I rliJtions in ~ SlllLe fret trade prtIIls till log l1larklt ticals at priLL PLOG nd tht amount QILT III logs is hipPtd from th~ LS to JIlan
Thlt lfkcts of the lumher on the kd II abo ~hcwl1 in Figure 3 re~llib 11 the iltnj1itJtl(in of till ckrivld lkmand
Dl aile fitaily these dowll~r(kloping Clntgt ir~ tOll~lnltted un the agtsllmption that proshytt~urs lkli(d dCillmd for lugs II1mt be satisfied
thimgc the profitability of doshyand art represented by movenwnt
dCIl1~llHj uns Changs in lumber prile~ abo I11f1Utl1ce the prorit~lblity of d011le~til prclssing but nPJ~tl1tld hifts in thl log ueml1d ~dltmiddotdl]- ( i) Imposition of thl lumbLr qUO I Ii iI1LT~ise L ILimbL and GIUSl
111 ottvd llt1 Jl1d tor (]) to D in (~ i I lorth Amaican lumber pnt(s I i billkvird Sllifr in llS prUCLur dcnnqit del1lC1l1d for logs I De to
DlS in ( I Shitt i 0 dlIT1Ulli lll-duk I re-llit III st r uillaml i EUL I lind murl ahundant SUPl liS ) on luI gn 11arkds in (31)) Thefl shyfore tll lurr qLiut~l dl iihT(ii trltk l indishyLaltt LJ III 1_ I IlovILlL pn either inLTtib 0 (kLTcccY dLjxnding lill ILL 11l
tudL )f the Ilitl in Jaliln t (lllllillid [mel r ll Tht LaC Ctl rewlihly strong shilt il]
JaPdiS ckllialld i llU j 13 the 1l1shy
LTeil( to P L 0(
An Econometric Model
A OVERVIEW
This ldion (Olltil [utiorical model ul the US-JapallLsl log tLlck It L1ll thl ddennlshynans of Jlpan r (kmand but illLOlll1ls for III in CS d Canddidl1 -oCtvmiddotood 111 a r Lct
T~I hie olltilin a cUllll11(ry c) the rllatiol1silips in thi -equcltion mudd
Jlpclll m~lrkd h dCLribed b~ thrcl ~tilllakd rllation~l1i Till iumblr citmdml equation i 1 ) lllcclshy
surL the u~tllllnts of mhtr LOnSllnkrS to ill lumber prill ~incl new Ii Till lumber production responst fUl1dion I ho- procssorsmiddot rltaction to hang6 in log ltlLl 1111llblr pricls wafcs and ldpacity l~quation (4) llWaSllrlS the tOIlcrSlOI1 logs te lumber Japans I() import deshymand Stilt-lillie is the nsuit of combinitH these estishymated relations with market dearing i(ftlltitilS toJ lumber (equation 3) and (equatiO 5)
6
Table 12
11 i Japand(Jlnestil lumber cunsumption QDSJ 1 (PJLL~11 HSJRt HSltHI
(~J Japan-d()tllelit lumber produlion QPSJ 1 = r(PlLlM r middot PlLOG t lilt CAPt PJLOG
1_1)
i ~
I Iapan-iulll[lcr Iliarlet identity QPSJ i QISlCAN t QDSJ r
( ) J Jpallmiddotiumber c())wcrsion hum OfS] (QDU QDU)t
( I JIJdil-lug lmpults frum Us (idelltiry ) QILlUS t = QDLJ QPU QIUSOV - QILJO
( ) ls-Ig expurts lu Japan OIUeS f(PUSLOC 1 PUSLUM QPLlSrt
DSTRI KE I l
(7) ( and U smiddotlogmiddotlumbtl prIce relatlllISilip PUSLlM t 1(PLOG 1 HSLSr HSCAN QPLCANt
QISJCANJ
US and Japall-lug prke linkage PLOG 1 = nPllSLOG EXtt
Endogenous Variables
us wholesale pIKe
edtl- hoards ( i
PJLOC lwes~lIc
S1 i
PlSLl~l United SIJles whOlesale p mb it 5 percen
to and btl rJlldum ho Lub
PUSLOC DUligias iir wmili log S1l1bL Csterll WisllinglOf] weStern
Exogenous Variables
Variable Description Units
HSJR t stans residential 1I1i11 llSJNR 1 Lman tdn~ lun- mi1l1ll 2
re~ide1tjal HSUS 1 Ulilled States hOllslIlg lttarts 1000 lJJ1tS
HSCAN 1 Canada housing slarts 1000 units
Table 12 (Cnn Exogenous Variables
Variable Description
Japan suft v (lOct saw logs and veneerlog~ ctomeslJc
QPLUS j lrited States soflwood domelic
QPLCA1 Can~lda softwuod v(neeriugs domliL
Jmm f oftu-d Ullber fron1 Callal1~t
QILJSOV 1
fro III
Ihe Sviet tnio11
QIUO j j OOU
WJ 1 000 r
CAP
EX
WPILS
DSTRIKE
The 11Otl noclet intentions (or the Notl Amrishyem supply side are to (1) ll1t3sure LS adjustments to chmging ccs aIld (_) acount for the fact that US processing adjustment alter the US-Canadian trade which in tvrL lIScS lcljltstshyment in the North Americm lUI1Jber prile Accordshyingly the log supply relation (equation ol is estimltecl directly This equa tion me aSlIres U S processors ddjustme nt to changing log tin d I UIll bel priles with given log produltion A second beh~ioral equation (n dcslTibts the rclation btween Korth American log and lumber prices The builds on the ~lssumption of equilibrium the LSshyCanadian IUllIber trade and accounts for thL Cillatiian log embdrgo
Eqliation 8 a dose relatiol1hip )x
twetn Us and prilCs Thi equa tion builds on the assumption frft track in lhL
market Log ~upplies are taken a- perfectly inelasti (nogshy
enous) in all three countries It reasonablt thlt to) supplies arc pusitively relakd to prit in the longest run of our theoretical exerLisf (Figure 3) a sllstJined price increase for example calls for increases If leat with rotations on a given ncl base mel mav also induLe an investment in more land uced for log production A thorough econometric
7
5 mue nf holale j U(O
A dUl1lcl variable w hieb (OUlil S
fortle1 effectsuf(liel West (ltlast dock rike t = I
I md l() ]q-= ncl otherwise)
Units
[000
i 000
1000
1000
1000
i1Olvltr must tilJi dh StlLl other probkms ~uLi1 CiS the short-run llonomk problel11 or marketing lutur timhf I ~7 I the fonls afflding ineTI11tl1t in future timber l reror~staiOl1L and the rules )ocrning management of pullic forest 1~II1(ls Such an tl1~1 IS the SLOP~ of this inVLstigltion
B JAPAN
lation oi ~[ll1dard lIltit)J1 ~illd guided othtr
11I1lt1ti0I1 to J1l~lrkd~ yielded ~ais-fesuJ ts
nspons es1 i mt tes SltllC1ltrd 11lCury In gll1trJ1 dLshy
middottput input priLcs for a facshyturs and quantitics cf fiJcd inpuh (11 In most forshyest ppliGitiul1s ) md abor ac Likcn igt lrilbll factors while proClssors capital lok 1 (1 ~ 22)
l~Timatcs llClr rlspOl1Sl 10110 [his get1Td its 11lClSSan to be war~ r ((lures of Japans w)od ing i rid pro Ltssing pandcd the I C)60s am no
I Illllsure ~ I~libbl( Thus a Pkil~ illtil ws d with Klcins 1r(I1J through rllaks metl1od Stcond lolinearit) among lumblr and Ce data made cqimatioll of (cetTishylIe]s dililllt In inincr lTlr(siol1s ali thrll
s bd 1ccorrlLl Sie~L but till ilillbcr C~PS)lbe d~ small r~lltil ro input pricl llatlli shy
tJl$middotmiddot ALLmdl in]ut pnccs vcr comhil1ld tll
Tlle hest Slt 01 v on WltfCS and thc log )lrl- II1dex WJ ubt]il1ed by l11inil11izine the ~111l1 01
1 T I ~ 1sc llrl( lrrors Ll 10 lOmg eq loa tlon lst Imake wilh Il~st squares wa~ the bcst of sClral similar
tions I) QPSJ 2r 147 -- 0 l8~533PJLU
(336) I ) 77)
(456 i 11584)
DW == 106 s=
u indlr prolil
or (1cgrC llfO in produl and inpu I j 2 ((jn-tyulntly al~ ~ontrailll dri1Cgt ~~pprup1JIl
ur produ-t ~Hd inVli~
gt 1= 1 cQPjmiddot lL r~
CQ the [qiclt) III OUlut le)1 wiligt r~pcct 10 th~ pri(C ()[ oulmiddot put rP h r nUlput Qi it11 rcpcc1 [() th price the j
th arJJbk llj In pril~ clastiil) eceeded the JUn
where Equation 2 below was the best of these formula-
CAP == a capa(ity index
CAP == (- 53532625 + 1246125T) 32750 if Tlt70
I ifT ~ 70
note QPSJ (1970) == 32750
PI clt prje index for variable eost items (1962 100
PJLOmiddot~ 03-~WJ== 065 G + ) 198
Dependent variable mean 28058 Historical period 1960 to 1976
Lumber demand origmates in the construction indllstn Thus lumber consumption should depend on prices of lumber substitute inputs and output Ii e hOUSlllQ or non-residential construction prics) Empirical st~ldies of lumber consumption typically relate consumption to prices of substitut inputs llovcer output quantity measure (building starts are used instead of building price Additionshy
some investigations account for the different lumber reqllinl11elts of commerlial and residential ~omtrucrion b the use of sllch ariabJes as separate residential and~ non-residential construction or ratios of tlwse Iaridbles
Attention to characteristics of Japans market should enhance the dna lysis of lumber consumption First it is low quality hardwoods (Juan) and non-wooden building methods both substitute for sotwood ll1 buildings Second the composition cf Japans blilding actiity switched during the midshy1960s In the early 1960s most building was intended for non-residential use but later credit for residential construclion was more plentiful and building favored residential construction Accordingly one should account for the effect of this change in building comshyposition on lumber consumption
Several sets of explanatory variables for explainshying historical yariation in apparent consumption wre considered Experiments involved comparison of n0111inal and real prices alternative responses to rcsiden tia I and 110n-residen tial construction and tests for substitutions between hardwood and softwood lumber consumption Regressions litl1 real prices had iovver explained variations than analogous specificashytions with nominal prices Also when luan lumber prices were included coefficients estimates were small relatin to standard errors It is difficult to conshyclude that this ~ub~titLition does not exist since the simple correlatlOl1 between cedar and Juan lumber
ces was around 096 Colinearity problems also precluded measurement of separate lumber responses to residential and non-residential construction HowshyeveL regressions with total building starts and the proportion of residential to total construction yielded reasonable results
8
tions (2) QDSJ t 12468047 - 02850614PJLUM t +
(165) (302) 028
8424076HST + 21974600 HSR (708) (1232) +045 039
R2 == 08238 DW 08693 S 184069
where
HST = HSJR + HSJNR
HSJR HSR == HSJR + HSJRNR
Dependent variable mean 888067 Historical period 1960 to 1976
Most statistical properties are acceptable Coefficient estimates have correct signs and t ratios indicate sigshynificame or contribution to explaining historical variation Also a high proportion (8 percent) of consumption vanation is explained However the Durbin Vatsoll Statistic suggests that unexplained variation ma not be due to random elements Several possibilities for exduded systematic effects exist First the pattern of residuals switched from positive to negalive in the mid-1960s and this change correshypol1cCed to a nev composition in residential and n011shyregtidential building Thus it is possible that some structural changc ccurred at this time Second the inlluence of lumber inventories is buried in apparent consumption data so cyclical inventory adjustments could account for the residual pattern
The relation between log and lumber markets is given by a simple regression of sawl1wood production on apparent sawlog consumption This approach is justified on the grounds that there is a fixed rate of conversion between logs and lumber The exact specishyfication presented here employs cUlTent and lagged values of sawlog consumption since it is likely that imported sawlogs are not processed until a later date When lagged log consumption was included with curshyrent consumption R2 improved slightly but the sum of current and lagged coefficients remained fixed around 085 Equation 3 belowshows the results
(3) QPSJ t = 27660964 + 060467347QDLt + (131) (652)
O24336772QDL t _1 (301)
R2 0942 DW 116 S 84041
Dependent variable mean 2888487 Historical period 1962 to 1976
B THE UNITED STATES
The US excess supply of logs is by definition the difference between domestic supply and demand
In general then log exports can be expressed in temlS of variables that influence domestic supply and deshymand functions In the statistical analysis of US log exports domestic log supply is taken as given Processhysors log demands depend on log and lumber prices wages and processing capital
Preliminary estimates showed that real prices exshyplained more of the historical variation in exports than similar regressions with nominal prices and that wage rates were not significant explanatory variables Additionally it seems that the prolonged west q)ast dock strike in 1971 had a substantial effect on US log exports This finding has been confirmed in other studies of trade between the US and Japan (7) Accordingly a dummy variable has been induded to account for the effect of the dock strike Equation 4 below shows the results of estimation (4) Q1LJUSt = 24716578 + 9736503PUSLOG t shy
(330) (373) WPIUS t 122
63801 66PUSLUMt + 017873QPLUS t shy
(104) 069
WPIUS t (304) 377
242494DSTRIKEt (195)
R2 0793 DW 151 ~
S = 1590
Dependent variable mean 74909 Historical period 1962 to 1976
C EQUILIBRIUM IN US AND CANADIAN LUMshyBER TRADE
Much empirical analysis of price behavior begins with the notion that supply (or cost) and demand (capacity utilization) forces both to playa role in market pricing 4 This principle is applied to the probshylem of estimating the relationship between log and lumber prices for North America The basic building blocks for the price equation are (1) lumber supply and demand relationships in Canada and the US (2) the assumption of free trade between the US and Canada in lumber and (3) an embargo on log trade between the US and Canada A linear relationship is developed with the North American lumber price as the dependent variable and the price of logs housshying starts in the US and Canada Canadian log proshyductiqn and the quantity of Canadian lumber shipped to- Japan as independent variables This relationship is applied to time series data for the 1960s and early 1970s
Suppose that (1) US and Canqdian processors face the same lumber price (PUSLUM) but (2) Canashydian log export embargo drives a wedge between US log price (PUSLOG) and Canadian log prices (PCNLOG) The lumber production (QPSUS) conshysumption (QDSUS) and import (lCND) relations of the US market are
4 Nordhaus provides a review of some of this literature 120 pp 34-42)
(i) QPSUSt = aj + 131 PUSLUMt 11 PUSLOGt
(ii) QDSUSt =ai PUSLUM t + Y~ HSUS t
(iii) ICND QDSUS QPSUS tt t
Similar production (QPSCN) consumption (QDSCN) and import supply (lCNS) relations are given for the Canadian market
(iv) QPSCN t Ct + ~T PUSLUM t YT PCNLOG t (v) QDSCN t PUSLUM t + 12 HSCN t
(vi) lCNr QPSCN t QDSCN t QISJCA
where QISJCAN is the level of Japanese imports Since the Canadians embargo log exporL domestic log consumption is to production Given that log supplies are assumed to be perfectly inelastic Canadian lumber production is determined by log production Thus equation (iv) can be rewritten as (ivr QPSCNt aQPLCNt
where QPLCN t Canadian sawlog production The lumber market equilibrium price relation is
obtained by developing lumber import supply and deshymand functions assuming tha t trade equilibrium occurs so that an c(pression that does not contain lumber Irade C211 be developed and rearranging The US import supply is obtained by substituting (i) and (ii) into (iii) to yield
(vii) lCN tD (a~ al) (pj + p~) PUSLUM l +
11 PUSLOG t + Y~ HSUS t
Similarly the Canadian excess supply funltion results from substituting (iy) and () into (vi)
(viii) ICN~ + QPLCN t + 135 PUSLUM l -
HSCN t QISJCANt
Assuming trJde equilibrium (lCN~ = lC1-Y) (vii) and (viii) can be combined to obtain
I I Ox) PUSLUM t K + 1 PUSLOGt + 12 HSUSt
12 S72
QPLCN t + 12 12 12
where S 12 til + ti1 + Equation Ox) gives the theoretical basis for anashy
lyzing log-lumber price relationships The relation sugshygests that sans shifts in market conditions log and lumber prices should be positively related Furthershymore given log prices lumber price should increase with demand expansions in either country (HSUS and HSCNJ or supply restrictions in Canadian markets (reductions in QPLCN or increases in QISJCAN)
Estimates of this price relationship yielded satisshyfactory results In equation (5) all coefficient estishymates have correct sign t-values for the explanatory variables indicate significance or contribute to eXshy
plained variation and a high proportion of historkal variation is explained
9
(5) PLSlUl1 ~4lt)h04 + 057 2~ 1 PLSLO(t + 18 C))
5 HSlSl + 0130093 HSCAN t (270) (120)
+ OOOk34x OISJ( ANt ooooqP ~lt)5 QPleAN) IjO()1 1~7 I
R2 = 7raquob DW 3 S 515
DependtlH variable mean 98 i l-Ibtorilal period 1962 to 1LJ7(1
E USmiddotJAPAN LOG PRICE LINKAGE
BeClllse or the Cree log tLlde pricl differtl1l~ bmiddotshytwecll Japan ~ll1d the US should rdlcLt transshyportation Lhargts exchangt rilles and qllltility diflershycntills This close rclltionship i approximated
of hpan ~ PIllC on the )lt11 eq~l tnt thL liS
Ihl PJLOC 1 4S25 -+shy
OOCJ3~25 3h (PUSLOC I Xi 11 CJ 1q I
DW = lh4 s 0
r-1 i~1 )ri ~(i I 19htolq7(
Impact Multipliers
~lujt IllClS11rl th o~ra (tTc r that de- out~idc the
the i1~ihsi section dcniOnstrdcd that n icrcdsc in Japans l(Jl1shy
strlcilC~ -I1cOuragl- dornestil iU[T1bc
Table 2 Impact lHuitiplieTS
MuJipliers provide u method of accounting for u ~eries of stcondar) tffeLts in the eXdlll ex panshy~ions in dOtn(slic lumber consumption an lt1l(0111shy
pJIlicd higher lumber and productIOn In Turn log prices arc bid up and the US provides more
to Lpun at tht highcr prile Higher lumber prices vQuid [ISO oC~ur in rth America beldLlst logs arc dihrted from domegttj( markets shy
The uitiplin (imale of Table ir base(] on The srJtistical rdatiollShips of the previoLls sediol1 An initial al1d trade l(uilibrium is rtpre~ented
equation i I til (~I for 1 eve of variu bL A second level is
ror the ast where one lxoenous t~ tlLm in the iir sOiution
(iatil tiut tillre J
ion (i nd
[nilS )f trllk hmn The lorr(~poncl
shy ~Hbuattd il
td ILlmlllf il JJpal1 II ~ s domestic lUllshy
r lnlding cOLlltries To the riyc r~hiticn betvvtt71
ti1C)- lstlllla tes icuLr prIce
quan
U(shy
J ltLll1
1972 base olution
QDU QILJUS PUSLOG PUSLUM PJLOG QPSJ aOSJ PJLUM
Units 1000 m 1000 m S mbf S rnb i 1962=100 1000 m 1000 m vim Exogenous value variable Units 1972 value Change 1972 421870 111870 1191 11748 1440 323440 33309 339580
-------~----- --~-~--~-------~~-- shy --~
()I~J( I (JO( y65JI ~ )fll - I I
QILlS() I (l(I(1 n~ flU I ( i 0 2) ~f(J- lt (lfl)middot
1I1()(j I 701n ( h I I - np1 I ~lraquo iOPLi
()PI lS LOOO i IhlJL-l)J i i 04 I - (t+J (Ie I i o~~
IOPt( Ai I CtHI i 11 til I i~ UO( U(1 i ~ tH
HSJR ill 11 7
(j i 95 9(4 ~2
11IF Lll 1n 1091 i n I jJ i i~ 1~ i b2h
H s I t)(l U) ~Iil I -~j
HSC U(li 2411 h25 i J)~5 115 191 -I I
~ -1 1filiO lO middot-36 9(middot -](115 - 4 ~
Yen mp
I X Yln 3()3IU[I 10 ~I is 195 -1 -----------~--------~~~---~~
10
19hO O~51
iii
j l i IlJ2h
A THE NATURE OF ADJUSTMENTS TO CHANGES IN JAPANS MARKET CONDITIONS
il ItllS1Il ot nd trck l([just nol(ortl1 I past rspol1se to hmgec ill
economi llI1ditiullshy
il US~iOll
Th
1rb T of 4 than ILlf hi lldrL( r
Fililn non II is i1cn
Lstmenh In rIll dj~~
(rAIT n ilnnluh I
ltil11br will Her Lq)~tn 1 hr Til ~rilll 1 T lhk indiCik
lrk elir t~ 1 [11 l ll(-l s t tumshy
b[ 1rl(k 111 ral in t l S 111 ~ji]1S ~lLti I
1lldrkeh 1 0 mil]k 111 lllr i (QISJC i
t h__bull
ccn ~tn tP~lll dorIIliL COn~Ullplil of ~73 111il1 111 3 nld 1 1coudion citJl1ltic ltmhlr productiu (QPSJ i uC 4+ mill Rtdll(Td 00111shyti PW(i-ii1g il1lpEc~ mill ill III d(lllltq log ljjQm ll1d porh irul1l the ( S ((jIU I Japal1ee lu miltr (PJ L UM i la II ( 00 ~ 11 ~ 11
(1 jwrcn1 iUl W 11101( tiflll upph while (lr1 AnlCricm lumher (PliSLUM I (S7gt- 11m) I
~Thl~ (--tirn~ dnhHln~ wilh Lt1CHi~tiJn 1- l-uod rlquif-nhr t ()nd~~n houl tJk~ ~buUl I ill ltif lUintilr whiI h-e ralPv 1-11shy
~O fH[ liti1 (2J L in I 2 ~d--I~ r -1l Plshy
111il II] ~nld -(t11 i-pro~middot~--cd
in~r-middota~middot ]]1 (~ln~1dljn IttI11shy
TI t1mul
ur (1 perccnt) dUe tn lumber iupplies divCrted nrll1 AIllLTic~lll marktl fin lug would fall sligh (1 lernn hCllllse the shi in Ltpancse dlIlLl11d letd~ th log supply shift in orth Amtricll lultig 1)111 h cr [umber pnLC~
S WHY DID JAPANS LOG IMPORTS EXPAND DURING THE 1960s AND EARLY 1970s7
1( famiklr WIth the (ill oi1Cidcd ith nshy
dOllllstl proshyduction and nhrC fJurabk tcr1l~ trade b(1Icn
al1d lhe US Om Lctor that t 111e parshyotler this If(nd w~ llh xpansioll of
ClldJian lumher cport~ to Japan Th llli
pnvide ncii(ilicn of hem iI11POrt~ll1t (~ld1 ul tbc~e f r~ ctT Sllh~ the htIlgc in bltwcen
hCfc R
6QPLJ+4LJl()56HSJR+ 13714 95if-X 50()1 ISJCAN + R
llOUI ti ng tororrll in1trican sllppl hift~
111)2 ariJhk eriou L1Liors till lhange i q(~ and 1C)7() l~~Ul be lulcushy
(k~ over 1h is tillle
-GIUlS
and random fkcts and 6 indicates
= AmiddotllJ IOOC n3 I
1
gtO~( 11000 3rT ( lCJOOOOO m2 flcor reu I
43 A f 1000000 El ilcor IIllI) dcn~ll)
IUK 1 01 000 [113
16 pl~rCe~H
nect~
122 perCllt)
Possible Developments in Japans Market Conditions and Implications for US Softshywood Markets
Future traj(r bne~ depend critically 011 lonshylillr 1ion and clonwstic oftwoud harvest ill
JaPlI1 enario for tilt l1Ct 0 years rtngl from q markh fur new housing and ahu1JdanT riml1er l1inesl to ~trong COl1stnlLtion 111lt1rshyklt and tores1 lutPlI ntar the luw lcvels of tht ] )lk Thi~ SCdiO1 lolllains a di~llssion of faclOr~ that m I Ie in1utl1cc construction and timber hanest ESlimltes of reilsonabk bounds alsu afe preshycenkcl HOll~il1g start are based on preshyviolls research f 21) while ~peculations on future roundwood (1 ~lre basd on crude inventory irowth modd for LIpans priatcly-owl1cd forest The
11
sctmlrios suggest that at best US log trade wiII show a slight gradual decline over the next 20 years On the other hand Japan could stop importing logs from the US by 1990
A ROUNDWOOD OUTPUT
of long-run harvest potential start with tlh Japan Forestry Agencys position that by tIll 200 dOl11estil round wood rroduction will be t 25 time~ the levels of the mid-1970s (14) ~orth AJ11erican opinion seems to doubt the full magnitude of this production increase but not the fact that it will occur (0 25) The North American outlook ror the interim and the species-composition or future supplies seems less certain One author hlts stakd that the trough has been reached and that within the next fin yeJrs harvest from the domestic forest in] CI pa n will i n ~Tease Less has been said howeyer lbcllIt the factors that could influence the magnitude timing and species composition of these output incrcasLs over the next few decades
My intentioll is to present a preliminary discusshysion of ~onwood output potential for the interim pLrioc1 (prior tu 20 10) based on a rather casual intershypretition of thl available JapJI1esc data First some importnt lh~lrackristics of Japans po~t war reforestshyJtion m dislmiddotll~scd Then some plmtsible softwood hlrve~t ccl1lrios 101 the next few decades are preshyslntld I Lommen t 011 some economic forces that COllid in lienee timber harvest schedules In parshyticldar it i argued that future output potential will Lvor ofrwood at the tOxpense of hardwoods Also Japan softwood prod udion could work to displace Imporh hy tile (rly 1990s at the lower end or plausible harvcst ages Finally stand ages could deshypend 011 prilc prospects with f(llling prices encouragshying elrly hlrv~st and rising prices favoring the harvest of morc matur timber
1 History and Situation
Japans artifiLial forLsts are the source of fltture production potential These forests are planted with sekctively brcd seedlings krtilized and periodically thinned In 1976 thcse forests comprised about 40 percent or Japans forest area and contained about 35 percellt or national inventory volume Virtually all oj this roret is planted to softwood and the bulk of this and is privately owned 1975 data indicate that the privately owned artificial forest accounts for 30 perccilt of Japans total forest area
Historical data also indicate that Japans investshyment in artificial softwood forests has come at the expense of natural forest and future hardwood supply potential During the 1962 to 1976 period the total forest area has remained constant at about 25 million hectares However artificial forests increased by 23 million hectares and natural forests declined by an equal amount over the same period (Figure 4) Afforshyestation and cut da also confirm this tendency During the 1972 to 1977 period about 85 percent of
12
the reforested area was planted to artificial softwood forests Meanwhile 80 percent of clear cut area was natural hardwood forest
Figure 4 Forest area in Japan by ty~ 1962-1974
AREA (Mill HAl
~____~___~__~~_~ Total250
200
150
100
50
Artificial
62 63 64 65 66 67 68 69 70 71 72 73 74
Figure 5 Age distribution of non-national artificial
500
1400
1300
1200
1100
( 1000
c 9000
0 0 ~ 800
1i 700
0 laquo 600
500
400
300
200
100
forest in 1975
70 75 65-70 60-65 55-60 50-55 45middot50 40middot45 35440 30-35
Total Area 6915 tho ha
-- I I I
Cmiddot5 6-10 1-1516middot2021-2526-3031-3536middot4041middot4546-5051middot5556middot6061
Age (years)
Table 3 Japans softwood roundwood production - actual ( 1975) and projected (1975-2000)
Million cubic meters National harvested from
Actual forest non-national forest lands land Total
1975 3099 1777 2086
Natural Artificial Projected 35 Yr 40 Yr 45 Yr 50 Yr 35 Yr 40 Yr 45 Yr 50 Yr 35 Yr 40 Yr 45 Yr 50Yr
1975middot80 310 405 773 1054 1216 1681 1313 1032 1170 2086 2086 2086 2086 1981-85 310 405 773 1054 1216 2146 1681 1313 1032 2551 2454 2376 ~ 48 1986middot90 310 405
- I J 1054 1216 4771 2146 1681 1332 5176 2919 2735 2529
1991-95 310 405 7 7)bull 1) 1054 1216 8819 4771 2 46 681 9224 5544 320 2897
1996-2000 310 405 773 1054 1216 10943 8819 477 2146 11348 9592 5825 3362 2001-05 310 405 73 1054 1216 9815 10943 8819 47 I 1022 11716 9873 5UP 2006-10 310 405 73 1054 1216 7787 9815 10943 88 I 81 g~ 10588 11917 1003
The private and local government investment in artificial softwood forests is primarily ~1 post-war phenomellJ (Figure 5) Area planted before World War II h~ld timber that was at least 36 years old in 1975 This area comprises a modest 10 percent of the non-nationaL artificial forLst area Large investment began during the 1950s and early 1960s a period of increasing consumption and heavy domestic producshytion Timber between 11 and 25 years old accollnts for 479 percent of the forest area Substantial investshyments continued during the import expansion period (1965 to 1975) Timber in the 6-10 year age group accounts for about 35 percent of the area
2 Prospects
The prospects for increasing supplies during the next few decades hinge on future replunting Jctivity If the present conversions from hardwoods to soft shywoods cease the longest n~n softwood supply prosshypects will discourage heavy cutting from the Jrtificili forest that was less than 25 years old in 1975 If the conversion to softwood forests continues though it is likely that the area with forests presently less than 25 years old will be harvested as it nears maturity Furthermore plausible softwood rotations are beshytween 35 and 50 years (15) Consequently dramatic harvest expansion could begin in the late 19805 I assume that conversions to softwood will continue The estimates emphasize potential developments of artjficial forests Thus future roundwood production from natural and nationally owned forests are asshysumed to remain near 1975 levels
Future roundwood production on artificial forests is computed as the product of standyield and al1l111ai harvested area Annual harvested area estimates are developed from 1975 age distribution data (Figure 5) With an eye towards developing a lower-limit potenshytial for expansion three conservative assumptions were employed
(l) Annual harvest is evenly distributed within the five year age groups specified in age disshytribution data
13
C2) Area that is presently beyond harvest age will newr be harvested
(3) Softwood stand yields an hlld at avrages for the emly 1970 regardkss of the stand age lssum ptioll
This volume cstil11Cl te (3687 m 3 htc1are) is Lonshysistent with the emphasis on gauging the effects of changes ill harvestable ~lrea6 All other things being equal failure to accollnt for harvestld timber mashyturity will produce underestimates for older stands and overestimltes for younger stands On balance however this is probably a conservative yield eqiiJIate since part-cllt areJS and IlSS productive government land 3re indlldec1 in the computation
ROlndwood prollctiOllS based on this method LIre shown in Table 3 The levd of projected OLltput for the 19 5 to 1980 period is indicated for four mashyturity assumptions hetween 35 ~l1d 50 years Changes ill output arise only because of increased harvest on nOll-national artificial forests Production from nashytional forests is held at 1975 alucs Also harvest from nOI1-national forests is held at 1975 v~tllles which imply that 1975 actual output is equal to projected output for the 1975 to 1980 period These estimates indicate that increasing softwood supplies are plaushysible For 35 and 40-year rotations output doubles by the early 1990s Under longer rotations (45 or 50 years) however significant output expunsions would not occur until the late 1990s
The harvest age should depend on economic COI1shyditions especially 011 the private forests (27) The expectation of rising timber prices would increase the gain from holding timber for future sale This would tend to increase the 11arvest age for exampk to 45 or 50 years On the other hand the prospect of falling prices would make the postponement of sales less profitable This would encourage shorter rotation periods perhaps 35 to 40 years
6 The area induded is clear-cut lreu on all natural and artificial forshyests regardless of ownership The historical averages from the 1972 to 1977 period were used for area and roundwood prodlHion
B HOUSING
Residential construLtion in Japan expanded drlshymltieally in the I 060s and early I070s in response to I housing shortage tlcled by population growth rural-to-urhan migration mel househuld lIl1l1oubling A~ of the mid-I (nos hovvever the nLlmber 01 aaiJshybk lInih hl~ lome into line with the l1l1l1lb~r of hOllSLhold~ 118) Conscquently future inw-itl1lel1ts in llC houing wOLlld take th~ form 01 quality improvcshyl11lnts d Ilew hOllseholds For example therL is a high potultid for repbling cklapiciatcd housing that was Lumtructcd 1I1 thL ]950s Also the size of the typictl dwelling is small by Anwrican stanclards so average floor space coule cont111W to lllcrease Finally ltistorial trenes away from n10re than onL ti1llily in I dwlilillg LoLlle Lontinue
Uedls relfnt report on Japanlt housing requireshymcnts fclure~ projeltions of new housing investment based on demographic and eLonomic radors (24)
Thi study built on the premise thut increases in 111
hOLlsing (S) consist of three ~elarate Lmiddotompol1enL S1 = h1 + Yt + rt herc 11 increJst in thl numher of hOLlsehold~ ~f increlst in the number of vacant units rl illLTCdSC in the numbn uf remoyals
Incrcase~ in hOllSdlOld formations were projellld orl the Insis of Jel110gnphiL data and Y~lCanC) rates JSshy~llJned a (Cntilluation of past trcnds Increases in removals were considered responsive to per capita income (or GNP) and the interest rates chargee on
financing new housing Thus removal forecasts were lClsed on assumptions [ur GNP growth and intcrLst r~ltls Under a high growth assumption annual GNP increases were bctween 65 and 75 plTcent A low growth as~umption featured GNP increases between 45 1I1e 30 percent Interest rates were held cunstant 111 both Lases
Although Ueclcls studv emphasized the number of available units ~ targd Inel uf tloor spclLe from ~urVly data was cited and it WJS assumed that this floor arecl would bc rlalizecl by the end uf the I Q90s This assumption ~l1nOllnts to a 20 ~1LrLent inLTcase in ~lerage floor spaLl by 2000
Table 4 contains Uedas housing unit projections for hi[l1 and low [JOwth )cerarios assumptions Ibout the increase in jerage tluor spacc and shows tIll comTrsion of these projections into the total floor area for 11lW housing The low growth housing unit fOf(ast is combined with the aS~lmption of a 20 pershy(cnt increase in loor ~ma by 19RO The high growth Iwusll1g unit proiection is combined with a 1110re optimistic projccti01~ of averdge floor area (30 percent incrClse by 2000)
C LOG TRADE
The Ljf_t of dCicopnwnts in Japans log output inc new housing Lomtruction can be estimated with the impact multipliers of Table 4 Under the assumpshytion lilat no other ch~ll1gts occur the relation among
Table 4 Housing starts and floor area projections by growth assumption through 1980
Low growth High growth
Year
Housing starts (mill units)
Floor area (20 percent) (mhouse)
Total area millm
Housing starts (mill units)
Floor area (30 percent) (mhouse)
Total area millm
1980 1 5 i-no 13 2 165~ 870 1437 1981 1584 8785 1392 1676 886 1485 j 98 1644 8870 1458 I 761 9021 1589 J983 1638 8955 1467 1758 9182 161A 1984 1643 90AO 1485 1765 9343 1649 1985 1620 9125 1471 I ~ 5 7 9503 1669 1986 15 83 9210 14511 1 735 9664 1677 1987 1626 9295 1511 (mn 1 1795 9824 1763 ]988 I 549 9380 1453 1720 9985 1717 1989 1570 9465 1486 1761 10145 17 87 1990 1506 955 1438 1709 103 i 1762
1991 15 51 9635 1494 1768 1046 1849
1992 1516 9720 147 A 1745 1063 1855
1993 IA70 9805 1441 1712 1079 1847 1994 lA40 Y890 142A 1695 1095 1856 ]995 1413 9975 1409 168 I 11 i 1866 1996 1350 10060 1358 1631 1 127 1838 ]997 I 335 10145 135 A 1640 1143 1875 IlJ98 l 285 10230 131 5 (1111111 1603 1159 1858 ]999 1318 10315 ] 359 1650 1175 1938 2000 l~1l9 1040 1341 1636 1191 1948
14
Table 5 Japans housing construction roundwood production and US log trade
Under two scenarios
Low income growthhigh roundwood production Highmcome growthlow roundwood production
Roundwood Roundwood production US log production USlog
House construction (35- year exports House construction (50-year exports (3 percent income growth) rotation) to Japan 3 (6 percent income growth) rotation) to Japan mill m 1 floor area m1I m mill m 3 mill me floor area mill m 3 mill m
1976 Actucl 20lJ lOA ~O9 04 1) 1981-85 1456 255 86 1596 11 0
1986-90 1469 518 0 j 74 i 253 9 1991-95 2448 9~ 2 0 185 290 1996-2000 1345 tlU 0 1)91 336 53
1 SOurce T ace 4
SOJrce Table 3 Reducticns Jarans fmport demand C0r18 entirely at the expense of lS trde hecause of the resjd~al s-pplier assurnptior_ Thus zero trace
-lith US is consistert With several states of Japans tog trade If the assump~ion tlL27 exporting countries foreign suppies are perfect~v ifeastc s abandoned then expanded Japanese SLpply beycnd zeroUS trade levels trst mean lt reduction in trade vgtlth Fussia Nev Even more abundant supplies in Japan WOLJld suggest that Jaoan would tailte the role oi an exportng country
Jog tr~lJ~ (QIULSL (lUllChH10d udion through ti1( 19905 Lncler tl1i- ~(lnclrio tr3ck wolld (QRPJL dnd hOll~ji1g starts 15 tIl1uin stahle illcar i 0 mill 111 L t11l
]980s but would drop llally during Ih~ li~I~Q[U =0 - -i-66QPRJ + 0492LlHSJR bull oftwooJ Ilnll illlrCald Log tLlic at thl end ofUsing Il) ( lidta this ditlernct lquatioll Cli be the I()CIO would be hout ktlf thl 19 7 5 In ~l (53(Tko to lir(r relation ~lmOJlg rlKSe thrl ~irlk mill
QILJ j C) i III the sllolld s~nrio inLome g1ot11 is mor(
Tabk 5 iLustrates some llrtlllc OUkOlllCS of moJcLll perClDt) so rlplan~l11Lnt ckl1lal1u tor Japan dOI1l~sr_ lumber mClrkd and the log tl j()I IWllsing i llkc] Jnd ClOOI arl1 l do not the Ilext tW1 dmiddotcade offsd rroiLded dlLIiIh~ in ho
Under onl lln~ri() inco111l growth is brisk 6 COil qucn 11 LLlnstrudiol1 would l(I11) illld rllativclv mature (50-Ycltlrl timbr is through the 1 but lkdinl during the I Vehd In rlli [St d~)meti so Iwrvest wehde this l~kak sCl1ario w-[k lllmbr d(I1~~lnd ilt couplld
Ol1Y -Iighty through the 1980s bUl in the with the hanst of young timber i 3 L Cdtput ould e)llll til 1(nS 1c(llc~ it [cIt [n this middot~l~ cioll1lsril udioll mon than doubles
lW housing (Olhtrudion wl)uld (xjl~iI1d (518 mill 111 3 ) till mid-1 9sOs and mtI the j)lrIocL as trong rtplJz~- thrcughott the remaindn the =Otl1 (el1lliry
ment demand 101 homing 1I1c1 il1CrtC1sl~ lJl Ilour arL3 trad would delline slightly uliring thc early nffset the nUI1lbtT of 1011sehulJ formations and wish during the rtll1lindtf of ril( 20th ~l1tllry
CTlh lIHpal lllultiplltf uf Jal~in Iog production un t S log 1111 port~ is - Given JJ) 84 pllTLnt ~onv(r~ion of rotllld crod 10 akt [he cc llJl alen ( ro]ndwuud ll1ultipli1 -6439
15
Bibliography
(I) Adams Dariu M Effects of nation]] forest timshyber l]rvest on ~oftwood stumpage lumber and pJywood markets an econometric analysis Forest Research Laboratory Res Bull 15 Oregon State University 197i
(2) Adams Darius M and Richard W Haynes The 1990 Softwood Timber Assessment Market I10del Structure Projection and Policy Simulation Forest Service Monograph 22 September 1980
(3) Adlms Gerald F and John Blackwell An econshyometric model of the United States forest products industry FOII S(iellte Vol 19 No~ 1973
(4) Dlrr David R Softwood log exports the value and employment issues USDA For Servo Res PqJ P~i-OO I enS
(5) Floating exchange rates and log lxporr policy Jourlal oFoIltn Vol 5 02 February 1977
For--kr Robert B b panese forestry the 1eshy~Odrc(s industries ]lld markets Canadian Dept l)f til( Environment Info Rq)ort E-X-30 October 1()JS
f CdLigller PauL MauITY BndahL illd Michael Ll11LmiddotSkr Japan(se and Vl~t European deshyl11und lor Us wheat USDA Public WSshy4H Wbeat Situation iLy 1979
(8) Glcruln Rolf Why are our Lxported J
Porllalid lI1agoilll Nowl1ber 1979 ~9) HaynC Richlrd A derived demand approach to
cstill1ating the lin bdweell stumpage wd lumber l11Jrkets rJICI Sciellc() Vol 3 o~ Iln7
(J () I Price im padS of export reshystriction under alternative assumptions USDA For Sen Res Pap PNW-212 976
(11) Henderson James M and Richml E QUl1ldt Microlconomic thLory 1971
(I ) I10liLmiddotk James P and Paul Gallaglwr Till Price Rlspomivness of US Corn Yield A iIIcricoll UI1I11(1 of Agricillillral IC()III111shyleI Vol 58 0 4 November 19 7 0
(13) hpan Llnber Jouma Vol 12 No4 February 219 7 1
(14) JUJall LlIliberolllllal Vol 21 lo 11June20 I C)xO
(15) Japan Forestry Agency Forestry in Japan Dai Nippon Printing Co Ltd 1069
(16) White paper on Japans forest inshydustries 1977 (English edition) Japan Lumber Journal Inc April 1977
(17) White paper on Japans forest inshydustries 1965 (English editiol1) Japan Lumber JournaL Inc 1965
(18) Japan Ministry of Construction HOllsing in Japan 1975
(19) Kmenta Jan Elements of econometrics The MacM i1Ian Company 1971
(20) Nordhalls WD Recent Developments in Price Dynamics in The Ecol1ometrics of Price Determination Conference O Eckstein ed Board of Governors of the Federal Reserve System and the Social Service Research CounciL June 1972
(21) McKillop William Structural analysis of Japashynese-North American trade in forest prodshylIcts Forest Science Vol 19 No l March 1973
(1~ Mills Thomas J and Robert S Manthv An econometril analysis of market factors deshytermining supply and demand for softwood lumber Agric Exp Sta Rep No 238 Michigan State University February 1974
(23) Samuelson Paul Economics of forestry in an evolving society Ecullomic fllllliT 14440492 December 1976
(4) Uec1a Michihiko Japanese long-term housing outlook State of Washington Dept of Nat Res 1979_
(5) US Department of Agriculture Tht Outlook for Timber in the United States Forest Resource Report No 20 July 1974
(26) US House of Representatives US Trade with ] apan - Public Lands Timber Export BilL Hearings before the subcommittee on intershynational relations Ninety-fifth Congress April 4 ond 21 1978
(27) Walker John L ECHO Solution Technique tor a Non-Linear Economic Harvest Optishymization Model paper presented at the Society of American Foresters Workshop on Systems Analysis clild Forest Resource Managel11l1t Athens Georgia August 12 1975
16
Appendix A
Table 1
Endogenous variables
Year ODSJ(g) OPSJ(g) ODLJ(g) OILJ(g) PJLUMab) PJLOG(m) PUSLOG(k) PUSLUM(k)
1960 1961
212334 224810
2123340 2248100
155360 202860
8198 9630
630 630
67 7 ~ 65 72
1962 222420 2187000 293900 16870 201280 10000 611 66 7 ~ 1963 243460 2372400 313200 26360 205360 10215 62 67T2 1964 254030 248370 342370 32980 207610 9987 64Y 6658 1965 267550 262790 344650 35090 206110 10042 679 6672 1966 286220 279930 364870 45040 218530 J0403 700 6891 1967 312290 301390 394300 67670 245860 12852 734 bY73 1968 328140 314670 414040 91750 256750 13757 875 Y1] 2
1969 333970 324500 393500 85400 262500 13Y20 1078 9210 1970 338290 327500 413370 102380 255420 13692 1007 1413 1971 322920 313810 379410 77180 243330 12955 1001 Y777 1972 333090 323440 423730 111870 339580 14400 IIYI I 1741 1973 338490 325130 436430 118100 48167 0 20724 2070 15223 1974 307170 2951500 373600 98150 462500 23874 2097 1350 1975 283510 273620 359340 103830 440000 22 58 1976 13764 1976 301020 286490 377710 110970 475000 23260 2313 16798
Exogenous variables
Year OISJCANg) QILJSOV(g) QILJO(gl WJ(h) CAP EX(hj) WPIUS(j) DSTRIKE
1960 154 648 3Y60 Y49 0 1961 169 686 36180 945 0 1962 3720 11840 5520 198 724 359IJO 148 0 1963 6220 13610 5750 227 763 36240 145 0 1964 5660 17530 6240 649 80 I 35849 947 0 1965 4760 20350 6660 271 839 36149 166 0 1966 6290 25580 9000 304 877 36235 Y9S 0 1967 10900 39710 13150 352 915 36215 1000 0 1968 13470 49910 21290 411 953 36055 1025 0 1969 9470 53550 22820 480 991 35837 1065 0 1970 10790 61670 27020 548 1000 35815 1104 0 1971 9110 61650 27380 632 1000 34803 1140 1000 1972 9650 68010 25960 757 1000 303 1 1191 ~ 1000 1973 13360 78110 26030 985 1000 27122 1347 0 1974 12020 71740 19380 1188 1000 29151 1601 0 1975 9890 68950 10460 128 7 1000 29680 1749 0
Exogenous variables
Year HSJR(i) HSJNR(i) HSUS(I) HSCAN QPLJ(g) QPLUS(g) QPLCAN(gl
1960 28972 32489 12960 108858 245760 1961 35588 42281 13650 125577 260200 1312350 453690 1962 35757 40888 14920 130095 259670 1422800 512310 1963 42602 44602 16420 148624 267480 1421660 545990 1964 46930 58800 15610 165658 285620 1508040 571610 1965 53630 48670 15100 166565 282550 1537780 587410 1966 57810 51927 11960 134474 285250 1573180 592220 1967 70387 67011 13220 164123 273 7 70 1559020 589190 1968 83605 76865 15460 196878 251090 1703450 633680 1969 93971 88776 15000 210415 231730 1580250 697460 1970 104746 100288 14690 190528 222300 1564680 712730 1971 105796 91941 20840 233653 213200 1726110 735170 1972 134707 109132 23780 249914 217890 1628390 763270 1973 152421 129330 20580 268529 214190 1635000 918650 1974 114123 84430 13520 222123 184330 1570340 806490 1975 120402 75890 11710 23]456 176100 1527860 693220
Sources are listed following the data table The letter of the source is indicated immediately after each variable name n the table submiddotheading
17
Appendix A (Sources)
(a I ifiJl () ( he L ton ber 11a c [ J ~t pa n forttry -lil1Jstry No 33
1jlllhli RlJI)rT rlie Liil1hcr lJurkc LiPlII
Furcst~y li1istry 0 )95 l(f)ll(JJl(- Inkrnatiol1JI
Fdition fir P(f)duC[ Sililli( I Seri j
JJ Ln i ted -J ations Tim ber Bulkt i 1
Europe VeL 30 Sllppkmcnt ( 1111 P)(I un FOreiT
Lpctri Lumber Journal _1r)Jl ~5tari51[C uf -1
rcriL 1 Forestry ~1 ~lIlL
Y(frJilj iii F()re)f prncuc FAO U VJriOl lU(lt
~ll)UIl )flisrilai ~c([r~f)k BurC~tLl of Sl tisti~middot~
Office of tilt Prme 11111i~t (1) SI7i fics middotiI Fore i ( lriiUr F sr
PIeld cts Di~ltun ForcstnL ~usL qC
I i riiiti Finunetil Srailsfi f3 SLltiqjLS Inkrnaticllal fonltar FdlLl
~TllJCr 1978 i k) Fr dic ii Prin L
UrrIiH(sf 1(((1 Sec()l7d North(q F t Jl1U
plr imt1t Statjpl LSDA Ishy
( [he Dci))w lUI Priel SirWfi(1I Ii PI)(iilciS l)-(j 7 forest Senice lSD vli~~cilJll((ll~ Puhli_ario1 ie 135~
f Ill An nck~ of huln~L in Lpan i
LonstnhtecL LLL Cor du the
1970 DocnllCl1tatlun of dat nd The m(thoc1 Llsed in C()1l11V
index be ()bt~linlcl from urhor
Appendix B
The intention hlrc is 10 Hlutratc- tl1l~ Lffelt~ of d more restridiv juoU 011 il1c1 lumber prics The Llleds of ncting quota are tlllc]w clcl11onstrltccl as a Firll Ve Lonsickr ilk imm
in the graphical exposition of till p~lper Then the scconclan
dJlIst1l1Cnr t[1i1 lumber markets balk to ibriull1 lIh reduced form LqLlatitJ11
Two SllS )1 Lquation vllLh Ckllibe the dClI11CSshytiL softvood cLonomies Jnd North America r rht blocks for
1 f ODSJ f PHX~l 11 J QPSJ
-~PJLCl ) PLOG
(31 ) QDU Q J + J PJLLI1 J
1 PLOCr
(4J J QPU J PLOC
11 1 QPSJ (lIS
IL] = j
mil AmcriLC
Ai i PALL~1
i ~AJ QPSA A +C~PALt1
3A) QPL~ A A3 PA Lt vI
=ODSA QISJ
I hA) QPtA QDL + L
dOl11srlt QDSA a1 ood doncti~ (onslimptioL ort1
Allknl
QPSJ (1wn cod itiOIl J l~)an
QPSA d uod
QDLJ log dOllleSTic J dP~i1
QDLA j()l~ltStic Qrth Ameri(
QPUshy
PJLCM
PALL1l 1tun be- r onh Amerkd PLO( in Lipan ~imiddotd orth AmenD
sr S~i 1Clod ml)ortlt Japan I tog~ncuSl
The disctlSS oj pnL b([lavior IS Gist in term ccluatiom whith dltscribe eqllilibrium In (21)11 of
th three interrelated softwood markets Tile first rdatJonsllJp stite tint Japlttns Illlllbtl markeT is in Cq II i ibri Lim _r ro 111 I iJ L (2] I ~1l1 d (5 J ) it fo II 0 W s t lta t
18
1 ---QISJ 3 + 3~
Similarly North Americas lumber market is in equilibrium when
A A A (X]- CY 2 )2
(B) PALUM = + PLOG + QISJ 3~ + 3~ 3 + 3~ 3~ + 3~
from (lA) (2A) and (5A) Log market equilibrium depends on conditions in Japan [equations (3J) (4J) and (61)] and North America [equations (3A) (4A) and (6A)] It follows that
J J (A A 3 J 3A((X3 - (X4) - (X4 - (X 3) 3 3
(C) PLOG = L +TP JLUM +LP ALUM
where L =11 + Y~ + YI + YJ
INITIAL EFFECTS
First consider the lumber market in isolation From equation (A) above it follows that
6PJLUM = - 1 6QISJ iJ +3i
A more restrained quota or the imposition of a quota say 6QISJ = - 1 raises Japans lumber price by
_-1-_ Similarly the re13tion between the quota
pi + iJ~ mu North American lumber pricc is
6PALUM = I 6QISJp1 + iJ1
from equation (B I These lumber price changes correshyspond to Figure 2
In turn the lumber price adjustments alter the log 1113rket equilibrium as in Figure 3 From equation (C)
J A 6PLOG =lL 6PJLUM + ~6PALUML L
The log price ch3nge resulting from the quota is obshytained by substituting for the lumber pricc effect
6PLOG = lSA LSJ] 6QISJ
where SA =iJ1 (j3~ + 31) and SJ = iJsect(pl + 3J) Thus a more restrictive quota will increase log prices
6PLOG 0 I d I 1 h N I(6QISJ lt ) provlc e t 13f t 1e s Itt 111 art 1
American log demand sA is S111311 relative to the shift in Japanese log demand SJ
REDUCED FORM
A series of adjustments in log 3nd lumber markets must occur before all three markets arc in a consistent equilibrium For example the new log equilibrium adjusts lumber production plans in both countries thereby setting off more adjustment in lumber price In turn a new log equilibrium is established The
19
equilibrium that is consistent with equilibrium in all three markets is given by the simultaneous solution of (A) (B) and (C) Converting to first differences and substituting (A) and (B) into (C) yields
6PLOG = iJI [ JYi J 6PLOG - J 1 J 6QISJJ + L iJl + iJ2 iJl + iJ2
-iJ1~ 11 6PLOG + 1 6QISJ ]
L iJ1 + iJ1 iJ1 + iJ1
Rearranging gives
6PLOG = J J A A 6QISJ L - S 12 - S l 2
The denominator L - SJ Yi - sAY1 represents the sum of slopes for foreign log supply and demand schedules L gives the direct effects - the coefficients for log supply and demand schedules The terms
sAY1 and sJ11 give log market adjustment to log price that result from 3djustment in the lumber market It is reasonable to assume that the foreign log supply is upwards sloping and foreign log demand
curves are downward sloping ie th3t L - SAY~ shy
sJY1 gt O Thus log prices rise with the ql~ota
(~~igG lt 0) when SJ gt SA ie when the shift in
Japans log demand exceeds the shift in American log demand
Lumber price changes are obtained by 5ubstitutshying the expression for the log price change into (A)
or
f~(SA - Sl) J LQIS16PJLUM=~_SJ)~_SA)i -j $i + ~i
IAs before the term ----=-J-~ represents the lumber
PI + pi price change that follows from a change in the quanshytity of lumber The bracketed term shows that a more restrictive quota will increase J3panese lumber price
(6PJLUM)lt0 d d 1 I d f shy6QISJ prOVl e t 13t t 1e 111 lrect e teets at J A J
the quota on domestic production 12 (S - s ) SJ J SA AL - )2- 12
do not offset the direct effect of the quota in reshyducing domestic lumber supply (- 1) When SJ gt SA the lumber price will always increase and when SA gt SJ the price will still rise provided that the difference SA - SJ is small
C
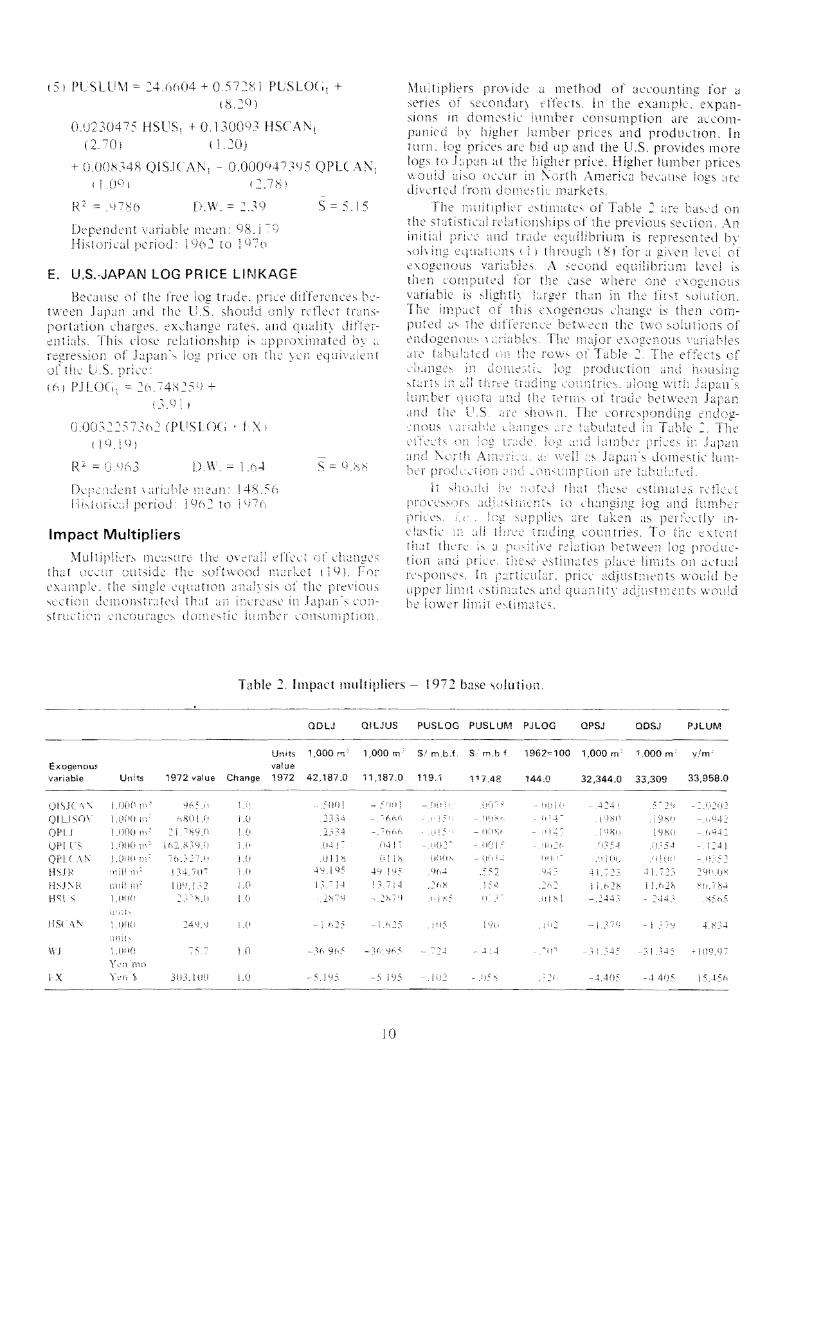
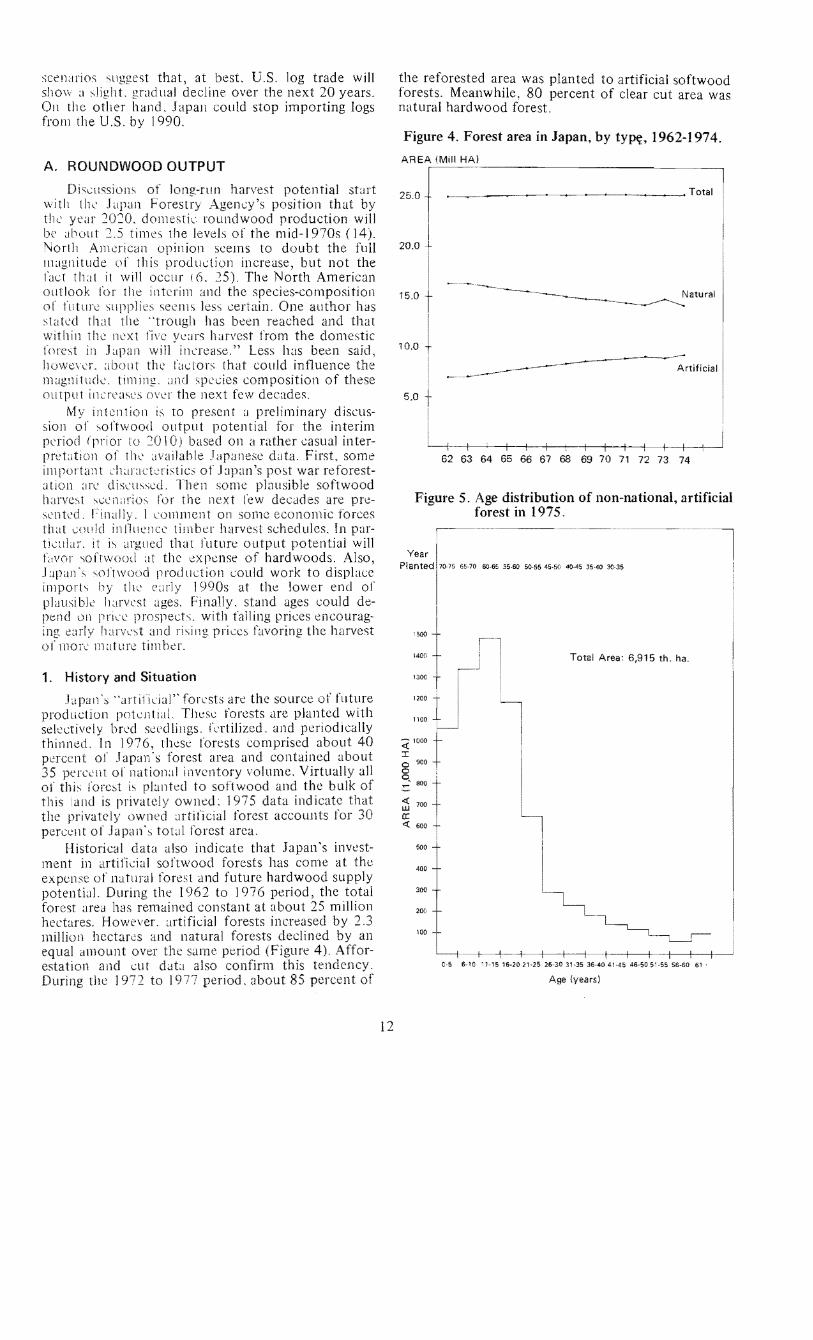
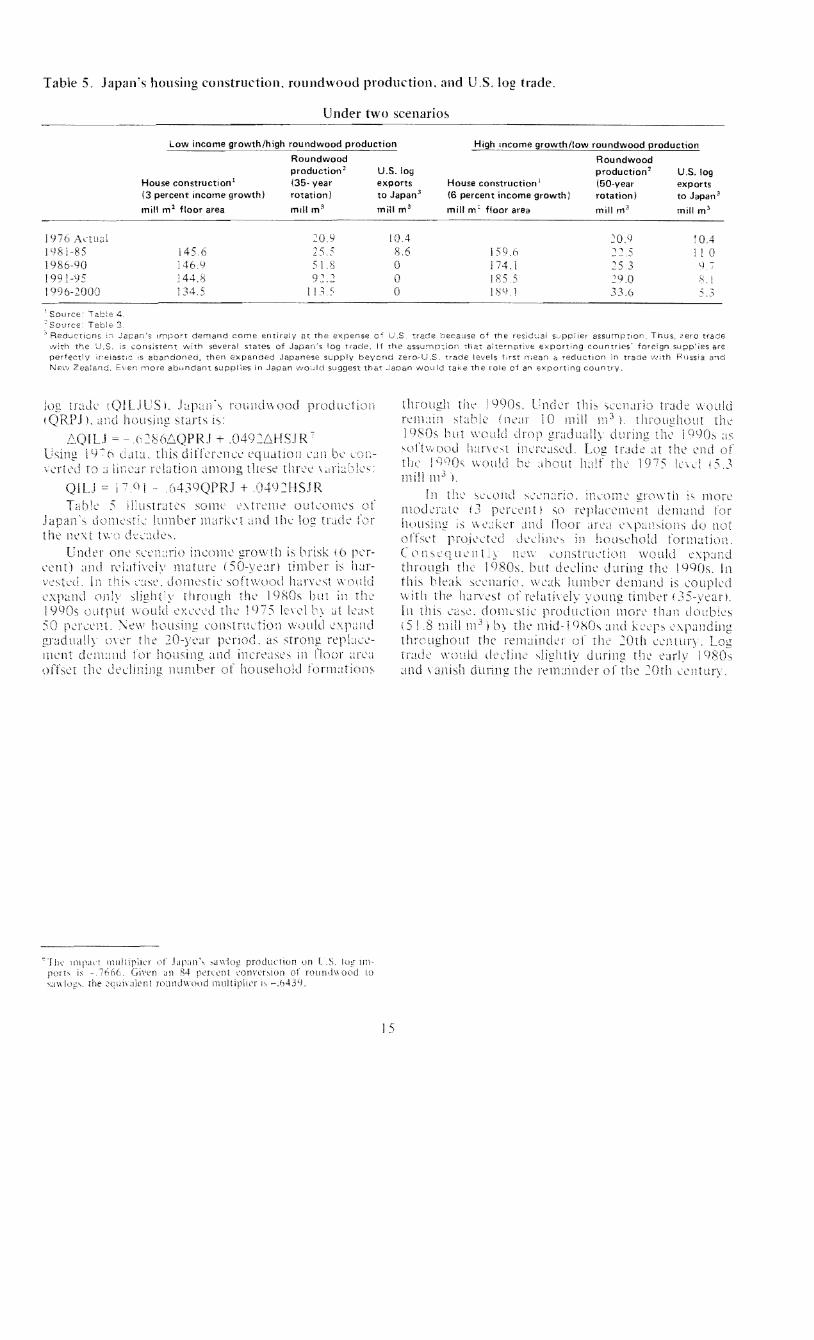