an analysis of the relationship between exports and growth
TRANSCRIPT

The Relationship between Exports and Growth in Select African Nations
A Senior Honors Thesis
Presented in Partial Fulfillment of the Requirements for graduation with research distinction in Economics in the undergraduate colleges of The Ohio
State University
by
Dhriti Pandhi
The Ohio State University June 2007
Project Advisor: Professor David Kraybill, Department of Agricultural,
Environmental, and Development Economics

I. Abstract
The relationship between exports and growth is an important one in
economics, particularly for developing nations that seek to improve the livelihoods of
their citizens through economic reform. This paper analyzes the theories behind the
role that exports play in growth, and seeks to use regression analysis for four African
nations’ economic data from 1981-2003, namely the Democratic Republic of the
Congo, Guinea Bissau, Malawi, and Nigeria. The data show a mostly positive
relationship between exports and growth and mixed results for the other independent
variables, investment and population.
II. Introduction
Exporting has been a point of thorough analysis and debate for many
economists during the twentieth and twenty-first centuries because of its inherent
impact on a nation’s economic growth. Countries like India, Pakistan, and Korea
have all increased their levels of GDP after introducing export-supporting policies and
the same can now be said for certain countries in Africa (Balassa). Studies on how
trade and growth have been related to each other in the developing world,
particularly in Africa, have been surfacing more recently. In fact, this is a very
important point to make because a recent report by the African Development Bank
stated that Africa is experiencing its “highest economic growth in the last two
decades, with the GDP growth rate, which averaged about 5 percent annually in the
1
past six years, rising to 5.5 percent in 2006, and is expected to reach 6 percent in
2007” (AllAfrica.com).
In analyzing Africa, economists have been studying whether the trade benefits
to the economic regions in Africa like ECOWAS, the Economic Community of West
African States, have had a significant impact on the continent’s economic
performance. The question of how our more accessible world will affect the regions
in the developing world still remains to be seen, but certain authors like Neil Foster
(2006) and Jean Paul Azam (2002) have been looking for the answer in their studies
entitled “Exports, Growth and Threshold Effects in Africa” and “Explaining Slow
Growth in Africa”, respectively. In this paper I hope to continue such analysis of the
impact of exports on growth for four specific African nations. The data sets I have
used were provided by the World Bank and are the most comprehensive for these
nations.
Before I enter a discussion on the merits of exports as they relate to economic
growth, I will assess the various economic situations of the Democratic Republic of
the Congo, Guinea Bissau, Malawi, and Nigeria. The reasons I have chosen these four
countries is because their data sets were the most complete for the Sub-Saharan data
from the World Bank, and because they each represent a unique aspect of the Sub-
Saharan experience. The Democratic Republic of the Congo (from here on referred to
as the DRC), a former Belgian colony, is one of the largest African nations by area,
and is located in the central region of the continent (although it is a part of the
2

Southern African Development Community). The DRC has had its share of political
and social turmoil in the 20th century, as evident by the Second Congo War, the
political instability created by Joseph Mobutu and his army, and the influx of
Rwandan refugees in the country during and after the Rwandan genocides
(Naniuzeyi). Considering these political circumstances the country has faced, it is still
important to analyze how the economic status of the country has been affected
throughout its recent history as many other African nations have faced tremendous
political trouble.
Guinea Bissau located on the west coast of the continent is one of the smallest
nations in Africa but has had its own tumultuous past. A revolutionary council ruled
the country from its independence until about 1984, and in 1998 an uprising within
the army pushed the president out of power and eventually led to the Guinea-Bissau
Civil War. A coup in 2003 took out the elected president, Kumba Lalá, and only in
July 2005 have the presidential elections been reinstated (British Broadcasting
Corporation). Thus Guinea Bissau has had political instability in more recent years,
and offers a smaller country perspective for this analysis.
In the south of Africa lies Malawi, which is a landlocked country unlike
Guinea Bissau, and is one of the more densely populated countries in Africa. The
economic statistics for Malawi paint a bleak picture, such as an average gross national
income per capita of $160. Most of the labor force in Malawi consists of employment
within the agricultural sector. There are high transport costs in Malawi and it has
3

been a part of structural adjustment programs since the early 1980s. The life
expectancy in Malawi has been decreasing over the past few decades, and it is
currently at 40 years (British Broadcasting Corporation). Malawi represents a more
underdeveloped status compared to most other African economies.
Nigeria has the highest population of any African nation and in a relatively
better situation than Malawi. Nigeria can be described as a more westernized nation
because it has significantly more manufacturing sites and is the largest producer of oil
on the African continent. Many foreign companies have invested in Nigeria, such as
the Royal Dutch Shell PLC, and other clothing and automobile manufacturers. Its
legal system is in many ways more advanced than other African nations (British
Broadcasting Corporation). Nigeria follows English and common law, as evident by
the Supreme Court of Nigeria, but regions in the north also follow Sharia law, which
is an Islamic system (Dina et al.). The diversity yet remaining stability in the country
provides us with a more perhaps optimistic view of economic analysis for an African
nation in that Nigeria has a larger and stronger economy.
In order to present an idea of the economic situation within these countries, I
will provide a picture of this through certain descriptive statistics for these nations in
comparison to each other.
4

Exports of Goods and Services (%GDP)
0
10
20
30
40
50
60
1970
1973
1976
1979
1982
1985
1988
1991
1994
1997
2000
2003
Year
Perc
enta
ge NigeriaGuinea-BissauMalawiDRC
Source: World Bank, World Development Indicatorsi
As seen by the exports of goods and services as a percentage of GDP, Nigeria is
for the most part well above the averages of the other three countries, and has shown
an overall increasing trend over the past 30 years. Malawi’s trend in exports seems to
remain along a horizontal line, thus implying that it may be more dependent on the
agricultural sector instead of the manufacturing one, because those sectors tend not to
experience significant growth. Guinea Bissau has a flat curve up until about the late
90s after which the exports of goods and services as a percentage of GDP start to
increase. The DRC has a more fluctuating curve, with increasing and decreasing
trends within the 30 year period, probably due in part to the political and social
situations that plagued the country in the 20th century.
5

GDP Constant US 2000 $
0
10000000000
20000000000
30000000000
40000000000
50000000000
60000000000
1970
1973
1976
1979
1982
1985
1988
1991
1994
1997
2000
2003
Year
GD
P
NigeriaGuinea-BissauMalawiDRC
Source: World Bank, World Development Indicatorsi
This GDP graph again places Nigeria in a stratosphere of its own in
comparison to the other countries in the study. Nigerian GDP shows an increasing
trend while both Malawi and Guinea Bissau have flat lines and GDP figures that are
alarmingly lower than Nigeria. The DRC has a more noticeable GDP curve than
Malawi and Guinea Bissau, but it seems to be that there is a decreasing trend over the
past decade.
6

Population (total)
020000000400000006000000080000000
100000000120000000140000000
1970
1974
1978
1982
1986
1990
1994
1998
2002
Year
Popu
latio
n NigeriaGuinea BissauMalawiDRC
Source: World Bank, World Development Indicatorsi
Because output and growth are also heavily dependent on population, it is
important to notice these figures as well. Each of the four countries show an overall
increase in population, but again, Nigeria has the curve with the greatest slope. The
DRC is next in terms of its overall population trend, followed by Malawi and Guinea
Bissau. It is important to remember the sizes of these countries in comparison to their
population; the DRC has the largest area, followed by Nigeria, Malawi and Guinea
Bissau but the populations do not follow in that same order; Nigeria is the most
populated, followed by the DRC, Malawi, and Guinea Bissau.
In terms of the types of sectors in their export market, each country has seen
both increases and decreases in the proportion of exports related to the agricultural
and manufacturing industries. This graph illustrates the exports of agricultural raw
7

materials exports as a percentage of merchandise exports for the DRC, Guinea Bissau,
Nigeria, and Malawi.
Agricultural Raw Materials Exports (% of merchandise exports)
0
2
4
6
8
10
1970 1971 1972 1973 1974 1975 1976
Year
Per
cent
age DRC
Guinea BissauNigeriaMalawi
Source: World Bank, World Development Indicatorsi
It is evident that for Guinea Bissau and the DRC, the overall percentages have
increased from 1970 to 1976 (the years for which the data is available as a complete
matrix), and for Malawi and Nigeria, this percentage decreased.
In terms of manufacturing exports as a percentage of merchandising exports,
data for Guinea Bissau was only available sporadically, but the overall percentage has
risen from 1.95% in 1970 to 7.19% in 1995. For the remaining three countries, it is
apparent that Nigeria and the DRC have had an overall decrease from the time period
1972 until 1978, but for Malawi the figure has remained relatively stable.
8

Manufactures Exports (% of merchandise exports)
02468
101214
1972 1973 1974 1975 1976 1977 1978
Year
Per
cent
age DRC
NigeriaMalawi
Source: World Bank, World Development Indicatorsi
III. General overview of the theories involving trade and growth
Even before the ideas of economists from the past century, Adam Smith
described the impact trade can have on production and productivity in his book An
Inquiry into the Nature and Causes of the Wealth of Nations. Smith claimed that the
primary benefits from trade are that it provides a means for a country’s surplus
production to channel through and it also brings a return for this surplus injection
into the trade market. Thus the labor and capital that was used in order to produce
the surplus production of a nation will not be wasted but instead profited from by
such trading activity. Smith went further in his theory by saying that not only will
this process of trade make use of surplus, but it would also encourage countries to
perform at their highest productivity because the idea of having a new market to tap
9

into pushes firms to increase their efficiency. In the end, such processes will increase
the revenue and wealth of society (Smith).
Taking the ideas of Smith even further, David Ricardo explained the notion of
comparative advantage which lays the foundation for why countries engage in trade
in the first place in his book Principles of Political Economy and Taxation. When
perfect competition exists, and there exists full employment of resources, countries
benefit by producing those goods which they can provide at the lowest opportunity
cost. This means that a country which makes one product by sacrificing less of
another has a comparative advantage in making that good versus another country. If
the US makes 1 computer at an opportunity cost of 0.5 cell phones, and Canada makes
1 computer at an opportunity cost of 1 cell phone, then the US has a comparative
advantage relative to Canada in making computers. If Canada on the other hand
makes 1 widget at the cost of 0.5 chairs, and the US makes 1 widget at the cost of 1
chair, then Canada has a comparative advantage in making widgets relative to the
United States. Thus in this example, it would be advantageous for the United States
to produce computers and export them, and import widgets from Canada. Canada
will do the exact opposite by exporting widgets, and importing computers. In this
way, both countries benefit and can focus on producing that which they are more
efficient at, and the result will be growth because of this more efficient production.
The benefits defined by Ricardo’s comparative advantage theory are the static
gains that result from the redistribution of the excess supply of resources produced
10

within a country to the new demand arising from the export market. Static gains are
a result of comparative advantage, but when redistribution stops, or is exhausted, so
do the static gains.
On the other hand, there may be dynamic gains to trade such as export
expansion (Thirwall). Dynamic gains from trade are those which shift the production
possibility frontier outward. The production possibility frontier is a graph that shows
the production characteristics of a country based on that which it is able to produce
considering the technological and factors of production restrictions. The points
located on a production possibilities frontier curve signify efficient production,
whereas points located on the inside of the production function represent inefficient
points. At points inside the curve it would still be possible to make more of one good
without decreasing the output of the other good. Represented graphically:
Dynamic gains therefore would shift the PPF line outward because of the increased
productivity and efficiencies that would arise from increased trade, or exporting.
11

In analyzing the benefits to trade, it is also important to note whether the
goods being traded are from the manufacturing or agricultural sector because this
impacts the benefits and rate of growth that can come about. Within the Sub-
Saharan African context, most exports produced are primary agricultural commodities
and these goods are more susceptible to changes in prices, or in other terms have a
low income elasticity of demand. Also, primary commodities are “land-based
activities and subject to diminishing returns” (Thirwall page 134). This means that
the more agricultural primary goods are produced, the lower the prices (because of
the increase in supply), but this decrease in prices is not coupled with an equally
significant increase in demand. The production of agricultural commodities does not
have increasing returns and so after a certain point, the marginal product of the labor
employed will be lower than the wages. The fixed costs associated with producing
primary goods essentially means that the diminishing returns impede the growth
associated with such sectors. On the other hand, the manufacturing sector has
increasing returns because there are more dynamic gains associated with increasing
their production. When there is higher productivity perhaps as the result of
increased employment in the manufacturing sector and / or increased technology,
there are greater returns because there is a proportionate increase in demand for such
goods. Although countries in Africa have a greater agricultural sector than
manufacturing sector, it is important to remember that the population in many of
12

these countries is quite small, some less than 14 million, and so without the possibility
of exporting they would not be able to achieve economies of scale (Thirwall).
Most arguments presented in favor of exports are based on the neoclassical
school of thought, but others exist such as the BOP Constrained Model and the
Virtuous Circle Models. The arguments presented in this paper reflect the
neoclassical school of thought, which purports that the export sector produces
positive externalities for sectors outside of exporting. The BOP constrained school of
thought on the other hand postulates that the balance of payments for a nation (its
exports minus imports) constrains the growth rate because eventually a country must
repay its debts and cannot “finance ever-growing deficits” (Thirwall). Thus in order
to achieve stability and growth, a country must determine the balance of payments
equilibrium conditions. These conditions would be the export and import levels
(which are dependent on foreign and domestic income levels) that would achieve
such equilibrium.
The virtuous circle model of export-led growth deals primarily with the
notion of causality between exports and growth. The model says that the increase in
productivity causes a circular relationship between exports and growth because
export growth leads to output growth which leads to more productive efforts, which
leads to greater quality and more competitive products, which leads back to increased
export activity (Thirwall).
13

IV. Literature Review
On an aggregate scale, the impact of globalization and the liberalization of
trade that many regions in the world have adapted have “led to a massive expansion
in the growth of world trade relative to world output” (Thirwall page 130). Thus
trade among nations has become an integral part of the new economies because of
trade liberalization. Based on data analysis, economists have claimed that the increase
in exports for a given country leads to an increase in gross domestic product. The
question now is how this is possible.
As seen by Ricardo’s theory and the aforementioned example of comparative
advantage in trade, another benefit of exporting is that it creates a new market for
producers. Using the example from above, before engaging in trade, the US producers
of computers only have their internal market. After trade, now these producers have
a new market with the Canadian consumers. Thus if the resources and capital
available to them make it feasible to increase production, the computer producers will
be able to expand their production and increase their revenues. If this affect is
analyzed on an aggregate basis, the sum of all the firms’ benefits will expand the
national income of the country as a whole (Balassa). This same logic can be applied to
a number of producers in a variety of industries. Or, as Thirwall stated, “If
production is subject to increasing returns, export growth becomes a continual source
of productivity growth” (Thirwall page 135).
14

By engaging in comparative advantage, countries are able to eventually expand
their production and essentially increase their economies of scale. Economies of scale
mean that a country (firm) attains minimum costs by producing a large amount. By
mass producing, the marginal cost of each unit is reduced. This can therefore bring
about cost efficiencies and increased production (Ram).
Other benefits of trade therefore include increased value in the technology of
a country. If a nation is able to expand their markets by engaging in trade, then the
resulting increased revenues can be reinvested into the production capital and the
technology of such factors. By investing in the technology of the production capital,
firms and other producers will become more efficient and be able to increase the
amount of exports they produce. For example, the shift from handmade production
to employing factories helped increase the supply of cotton based goods and expanded
the textile industry immensely in the nineteenth and twentieth centuries. This
would essentially lead to increased GDP for the country, and its subsequent growth.
Some authors, however, claim that the impact of export growth on technological
change is curtailed in the case of primary exports because they do not have increasing
returns to scale like manufacturing goods (Fosu).
Also, exporting can bring about growth through increasing both domestic and
foreign investment within a country. As a nation undergoes increasing exports, the
benefits include increased efficiencies due to the expanded nature of producers’
markets. In order to meet the increasing demands due to the new export market,
15

producers must increase the efficiencies in their production practices. Increasing
efficiency may mean optimal operations management styles in producing a good, and
faster and error-free distribution (by eliminating defects, for example) to the foreign
markets. Also, management styles within the country’s exporting businesses will
improve because they are needed to meet the demand. (These advancements and
efficiencies may not only affect the export business, but also the non-export
businesses within a country). With better practices, and a more reliable economy,
foreigners will be more willing to invest in a booming economy that seems to be
decreasing their risk through productive, reliable practices. Foreign direct investment
may come to a country in many forms, such as the introduction of foreign
corporations into a country or collaborations with already existing firms to expand
them through investment. In fact, the capital that is attained through FDI brings
about other benefits such as changes in attitudes (Thirwall).
Although it may seem trivial, the idea that increasing investment (that results
from increased exports) can bring about new attitudes can actually be instrumental in
a country’s development. The fruits of efficient practices are mostly the result of a
change in mindset on the part of the managers and firms. By essentially educating
this population on the ways to meet foreign export demand and about why it is
important, the aggregate result would be immense for the country as a whole.
Within certain developing nations, this result may be even more magnified because
the civil conflicts that exist in parts of the third world have had a deleterious impact
16

on investment and growth. If exports are able to increase, and more efficient styles
are taken on throughout the country, perhaps this commonality in economic goals
may impact the political turmoil in a positive manner. Paul Collier concludes that
“aid and policy are complementary: aid amplifies the effects of policy, and policy
amplifies the effects of aid…Both economic performance and economic structure
have powerful effects on the risk of conflict, so that potentially both aid and policy
can be expected to affect risk… [T]he higher the level of per capita income, the lower
the risk of conflict” (Collier page 436). Thus, if exports do in fact bring about
economic growth, then perhaps this could also affect the level of income within a
country and in effect the level of conflict as well.
To expand more on the issue of increased efficiencies, the resulting increase in
export activity can lead to greater capacity utilization (Ram). Because of the
introduction of a new market for producers, they will be able to theoretically produce
as much as their current capital allotment allows. The domestic demand of a good
may not be high enough to maximize the use of a country’s physical or intellectual
capital. The factories, manufacturing processes, and land use that a country can
sustain may not be producing the number of units that it could. Also, if there is a
decreased production of goods and a less than maximum potential of resource
utilization, the labor demand by firms will be lower. By having a lower demand than
supply of the working population in a country, there will be less incentive for
17

workers to attain an educational foundation that would be necessary to work in a
manufacturing or other sector (Balassa).
Thus the allocative efficiencies are increased as a byproduct of increasing
exports within a country. Firms are able to allocate resources better, and maximize
and even expand the capacities of producers. By doing so, another side benefit is that
there is increased competitiveness within the export industry of a nation. Because of
the increased market and potential for trade, countries are able to improve the output
of their producers when competition arises because it essentially challenges the firms
to do their best because the consumers in the market will have a greater pool to
choose from (Sharma et al.).
The other benefit of having export growth is the resulting “relaxation of the
foreign exchange constraint” (Abdulai et al. page 2). The foreign exchange constraint
leads to decreased trade activity for a nation. By relaxing this constraint, and
allowing the “imports of intermediate inputs, export expansion relaxes a crucial
bottleneck and facilitates the export of inputs embodying recent techniques” (Ghatak
et al. page 214). This means that by importing inputs, the country can focus with
greater efficiency and time on the production of the exports that the country can
attain greater revenues by focusing on producing goods for which it has a comparative
advantage in. Balassa helps to explain this idea by saying that countries which engage
in trade can import goods that it needs, such as inputs, but cannot make without
placing a significant economic burden on the nation. Thus relaxing a possible foreign
18

exchange constraint could help to alleviate such inconvenience and increase the
productive capacity and economic growth for a country. India is a prime example of a
country that previously suffered from a severe foreign exchange constraint, especially
in the years following its independence from the United Kingdom. India followed
the Gandhian notion of “self-reliance” as a rebellion against its previous colonization.
This hindered investment and growth for the country until decades later when it
opened its doors to foreign companies and increased imports (Kaushik).
It is important to note, finally, that there are two different models in
describing the relationship between exports and growth; one is the export-led growth
model and the other is the growth-driven export model (Abdulai et al.). The former
theory asserts that comparative advantage sets the stage for trade activity and results
in productive and efficient allocation of resources. Because of this, the export sector
increases and this leads to better technology, more capital available, and overall
growth. The other school of thought is that growth, which can be attained through
human capital, technological improvements that are fostered through patents and
other licensing and foreign direct investment, and the addition of physical capital,
may as a result foster economic growth that is not the result of a specific policy
designed to stimulate export growth. Thus in this theory, the demand for goods after
this increased economic activity may not and probably will not equal the increase in
supply, so the producers must now look to new foreign markets to sell this excess
supply via exporting (Jung et al.). Although both models have been tested, there is no
19

clear-cut answer as to which model is correct, because then again there is no absolute
answer in the relationship between exports and growth. What is certain, however, is
that by choosing one model and testing for it can help answer certain policy and
other economic questions such as exports policies affect a country’s economic growth.
There have been studies already conducted by economists on the impact of
exporting on the growth of GDP. For instance, Bela Balassa in his paper “Trade
Policies in Developing Countries” notes that the growth in countries like Taiwan and
Korea increased significantly after having pro-export policies. Each of these countries
increased the exports of nondurable consumer goods thus creating a market for their
“educated manpower”. The ratio of exports to GDP for Taiwan from 1960-69 was 39
percent, and for Korea it was 29 percent thus indicating high contributions of exports
to GDP. Pakistan also experienced rapid growth after importing certain inputs and
because the Export Bonus scheme increased the expansion of the country’s industrial
sector. A. Abdulai and P. Jaquet carried out a test of exports and economic growth
through regression analysis and found that by their positive coefficients, investment,
exports, labor force, and GDP move “in the same directions in the long run” (Abdulai
et al. 9-10). JP Azam et. al. in the study entitled “Explaining Slow Growth in Africa”
summarized the findings of major papers related to export activity on economic
growth in Africa. The point estimates for the studies Azam analyzed all hovered
around 0.10, regardless of differences in the definition of the dependent variable or in
the variances in sample size. This number means that if merchandising exports are
20

increased by 10 percent, then there is an associated increase in GDP of 1 percent.
This shows an obvious impact of export activity on growth for Africa. Awokuse’s
analysis shows that the link between exports and GDP growth was bidirectional in a
case dealing with Korea; this means that there were both export-driven growth and
growth-driven increases in exports. Thus although the specific countries and data
results varied in these studies, all support the notion that exports bring about some
level of growth.
V. Regression
I will conduct an analysis on the relationship between exports and growth for
four African nations; Malawi, Nigeria, Guinea Bissau, and the DRC. Because of the
limited nature of the number of data I have, I will employ the use of a simpler model
to illustrate the basic relationship I am interested in. The general level of production
as a dependent variable is seen in the production function defined by the equation
Y = f (L, K, X)
where L is the labor input, K is the capital input, X is the level of exports, and Y is the
aggregate real output. A growth equation can be made based on this equation, as
defined by Rati Ram, to be
Y’ = βLL’ + αK (I/Y) + βXX’
21

where L’ is the rate of growth of labor, X’ is the rate of growth of exports, Y’ is the
rate of growth, and I/Y is the investment-output ratio. By “adding a constant term
and a stochastic component” to the above equation, we get
Y = β0 + βLL’ + αK (I/Y) + βXX’ + u
We are assuming that the two sectors in the economy are the export and non-
export ones. Also, the export sector is assumed to have positive externalities on the
non-export sector in terms of its output (as discussed above, increased exports can
increase the productivity and efficiencies within firms, and this may be translated to
the non-export sector as well in terms of better management styles, etc.). The final
assumption here is that capital and labor are inputs to the export and non-export
sector (Ram).
My model is more reflective of the exogenous growth model because I do not
use an initial GDP variable, nor do I employ the use of government spending and
research and development, which are essential to the endogenous growth model.
There is significant literature on the endogenous growth model, but considering data
and other circumstantial restraints, it was more fitting to use the exogenous growth
model. The neoclassical model explains that the rate of growth is exogenously
determined, but oversimplifies this relationship. The endogenous growth theory
supports the idea that government policies may impact growth. This model takes
ideas from microeconomics and applies them on an aggregate level; just as households
maximize utility while considering their budgetary constraints, firms do the same
22

while trying to increase and maximize profits. In addition, firms and producers are
affected by the human capital available and technological advances they are able to
employ (Abdulai et al.).
In his paper “Exports, Growth and Threshold Effects in Africa”, Neil Foster
uses this theory and produces a linear growth model which I have modeled my own
regressions after. The equation is
ΔlnGDPit = β1 ln INITGDPit + β2INV it + βsΔPOPit + β4SECMRWi + β5 Δ ln EXPit
+ μi + εit + ηt
“where ΔlnGDPit is the growth in income for a country in period t, lnINITGDPi is
(log) initial GDP per capita, INV is the ratio of investment to GDP, ΔPOP is
population growth, SECMRW is the percentage of the working age population in
secondary schooling…and μi and ηt are country and time specific constants and εit is a
normally distributed term” (Foster page 1062). Also, Δ is the Greek letter delta,
implying a change or difference, and ln is the abbreviation for the mathematical
function log.
For the purposes of my regression, I have altered Foster’s equation to
ΔlnGDPt = β1INVt + β2ΔPOPt + β3 Δ lnEXPt + c
where c is a constant term, INV is investment, EXP stands for exports, and POP is
population. My investment variable is PPP over investment / XRAT (where XRAT
stands for exchange rate) in Current Prices as given by data in the Penn World
Tables. Because I did not employ the use of panel data, and instead conducted
23

analysis for each country individually, it was not necessary for my variables to be
defined by a period “it” subscript like Foster did but instead just a time period “t”
subscript. Based on the theories and concepts reviewed earlier, I hypothesize a
negative coefficient between the investment variable and growth, because INV is
defined as the inverse of investment. Finally, I hypothesize that the relationship
between exports and growth and population and growth to be positive and for the
coefficients to also be positive.
One of the key issues in dealing with time series data is that of stationarity and
nonstationarity. A stationary process in econometrics is assumed to be unchanging
with time; if the opposite occurs, that is the characteristics of a series vary over time,
then data is nonstationary. Stationarity allows one to “model the process via an
equation with fixed coefficients that can be estimated from past data” (Pindyck et al.
page 493). Because few time series are stationary, and because figures like GDP are
usually nonstationary, I tried to solve this problem in my data and regression by using
the first-differences of my variables. The first difference is basically done by
subtracting a variable in time period t minus that variable in time period t-1. I used
this procedure for exports (for which I took the log as deduced by Foster’s equations),
and population. (I did not do this for investment because it is already defined as the
change in capital stock from one period to the next, thus already being first
differenced.)
24

By following Foster’s model and using the first-difference form of my
variables, the regression results were as followsii:
The Democratic Republic of the Congo
Dependent Variable: GDP Method: Least Squares Sample: 1981 2003 Included observations: 23
Variable Coefficient Std. Error t-Statistic Prob.
C 0.015200 0.029307 0.518641 0.6100 EXPORTS 0.095291 0.026655 3.574944 0.0020 INVESTMENT 4.63E-05 5.77E-05 0.803071 0.4319 POPULATION -2.46E-08 2.15E-08 -1.143752 0.2669
R-squared 0.525057 Mean dependent var -0.007949 Adjusted R-squared 0.450066 S.D. dependent var 0.023012 S.E. of regression 0.017065 Akaike info criterion -5.146775 Sum squared resid 0.005533 Schwarz criterion -4.949298 Log likelihood 63.18792 F-statistic 7.001610 Durbin-Watson stat 0.983258 Prob(F-statistic) 0.002311
25
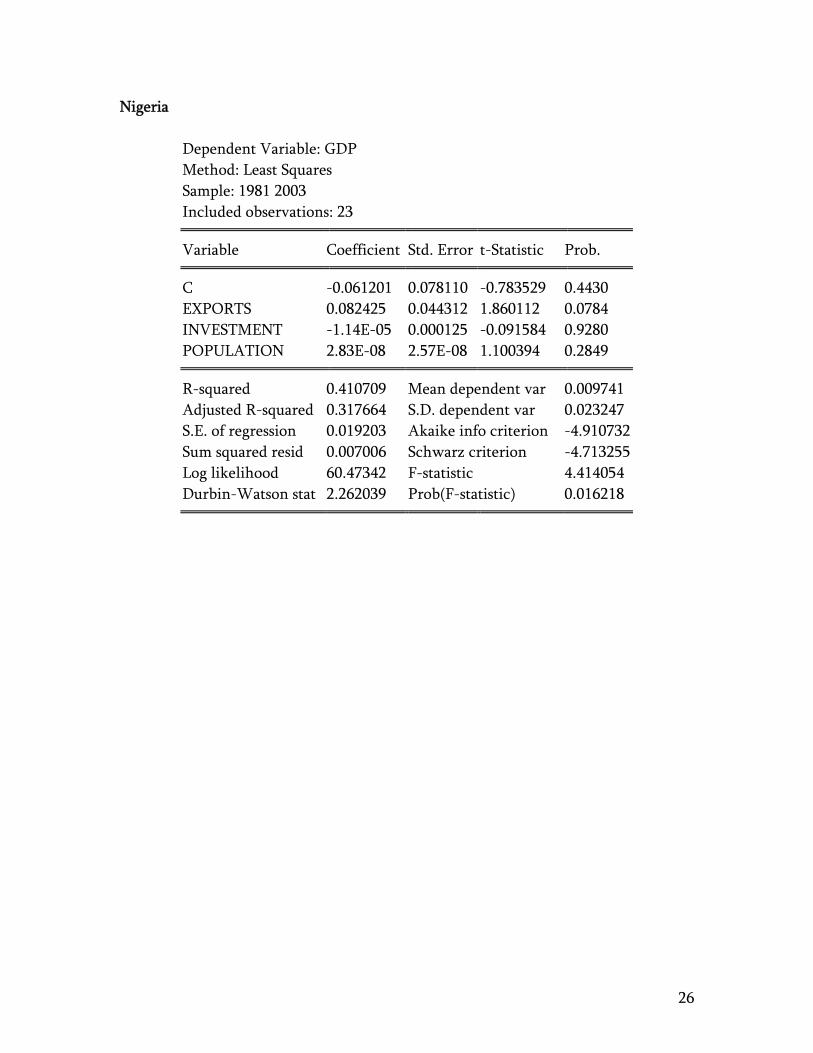
Nigeria
Dependent Variable: GDP Method: Least Squares Sample: 1981 2003 Included observations: 23
Variable Coefficient Std. Error t-Statistic Prob.
C -0.061201 0.078110 -0.783529 0.4430 EXPORTS 0.082425 0.044312 1.860112 0.0784 INVESTMENT -1.14E-05 0.000125 -0.091584 0.9280 POPULATION 2.83E-08 2.57E-08 1.100394 0.2849
R-squared 0.410709 Mean dependent var 0.009741 Adjusted R-squared 0.317664 S.D. dependent var 0.023247 S.E. of regression 0.019203 Akaike info criterion -4.910732 Sum squared resid 0.007006 Schwarz criterion -4.713255 Log likelihood 60.47342 F-statistic 4.414054 Durbin-Watson stat 2.262039 Prob(F-statistic) 0.016218
26

Malawi
Dependent Variable: GDP Method: Least Squares Sample: 1981 2003 Included observations: 23
Variable Coefficient Std. Error t-Statistic Prob.
C 0.017467 0.026452 0.660312 0.5170 EXPORTS -0.026530 0.063202 -0.419763 0.6794 INVESTMENT -0.000120 0.000350 -0.343447 0.7350 POPULATION 3.75E-09 4.80E-08 0.078193 0.9385
R-squared 0.021459 Mean dependent var 0.011182 Adjusted R-squared -0.133048 S.D. dependent var 0.024788 S.E. of regression 0.026385 Akaike info criterion -4.275261 Sum squared resid 0.013227 Schwarz criterion -4.077784 Log likelihood 53.16551 F-statistic 0.138884 Durbin-Watson stat 2.514775 Prob(F-statistic) 0.935505
27

Guinea Bissau
Dependent Variable: GDP Method: Least Squares Sample: 1981 2003 Included observations: 23
Variable Coefficient Std. Error t-Statistic Prob.
C 0.047885 0.077348 0.619080 0.5432 EXPORTS 0.088063 0.037798 2.329859 0.0310 INVESTMENT -2.88E-05 0.000425 -0.067730 0.9467 POPULATION -1.23E-06 1.61E-06 -0.765254 0.4535
R-squared 0.253801 Mean dependent var 0.010690 Adjusted R-squared 0.135980 S.D. dependent var 0.039615 S.E. of regression 0.036823 Akaike info criterion -3.608616 Sum squared resid 0.025763 Schwarz criterion -3.411139 Log likelihood 45.49909 F-statistic 2.154121 Durbin-Watson stat 1.776032 Prob(F-statistic) 0.127034
In evaluating the regression, attention is paid to the R-squared term, the signs
on the coefficients of the independent variables, and the statistical significance of the
independent variables. To start with the R-squared terms, for the DRC it was
0.52507, for Nigeria 0.410709, for Malawi 0.021459, and for Guinea Bissau 0.253801.
The R-squared term is equal to 1 – (ESS/TSS) = (RSS/TSS) where ESS is error sum of
squares, TSS is total sum of squares, and RSS is regression sum of squares. The R-
squared values can range from 0 to 1, where 0 would mean that the regression model
“does nothing to help explain the variation in Y” (Pindyck et al. page 72). The higher
value of R-squared means that the model and regression line are a good fit, and vice
versa. The DRC had the highest R-squared of all the countries, followed by Nigeria,
28

Guinea Bissau, and Malawi. The reasons behind a low R-squared may be that there is
unexplained variation in Y, as could be the case for Guinea Bissau and Malawi.
The signs on the coefficients give somewhat mixed results. For all of the
countries except for Malawi, the coefficient of exports is positive, which is expected.
The relationship between exports and growth is not positive for Malawi perhaps due
in part to the extenuating circumstances in the country such as the high HIV/AIDS
infection rate, or the high percentage of the population that lives off of subsistence
farming. The exports were significant at the 1% level for the DRC, the 5% level for
Nigeria, and the 5% level for Guinea Bissau. Thus, the sign and the significance of the
coefficient on exports support the hypothesis that exports have a positive effect on
growth.
The coefficient for investment is positive for the DRC and negative, as
expected, for the remaining countries. However, investment is not statistically
significant even at the 10 percent level for any of the countries. This variable has
decreased from its level in 1981 to its level in 2003 for the DRC, and may be part of
the reason as to why its relationship with growth is negative.
The population variable shows a positive sign for both Nigeria and Malawi,
and a negative sign for the DRC and Guinea Bissau. Both the DRC and Guinea Bissau
experienced a great deal of political and economic turmoil which significantly
reduced the efficiency of their economies, and could have ultimately led to an overall
decline of output per capita. While the relationship between population and output
29

seems to be negative in my model, the coefficient on may be picking up the effects of
other factors, such as a decline in public services and infrastructure, which could have
happened at the same time that population was increasing.
VI. Conclusion
The relationship between trade and exports is one that is agreed upon by
economists from many different schools of thought, and the areas of contention are
usually those dealing with the causality issues or the extent of the role that exports
play in economic growth. This paper supports the export-led growth theory.
As AP Thirwall stated, “export growth is the only component of demand that
provides the foreign exchange to allow other components of demand in an economy
to grow faster” (Thirwall page 133).
From the analysis presented on the select African nations of Malawi, Nigeria,
Democratic Republic of Congo, and Guinea Bissau, we see that exports play an
important role in the GDP growth of their respective economies. Not only is the
specific role that exports play in the growth for the nations important here in the
analysis, but it is also important because economic development has and will play an
instrumental role for the development of nations in Africa.
30

Appendix
i. All data was obtained from the World Bank’s World Development
Indicator database and from the University of Pennsylvania’s Penn World
Tables.
ii. EViews Version 5.0 was the software program used to conduct regression
analysis.
31

References Abdulai, Awudu and Philippe Jaquet (2002), “Exports and Economic Growth: Cointegration and Causality Evidence for Cote d’Ivoire”, African Development Review, Volume 14, Issue 1, pp. 1-17. AllAfrica.com (2007), “Continent Records Highest Growth in Two Decades”, African Development Bank. Awokuse, Titus O (2005), “Exports, Economic Growth and Causality in Korea”, Applied Economics Letters, Volume 12, Issue 11, pp. 693-696. Azam, Jean-Paul, Fosu, Augustine, and Njuguna S. Ndung’u (2002), “Explaining Slow Growth in Africa”, African Development Review, Volume 14, Issue 2, pp. 177-220. Balassa, Bela (1971), “Trade Policies in Developing Countries”, American Economic Review, Volume 61, Issue 2, pp.178-187. British Broadcasting Corporation, BBC Country Profile, “Guinea Bissau”, http://news.bbc.co.uk/2/hi/africa/country_profiles/1043287.stm British Broadcasting Corporation, BBC Country Profile, “Malawi”, http://news.bbc.co.uk/2/hi/africa/country_profiles/1068913.stm British Broadcasting Corporation, BBC Country Profile, “Nigeria”, http://news.bbc.co.uk/2/hi/africa/country_profiles/1064557.stm Collier, Paul (2002), “Aid, Policy and Peace: Reducing the Risks of Civil Conflict”, Defense and Peace Economics, Volume 13, pp. 434-450. Dina, Yemisi, Akintayo, John, and Funke Ekundayo, “Guide to Nigerian Legal Information”, Hauser Global Law School Program, NYU, http://www.nyulawglobal.org/globalex/Nigeria.htm Foster, Neil (2006), “Exports, Growth and Threshold Effects in Africa”, Journal of Development Studies, Volume 42, Issue 6, pp. 1056-1074. Fosu, Augustin Kwasi (1996), “Primary Exports and Economic Growth in Developing Countries”, World Economy, Volume 19, Issue 4, pp. 465-475.
32

Ghatak, Subrata, Milner, Chris, and Utku Utkulu (1997), “Exports, Export Composition and Growth: Cointegration and Causality Evidence for Malaysia”, Applied Economics, Volume 29, Issue 2, pp. 213-223. Investopedia.com, “Production Possibility Frontier – PPF”, http://www.investopedia.com/terms/p/productionpossibilityfrontier.asp Jung, Woo S. and Peyton Marshall (1985), “Exports, Growth, and Causality in Developing Countries”, Journal of Development Economics Volume 18, Issue 1, pp. 1-12. Kaushik, Surendra K (1997), “India’s Evolving Economic Model: A Perspective on Economic and Financial Reforms”, American Journal of Economics and Sociology, Volume 56, Number 1, pp. 69-84. Naniuzeyi, Mabiengwa Emmanuel (1999), “The State of the State in Congo-Zaire: A Survey of the Mobutu Regime”, Journal of Black Studies, Volume 29, Number 5, pp. 669-683. Penn World Tables, http://pwt.econ.upenn.edu/. Pindyck, Robert S. and Daniel L. Rubinfeld (1998), Econometric Models and Economic Forecasts Fourth Edition, Irwin McGraw Hill. Ram, Rati (1987), “Exports and Economic Growth in Developing Countries: Evidence from Time-Series and Cross-Section Data”, Economic Development and Cultural Change, Volume 36, Issue 1, pp. 51-72. Ricardo, David (1817), Principles of Political Economy and Taxation. London, Everyman, 1992. Sharma, Abhijit and Theodore Panagiotidis (2005), “An Analysis of Exports and Growth in India: Cointegration and Causality Evidence (1971-2001)”, Review of Development Economics, Volume 9, Issue 2, pp. 232-248. Smith, Adam (1776), An Inquiry into the Nature and Causes of the Wealth of Nations. London, Strahan and Caddell. Thirwall, A.P (2000), “Trade Agreements, Trade Liberalization and Economic Growth: A Selective Survey”, African Development Bank, pp. 129-160.
33

World Bank World Development Indicators, http://web.worldbank.org/WBSITE/EXTERNAL/DATASTATISTICS/0,,menuPK:232599~pagePK:64133170~piPK:64133498~theSitePK:239419,00.html
34