an analysis of the nexus between social cohesion and
TRANSCRIPT

An analysis of the nexus between social cohesion and inclusive
development
O Mosiane
orcid.org/0000-0003-1783-9809
Dissertation accepted in fulfilment of the requirements for the degree Master of Commerce in Economics
at the North-West University
Supervisor: Prof WF Krugell
Graduation: October 2019
Student number: 21009163

i
Abstract
Since the 1980s, remarkable economic development has taken place almost world-
wide. Economic growth in developing countries has lifted millions of people out of
poverty and has reduced global inequality. More recently, the concern has been to
make growth more inclusive. Since the global financial crisis, economic growth has
slowed and there has been an increase in within country inequality. Skills-biased
growth has created social tensions, and has facilitated the rise of populist leaders. To
examine this challenge more closely, the World Economic Forum has published an
Inclusive Development Index (IDI). The IDI focuses on economic indicators of
inclusivity, such as income, employment, productivity, health and inequalities of
wealth. This misses the social aspects of inclusiveness. In response, this dissertation
sets out to determine the relationship between the IDI and social cohesion for a cross
section of countries. The social cohesion measure was built using responses to the
World Values Survey. A simple OLS regression model was used to examine the
determinants of social cohesion, finding, among other things, a positive relationship
with inclusive development.
Keywords
Social cohesion, inclusive development, government effectiveness, rule of law, control
of corruption, ethnic fractionalisation, cultural diversity, correlation, diagnostic tests

ii
Dedication
To my mother, siblings, grandmother, I hope this will make up for all the time I spent
away from you. It was worth it. To my late grandfather (Isaac Mosiane), Friend (Bakang
Nokane) and girlfriend (Resolofetse Sebego), the promise has been fulfilled and may
you continue to rest in peace

iii
Acknowledgements
I would like to express my special thanks to the following
Professor Waldo Krugell, for his guidance, support, wisdom and patience he
gave me until I completed this dissertation.
Madito Oatlhotse and Olebogeng Mfoloe, for the friendship and the support you
gave me to complete my studies.
Dr John Mokhele Khumalo, for his support and guidance throughout my
academic life to date.
Madiane Silver Bapela (Pr Tech Eng ), for all the support and guidance he has
given me thus far.
NWU Facilities and Infrastructure Planning Department (my employer), for
giving me the support I required to complete my studies.
I also note that the errors, omissions and any shortcomings that might be witnessed
in this study are my responsibility and not to be associated with any of the above-
mentioned individuals or institutions. Ke leboga ka pula.

iv
List of acronyms
Term Description
ABS Australian Bureau of Statistics
ANS Adjusted Net Savings
BRICS Brazil, Russia, India, China and South Africa
CFA Component Factor Analysis
CO2 Carbon Dioxide
CPI Consumer Price index
CSO’S Civil Society Organisations
EBRD European Bank for Reconciliation Development
EFA Explanatory Factor Analysis
EKC Environmental Kuznets Curve
GDP Gross Domestic Product
HDI Human Development Index
IDI Inclusive Development Index
KIPPRA Kenya Institute for Public Policy Research and analysis
KSCI Kenyan Social Cohesion Index
OECD Organisation for Economic Cooperation and Development
PCA Principal component analysis
SA South Africa
SCI Social Cohesion Index
SCORE Social Cohesion and Reconciliation
STATSSA Statistics South Africa
UNECA United Nations Economic Commission for Africa
WB World Bank
WEF World Economic Forum
WGI Wold- wide Governance Indicators
WVS World Values Survey

v
Table of contents
Contents Pages
Abstract ............................................................................................................................. i
Dedication ........................................................................................................................ ii
Acknowledgements ........................................................................................................ iii
List of acronyms ............................................................................................................. iv
Table of contents ............................................................................................................. v
1. Chapter 1: Introduction ......................................................................................... 1
1.1. Background ........................................................................................................... 1
1.2. Problem statement ................................................................................................ 6
1.3. Objectives .............................................................................................................. 6
1.4. Method ................................................................................................................... 6
1.4.1. Data sources ......................................................................................................... 7
1.4.2. Model estimation .................................................................................................. 8
1.5. Outline of the study ............................................................................................... 9
2. Chapter 2: Literature review ............................................................................... 11
2.1. Introduction ......................................................................................................... 11
2.2. An overview of social cohesion ......................................................................... 11
2.3. Dimensions of social cohesion .......................................................................... 13
2.4. Measures of social cohesion .............................................................................. 15
2.5. Types of discourse around social cohesion ..................................................... 16
2.5.1. The liberal discourse ........................................................................................... 16
2.5.2. The republican discourse ................................................................................... 17
2.5.4. The academic discourse on social cohesion .................................................... 17
2.5.5. The policy discourse on social cohesion .......................................................... 18
2.6. Social cohesion as a matter for economic outcomes ....................................... 18
2.7. Social cohesion, institutions and economic outcomes .................................... 20
2.8. Economic inclusion and development ............................................................... 22

vi
2.8.1. Policy ingredients for inclusive growth ............................................................. 24
2.9. Economic growth, inclusion and development ................................................. 25
2.10. Social cohesion and inclusive development ..................................................... 29
2.11. Conclusion ............................................................................................................ 30
3. Chapter 3: Description of WEF- IDI and World Values Survey Data ................ 32
3.1. Introduction ......................................................................................................... 32
3.2. Components of the Inclusive Development Index ............................................ 33
3.2.1. Growth and development.................................................................................... 33
3.2.2. Inclusion .............................................................................................................. 34
3.2.3. Intergenerational equity and sustainability ....................................................... 36
3.3. The data patterns for IDI ..................................................................................... 38
3.4. Description of measures of social cohesion ..................................................... 40
3.4.1.1. Scanlon-Monash index ................................................................................ 41
3.4.1.2. Social cohesion and reconciliation (SCORE) index .................................. 42
3.4.1.3. Kenyan social cohesion index .................................................................... 43
3.5. Measures of social cohesion and survey questions ......................................... 43
3.5.1. Economic measures............................................................................................ 44
3.5.2. Societal level of cohesiveness ........................................................................... 44
3.5.3. Measures of wellbeing ........................................................................................ 44
3.5.4. Measures of social capital .................................................................................. 45
3.6. Conclusion ........................................................................................................... 47
4. Chapter 4: Empirical analysis ............................................................................. 48
4.1. Introduction ......................................................................................................... 48
4.2. Calculating a social cohesion index for a cross-section of countries ............. 48
4.3. Estimation technique .......................................................................................... 52
4.4. Diagnostic test analysis ...................................................................................... 59
4.4.1. Heteroskedasticity .............................................................................................. 59
4.4.2. Ramsey RESET test ............................................................................................ 60
4.5. Conclusion ........................................................................................................... 61

vii
5. Chapter 5: Conclusion and recommendations .................................................. 62
6. Bibliography ........................................................................................................ 64
Appendices .................................................................................................................... 71

1
1. Chapter 1: Introduction
1.1. Background
The fundamental need for both emerging and developed nations is to ensure that their
economic structures, such as the production of output, trade, creation of employment
and distribution of income, across different sectors of the economy, are designed in a
way that ensures effective social and economic inclusion. World Economic Forum
(2016) highlights on its global agenda that the greatest challenge facing the global
economy is not just economic growth, but it is also increasing growth in a way that is
more inclusive than it was in the past. The World Economic Forum (WEF) (2017)
Inclusive Development Index (IDI) Report further highlights that emerging markets
often find it difficult to counter slow economic growth and that efforts towards
accelerating economic activity by the global economy are necessary to assist
developing nations in accelerating growth. The acceleration of economic growth must
be coupled with inclusive development initiatives, so that the benefits of growth can
reach every member of a society. The World Bank (2012: 24), highlights that Civil
Society Organisations (CSO’s) should lay a role in facilitating the relationship between
the society and the state.
There are several countries that have successfully implemented their inclusive
development initiatives, such as the joint efforts by the government of Brazil and its
CSO’s in the formulation of public policies on food security. Initiatives such as these
have led to major improvements in the living conditions of the deprived, as
engagements between the government and civil society have proven to be important
in the development of Brazil’s food and nutritional security policies (Chmieleska &
Souza, 2011:10). According to Oxfam International (2012), the CSOs in India have
long pushed for the implementation of community-based monitoring and planning
processes as a part of the national standards system. Another country in Africa,
Kenya, adopted a new constitution in 2010, which seeks to address the issues of
gender exclusion experienced by women in ensuring that they fully participate in all
aspects of growth and development in Kenya (NGEC, 2016:37). These examples
show that growth should include access to institutions, justice and ability to own

2
property. Furthermore, collaboration between civil societies/ Special Interest Groups
(SIG’s) and government is essential in assisting government in realising their
development objectives by ensuring that there is the transparency and accountability
necessary to enhance development outcomes. The issues arising from economic
exclusion must not be a continental or regional issue; the global economy must step
up and come up with ways as to how the nations can work together to come up with
solutions.
A report published by World Economic Forum (WEF) on the Inclusive Development
Index (IDI) of 2018 highlights that, recently, there has been slow progress in
improvements in living standards and increasing inequality in emerging economies.
This has the effect of leading to the divergence of political attitudes/ideas and erosion
of social cohesion within and among countries. The issue of slow progress in
improving the living standards and the widening inequality, particularly in emerging
economies, has compelled the WEF to formulate and build a consensus around a
framework that would encompass a sustainable model of growth and development.
The model is structured to promote better living standards for all and to be inclusive in
nature. Their key output is the inclusive development index.
The WEF IDI Report (2018), on the Inclusive Development Index highlights the efforts
by the WEF in accelerating economic progress through a new economic policy
framework and monitoring national key performance indicators (i.e. growth and
development, inclusion, intergenerational equity and sustainability). The WEF’s policy
framework concludes that the aim of the national economic performance standards is
broad-based and sustained growth in living standards, which is a concept that involves
a wide range of issues such as wage and non-wage issues, economic opportunity for
all, security and quality of life. The WEF Report (2018) further highlights that the
income redistribution efforts in emerging economies are in fact found to be severely
underperforming or relatively underdeveloped and that the development of the above-
mentioned framework also seeks to address this issue. This is supplemented by the
figures provided on United Nations (UN) data (2018) for World Bank GINI index
estimates, which shows the Gini index for developing nations, such as SA to be 0.63,
Namibia 0.61, Botswana 0.61, among the list of developing nations.

3
The continuing trend of inequality in emerging economies has been seen to be the
main driver of economic and social ills ranging from low consumption to social and
political unrest, which has also been damaging and harmful to their future economic
prospects. WEF (2016), publication on global agenda further states that economic
growth must provide broad-based improvements in living standards and also notes
that currently there is not much of a concrete policy guidance as to how this goal can
be achieved. Another important issue that is often left out by governments is that of a
need to recognise socio-economic inequality, such that it can be prioritised and
measured in order to sustain public confidence in the capacity of technological
advancement and international economic integration to support better living standards
for all.
WEF IDI Report (2017:1), highlight that the global economy has recently found itself
to be at a crossroad due to slowing global growth (3.1% forecasted for 2018 from 3.3%
in 2017) compared to that of the post-World War II era standards, and it is continuing
to decelerate. After generating the majority of global growth in the aftermath of the
financial crisis, BRICS countries and other emerging market economies are
experiencing a serious slowdown. Lastly, some developing economies such as Kenya
and Nigeria have battled to spread the benefits of rapid growth (Kenya, 5% per annum
growth; Ethiopia 8.5%, based on 2017 estimates) and industrialisation to meet the
rising social expectations (employment opportunities, lower poverty, and improved
healthcare) (WEF IDI Report (2017:1).
Socio-economic inclusion has been a burning issue to both emerging and developed
economies and failure to address it can lead to domestic uncertainty such as
corruption and crime, and even social unrest. Samans et al. (2015:3), emphasises that
the main objective of benchmarking inclusive growth and development is to provide
an understanding on how economic policy has an influence on socioeconomic
inclusion. There is a need for a well-structured policy that can address the need for a
more inclusive growth and development model that would retain and build on positive
lessons of the past regarding the allocative efficiency of the markets and the need for
macroeconomic stability (WEF IDI Report (2017:13).
Social cohesion is essential for economic growth and inclusive development because
it brings along with it a natural ability for collaboration that can produce and foster

4
change in a country. According to Easterly, Ritzen and Woolcock (2006: 103), a
country’s social cohesion is essential for generating the trust needed to implement
policy reforms in a country. This is mainly because the inclusiveness of a country’s
communities and institutions can greatly contribute to building social cohesion,
because citizens have to trust that the short-term losses arising from the
implementation of the policy reforms, through social cohesion, can be addressed
significantly by means of long-term gains.
The link between social cohesion, economic growth and inclusive development
remains an important aspect for policymakers across the globe. According to Foa,
(2011: 3-4), the economic costs to be accrued by an absence of social cohesion are
high due to existing inequalities rampant among different communities. Furthermore,
inclusive development is a great challenge, especially in emerging economies that are
experiencing low economic growth rates, low household income, and poor health
facilities such as in Libya, Somalia, the Ukraine, Venezuela and South Sudan. A lack
of social cohesion poses a threat to the success of the implementation of inclusive
development in emerging economies, such that the social participation and the
mindset of people are already affected by the issues of inequality, high and persistent
poverty, lack of access to education and restrictions to participate in the country’s
economic activities. South Africa as an emerging economy has in excess of 51% of its
population living in poverty in headcount measure, as alluded to in Statistics South
Africa’s (STATSSA) report (2015). The report used the upper bound poverty line of
R992 per person per month on 2015 prices. Furthermore, the report states that the
main drivers of the high poverty rates are associated with both international and
domestic factors, such as low and weak economic growth in South Africa a decline in
real income growth, lower investment levels, growth in informal settlements and rising
unemployment rates (STATSSA, 2015)
South Africa is currently going through a period that is characterised by a lack of trust
in the government by its citizens and this is as a result of, inter alia, corruption
scandals, and lack of service delivery and high levels of youth unemployment. The
level of trust plays a major role in the current and future developmental progress of the
economy and failure by South African policies to adequately address the issues
surrounding economic exclusion and rising inequalities. The rising inequality and
economic exclusion has a potential of exacerbating the prevailing lack of trust and

5
further hinder the country’s developmental objectives. Gumede (2011:88), highlights
that the state capacity and organisation in terms of delivering in economic growth and
governance issues are arguably the primary constraints to South Africa becoming a
fully-fledged developmental state. Luyt (2008:1), highlights that good governance
might not alone be sufficient to eradicate poverty as an important social concern, but
good governance does complement the human rights approach in alleviating poverty,
which is necessary for social cohesion.
Pervais and Chaudhary (2015: 369), define the concept of social cohesion to be a
sense of togetherness in society. Numerous studies (Easterly et al. 2006; Fearon,
2003), view social economic inequalities and ethnic fractionalisation and also cultural
diversities as the primary causes of a lack of social cohesion. A lack of social cohesion
in a society can hinder economic growth and result in socio-political instability, a
decline in institutional quality as well as a lack of human capital creation. Ritzen (2001:
1), further highlights that the concept of social cohesion in most developing nations
can be seen to be driven by prolonged improvements in measures of equality and
inclusiveness. Social cohesion can also be enhanced through trust among members
of society, confidence in the state, cooperation between the civil society and the state
where it used to be lacking. Accountability, transparency and flexibility in public
institutions can also improve social cohesion among members of society.
It is also important to understand how other nations view the concept of social
cohesion and how it affects their economic and social well-being. The concept of social
cohesion in South Africa has been treated as that of which is in tandem with nation
building. Palmary (2015: 63), suggests that the concept of social cohesion
internationally is mainly connected to the state as it is viewed as a contemplation of
how society feels about their government. In summary, Palmary (2015:64), highlights
that social cohesion and nation building can complement each other to serve as a
strong response to the challenges of economic exclusion experienced in the past. The
concept of social cohesion seems to be related to inclusiveness, as they both have an
effect on growth, and the relationship seems to vary between the developing and
emerging economies.

6
1.2. Problem statement
To turn economic growth into inclusive development requires social cohesion. The
policy reforms necessary to improve the equity and sustainability of growth will have
short-term costs, but greater social cohesion will help citizens bear such costs in
expectation of long-run benefits. This dissertation will examine the relationship
between inclusive development and social cohesion.
1.3. Objectives
The general objective of this study is to empirically determine the relationship between
inclusive development and social cohesion. To achieve this, a number of specific
objectives need to be achieved:
A review of the literatures of inclusive development and social cohesion and
explaining how social cohesion produces institutions that promote inclusive
development; Explaining the World Economic Forum’s Inclusive Development
Index, its components and calculation;
Constructing a measure of social cohesion from variables in the World Values
Survey; and
To estimate a regression model of the relationship between social cohesion and
inclusive development for a cross-section of countries.
1.4. Method
This study will follow a quantitative research approach. The main aim of choosing this
approach for this study is to determine the empirical relationship between social
cohesion and inclusive development in a cross-section of countries. The study will test
the relationship between the two concepts for 42 countries for both emerging and
advanced economies.

7
1.4.1. Data sources
The data to be used in this study are from the World Economic Forum’s Inclusive
Development Index (IDI) and the World Values Survey. The WEF IDI Report (2018: 2)
on the IDI report states that the IDI provides an annual assessment of countries’
economic performance that measures how countries perform on 11 dimensions of
economic progress in addition to gross domestic products (GDP). The WEF IDI Report
(2017: 1-13) emphasise that IDI has three (3) national performance indicators, namely
growth and development, inclusion, and lastly, intergenerational equity and
sustainability of natural and financial resources. It is important to note that, in the first
pillar of measuring inclusive growth and development, both variables do not share the
same definition, even though they are used under the same pillar on the WEF Inclusive
Development Index. Growth generally means an increase in the real per capita income
of citizens, whereas the definition of development expands its focus from income
alone, and reaches out to issues of well-being, in particular education and health. The
last pillar comprises intergenerational equity and sustainability, which incorporate four
measures of intertemporal equity and sustainability for the reason that growth gains in
living standards are not socially inclusive if they are generated in a manner that unduly
and unsustainably burden the younger and future generations.
The IDI is a project of the WEF’s system initiative on the future of economic progress.
The IDI also aims to inform and enable sustained and inclusive economic progress
through deepened public-private cooperation through thought leadership and analysis,
concrete cooperation and strategic dialogue, including accelerating social impact
through cooperative action (WEF IDI Report (2017:18-19).
The WEF compiles the IDI for 29 advanced economies and 79 emerging economies,
making a combined total of 108 economies. The figure below presents the elements
of the IDI. National key performance indicators are shown in Figure 1.1.

8
Figure 1.1: National key performance indicators
Source: World Economic Forum IDI report 2017
The other key source of data to measure social cohesion is the World Values Survey
(WVS). The survey has a range of questions about people’s perceptions of life. This
is available for 90 countries and wave six of the survey spans for the period of 2010
to 2014. This survey provides data on socio-cultural and political change, worldwide.
The WVS consists of national samples from over 90 countries using a common
questionnaire with variables on belief, economic development, democratisation,
religion, gender equality, social capital and subjective well-being. A measure of social
cohesion will be constructed and used in the analysis. The details of the construction
of an index of social cohesion will be explained in Chapter 3.
1.4.2. Model estimation
This study aims to estimate the relationship between inclusive development and social
cohesion, for a cross-section of 42 countries, while controlling for other predictors of
inclusive development. The regression model for this study is estimated as follows:
National key perfomance indicators
Growth and Development
GDP (Per
capita)
Employment
Labour Productivity
Healthy life expectancy
Inclusion
Median household
income
Poverty Rate
Income Gini
Wealth Gini
Intergenerational equity and
sustainability
Adjusted Net savings
Public debt (as a share
of GDP
Dependency Ratio
Carbon intensity of
GDP

9
𝐼𝐷𝐼 = 𝛽0 + 𝛽1𝑆𝐶𝐼 + 𝐵2𝐷𝑉 + 𝛽3𝐶𝑛𝑡𝑟𝑙𝑠 + 𝑒𝑡 ⋯ ⋯ ⋯ ⋯ ⋯ ⋯ ⋯ ⋯ ⋯ ⋯ ⋯ ⋯ ⋯ 𝑒𝑞𝑢𝑎𝑡𝑖𝑜𝑛(1)
Where : 𝑆𝐶𝐼= Social Cohesion Index
: 𝐼𝐷𝐼= Inclusive Development Index
: 𝐷𝑉= Dummy Variable for developed and developing economies
: 𝛽0 = Constant
: 𝐶𝑛𝑡𝑟𝑙𝑠 = Control Variables
: 𝑒𝑡= Error term
This effect is given by 𝛽1. The error term 𝜖𝑖 contains those factors that might have been
left out in the model, which might have an effect on the overall regression model.
The analysis of this study will have two parts. The first part is to build a measure of
social cohesion. The study will use the indicators on the WVS database to compute
an index of social cohesion. The scaled responses will be classified into binary
responses indicating more or less social cohesion. This study will then calculate the
average responses (cohesive, non-cohesive) per country and then move on to
calculate the average scores across measures.
The second part of the analysis is to estimate and test the regression model outlined
above. The other control variables are measures of institutions, or the quality of
governance and include standard measures of the rule of law, control of corruption
etc. The estimation of the model is explained in detail in Chapter 4.
1.5. Outline of the study
Chapter 1: Introduction – this chapter gave a background about inclusive
development and social cohesion. The challenges that countries often face in
achieving inclusiveness and greater cohesion for growth and promotion of
institutions have been discussed. Most importantly this chapter explains the aim
of the dissertation and explains the method to be applied in achieving the aim
of the dissertation.
Chapter 2: Literature review- in this chapter various studies are reviewed to
ensure that the objective and the problem statement have a basis. The study

10
also reviews the literature on various method applied by other studies to
achieve the similar objective that are outlined in 1.3.
Chapter 3: Description of WEF-IDI and World Values Survey Data – this chapter
describes WEF- IDI measures and indices, how WVS obtains its data which will
be used to construct an index of social cohesion for this study and lastly other
social cohesion measures and indices.
Chapter 4: Empirical analysis – in this chapter, an index of social cohesion is
finalised. The index will be used as an explanatory variable for variation in IDI.
The regression model will be estimated and tested and the results interpreted.
Chapter 5: Conclusion – the final chapter sums up the analysis of the findings
in chapter 4 and highlights whether they address the objectives of the study as
well as the problem statement.

11
2. Chapter 2: Literature review
2.1. Introduction
This chapter attempts to review literature on social cohesion and inclusive
development for both emerging markets and advanced economies. Social cohesion
remains an important phenomenon in addressing socio-economic challenges,
particularly for emerging market economies. In an effort to provide an insight into the
links between social cohesion and inclusive development it is crucial to examine the
existing theoretical and empirical literature, in order to understand the relationship
thereof.
The examination of the literature will also assist in explaining a view that social
cohesion can effect institutions that stimulate inclusive development. Among others
factors, this chapter explore dimensions, measures and components of social
cohesion. Furthermore, the chapter also discusses the theoretical and empirical
linkages between social cohesion, economic inclusion and inclusive development.
2.2. An overview of social cohesion
Lack of social cohesion can be damaging in a country, in a sense that it can be linked,
inter alia, to social conflicts, corruption and crime. A lack of social cohesion is closely
linked to what Acemoglu and Robinson (2008: 3-4) refer to as extractive institutions,
and it is associated with unequal growth outcomes. On the other hand, inclusive
development addresses challenges related to the exclusions experienced by all
segments of society from participating in and benefiting from their country’s economic
activities. According Pouw and Gupta (2017), and Sachs (2004), inclusive
development ensures equal access to opportunities, direct democracy and equitable
distribution of services (i.e. health, education and infrastructure) with a view of
enabling participation by all segments of society.
Chan, To and Chan (2006: 279-280), believe that a good definition of social cohesion
should, just like any other concept in the social sciences, be judged in terms of good
12
criteria, namely minimal in scope and close to ordinary usage. In addition, the above-
mentioned criteria are not linked to any particular school of thought or social science
methodology, but instead they are some of the basic principles embodied in virtually
all scientific research. The minimal in-scope criteria of social cohesion are only about
what constitutes the concept and only define the essential components of the concept
and not the conditions, or any other related principles that may promote it. Lastly, the
minimalist approach opposes how the other literature views social cohesion, where
the term is defined with references to other concepts and values such as how much
the concept excludes as opposed to its inclusiveness. Green, Janmaat and Han
(2009:19), follows the same argument where they suggest that using a minimal
definition of social cohesion, that highlights the nature of social cohesion, excluding
the potential causes/ real life forms or effects of social cohesion, is essential. A close
to ordinary usage criterion, on the other hand, deals with the instructive importance of
noting that social cohesion, unlike other esoteric science constructs, is very much a
figurative term that most people will have at least a rough idea of its meaning (Chan
et al (2006:280). Therefore, a good definition of social cohesion should not be too
distant from its ordinary meaning.
Social cohesion is characterised by a general situation regarding the relationships
between members of the society and it is portrayed by a conventional set of attitudes
and norms that include trust, a sense of belonging, willingness to participate and help,
as well as societies’ behavioural manifestations (Chan et al. 2006: 290). It is important
to note that members of the society, as mentioned in the above definition, are not
necessarily restricted to individuals, but also various groups, organisations and
institutions that make up a society hence there is a classification between horizontal
and vertical interactions of social cohesion. Chan and Chan (2006: 639), highlights
that the concept of vertical interactions in the definition of social cohesion refers to the
relationships between individuals and groups in the society, while the horizontal
interactions refer to trust the citizen have in political institutions such that they can
participate in some political decisions e.g. voting. The primary focus of the above
definition is on the state of cohesiveness of the society as a whole, even though social
cohesion can be measured in terms of individual and group-level data in practice
(Chan et al. 2006: 290).

13
Other researchers also have their own definition of social cohesion, which is similar to
the above definition. Larsen (2013: 3), defines social cohesion as a belief held by
citizens of a society that they belong together and share a moral community, which
allows them to trust each other. Mulunga and Yazdanifard (2014: 16), argue that social
cohesion is characterised by a relationship that holds society together or maintains
their stability. Other studies have been conducted to provide insight into how social
cohesion can relate to other aspects of well-being.
Giardello (2014: 80), formulated a generative theory of social cohesion and civic
integration with the aim of showing a relationship between social cohesion and civic
dissolution. The significance of studying the relationship between social cohesion and
civic dissolution was to analyse whether the relationship is able to describe the
behaviour of local communities and neighbourhoods. The argument, in this instance,
is that civic dissolution includes the clash of values as well as tolerance and
contribution by members of a particular community. The study further states that, as
the concept of social cohesion spreads around the community, it serves as a response
in terms of interpretation and policies to issues emerging in social, cultural and political
spheres.
There are instances in the delineations of political economic reality where the existing
policies of social protection are unable to sustain the intricate social frameworks of
new ethnic conflicts caused by migration and other global processes. Lastly, the study
concludes that social cohesion may be used by policymakers as a response to the
negative effects arising from structural changes in an effort to keep social bonds for
the community intact.
2.3. Dimensions of social cohesion
When dealing with the characteristics of social cohesion, it is important to classify the
two levels of analysing the concept of social cohesion. The first level is about the study
of macro-structural dimensions, which take into account factors closely linked to the
crisis of welfare experienced in many countries, the escalation of inequality and lastly
the evolution of the labour market in a manner that is uncertain (Giardello, 2014:82).
A report published by Alexandre, Alys, Ghazia, Michelle and Kanishka (2012: 7), on

14
societal dynamics and fragility outlines this structural dimension by focusing on ways
in which various factors at the macro-social level may produce fragility. The report
defines fragility as a problem not only of state capacity, but also of dysfunctional
relationships across groups in society, including the relationship of different groups
within the state, which may result in social exclusion.
Furthermore, Atkinson and Hills, (1998: 13-14), highlights that there are three
components of social exclusion (relativity, agency and dynamics) that normally arise
when the concept is being discussed. Relativity explains that people may be prohibited
to associate with a certain society. Agency clarifies that people may make a choice of
not participating in the community or they can be barred from participating by
institutions, e.g. banks, government, insurance. Dynamics explain that people’s future
prospects play a role in their social participation as the assessment of degree of social
exclusion goes beyond current status. These components on social exclusion may
result to fragility, which arises from a dysfunctional relationship within a society and
causes an impediment to social cohesion prospects.
Alexandre et al. (2012: 7), conceptualise fragility as a dynamic continuum, along which
societies can experience extreme state failure and violent conflict at one end, and a
more cohesive society moving up the continuum. The key driver of fragility is identified
in the report as the significance of the perception of unfairness in the treatment of
social groups (rather than inequality). According to Chan et al. 2006 (cited by Berger-
Schmitt, 2000:8), the societal goal of this dimension is to reduce regional disparities
and social exclusion by fostering equal opportunities between genders, different social
strata and groups.
The second level relates to the micro-dimensions of social cohesion. It is essential to
note that the analysis of the macro-structural dimensions of social cohesion seems to
disregard the analysis of phenomena related to social disorganisation in a community
or neighbourhood, the crisis of social ties and more especially the difficulty of activating
the generative social and civic process (Giardello, 2014: 82).
The micro-dimensions’ views, on the other hand, do not exclude that of macro-
dimensions given that the two dimensions complement each other. The micro-
dimension of social cohesion can be linked to social capital because it consists of
primary and secondary relationships that prevail within a local community. According
15
to Berger-Schmitt (2000: 5-6), the concept of social capital covers topics such as the
density and quality of relationships and interactions between individuals or groups,
their mutual feelings of commitment and trust due to common values and norms, a
sense of belonging and solidarity that are supposed to be fundamentals of the internal
social coherence of the society.
According to United Nation Economic Commission for Africa (UNECA) (2016: 3) report
on social cohesion in eastern Africa outlines that the concept of social cohesion may
have three main components: social relations, connectedness and focus on the
common good. Social relations deal with networks that exist between individuals and
groups within society, which can be used to measure this component. Other
considered aspects of social relations are trust in others and acceptance of diversity.
Connectedness deals with the positive ties that exist between individuals, their country
and its institutions. Identification with shared values, trust and perceptions of fairness
are important in this regard. Civic participation levels, the extent of solidarity,
helpfulness of people in the society and the respect for rules among other variables
can be possible measures of social cohesion.
2.4. Measures of social cohesion
According to the Organisation for Economic Co-operation and Development (OECD,
2011 :55), the traditional and subjective measurements of social cohesion are as
follows:
Income inequality: The OECD publication considers income inequality as being
essential to measuring and monitoring the evolution of social cohesion together
with deprivation measures such as the poverty gap;
Unemployment: This measurement depends on the participation of members
in the productive economy where the unemployment rate serves as monitoring
broad indicator of levels of life satisfaction and the risk of civil tension;
The measures of well-being (objective and subjective well-being): These
measures are gauges of cohesive society’s inclusiveness and equality (life
expectancy at birth and literacy rates etc.) and for supporting wider, full
participation in civil society and political life;
16
Measures of social capital: These measures generally include group
memberships and interpersonal trust. Mulunga and Yazdanifard (2014: 17-18),
suggest that social capital has a range of social policy functions that relate to
bridging, bonding or linking relationships. Furthermore, social capital is also
described as a flow of individual investments. Groups are characterised as
being cohesive when they possess group-level structural conditions that
produce positive membership and attitudes; lastly, social capital entails
individuals’ sacrifices in terms of time, effort and consumption made in an effort
to promote cooperation with others.
Easterly et al. (2006: 106-107), classify measures of social cohesion in two categories
(direct and indirect measures). The direct measures of social cohesion are measures
of trust (interpersonal trust and institutional trust) and membership rates of social
organisations and civic participation. The indirect measures of social cohesion can be
pursued using structural factors (class and ethnic inequality), which can have an effect
in undermining the capability of various groups to work together. Income distribution
measures and ethnic heterogeneity are the indirect measures.
2.5. Types of discourse around social cohesion
2.5.1. The liberal discourse
According to Green et al. (2009: 21), the liberal discourse places more emphasis on
an active civil society, particularly at the local level. In this instance, the role of the
central state is played down along with its institutional roles for providing the necessary
welfare and social protection for promoting equality through redistribution.
Furthermore, an active civil society with greater civic participation can develop trust
through interactions between individuals and groups.

17
2.5.2. The republican discourse
The republican discourse puts more emphasis on the state rather than on civil society.
According to this theory, the state promotes social cohesion through its institutions for
welfare, social protection and redistribution. The state, in this instance, disseminates
information through public education, a common identity and broad set of shared
values that emphasises belonging to and active participation in, a political community
at the national rather than local level. Finally, the state also plays a supervisory role in
relation to key institutions in civil society that are seen to intermediate conflicts, such
as professional and employer institutions (Green et al. 2009: 22).
2.5.3. The social democratic discourse
Green et al. (2009:22), suggest that the social democratic discourse and the
republican discourse are linked in most of its essentials, except that in this instance
the emphasis on equality is greater. The republican discourse and the social
democratic discourse both place their emphasis on the role of the state and its
sanctioned active civil society groups. The active society group might include the trade
association of the employer and the employee organisations in providing the
institutional foundation of social cohesion. In this discourse, social partnership plays a
pivotal role in conflict resolution through representative civil society organisations
2.5.4. The academic discourse on social cohesion
Chan at al. (2006: 275), explain that social cohesion can often be explained in terms
of broader questions of social integration, stability and disintegration. There are
possibilities of normative conflicts (ethnic conflicts) in modern society’s experiences,
which can be mediated by institutional arrangements.

18
2.5.5. The policy discourse on social cohesion
This discourse explains that for social cohesion to produce economic outcomes, it
should cover a broader set of elements, starting from income distribution, employment,
access to basic services (education, healthcare), housing and civic participation (Chan
et al. 2006:277).
2.6. Social cohesion as a matter for economic outcomes
According to Cilingir (2016: 1), social growth through active cooperation between
various groups in the society e.g. Religious, Ethnic groups, reduces transaction costs
in economic exchange, such as information accumulation, communication and
contractual practices. The performance in economic activities depends on the level of
trust and collaboration among different groups of identity that can sometimes be low
because of higher costs of economic exchange. The second point to note is that social
cohesion improves mutual relationships among individuals where their demand for
public goods is consistent with the supply of those goods. The subsequent
accessibility of public goods will have a positive effect on the national income, thereby
boosting economic growth.
Foa (2011:4), highlights that the narrative of linking social cohesion to economic
growth is that a lack of social cohesion can impede economic growth through capital
dis-accumulation. Long-run economic growth is characterised by a sustained capital
accumulation, and, in turn, it is driven by the productivity of the factors of production
such as land, labour, enterprise and capital in the long run. Capital dis-accumulation
can be a result of intergroup violence in the form of destruction of physical
infrastructure and the loss of human capital. Social cohesion plays a role in economic
outcomes, where its absence may lead to allocative inefficiency as a result of poor
social institutions, e.g. group based intolerance/discrimination or exclusion.
Foa (2011), conducted a study on the economic rationale for social cohesion based
on cross-country evidence. The paper evaluated the economic returns of social
cohesion by examining the relationship between social cohesion and other features of
economic development. The study employed various institutional measures involving
over 200 indicators from various data sources. The data used in this study included

19
survey data on intergroup discrimination, the rate of occurrence of newspaper reported
cases such as the intergroup riots and the expert assessment ratings of ethnic and
religious groups. Cilingir (2006:3), names the intergroup discrimination based on
ethnic religious groups as horizontal inequalities which can have dire consequences
to social cohesion.
A modified index of social cohesion was developed by Foa (2011: 7), to assist when
analysing the data for this study. The index formulated was based on the collection of
data sourced from the International Shareholders Services (ISS) website.
Supplementary proprietary data donated by the Gallup World Poll was also used in
the study in order to complement the data from ISS. Measures of reflective social
cohesion were chosen as indicators and they comprised patterns of intergroup
discrimination as well as that of intergroup violence. For the purpose of the study, an
unobserved approach was considered to combine the indicators because every group
of indicators symbolise some latent values of fundamental occurrence in each society
containing varying scales with a variety of samples and also varying degrees of
measurement errors.
The results showed that there is a relationship between GDP per capita and the social
cohesion index. The analysis of the results highlighted that per capita GDP and social
cohesion have a strong and positive relationship due to the fact that healthy social
institutions are the result of the progression of sustained economic development.
Lastly, long-run economic growth is outcome dependent upon the prior existence of
social infrastructure (norms, cultural expectations and precedents) that accumulate
over the course of a country’s history and contribute to sustain capital accumulation
(Foa, 2011).
Pervais and Chaudhary (2015), conducted a study on social cohesion and economic
growth based on empirical analysis. The focus of the study was to empirically
investigate the effect of social cohesion on economic growth by using panel data for a
cross section of countries for the period of 1990 to 2010. Two different indices were
used in the study, namely inter-group cohesion and membership of clubs; and lastly,
voluntary associations as proxies for social cohesion. In order to study the relationship
between social cohesion and economic growth, the study applied a panel data
framework.
20
The study highlights that the advantage of using a panel data framework over a cross-
country regression is that it can also address the heterogeneity across the cross
sectional units and it can also address the endogeneity problem due to omitted
variable bias.
Real GDP per capita growth rate was used as a dependent variable in testing the
methodology. The results showed that intergroup cohesion has a positive effect on
economic growth. This positive relationship was an indication of cooperation among
different identity-based groups that prove to be helpful in reducing the possibility of
conflicts among groups. The variable of memberships of clubs and voluntary
associations was found to be negatively associated with economic growth.
This negative relationship points towards the phenomenon of negative externalities
generated by the bonding social capital. The bonding social capital describes the
connections within a society that can be associated with similar demographic values,
attitudes, and lastly, the availability of information and resources. The bonding social
capital can have damaging effects on the economy through free riding and rent
seeking caused by the exclusion of some groups that can slow down the pace of
economic growth through inefficient allocation of resources (Pervais & Chaudhary,
2015).
2.7. Social cohesion, institutions and economic outcomes
A study by Easterly et al. (2006), investigated the limitations to policy reforms in
developing nations by critically evaluating the strength and direction of the relationship
between social structures, political institutions and economic policies. In the measure
of social cohesion, the paper followed two approaches, namely the direct and indirect
measures. The study proposed that the key development outcomes are more likely to
be associated with countries governed by effective public institutions and, in turn, they
are more likely to be found in socially cohesive societies. This hypothesis was tested
for a sample of 82 countries, from 1960-1996, using a cross-country regression.
The empirical results of the abovementioned study present that building social
cohesion through the formulation of quality institutions that are focused on achieving

21
a common goal of dealing with economic and other divisions in the society has been
an important task for countries struggling with economic development. The results also
highlight that good institutions are sometimes limited due to ethnic divisions that hinder
the development of social cohesion that is necessary for the development of those
institutions. In addition, ethnic divisions make it difficult to develop the social cohesion
necessary to build good institutions.
Lastly, societies with lower inequality and more linguistic homogeneity have more
social cohesion and better institutions. The study concluded that linguistic
homogeneity can be used as a measure of how much groups of nationals have
developed a common identity. In a case where a common identity lacks in a society,
politicians often take advantage of exploiting the ethnic differences present at the time
to build up their power base.
Acemoglu and Robinson (2008), contribute to how institutions matter for economic
outcomes in one of their studies on the link between institutions on economic growth
and development. The main argument of the study was that the determining factor of
transformations in prosperity across countries is the transformation in economic
institutions. The study highlights on the literature a possibility of a cross-country
differences in the way the economic and political lives are structured, as well as a
strong correlation between institutions and economic performance. Cilingir (2006:8),
also adds that absence of institutions may also have an effect on social conflicts and
violence which can subject countries to economic crisis.
Acemoglu and Robinson (2008), also argue that this type of correlation does not mean
that the countries with underperforming economic institutions are poor because of their
institutions. When modelling the institutions for the study, the authors considered the
relationship between three institutional characteristics, namely economic institutions,
political power and political institutions. Economic institutions have an effect on
investment inflows, especially in human resources, technology and production
capacity. Furthermore, economic institutions are determined through a collective
choice of the society.
Conflict of interest can arise because not all groups will prefer the same set of
economic institutions and political power might be a remedy of such conflicts. The
findings of the study highlighted that institutional variations are the main determinants
22
of cross-country variations in income per capita. The differences in institutions across
countries primarily reflect the outcome of different choices. Based on robust patterns
in the cross-sectional data, a conclusion was drawn that in the case of Africa,
promoting democracy and accountability can lead to better economic policies and
institutions.
Anderson and Hachem (2009), applied a dominance-based analysis of causality and
multivariate welfare to analyse the relationship between institutions and economic
outcomes. In a case of dynamic relationships, a positive relationship between
institutions and economic outcomes was readily established and causality was found
to be contentious. The study emphasises that, on a theoretical basis, causality can run
in both directions. Investment incentives encourage economic activity because those
incentives are provided by better institutional policies, such as property rights, political
freedom, government accountability, etc.
The study also considered a sample of 84 developed and developing countries over
the period of 1960 to 2000 and collected data on institutional quality and economic
outcomes at five-year intervals. Economic outcomes were measured using the data
on GDP per capita from the World Bank Development Indicators. When the growth
institutions nexus was tested using causality dominance approach, the result
presented that the interactions between institutions and economic growth is
paramount. The results also highlight that institutions cause economic outcomes
largely in the way economic outcomes cause institutions, particularly when India and
China were excluded from the analysis.
2.8. Economic inclusion and development
Bettcher and Mihaylova (2015: 1), define economic inclusion as the equality of
opportunity for all members of society where all individuals of all social backgrounds
and social strata have opportunities to participate in the economic activities of their
country, be it as employees, entrepreneurs, consumers or citizens. Every citizen of a
country should have an opportunity to participate in the economy and reap the benefits
of their participation. The WEF (2017: 8), on the definition of inclusive growth, argue
that the definition should be based on a wide range of output growth realised
23
throughout all economic sectors and sustained over the decades, which is able to offer
employment to the country’s working age population, improve their living standards
and combat poverty.
George, McGahan and Prabhu (2012), conducted a study of innovation for inclusive
growth. The study views inclusive growth as the most favourable result of attempts by
the state to improve the lives of individuals from disenfranchised parts of society. The
study highlights that its focus on inclusive growth is based on the core principle that
the organisations can, and do engage in social innovative activities to connect
disenfranchised communities with opportunities that foster social and economic
growth. In order to stimulate innovation that enhances the opportunities to better the
lives of the largest but poorest socio-economic group, the study interchangeably used
the terms economic innovation and innovation for inclusive growth. The study followed
a qualitative research approach in an effort to test, validate and extend established
theories. The study found that the principles of innovation and growth in developed
markets are equally relevant to emerging markets, even if there are essential empirical
differences between emerging and advanced economy markets that have
methodological consequences. The primary difference in emerging market context,
which posed a challenge to the study, was the lack of robust, quantitative data on large
panels of firms to understand entrepreneurship, corporate strategy, and business
models. The study through the consideration of Pareto optimality assumption that
areas of entrepreneurship and strategy often import as a construct for guiding theory
found that, Inclusive growth is an activity that can bridge the gap between growth and
inequality where the poor will become enfranchised as customers, employers,
employees and community members Despite the methodological challenges that
emerging markets posed to this study.
Other studies that investigated innovation for inclusive growth, such as Ansari, Munir
and Gregg (2012:833), and Bradley, McMullen, Artz and Simiyu (2012:710), found that
basic conditions of innovation depend in practice on local needs and resources that
likely vary considerably as innovation in developing nation may differ from that of
developed economies. Finally, inclusive growth has the potential to change business
practice and public policy to improve the lives and livelihoods and particularly to
improve the well-being of the poor (George et al. 2012).

24
Kanbur and Rauniyar (2010: 4), define inclusive development by firstly outlining the
distinction between growth and development, and lastly by dealing with the importance
of the term ‘inclusive’. Development deals with the facets/components of well-being
other than income, whereas the term inclusive deals with the allotment of well-being
in society. Mohr and Associates (2015:410), define economic growth as the growth in
the yearly rate of total production or income per capita. The Human Development
Index (HDI) can be used to measure development. The study highlights that the
developers of HDI involved clear evaluation of the country’s performance from GDP
to other facets of human well-being (Education and health). Lastly, Kanbur and
Rauniyar (2010: 5) emphasise that inclusiveness is measured by the extent of poverty
for a given level of average income and the inclusiveness of changes in income and
growth is measured by the change in poverty.
The Commission on Growth and Development Report (2008:29), highlights that
institutions are important in conveying information and ensuring that informational
gaps in the society and the market is bridged. Furthermore, it is also essential to
mention that institutions and their capabilities in developing nations may not be fully
invented to address social protections, equity and inclusiveness. This often make it
difficult for policy makers as they may not know how the society and the market will
respond to a policy which is deemed as providing an answer to a certain economic or
social issue.
2.8.1. Policy ingredients for inclusive growth
Ali and Zhuang (2007: 12), identify policy ingredients for inclusive growth as follows:
High and sustainable growth: This element is the key to creating productive and
decent employment opportunities as the strategy for igniting and sustaining
growth. Economic growth differs among developing nations, depending on their
current levels of income and extreme poverty. If a country does not adapt and
change structures accordingly the economic growth can negatively affect
developmental objectives of a country

25
Social Inclusion: Social inclusion can be promoted through public intervention
in three areas. Firstly, by investing in education, health and other social services
to expand human capabilities, especially that of the disadvantaged. Secondly,
by promoting good policy and sound institutions to advance social and
economic justice. Lastly, by forming social safety nets to prevent extreme
deprivation. Good Policies and Strong institution can assist in combating
corruption. Samans et al. (2015:7), emphasize that corruption has a negative
effect on economic growth and social inclusion due to its corrosive nature.
Personal initiative, entrepreneurship & investment and job creation are the least
affected by corruption.
2.9. Economic growth, inclusion and development
Economic growth is beneficial if it improves the quality of life of the citizens. Economic
prosperity involves more than just increasing and distributing wealth, because human
well-being includes social, cultural, ethical and spiritual dimensions. Furthermore, the
economic prosperity is also important, as it is a fundamental element to the quality of
life of the citizens of a country (Lopez-Carlos, 2015). Economic growth brings in a
structural transformation of the economy. The economy transforms from rural
workforce to an urban one, or from agriculture to manufacturing. Middle-income
countries can struggle to maintain their growth momentum due to wages that tend to
rise during the process of structural transformation.
When wages rise, labour intensive industries in the middle-income countries will
gradually be lost or diminished in due course. The growth strategies that served the
economy well at lower income levels cease to apply at higher income levels
(Commission on Growth and Development, 2008:9). Economic growth should be
integrated with innovation with a higher consideration of physical and human capital.
Economic growth is in reality expected to trigger economic development and to
improve the welfare of the citizens of a country. It then becomes problematic if the
increase in growth is not deemed inclusive such that it is associated with higher levels

26
of income inequality or where growth fails to address the issues of income disparities
between the rich and the poor.
Akpoillih and Farayabi (2012), conducted a study on economic growth and inequality
in Nigeria, by measuring its magnitudes and challenges from 1960 to 2010. The study
emphasises that Nigeria is endowed with wealth and, over the last decade, the
economy has recorded a rising growth in its GDP with the endowment of crude oil
being a major contributor. The paper also notes that the increase in growth during that
period has not translated into accelerated employment, reduction in poverty or a
decline in inequality for the citizens of Nigeria. The paper examined the occurrences
of growth-inequality nexus by employing a trend analysis to examine the extent and
the challenges of the prevailing inequality scope in Nigeria. Poverty in Nigeria was
found to be partly a feature of high inequality that establishes itself in highly unequal
income distribution with differing access to basic infrastructure, education and
employment opportunities. The results of the trend analysis in Nigeria have suggested
that increasing the well-being of the majority of citizens in Nigeria can be enhanced by
reducing the prevailing level of inequality in Nigeria.
Vijaykumar (2012), in his attempt to examine the emerging challenges in achieving
inclusive development and growth in India, highlights that the pursuit towards
balancing the outcome of economic growth is a challenge. The frequent challenges
encountered by most emerging economies include maintaining the acceleration of
economic growth without compromising human development and sustainability.
According to Vijaykumar (2012: 33), the rising economic growth rate in India has raised
new developmental challenges, which include, among others:
Improving the delivery of core services, where this challenge persists because,
as income rises, citizens tend to demand better delivery of core public services
such as water and power supply, education, sanitation and public health.
Maintaining rapid growth while making growth more inclusive, with growing
inequality between urban and rural areas, skilled and low skilled workers, the
primary medium-term policy challenge for India is not to raise growth from 8 to
10%, but to sustain rapid growth while spreading its benefits more widely.
The Commission on Growth and Development Report (2008: 9) highlights that it is
every country’s aim to pursue a high-growth strategy in order to reach their

27
competitiveness targets and improve living standards of the people. In order for those
countries to achieve the desired levels of growth, they are sometimes faced with global
challenges that their predecessors did not face and that they must overcome. The
global challenges include global warming, the falling price of manufactured goods,
rising relative prices of commodities, higher population growth rates, and increasing
poverty rates.
Lopez-Carlos (2015), highlights that the most sustainable path towards ending
extreme poverty and promoting shared prosperity is through creating an inclusive
society that allows everyone, including traditionally marginalised groups such as
ethnic, religious and other minorities, the same opportunity to participate in and benefit
from the economy. It is mainly the role of the government to have in place policies,
which allow for an inclusive participation of all citizens in a country. Economic growth
generally serves as a basis for development as it can open doors for better
infrastructure and other services. It is also critical to note that higher economic growth
can also have an effect on the environmental conditions of a country. As the economy
grows, firms expand and that expansion, if not monitored by strict environmental
legislations, can cause deterioration in the environment through depletion of resources
such as air, water and soil destruction of the ecosystems.
Kuhuthu (2006), conducted a study on economic growth and environmental
degradation within a global context. The aim of the study was to analyse the
relationship between growth and environmental degradation with a particular
reference on carbon emissions and deforestation. GDP per capita was included as a
variable to assess the level of development in a cross-country analysis. The study
emphasises the use of GDP per capita as the most common approach to evaluate the
magnitude of growth and development of a country. This evaluation is necessary to
compare results achieved by different countries through different policies.
The study further emphasises that this approach seems to be limited in scope, since
economic growth tends to ignore the damages caused by pollution and the depletion
of natural resources that are characterised as the side effects of a process of growth.
Environmental degradation affects economic development of a country in terms of
pollution. The study applied panel data to cater for complicated behavioural patterns
on the economic scale and technological progress by combining cross-country and

28
time series data. The data used in the analysis referred to a sample of 84 countries at
various levels of development that covered the period of 1960 to 2000. The results of
the study suggested that, over a considerable period, there has been a general
increase in both GDP levels and carbon emissions. In the case of forest covers, the
overall significance of the estimated model was negligible, implying that economic
growth does not necessarily reduce deforestation because of its cumulative effects
and because of its irreversible effect on the ecosystem.
Africa, as a developing continent, has over the years followed a growth-oriented
approach (economic growth approach) to development, whereby maximising the level
of GDP was considered extremely imperative. The maximising of GDP in Africa has
to a certain degree come at a cost (i.e. inequality, environmental pollution, carbon
dioxide emissions) in the developmental progress of the continent. Adu and Denkyirah
(2017) studied economic growth and environmental pollution in West Africa by testing
the Environmental Kuznets Curve (EKC) hypothesis. The EKC hypothesis states that
the environmental damage first increases with income then declines in the long run
(Stern, Common and Barbier, 1996). The study employed panel data analysis using
secondary annual country data for the period 1970 to 2013.
The sampling criteria of the above mentioned study yielded a balanced dataset of
seven West African countries with lower to middle income status (Ghana, Nigeria,
Cote d’Ivoire, Togo, Benin, Burkina Faso and Gambia). The results of the study
showed that economic growth, in the short term, increased carbon dioxide emissions
and carbon waste significantly. Economic growth, on the other hand, did not
significantly decrease environmental pollution. The results suggested that even at
higher income levels, environmental pollution did not decrease significantly. This
insignificant relationship between economic growth and environmental pollution in the
long run indicated the non-existence of EKC in West Africa (Adu and Denkyirah
(2017).
Alam (2014), conducted a study on the relationship between economic growth (GDP
per capita) and CO2 (carbon dioxide) emissions on the Bangladesh experience. The
paper examined the relationship between economic growth (GDP) and CO2 emissions
based on the Environmental Kuznets Curve (EKC). The EKC is the systematic
relationship between economic growth and environmental quality (Alam, 2014). The

29
study highlights that CO2 emissions are a major contributor to global warming and the
emissions have grown in the past centuries due to human activities. As the country
experiences development, the use of fossil fuel consumption (coal, oil and gas)
increases with demand, as they are the main sources of electricity generation.
Manufacturing activities, transport and the increase in consumption for goods and
services are linked to economic growth. The study applied the World Development
Indicators of 2013 and World Bank data to examine the trends and patterns of CO2
emissions according to GDP per capita for the year 1972 to 2010 for Bangladesh. The
study concluded that EKC does not hold in Bangladesh for the period specified.
Results showed that CO2 emissions increase as GDP contribution of industry and
services was expansively rising. This was mainly due to manufacturing and industrial
processes that emitted fossil fuel combustion as well as services indirectly with
electricity generated with fossil fuels.
2.10. Social cohesion and inclusive development
Social cohesion as a concept of togetherness plays a role in motivating the citizens of
a country in their willingness to participate in the development of their country. It is
also important for the citizens of a country to have a level of trust in the government
that their policy implementation will be of great benefit. The republican discourse,
mentioned above, elaborates on the importance of the state’s role and its institutions
in promoting social equality and distribution.
The concept of inclusive development, if properly addressed, contributes and
enhances the element of trust by all segments of society, as citizens know that they
will have an equitable share in participating in the economic life of their country,
regardless of their race, gender or social background. Economic growth is at the centre
stage of social cohesion and inclusive development such that it would seem to be
difficult for both concepts to thrive with extremely low or negative growth. Inclusive
development aims to combine the social aspects with economic growth through
political approaches considered by the government.
Social cohesion can influence institutions that promote inclusive development, as
economic institutions are determined through a collective choice of the society. Society

30
will find it difficult to make a collective choice if there are no proper social relations
among them, a sense of connectedness and lastly if they cannot focus on the common
goal. Easterly et al. (2006), argue that the strength of institutions may be, in part,
determined by social cohesion and propose that the key development outcomes are
most likely associated with countries that are socially cohesive and therefore governed
by effective public institutions.
To test the relationship between Inclusive development and social cohesion, a
concrete measure/ index of social cohesion has to be developed for the variables of
social cohesion chosen for this study.
2.11. Conclusion
The literature provides some detailed arguments about the effects of social cohesion
in society. The ideal situation would be to have a cohesive society with an inclusive
economy coupled with a moderate economic growth rate. The literature also provides
an idea that economic growth does not always bring desired outcomes as it is
sometimes associated with environmental externalities. The literature review of this
study focused on all the positive and negative elements of the two concepts (social
cohesion and inclusive development) with economic growth being at the epicentre.
The literature also provides evidence that social cohesion and inclusive development
do relate, but the relationship seems to go both ways in some instances. George et al.
(2010: 9), state, in their literature, that the idea of inclusive growth and development
emanates from Non- governmental organisations engaging in initiatives to foster social
and economic growth. Cilingir (2006: 1), on the other hand, argues that the
performance of economic activities depends on the level of trust and collaboration
between different groups and such a collaboration can lead to higher economic
outcomes. The literature gathered provides this study with direction as this study will
attempt in its analysis to test the direction of the relationship between inclusive
development and social cohesion. The next chapter sets out to describe the data that
will be used to test the relationship. The compilation of the WEF’s Inclusive
Development Index is explained. The measures of social cohesion available in the

31
World Values Survey are also discussed. This sets the scene for the calculation of the
social cohesion index and the empirical analysis in Chapter 4.
32
3. Chapter 3: Description of WEF- IDI and World Values Survey Data
3.1. Introduction
The WEF Inclusive Development Index (IDI) summary Report (2018:1) highlights that
GDP is regarded as a standard measure of national economic performance as it
serves as a means to measure the success of broad-based progress in the standard
of living. The importance of GDP statistics strengthens the attention that the state as
well as investors pay to macro-economic and financial stability policies of a country as
they have an important influence on the overall level of economic activity and its
performance. The report also states that economic growth is a necessity for every
economy, but it is also not a sufficient measure of national economic performance.
The WEF developed an alternative/complementary metric that can measure the level
of and improvement in shared economic progress. The Inclusive Development Index
developed by the WEF focuses more closely on the criteria by which people can
evaluate their country. The IDI comprises 12 indicators/components that are combined
to form a metric that measures inclusive national economic performance.
The previous chapter explained that social cohesion is an important phenomenon in
addressing socio-economic challenges, particularly for emerging market economies.
The policy reforms necessary to improve the equity and sustainability of growth will
have short-term costs, but greater social cohesion will help citizens bear such costs in
expectation of long-run benefits. Measuring social cohesion is more of a challenge.
This chapter will describe the data that will be used to test the relationship between
inclusive development and social cohesion. The compilation of the WEF’s Inclusive
Development Index will be explained in section 3.2. In section 3.3 a brief description
of IDI rankings will be given for a number of developed and developing economies.
The measures of social cohesion and exiting indices will be discussed in section 3.4.
The specific measures available in the World Values Survey will be explained in
section 3.5. Section 3.6 concludes.

33
3.2. Components of the Inclusive Development Index
The Inclusive Development Index measures the national economic performance while
focusing strongly on median living standards and the inclusivity of growth. The WEF
compiles the IDI for 103 economies comprising 29 advanced economies and 74
emerging economies. The IDI has three pillars (growth and development, inclusion
and intergenerational equity and sustainability), where each of the pillars has four
indicators representing the best available cross-country measures of sustained and
broad-based living standards.
3.2.1. Growth and development
This pillar describes the four fundamental metrics of economic growth and
development.
Economic growth as measured by GDP per capita
WEF IDI report (2018:24), uses GDP at purchaser’s price for the compilation of the
IDI. The report outlines that the GDP at purchaser’s price is “the sum of the sum of
gross value added by all resident producers in the economy plus any product taxes
minus any subsidies not included in the value of the products”.
Employment / Unemployment
According to Bryne and Strobl (2004: 1), unemployment can be used as a measure of
economic well-being in general. Employment rate is calculated using a ratio of people
currently employed to the working age population (WEF IDI report: 2018:24). For an
individual to be classified as unemployed, he/she should be without work, actively
seeking employment and currently available for work. The formula for unemployment
is expressed as follows:
𝑈𝑛𝑒𝑚𝑝𝑙𝑜𝑦𝑚𝑒𝑛𝑡 𝑟𝑎𝑡𝑒 =𝑁𝑢𝑚𝑏𝑒𝑟 𝑜𝑓 𝑢𝑛𝑒𝑚𝑝𝑙𝑜𝑦𝑒𝑑
𝑇𝑜𝑡𝑎𝑙 𝑙𝑎𝑏𝑜𝑢𝑟 𝑓𝑜𝑟𝑐𝑒… … … … … . . 𝐸𝑞𝑢𝑎𝑡𝑖𝑜𝑛(2)

34
Labour productivity
According to Freeman (2008), it is crucial to measure labour productivity, as it explains
how increased labour productivity can stimulate economic growth and development.
Labour productivity is a percentage of a volume of output to a measure of input use
(WEF IDI report: 2018:24). The volume of measure of output represents the goods
and services produced by the country’s workforce and it can be measured by GDP.
The measure of input use, on the other hand, reflects the commitment by the workforce
in terms of time, effort and skills contributed in production. Labour productivity can be
measured by the sum of hours worked by all employees and by the head count of
employment. Labour productivity can be used to boost the growth, competitiveness
and living standards of the economy. Samans et al. (2015:25) denotes the formula for
measuring labour productivity as follows:
𝐿𝑎𝑏𝑜𝑢𝑟 𝑝𝑟𝑜𝑑𝑢𝑐𝑡𝑖𝑣𝑖𝑡𝑦 =𝑉𝑜𝑙𝑢𝑚𝑒 𝑚𝑒𝑎𝑠𝑢𝑟𝑒 𝑜𝑓 𝑜𝑢𝑡𝑝𝑢𝑡
𝑀𝑒𝑎𝑠𝑢𝑟𝑒 𝑜𝑓 𝑖𝑛𝑝𝑢𝑡 𝑢𝑠𝑒… … … … … . 𝐸𝑞𝑢𝑎𝑡𝑖𝑜𝑛(3)
Healthy life expectancy
WEF IDI report (2018:24), define healthy life expectancy as the aggregate number of
years an individual can expect to live in full health by considering years lived in less
than full health due to ailments or injuries. Healthy life expectancy is mostly calculated
by using David Sullivan’s (1971) as cited by (Jagger, Cox, Le Roy, 2007:2). The
Sullivan method of calculating the healthy lifecycle reflects the number of years
remaining, which an individual expects to live healthy at a certain age. The data used
for this method is obtained from cross-sectional surveys with age-specific proportions
as well as age-specific mortality information (Jagger et al. 2007). The IDI uses a five-
year trend on the change on healthy life expectancy between 2011 and 2016.
3.2.2. Inclusion
This pillar deals with the four important measures of social exclusion and they are
presented below.
Median household income
Guzman (2018:1), explains that the household’s median income is based on the
distribution of income of all households in the economy including households with no

35
income. The median income point separates the distribution of income in two halves,
where one half will comprise income above the median income point and the other
half below the point. The WEF IDI report (2018:25), used the data from nationally-
representative household surveys, conducted by national statistical offices and by
private agencies, which was obtained from World Bank Group Departments and
government statistical offices. The authors of the IDI Report have converted the data
from monthly to daily median income.
Income Gini
Mohr and associates (2015), highlight that the Gini coefficient is one of the measures
of inequality. The Gini coefficient measures the distribution of income and it ranges
between zero and one. In order to compute the Gini index, the researcher has to
multiply the Gini coefficient by 100. In an economy where the income is distributed
evenly, the Gini coefficient will equate to zero. The closer the coefficient is to one, it
shows that there is perfect inequality distribution of income in an economy. On the
other hand, the wealth Gini focuses on the measures of economic distribution of
ownership of assets rather than on income distribution. The WEF IDI report (2018:24)
highlights that higher Gini coefficients show a greater inequality in the distribution of
wealth, where 1 signals complete inequality and 0 signals complete equality in an
economy.
Poverty rate
The WEF IDI report (2018:24), explains that the relative income poverty rate for
advanced economies is explained as half of the respective median income. Coudel,
Hentschel and Wodon (2002:33), emphasise that income poverty rate measures the
ratio of people of a certain age group living with income below the poverty line.
Furthermore, there are two common ways of determining the poverty lines (relative
and absolute poverty lines). Furthermore, the relative poverty lines are explained in
accordance with the aggregate income distribution or consumption of a given country.
Lastly, countries in most instances set their poverty lines at a given percentage of their
mean income or consumption. Absolute poverty lines used by the WEF in compiling
the IDI can be explained in terms of monetary measures where the focus is on the
estimates of the costs of basic food prices. Basic food needs comprise the nutritional
basket deemed necessary for minimal health with a provision of non-food needs. The

36
WEF IDI report (2018:24) explains that income poverty rates for emerging economies
are the ratio of the population living on less than $3.20/ day at 2011 international prices
Wealth Gini
The last measure of this pillar (3.2.2) measures the disparities in the distribution in
wealth where a higher Gini coefficient with results in greater inequality (WEF IDI report
(2018:24).
3.2.3. Intergenerational equity and sustainability
This pillar also has four measures that signify that growth and benefits in living
standards are not socially-inclusive if they are provided in a manner that excessively
and unsustainably burdens the country’s younger and future generations.
Adjusted gross national savings
Adjusted net savings (ANS), as introduced by the World Bank in 1992, include in its
measure a calculation of various elements such as natural resources depletion,
environmental degradation/pollution and the addition of human capital formation
(Pardi, Salleh, & Nawi, 2015). The ANS provides a relative indicator of how efficient
and sustainable the country’s investment policies are. Bolt, Matte and Clemens (2002),
and Pardi et al. (2015) compute the formula for calculating ANS as follows:
𝐴𝑁𝑆 =𝐺𝑁𝑆 − 𝐷𝑛 + 𝐶𝑆𝐸 − ∑ 𝑅𝑛𝑖 − 𝐶
𝐺𝑁𝐼… … … … … … … 𝐸𝑞𝑢𝑎𝑡𝑖𝑜𝑛 (4)
Where:
ANS = Adjusted net savings rate
GNS= Gross national savings
Dn= Depreciation of produced capital
CSE= Current (non-fixed capital) expenditure on education
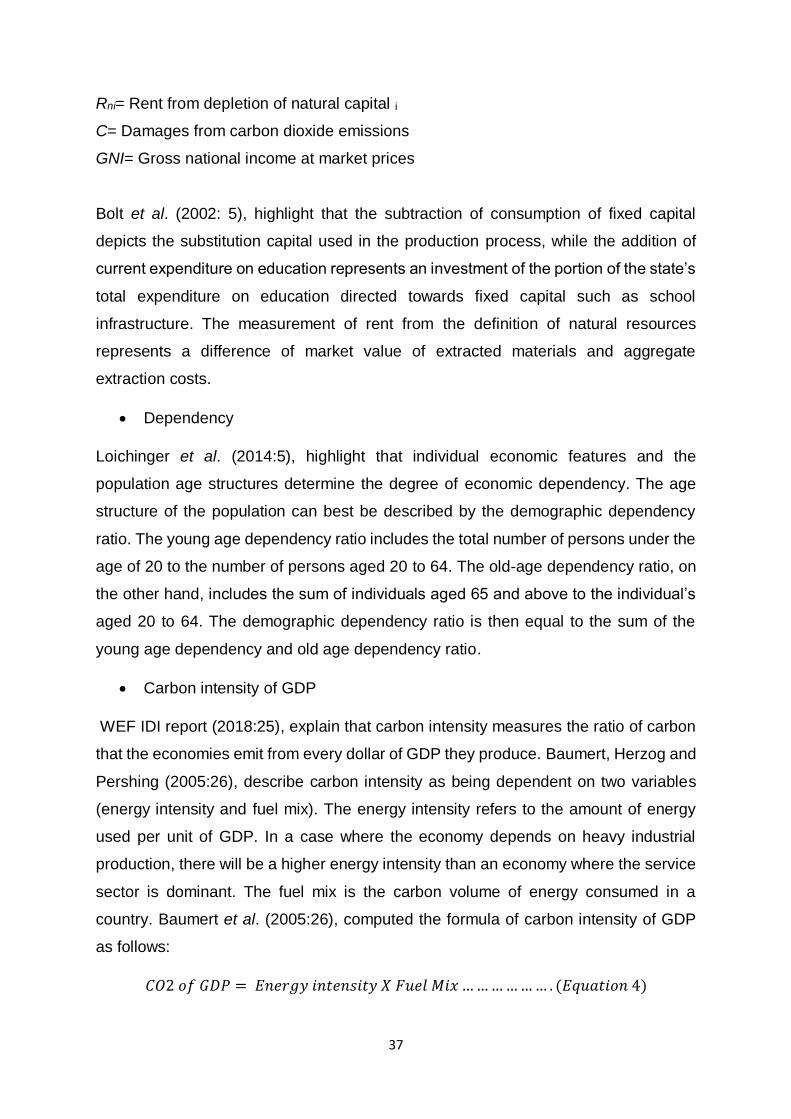
37
Rni= Rent from depletion of natural capital i
C= Damages from carbon dioxide emissions
GNI= Gross national income at market prices
Bolt et al. (2002: 5), highlight that the subtraction of consumption of fixed capital
depicts the substitution capital used in the production process, while the addition of
current expenditure on education represents an investment of the portion of the state’s
total expenditure on education directed towards fixed capital such as school
infrastructure. The measurement of rent from the definition of natural resources
represents a difference of market value of extracted materials and aggregate
extraction costs.
Dependency
Loichinger et al. (2014:5), highlight that individual economic features and the
population age structures determine the degree of economic dependency. The age
structure of the population can best be described by the demographic dependency
ratio. The young age dependency ratio includes the total number of persons under the
age of 20 to the number of persons aged 20 to 64. The old-age dependency ratio, on
the other hand, includes the sum of individuals aged 65 and above to the individual’s
aged 20 to 64. The demographic dependency ratio is then equal to the sum of the
young age dependency and old age dependency ratio.
Carbon intensity of GDP
WEF IDI report (2018:25), explain that carbon intensity measures the ratio of carbon
that the economies emit from every dollar of GDP they produce. Baumert, Herzog and
Pershing (2005:26), describe carbon intensity as being dependent on two variables
(energy intensity and fuel mix). The energy intensity refers to the amount of energy
used per unit of GDP. In a case where the economy depends on heavy industrial
production, there will be a higher energy intensity than an economy where the service
sector is dominant. The fuel mix is the carbon volume of energy consumed in a
country. Baumert et al. (2005:26), computed the formula of carbon intensity of GDP
as follows:
𝐶𝑂2 𝑜𝑓 𝐺𝐷𝑃 = 𝐸𝑛𝑒𝑟𝑔𝑦 𝑖𝑛𝑡𝑒𝑛𝑠𝑖𝑡𝑦 𝑋 𝐹𝑢𝑒𝑙 𝑀𝑖𝑥 … … … … … … . (𝐸𝑞𝑢𝑎𝑡𝑖𝑜𝑛 4)
38
Public debt
Holtfrerich et al. (2016:18), define public debt as a financial debt accrued by the state
through lending and issuance of treasury bills, bonds and other related instruments.
In a situation where the government revenue is not sufficient to cover the current
spending, the government may opt to borrow to finance the expenditure. The purpose
of borrowing is to stabilise the macro-economy where they pay down the debt when
the economy is heading towards overheating. The government can also borrow money
if it is faced with a short-term drop in revenues or a short-term rise in spending to
respond to a shock/disaster. The net new debt is the difference between non-credit
revenues and regular expenditure. Holtfrerich et al. (2016:18) highlight that the ratio
of net new debt to GDP is referred to as the deficit ratio.
In summary, measures of Inclusive Development Index include three pillars namely,
growth and development, inclusion and intergenerational equity and sustainability.
Growth and development is measured by GDP, labour productivity, employment and
healthy life expectancy. Samans et al. (23:3), highlights that an important measure pf
inclusiveness in society’s growth prospects is the degree to which it improves the living
standard of people. Inclusion is measured by median household income, poverty rate,
wealth Gini and income Gini. Lastly, we have intergenerational equity and
sustainability which is measure by adjusted net savings, public debt as a share of
GDP, the dependency ratio and carbon intensity of GDP.
3.3. The data patterns for IDI
WEF IDI Report (2017:3), explain that the benchmarking framework of the IDI includes
two types of data, i.e. the quantitative data collected from international organisations
and other respected sources and the other class of data obtained from the WEF’s
executive opinion survey. The questions posed on the survey were scaled from one
to seven; where one represents the worst case and seven represents the best. In a
case where outliers were observed in quantitative data, the WEF method introduced
data thresholds to minimise bias in the distribution. In order to align quantitative data
with survey results, indicators were converted to a 1-7 scale.

39
To give the reader some notion of the IDI data that will be used in the analysis later
on, the following two graphs present the IDI scores for a number of advanced and
developing economies in 2017 and in 2018.
Figure 2: IDI for advanced economies, 2017 and 2018
Source: WEF IDI report 2017 and 2018
The above figure shows the IDI scores of ten advanced economies for 2017 and 2018.
Over the two years the IDI shows that most of the countries have improved their index
scores from 2017 to 2018. Sweden has improved from 5.3 (2017) to 5.76 (2018), the
Netherlands from 5.28 to 5.61, and the USA’s IDI increased with a small margin of
0.16 from the 2017 IDI score.
The IDI scores for the selected emerging economies depict a different story where
nine of the countries showed lower IDI scores for 2018. The figure below depicts the
changes in the IDI among a number of emerging economies for 2017 and 2018.
0
1
2
3
4
5
6
7
Inclusive Development Index
2017 2018

40
Figure 3: IDI for emerging economies, 2017 and 2018
Source: WEF IDI report 2017 and 2018
The graphical representation in Figure 2 shows that Poland is the only country from
the group to have improved its IDI score from 4.57 (2017) to 4.61 (2018). Azerbaijan
and Poland remain the only two countries to have their IDI scores above the average
score of 4.5 from 2017 to 2018. The BRICS countries also have not performed well in
the IDI score, where Brazil dropped its score from 4.13 (2017) to 3.93 (2018), Russia
(4.42 to 4.2), India (3.8 to 3.09), China (4.4 to 4.2) and South Africa has scored the
lowest (2.94) in the 2018 rankings. The figure above shows that many of the emerging
economies are struggling to make their economies more inclusive.
3.4. Description of measures of social cohesion
The data for the variables measuring social cohesion will be obtained from the World
Values Survey (WVS) database. The WVS is an organisation that studies changing
values of the society and also their impact on social and political life. The WVS
conducts surveys that are important and provide the information regarding the aspects
of social change. The aspect of social change includes, among others, the values,
beliefs and motivations of ordinary citizens. The countries participating in surveys are
emerging and developed nations with all their major cultural regions included.
00,5
11,5
22,5
33,5
44,5
5
Alg
eri
a
Aze
rbai
jan
Arg
enti
na
Arm
enia
Bra
zil
Ch
ile
Ch
ina
Co
lom
bia
Geo
rgia
Gh
ana
Ind
ia
Kaza
khst
an
Jord
an
Kyrg
yzst
an
Mal
aysi
a
Mex
ico
Nig
eria
Paki
stan
Peru
Phill
ipin
es
Pola
nd
Ro
man
ia
Ru
ssia
Rw
and
a
Sou
th A
fric
a
Zim
bab
we
Thai
lan
d
Tun
isia
Turk
ey
Ukr
aine
Egyp
t
Uru
guay
Inclusive Development Index
2017 2018

41
The WVS uses a questionnaire to measure the changing/dynamic values of religion,
gender roles, work motivations, democracy, good governance, social capital, political
participation, tolerance of other groups, environmental protection and subjective well-
being. This study will make use of survey data for wave 6 conducted from 2010 to
2014 where 60 countries participated with 86 274 respondents. According to Inglehart
(2017), the information obtained from surveys demonstrates that people’s beliefs play
an important role in economic development, the emergence and success of
democratic institutions, the rise of equality and the degree to which societies have
effective government. The WVS has data on various indicators of social and political
life. This study will develop an index to measure social cohesion for 42 countries, using
measures outlined in the OECD Report (2011:55), publication of social cohesion as a
guideline. The measures include views on income inequality, societal level of
cohesiveness where unemployment is being used as a measure for the degree of life
satisfactions and the risks of civil tensions, the measures of well-being and measures
of social capital. The index will be developed for a cross-section of countries with
emerging and advanced economies. The index will use a scale of 1 to 7 where one
represents the lowest and seven represents the highest. There are other indexes
developed by other nations and scholars to measure social cohesion. Those indices
are discussed below and they will be used as a guideline to develop an index for social
cohesion for this study using the indicators outlined above.
3.4.1. Social cohesion measures and indices
3.4.1.1. Scanlon-Monash index
Markus (2014:4), explains that the Scanlon-Monash index of social cohesion shows
how Australia is measured over time according to five key elements of social cohesion:
Belonging: This indicator focuses on how Australian citizens view their way of
life and culture and the importance of maintaining it and sense of belonging.
Worth: It measures people’s level of fulfilment and happiness with their current
financial status as compared to that of the previous years.

42
Social justice and equity: It measures people’s trust in the state, policies and
reforms to challenges experienced by the citizens with low incomes, income
inequality and the people’s views on economic opportunity available in the
Australian economy.
Participation: This indicator focuses on people’s participation in the political life
of their country through participation in protest, signing petitions, and contact
with members of parliament.
Acceptance and rejection, legitimacy: This measures the rejection resulting
from reported cases of discrimination, people’s views on immigrants or minority
groups in Australia and the people’s hope about the future.
Markus (2014:4), explains that the survey data obtained for the Scanlon Monash index
is weighted to adjust for the chance of being sampled in the survey and channel the
respondent’s profile in line with the Australian Bureau of Statistics (ABS) demographic
indicators.
3.4.1.2. Social cohesion and reconciliation (SCORE) index
Burns, Lefko- Everett and Njozela (2018:4), explain that the SCORE index measures
social cohesion and reconciliation, which it deems as important conditions, required
for peace in any society. The SCORE index uses open-ended survey questions
conducted through face-to-face interviews. The indicators used for measurement are
the people’s perception on corruption; trust in state institutions, feelings represented
by institutions and inclusiveness in decision-making processes, human security and
civic life satisfaction.
The United Nations Development Programme (UNDP) (2015:13) report outlines that
the first step in calculating the SCORE index was to test the internal
reliability/consistency of indicators for social cohesion and for reconciliation using
Cronbach’s alpha with the value that can vary from zero to one. If the value obtained
is closer to one, then there is a higher internal consistency where, in principle, the
values between 0.7 and 0.8 were considered to be acceptable. Once the desired
internal consistency was achieved, a two-way Explanatory Factor Analysis (EFA) was
performed for social cohesion and reconciliation. The components that constituted

43
each dimension were included when performing the EFA, showing that a single
construct is measured rather than multiple constructs. The last stage was to complete
a Confirmatory Factor Analysis (CFA). The programme used was instructed to load
certain items on a specific indicator and which indicators to load onto which
dimensions. After the finalisation of the model, the loadings were then used to estimate
the scores for social cohesion and reconciliation. The scores ranged from 0 to 10.
3.4.1.3. Kenyan social cohesion index
The Kenya Institute for Public Policy Research and Analysis (KIPPRA) (2014),
established the Kenyan Social Cohesion Index (KSCI) in 2013. The KSCI was based
on a nationally representative public opinion survey. Naituli and Nasimiyu (2018: 37)
outline the indicators for measuring social cohesion in Kenya as follows:
Prosperity focuses on the ability of the state to ensure the well-being of society,
Equity deals with the equality and access to economic opportunities,
participation, solidarity and decision-making,
Peace is the absence of protest in the society; crime-free environment,
Diversity deals with the degree of social bonds in Kenya, e.g. cultural bonds
and values,
Diversity, and
Trust measures the extent to which people trust each other in a society.
Naituli and Nasimiyu (2018), further explain that the statistical method used for
calculating the KSCI was the Principal Component Analysis (PCA) technique. The
PCA technique identified a latent variable from a pool of possible variables that might
define social cohesion. The PCA also tested the variance and covariance matrix of
factors underlying the phenomenon of social cohesion. Lastly, the data was weighted
for each variable and summed to arrive at an index for each dimension, which was
aggregated to arrive at KSCI.
3.5. Measures of social cohesion and survey questions
It is crucial to first look at the contents of the questionnaire in relation to the variables
for measuring social cohesion for this study. The WVS conducts a survey by asking

44
the respondents to place their views on a scale of one to ten on various issues. For
the possible measure of social cohesion, the contents of the questionnaires are
discussed briefly below in line with the indicators of WVS.
3.5.1. Economic measures
For this indicator, respondents were required to respond to two statements on both
sides of the questionnaire. The question on the left side of the questionnaire was
whether “incomes should be made more equal” and on the right side was whether “we
need larger income differences as an incentive for individual effort”. A measure of 1
meant that the respondent completely agreed with a statement on the left and 10
meant he/she completely agrees with the statement on the right.
3.5.2. Societal level of cohesiveness
Social justice and equity: In this indicator, the people’s views and feelings about
how they evaluate their national policy, play an important role. The WVS asks
the respondents about their confidence in the government.
Acceptance and rejection: This measure deals with how people feel about the
minority groups in their society, immigrants and newcomers. This study chose
an indicator from the WVS questionnaire that asks an individual about whether
he/she would like to have immigrants/foreigners as neighbours, or not.
3.5.3. Measures of wellbeing
Worth: The indicators chosen from the WVS for this measure are satisfaction
with one’s life, and satisfaction with financial situation in the household.
Health: The WVS asks in the questionnaire the respondent about his/her state
of health.

45
3.5.4. Measures of social capital
Participation: People’s willingness to give back to society in terms of voluntary
work; being a part of a political organisation or any cooperative involvement
does assist in nation building. The indicator chosen on the WVS for this
measure is people’s membership of political organisations and whether a
person is an active/inactive member of a humanitarian or charity organisation.
Interpersonal trust: the WVS questionnaire would ask a respondent whether in
his/her own view people can be trusted or whether one needs to be careful in
dealing with people.
The index of social cohesion will be calculated using the measures and indicators
outlined above. Each indicator has a specific code on the WVS database and the table
below provides the summary of measures and how they are presented in the WVS
database. The table below shows measures, indicators and their description and
codes in the WVS survey.

46
Table 3.1: Summary of social cohesion metrics
Measure Indicators WVS codes and description
1. Economic measure Inequality V96: Income inequality
2. Societal level of
cohesiveness
Social justice & equity
Acceptance and rejection
V115: Confidence: the
government (in your
nation’s capital)
V39: Would not like to
have as neighbours:
immigrants/ Foreign
workers
3. Measures of well-being Worth
Health
V23 Satisfaction with your
life
V11: State of health
(subjective)
4. Measures of social
capital
Participation
Interpersonal trust
V29: Active/inactive
memberships: political
party
V32 Active/inactive
humanitarian or charitable
organisation
Most people can be
trusted
The measures provided in Table 3.1 will be used to develop an index of social
cohesion. The success of developing a social cohesion index (SCI) will enable the
study to test its relationship with the IDI. The empirical analysis presented in the next
chapter will provide a clear outline of the computation of the SCI and also how it is
tested with the IDI.
In summary the study uses the data from the WVS to measure social cohesion. A
measure of social cohesion will be achieved through developing an index of social
cohesion. The study also highlighted some of the social cohesion measures and
indices (Scanlon- Monash index, SCORE index and Kenyan social cohesion Index)
which will guide the methodology of developing an index for this study.

47
3.6. Conclusion
The main aim of this chapter is to describe the different measures that will be used to
test the relationship between inclusive development and social cohesion. The national
key performance indicators / measures of IDI were discussed in detail. The study also
discussed how the WVS obtains its data and the question asked to respondents during
survey. The measures of social cohesion, indicators, as well as the data from the
respondents will be used for the empirical analysis for the study in the next chapter.
48
4. Chapter 4: Empirical analysis
4.1. Introduction
Chapter 2 explained that social cohesion is important if policymakers want to address
socio-economic challenges. The policy reforms necessary to improve the equity and
sustainability of growth will have short-term costs, but greater social cohesion will help
citizens bear such costs in expectation of long-run benefits. Chapter 3 argued that
measuring social cohesion is more of a challenge and described the data sources that
will be used to test the relationship between inclusive development and social
cohesion. The focus was on the WEF’s Inclusive Development Index and measures
of social cohesion from the WVS.
This chapter presents the empirical analysis of the dissertation. The first step is to
compile a social cohesion index using the WVS data and this is explained in section
4.2. The indicators of social cohesion were identified in the previous chapter and can
be referred to in Appendix A1. This construction of an aggregate measure of social
cohesion using a method similar to that of Burns et al. (2018). Then section 4.3
presents the empirical analysis and the use of this social cohesion index in a
regression model of inclusive development. Different models are estimated and the
results interpreted in this section. Section 4.4 shows the diagnostic tests of the
regression models. The conclusions are presented in section 4.5.
4.2. Calculating a social cohesion index for a cross-section of countries
The first step in constructing an index is to filter the data using Microsoft Excel in order
to filter only the indicators (6) and countries (42) that are relevant for this study. The
42 countries are a mix of advanced and emerging economies from a convenience
sample determined by data availability. The WVS surveys countries in waves over
multiple years. The 42 countries included in this analysis has data available form wave
6 conducted from 2010 to 2014. It is the most up to date values data that can be used
alongside the more recent IDI data. The first step in the construction of the index is to
49
assign new consecutive country codes, replacing the country codes used in the WVS.
Table 4.1 below shows that the countries are numbered 1 through 42 along with the
number of responses to the WVS per country. It is notable that respondents in India
make up a large share of the observations (Appendix 1).
The next step is to account for the different scales used in the WVS questionnaire
items. The issue is that the numbering of different responses do not measure in the
same direction across different items. An example is the state of health indicator,
where its scale ranges from one to four, with one representing very good health and
four representing poor health. On the other hand, the life satisfaction indicator has a
scale of one to ten, where one represents a “not satisfied” outcome and ten means
“completely satisfied”. Therefore, where necessary, scales are reversed to ensure that
“positive” outcomes, which are likely to be associated with social cohesion (as per
Chapter 3), are all measured in the same direction.
To standardise the different measures, the scaled responses are reclassified into
simple binary measures per respondent (Appendix 3).
For state of health, the rating scale is from one to four, where one and two
represent very good and good health, while three and four represent fair and
poor health. This then recoded into two categories of one and zero where one
represents fair to very good health and zero represents poor health.
For the life satisfaction measure, respondents who answered from five to ten
are assigned one (satisfied) and respondents who answered from one to four
are assigned zero (not satisfied).
The third indicator from the WVS measures respondents’ views of whether
“people can be trusted”. Those respondents who answered one for trust in the
WVS are again assigned a one, indicating trust. Those who responded with a
two in the WVS, i.e. no trust, are now assigned a zero.
For the WVS item that asked whether respondents are members of a political
party, respondents who answered zero and one (not a member, or an inactive
member) are now assigned a zero (inactive membership) and those who
responded by selecting a two on the WVS scale, are given a one (active
membership).

50
The fifth WVS indicator is about the respondent’s membership of a charity
organisation, or humanitarian organisation. Similar to the above, respondents
who answered zero and one (not a member, or an inactive member) are now
assigned a zero (inactive membership) and those who responded by selecting
a two on the WVS scale, are given a one (active membership).
The WVS also asked respondents about people that they would like to have as
neighbours, specifically immigrants. Respondents who mentioned that they
would not like to have immigrants as neighbours were recorded with a one in
the WVS data and this is now recoded to zero. Those that did not mention it are
coded as one.
The WVS also asked respondents whether they think that income should be
distributed more equally. Those who answered on the scale from five to ten are
now recoded as one, favouring equality. Those who answered from one to four
are recoded as zero.
The last indicator measured whether respondents have confidence in the
government. The respondents who answered with one or two are recoded as
one (confidence), and those who chose three and four are recoded as zero (no
confidence).
Appendix 2 attached shows the indicators and their codes as presented on the WVS
survey questionnaire.
Chapter 3 explained that the eight measures of social cohesion can be grouped as
four factors, or constructs of social cohesion. The next step is to calculate a value for
each of the constructs using the simple average of the percentage of respondents that
gave responses categorised above as “more social cohesion”. Again, this is done at a
country level. The result is expressed as a value between 0 and 1 (Appendix 3).
Equality: In an effort to calculate the index of social cohesion for this study, the
average of the income equality/inequality indicator is used for this construct.
The proportion of respondents who favoured a more equal distribution of
income is the single measure that is used.
Societal level of cohesiveness: This construct takes the average of individuals
who have confidence in their government to deal with social issues as well as
the measure of how people feel about the presence of immigrants or foreign
workers in their surroundings.

51
Wellbeing: The average of the proportion of respondents who are more satisfied
with life and the proportion of those who are in good health are used to measure
this construct.
Social capital: The study considers the average of people’s participation in their
country’s politics, society’s involvement in humanitarian and charity
organisations and lastly the level of trust the society has.
Appendix (3) presents a table for all the indicators used to measure social cohesion
for this study in each country and how they were re-scaled.
Finally, to calculate a summary social cohesion index score per country, the simple
average of the scores per construct are calculated. The results of the social cohesion
index (SCI) will range from zero to one (refer to Appendix 4), where a value closer to
one represents strong cohesion and a value closer to zero is explained as weak
cohesion for a particular country.
Appendix 5, shows the social cohesion index for the cross section of countries
examined in this study. The SCI shows that Sweden (0.67) and New Zealand (0.66)
are the countries with higher scores of SCI of the advanced economies. The SCI, as
mentioned above, ranges between zero and one, where the average SCI score is
expected to range around 0.5. Countries from the advanced economies that have
scored above average include Slovenia (0.53), and Japan (0.55). From the list of
advanced economies chosen for this study, Estonia (0.49) scored the lowest in SCI.
Argentina, (0.87), Malaysia (0.66), China (0.65), and Uruguay (0.64) are amongst
countries on the list of emerging economies to have scored above the average score
of SCI. The SCI results also show that Ukraine has the lowest SCI score (0.47)
amongst the emerging economies. Most of the SCI scores for the countries are
centred on the average score (0.5), where Argentina is the only country that has
managed to get a score close to one. The SCI scores presented in Appendix 5 above
will be analysed along with the IDI index presented in Chapter 3 in order to examine
the relationship between the two variables.
52
4.3. Estimation technique
The study aims to estimate a simple regression model (using E-views 7), to analyse
the relationship between inclusive development and social cohesion. Inclusive
development is estimated as a function of social cohesion and a number of control
variables. This study estimates the model as follows:
𝐼𝐷𝐼 = 𝐶 + 𝛽1𝑆𝐶𝐼 + 𝛽2𝐷𝑉 + 𝛽3𝐶𝑂𝐶 + 𝛽4𝐶𝐷 + 𝛽5𝐸𝐹 + 𝛽6𝐺𝐸 + 𝛽7𝑅𝑂𝐿 + 𝑒𝑡 … … . . 𝐸𝑞𝑢𝑎𝑡𝑖𝑜𝑛(4.1)
Where:
IDI= Inclusive Development Index
C= Constant
SCI= Social Cohesion Index
DV = Dummy Variable (where 0= developed economy and 1= developing economy)
COC= Control of corruption
CD= Cultural diversity
EF= Ethnic fractionalisation
GE= Government effectiveness
ROL= Rule of law
Et= Error term
The controls are variables that are frequently used as predictors / determinants of
institutions (see Easterly et al. 2006), and as such are used as country-level factors
that can influence inclusive development. The data for the government quality /
effectiveness indicators (COC, GE, ROL) used in the above regression equation is
obtained from the World Bank data site. The World Bank through the Worldwide
Governance Indicators (WGI) project reports on the overall and complete governance
indicators for more than 200 countries over the period of 1996 to 2017.
The WGI compiles information from different data sources on views and experiences
of citizens, entrepreneurs, private institutions and non-government organisations
globally, on various aspects of governance. According to the World Bank-WGI (2018),

53
the WGI relies on four different types of data, which includes surveys of household
and firms (Afro Barometer Surveys, Gallup World-poll), commercial business
information providers (Economist Intelligent Unit, Global Insight and Political Risk
Services), non-government organisations (Global Integrity, Freedom House,
Reporters Without Borders) and public sector organisations (CPI assessments of
World Bank, the European Bank for Reconstruction and Development (EBRD)
transition report, French Ministry of Finance Institutional Profile database).
The first step the World Bank uses in the aggregation methodology of the WGI includes
the assignment of data from individual sources to the aggregate indicators. The
second step involves the rescaling of the individual data sources to range from zero
to one. A higher value resulting from the rescaling corresponds with better outcomes,
while the lower values closer to zero represent the worst outcomes. The World Bank-
WGI Report (2018) methodology then uses the unobserved component model (UCM)
to construct a weighted average for all the indicators. The UCM develops an aggregate
measure of governance in units of a standard normal distribution consisting of a mean
zero with a standard deviation of one that runs from approximately -2.5 to 2.5, where
higher values correspond with better outcomes (World Bank-WGI Report, 2018).
This study will only use three indicators from the WGI, namely rule of law, control of
corruption and government effectiveness. Furthermore, the study will concentrate on
the data for the aggregate indicators presented in their standard normal units ranging
from -2.5 to 2.5. The higher positive figures will mean that there is a better rule of law,
better control of corruption and more government effectiveness.
The data for cultural diversity and ethnic fractionalisation were collected from the
Ethnic and Cultural Diversity Index (2016). The index of cultural diversity is skewed
towards linguistic variations among members of a society where the similarity between
languages is measured with 1 depicting an index of population speaking two or more
languages, and 0 showing that the population speaks only one language. A higher
positive score will represent more diversity. According to Fearon (2003:201), ethnic
fractionalisation deals with the ability of people to identify each other based on
common language, ancestry, social, cultural and national experiences and a lower
score closer to zero will mean a perfectly homogeneous society and a figure closer to
one will represent a more fractionalised society. Table 4.4 summarises the indicators,
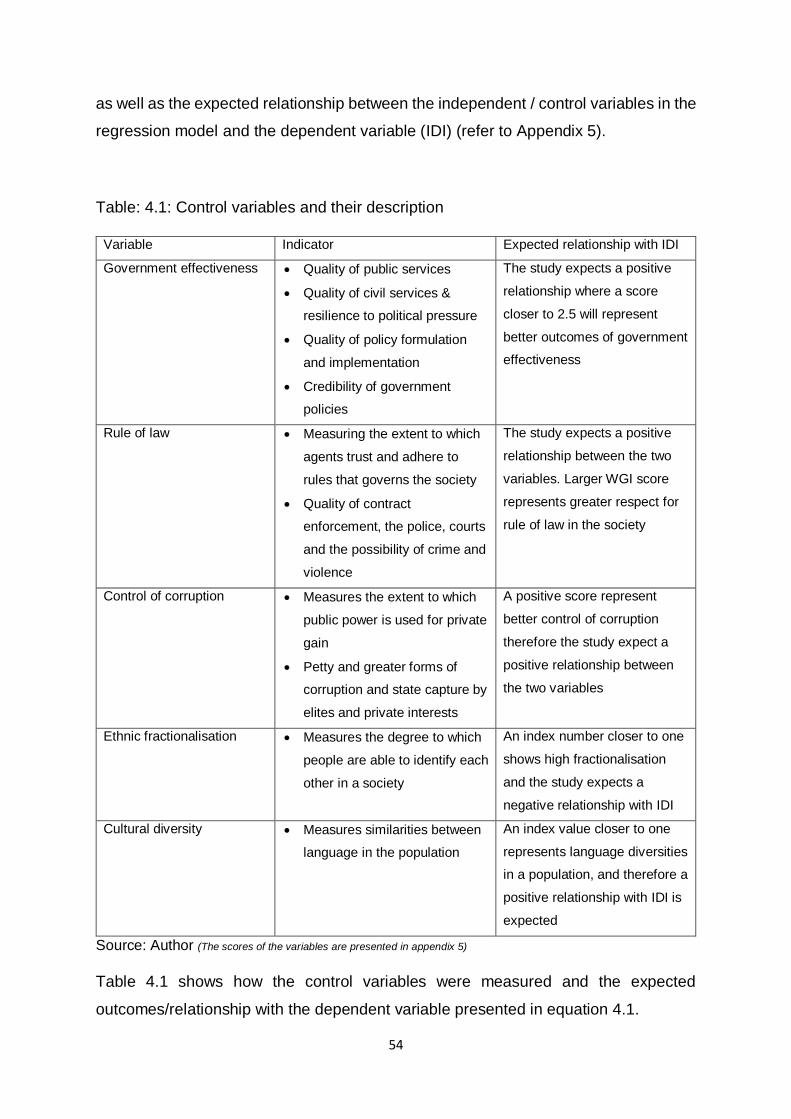
54
as well as the expected relationship between the independent / control variables in the
regression model and the dependent variable (IDI) (refer to Appendix 5).
Table: 4.1: Control variables and their description
Variable Indicator Expected relationship with IDI
Government effectiveness Quality of public services
Quality of civil services &
resilience to political pressure
Quality of policy formulation
and implementation
Credibility of government
policies
The study expects a positive
relationship where a score
closer to 2.5 will represent
better outcomes of government
effectiveness
Rule of law Measuring the extent to which
agents trust and adhere to
rules that governs the society
Quality of contract
enforcement, the police, courts
and the possibility of crime and
violence
The study expects a positive
relationship between the two
variables. Larger WGI score
represents greater respect for
rule of law in the society
Control of corruption Measures the extent to which
public power is used for private
gain
Petty and greater forms of
corruption and state capture by
elites and private interests
A positive score represent
better control of corruption
therefore the study expect a
positive relationship between
the two variables
Ethnic fractionalisation Measures the degree to which
people are able to identify each
other in a society
An index number closer to one
shows high fractionalisation
and the study expects a
negative relationship with IDI
Cultural diversity Measures similarities between
language in the population
An index value closer to one
represents language diversities
in a population, and therefore a
positive relationship with IDI is
expected
Source: Author (The scores of the variables are presented in appendix 5)
Table 4.1 shows how the control variables were measured and the expected
outcomes/relationship with the dependent variable presented in equation 4.1.

55
The next step of the analysis is to test whether the independent variables have a
relationship with each other and the strength of the relationship if it exists. The study
performs a hypothesis test to check the significance of the correlation coefficient on
the independent variables. According to Sedgwick (2012:1), a Pearson correlation
coefficient is represented by r, and the population from which the sample is drawn is
represented by P, the coefficient is measured on the scale and can take a value from
-1 through 0 to +1. The study tests for correlation to verify the possibility of
multicollinearity in the regression model. Table 4.5 presents the correlation results
performed using EViews 10.
Table 4.2: Pearson correlation
Covariance Analysis: Ordinary
Date: 05/06/19 Time: 21:02
Sample: 1 42
Included observations: 42
Correlation IDI SCI ROL GE EF COC CD
IDI 1.000000
SCI 0.204980 1.000000
ROL 0.680302 0.054605 1.000000
GE 0.692185 0.065825 0.950062 1.000000
EF -0.471811 -0.027796 -0.320853 -0.312999 1.000000
COC 0.611914 -0.039711 0.923138 0.881197 -0.347748 1.000000
CD -0.276852 -0.117302 -0.184273 -0.110290 0.748667 -0.252032 1.000000
Source: Author’s own calculations
It is clear that there are strong correlations between Rule of law (ROL), and
Government effectiveness (GE), and Control of corruption (COC). There is also a
strong correlation between Government effectiveness (GE), and Control of corruption
(COC). If these variables are used together in a single regression model, it may be the
cause of multicollinearity.
For this study seven regression models were estimated in order to analyse the
relationship between SCI and IDI with the inclusion of different control variables. The
correlation results also assist in selecting the combinations of variables for different
regression models applicable to this study. The summarised coefficient results for the
estimated regression models are presented in Table 4.3

56
Table 4.3: Regression results
Dependent
variable
(IDI)
Model 1 Model 2 Model 3 Model 4 Model 5 Model 6 Model 7
C 3.38
(0.0018)*1
3.76
(0.0003)*
3.71
(0.0008)*
2.85
(0.0084) *
3.25
(0.0027)
3.16
(0.0025)*
3.09
(0.0023)*
SCI 2.81
(0.0989) ***
2.69
(0.0907)***
2.52
(0.1344)
2.97
(0.0854)***
2.84
(0.0718)***
2.20
(0.1544)
2.25
(0.1368)
Dummy
Variable
-1.32
(0.0000) *
-1.12
(0.0001)*
-1.26
(0.0000) *
-0.69
(0.0874)***
-0.28
(0.5213)
-0.22
(0.6112)
EF -1.19
(0.0126)**2
-1.06
(0.0257)**
-1.07
(0.0201)**
-1.05
(0.0213)
EF* Dummy -2.36
(0.0000)*
CD -0.79
(0.1485)
0.81
(0.2408)
COC 0.25
(0.1702)
-0.04
0.8555
GE 0.61
0.0584***3
0.44
(0.2945)
ROL 0.14
(0.7104)
R- Squared 0.4239 0.5121 0.4551 0.4379 0.5366 0.5811 0.5823
Adj R-
Squared
0.3945 0.4736 0.4122 0.3936 0.4865 0.5229 0.5243
Probability values are shown in brackets and coefficients above
1 * Represents 1% level of significance 2 ** Represents 5% level of significance 3 ***Represents 10% level of significance
57
The table 4.3 summarises the results of the estimation of seven different specifications
of the regression model represented by equation 4.1. The study sets the alpha level
at 0.1 where the study accepts up to 10% chance of rejecting the null hypothesis when
it is actually true.
Model 1 runs a regression between IDI and SCI with the addition of a dummy variable
where a value of one indicates a developing country and zero represents a developed
country (Appendix 5). The coefficient values in Table 4.3 shows that SCI has a positive
relationship with IDI, and the probability statistics show SCI to be statistically
significant at the 10 percent level (Appendix 6A, Model 1). The results also show that
the dummy variable has a negative relationship with IDI and that it is statistically
significant. It indicates that there is a difference between developed and developing
economies that have lower levels of IDI. The R-squared shows that 42.4 percent of
the variation in IDI can be explained by SCI and this allows the study to add more
variables in the next model to further test and analyse the relationship.
Model 2 adds EF to the independent variables used in model 1, and the results for
model 2 still show SCI as having a positive relationship with IDI, and still statistically
significant at the 10 percent level (Appendix 6B). The coefficient for EF shows that it
has a negative relationship with IDI, and statistically significant at the 10 percent level.
The addition of the second independent variable in model two also shows an
improvement in the R- squared. The results show that 51.2 percent of the variation in
IDI can be explained by the independent variables.
Model 3 substitutes ethic fractionalisation (EF) for cultural diversity (CD) to further test
the relationship between the social cohesion and inclusive development. The values
for the coefficients show that both SCI and CD have a positive relationship with SCI,
but that both independent variables are statistically insignificant. The coefficient for the
dummy variable shows an existence of a negative relationship with IDI and it is also
strongly statistically significant. The R-squared for model 3 shows a drop in the fit of
the model. In this variation 45.5 percent of the variation in IDI can be explained by SCI,
dummy variable and CD in this model.
Model 4 adds an interaction variable (EF*DV) in the regression model to further
examine the results from model 3. The coefficients presented in table 4.3 shows an
existence of a positive relationship between SCI and IDI and that SCI is statistically

58
significant at the 10 percent level. The multiplicative dummy variable shows an
existence of a negative relationship with IDI and also it is strongly statistically
significant at the 10 percent level. The result can be interpreted to mean that ethnic
fractionalisation is more detrimental to inclusive development in developing
economies than in developed economies. The R- squared shows that 43.8 percent of
the variation in IDI can be explained by the independent variables.
Model 5 represents a run of the regression model with four independent variables
(SCI, DV, EF and COC). The coefficient value for SCI in Table 4.3 shows an existence
of a positive relationship with IDI and also that it is statistically significant at 10 percent.
EF and DV both have a negative relationship with IDI and they are both statistically
significant at different probability levels (EF at 5 percent and DV at 10 percent). The
coefficient results in Model 5 also shows that COC has a positive relationship with IDI
and the results shows that it is not statistically significant.
Model 6 uses the four independent variables in model 5 with GE as an added
independent variable to the regression equation. The coefficient results show SCI as
still having a positive relationship with IDI but in this case the probability results shows
that it is not statistically significant. The coefficient results also shows EF as having a
negative relationship with IDI and the regression results also show the variables as
being strongly significant at 5%. The coefficient results further shows that COC has a
negative relationship with IDI and that the probability depicts that it is not statistically
significant. The coefficient for ROL show an existence of a positive relationship with
IDI and the probability results shows that it is statistically significant at the 10 percent
level. The R- squares shows that 58.1 percent of the variation in IDI can be explained
by the independent variables. Given the correlation table above, this model has to be
tested for multicollinearity.
The last model (7) uses five independent variables (SCI, DV, EF, ROL, GE). The
probability results show that only one variable is statistically significant in the model
with a negative relationship to IDI as shown by the coefficient value. Given the
correlation table above, this model has to be tested for multicollinearity.
This study estimated seven models to analysing the relationship between IDI and SCI
with some additional control variables. Before the summing up the results of the control
variables, it is crucial to explain the results of the main independent variable (SCI).

59
The coefficient shows that social cohesion (SCI) has a positive relationship with
inclusive development (IDI) when the regression was ran in seven models. The
probability results show that SCI is statistically significant at the 10 percent level in four
models (model1, model 2, model 4 and model 5) out of seven. Of the control variables,
greater ethnic-fractionalisation (EF) showed a negative relationship with inclusive
development in all models it was used and the results shows that this relationship is
statistically significant at the 5 percent level. The relationships of the other control
variables (COC, GE and ROL) also matches the expected relationships outlined in
table 4.1. Control of corruption, government effectiveness and rule of law were
positively related to inclusive development in different versions of the model.
The study, through the use of the regression modelling, has managed to establish the
existence of a positive relationship between IDI and constructed SCI. It is also crucial
to perform diagnostic tests to assist in validating the results of the models. The study
performed a heteroscedasticity test (white test) and Ramsey’s RESET test and the
results are reported in the following sub-section.
4.4. Diagnostic test analysis
4.4.1. Heteroskedasticity
According to Williams (2015:5), the White test estimates the overall test for
heteroscedasticity in the error distribution by regressing the squared residuals on all
different regressors, cross-products, and squares of regressor. Klein, Buchner, and
Schmermelleh- Engel (2016:568), define heteroscedasticity as a situation whereby
errors in a linear model are not independently and identically distributed, and also
whether the errors are forecasted to have different variances. This study will test for
heteroscedasticity (white test) for model 5 using Eviews10, where the null hypothesis
assumes that there is no heteroscedasticity. The results of the test are presented in
Table 4.4.

60
Table 4.4: White test results
Model1 Model 2 Model 3 Model 4 Model 5 Model 6 Model 7
0.5841 0.7175 0.5788 0.8331 0.8473 0.9110 0.8853
Table 4.4 provides the Chi- square probability results for the White test conducted to
check existence of heteroscedasticity for all seven models. Based on the probability
results, the study cannot reject the null hypothesis that there is no heteroscedasticity
in all the regression models presented. The results also permit the study to conclude
that the variance of the residual is constant in all models The study further concludes
that the model chosen for measuring the relationship between social cohesion and
inclusive development can be relied upon based on the heteroscedasticity results
presented above (refer to Appendix 7A- 8G).
4.4.2. Ramsey RESET test
According to Shakur and Mantalos (2004:370), the Ramset RESET test is regarded
as a general misspecification test where its focus is on detecting omitted variables and
inappropriate functional form.
Table: 4.5. Ramsey RESET test Model
Model 1 Model 2 Model 3 Model 4 Model 5 Model 6 Model 7
0.8037 0.7319 0.8159 0.4117 0.4869 0.6509 0.6379
Table 4.5 shows the F statics probability results of the Ramsey reset tests conducted
in all seven models of the study. The Ramsey RESET test for this study is conducted
under the null hypothesis of no misspecification in the model. Rao (1971:37) highlights
that the presence of misspecification can be as a result of irrelevant variable in the
model or because of an omission of a variable specified by the truth. This study

61
assumes that the test statistic for all models are exactly F-distributed. The results of
the Ramsey RESET test shown in Appendix A8 and summarised above, informs the
study. One cannot reject the null hypothesis of no misspecification in the model. The
study therefore concludes that all the seven models do not suffer from omitted variable
bias or misspecification of functional form (Refer 8A to 8G).
4.5. Conclusion
The study has successfully compiled an index of social cohesion (SCI) and applied a
simple OLS regression model to test the relationship between inclusive development
and social cohesion. The study used seven models to test the relationship between
IDI and SCI including different combinations of control variables. A positive
relationship was established between IDI and SCI as depicted by the coefficient values
in table 4.3. The results also show that between IDI and ethnic fractionalisation there
exists a negative relationship It seems that for this sample of countries, greater cultural
diversity’s relationship with IDI varies even though it is statistically insignificant. There
is also a positive relationship between IDI and better control of corruption, as one
would expect, and a positive (and insignificant) relationship with government
efficiency. The diagnostic tests performed for this study prove that the model does not
have heteroscedasticity and is correctly specified. The reliability of the model and the
analysis of the regression results presented above enable the study to draw
conclusions and make recommendations presented in Chapter 5.

62
5. Chapter 5: Conclusion and recommendations
In Chapter 1 it was argued that economic growth is a necessary, but not sufficient
condition for ensuring economic development. In recent years, growth has fuelled
inequality. In response, the concept of inclusive development became the focus, of for
example, the World Economic Forum. They developed an Inclusive Development
Index the extent to which the citizens of a country can sustainably participate in and
benefit from economic activities. The concept of inclusive development and the
indicators used in the IDI were discussed in chapters 2 and 3.
Chapter 2 also explained that to ensure inclusive development requires good policies
and institutions: The policy reforms necessary to improve the equity and sustainability
of growth will have short-term costs; and this requires social cohesion. A lack of social
cohesion is often associated with social conflicts and extractive institutions. The
concept of social cohesion and indicators used to measure it were discussed in
chapters 2 and 3.
Thus the objective of this study was to explore the relationship between social
cohesion and inclusive development. Since an index for social cohesion for a cross-
section of countries was not readily available, the study compiled its own index of
social cohesion using data from the World Values Survey. The study used the IDI from
the WEF, which was readily available to measure inclusive development. The study
used a simple OLS regression model to test the relationship between the two
variables.
The results showed a positive and significant relationship between inclusive
development and social cohesion in a cross section of countries. The use of a dummy
variable showed that there is a difference in the levels of inclusive development
between developed and developing economies. It was found that ethnic-
fractionalisation is negatively associated with inclusive development and that it is more
detrimental to inclusive development in developing economies. Control of corruption,
government effectiveness and the rule of law were all positively associated with
inclusive development in different versions of the model. White’s test for
heteroscedasticity and Ramsey’s test for misspecification showed that the basic
assumptions for the regression model holds.

63
The conclusion is that there exists a nexus between inclusive development and social
cohesion. The institutions literature often focuses on the proxy measures for good
governance or inclusive institutions, but this study has shown that it is worthwhile to
drill a level deeper and consider the social fabric on which the “rule of the game” are
built.
The recommendation for further work is to focus on specific countries that have, over
time, experienced changes in their social fabric and their institutions. The aim would
be to determine whether changes in social cohesion leads or follows economic
inclusivity.
64
6. Bibliography
Acemoglu, D., & Robinson, J. (2008). The Role of Institutions in Growth and
Development. Commission on Growth and Development, Working Paper No
10.
Adu, D., & Denkyirah, E. (2017). Economic Growth and Environmental Pollution in
West Africa: Testing the Environmental Kuznets Curve hypothesis. Kasetsart
Journal of Social Sciences ,1-8
Akpoilih, R., & Farayibi, A. (2012). Economic Growth and Inequality in Nigeria:
Magnitudes and Challenges. Munich Personal RePEc Archive: 1- 19.
Alam, J. (2014). On the Relationship between Economic Growth and CO2
Emissions: The Bangladesh Experience. IOSR Journal of Economics and
Finance (IOSR-JEF), e-ISSN: 2321-5933, p-ISSN: 2321-5925,5(6). Ver. I: 36-
41.
Alexandre, M., Alys, W., Ghazia, A., Michelle, R., & Kanishka, B. (2013). Societal
Dynamics and Fragility : Engaging Societies in Responding to Fragile
Situations. New frontiers of social policy;. Washington, DC: World Bank.
Ali, I., & Zhuang, J. (2007). Inclusive Growth Towards a Prosperous Asia: Policy
Implications. ERD Working Paper, Series NO 97. Economics and Research
Department, Asian Development Bank.
Anderson, G., & Hachem, K. (2009). Institutions and Economic Outcomes: A
Dominance-Based Analysis of Causality and Multivariate Welfare with
Discrete and Continuous Variables. University of Toronto, Department of
Economics, Working Papers
Ansari, S., Munir, K., & Gregg, T. (2012). Impact at the ‘Bottom of the Pyramid’: The
Role of Social Capital in Capability Development and Community
Empowerment. Journal of Management Studies, 49(4).
Atkinson, A., Hills, J. (Eds.), 1998. Exclusion, employment and opportunity. CASE
Paper 4, Centre for Analysis of Social Exclusion, London School of
Economics, London
65
Baumert, K., Herzog, T., & Pershing, J. (2005). Navigating the Numbers: Green House
Gas and International Climate and data Policy. World Resources Institute,
Washington DC.
Berger-Schmitt, R. (2000). Social Cohesion as an Aspect of the Quality of Societies:
Concept and Measurement. EU Reporting Working Paper No 14, Subproject:
European System of Social Indicators: Centre for Survey Research and
Methodology(Zuma), Social Indicators Department
Bettcher, K., & Mihaylova, T. (2015). Economic Inclusion: Leveraging Markets and
Entrepreneurship to Extend Opportunity. Center for Internaltional Private
Enterprise, Economic Reform Future Service.
Bolt, K., Matete, M., & Clemens, M. (2002). Manual for Calculating Adjusted Net
Savings. Environment Department, World Bank.
Bradley, S., McMullen, J., Artz, K., & Simiyu, E. (2012). Capital Is Not Enough:
Innovation in Developing Economies. Journal of Management Studies, 49(4).
Bryne, D., & Strobl, E. (2004). Defining unemployment in developing countries:
evidence from Trinidad and Tobago. Journal of Development Economics, 73:
465-476.
Burns, J., Lefko-Everett, K., & Njozela, L. (2018). From definition to measurement:
constructing a social cohesion index for South Africa. Cape Town. SALDRU,
UCT. (SALDRU Working Paper Number 217).
Chan, J., To, H-P., & Chan, E. (2006). Reconsidering Social Cohesion: Developing A
Definition And Analytical Framework For Empirical Research. Social
Indicators Research (2006), 75: 273-302.
Chan, J., & Chan, E. (2006) “Charting the State of Social Cohesion in Hong Kong.”
The China Quarterly, 187: 635–658.
Chmielewska, D. &Souza D., 2011. The Food Security Policy Context in Brazil.
International Policy Centre for Inclusive Growth, UNDP
Cilingir, Y. (2016). Social Cohesion for Economic Growth. Economic Policy Research
Foundation of Turkey. Area Studies Program, Macroeconomic Studies
Program.

66
Commission on Growth and Development Report. (2008). Strategies for Sustained
Growth and Inclusive Development. Washington DC: World Bank.
Coudel, A., Hentschel, J., & Wodon, Q. (2002). Poverty Measurement and Analysis
In a Sourcebook for Poverty Reduction Strategies. Core techniques and
Cross Cutting Issues, World Bank, Washington DC, 1: 27-74.
Easterly, W., Ritzen, J., & Woolcock, M. (2006). Social Cohesion, Istitutions and
Ethnic and Cultural Diversity Index. Wikipedia, the free encyclopaedia,
http://chartsbin.com/view/41545. Date of access: 08 Aug 2018
Fearon, J. (2003). Ethnic and Cultural Diversity by Country. Journal of Economic
Growth, 8 (2): 195-222.
Freeman, R. (2008). Labour Productivity Indicators : Comparison Of Two Oecd
Databases Productivity Differentials & The Balassa-Samuelson Effect. OECD
Statistics Directorate, Division of Structural Economic Statistics.
Foa, R. (2011). The Economic Rationale for Social Cohesion- The Cross- Country
Evidence. Paper at the Conference Social Cohesion and Development. OECD,
Paris.
George, G., McGahan, A., & Prabhu, J. (2012). Innovation for Inclusive Growth:
Towards a Theoretical Framework and a Research Agenda. Journal of
Management studies. (49)4. Research collection Lee Kong Chian School of
Business, 661683.
Giardello, M. (2014). The Generative Theory of Social Cohesion and Civic
Intergration. European Scientific Journal, Special Edition, 2. ISSN: 1857 –
7881
Green, A., Jaanmaat, J., & Han, C. (2009). Regimes of Social Cohesion. LLakes
Research Paper 1. Centre for Learning and Life Changes in Knowledge
Economies and Societies. Institute of Education. University of London.
Gumede, V. (2011). Social and Economic Inclusion in Post Aparthid South Africa, INJ,
Hofmeyer (Ed). From inequality to inclusive growth: 2011 transformation audit:
92-93.

67
Guzman, G. (2018). Household Income: 2016 American Community Survey Briefs.
United States Census Bureau.
Holtfrerich, C.-L., Feld, L., Heun, W., Illing, G., Kirchgässner, G., Kocka, J.,... von
Weizsäcker, C. (2016). Government debt: causes, effects and limits. Berlin.
Inglehart, R. (2017). Values Change the World: World Values Survey. World Values
Survey . https://www.iffs.se/media/1931/wvs-brochure-web.pdf. Date of
access: 28 Aug 2018
Jagger, C., Cox, B., Le Roy, S., & EHEMU Team. (2003). Health Expectancy
Calculation by the Sullivan Method: A Practical Guide. European Health
Expectancy Monitoring Unit, EHEMU Technical Report, 3rd Edition
Kahuthu A (2006) Economic growth and environmental degradation in a global
context. Environment, Development and Sustainability 8(1):55–68
Kanbur, R., & Rauniyar, G. (2009). Conceptualizing Inclusive Development: With
Applications to Rural Infrastructure and Development Assistance. Independent
Evaluation Department. Asian Development Bank. Ocassional Paper No 7.
Kenya Institute for public Policy Research and Analysis (KIPPRA). (2014). The Status
of Social Cohesion in Kenya, 2013. National Cohesion and Integration
Commission, 2014.
Klein, A., Gerhard, C., Büchner, R., Diestel, S., & Schermelleh-Engel, K. (2016). The
Detection of Heteroscedasticity in Regression Models for Psychologicaldata.
Psychological Test and Assessment Modeling, 58: 567-592
Larsen, C. (2013). Social cohesion: Definition, measurement and developments.
Centre for Comparative Welfare Studies
Loichinger, E., Hammer, B., Prskawetz, A., & Freiberger, M. (2014). Economic
Dependency Ratios: Present Situation and Future Scenarios. Welfare Wealth
Work for Europe.
Lopez- Carlos, A. 2015. How Inclusive Societies Boost Economic Growth. World
Economic Forum Publication. https://www.weforum.org/agenda/2015/08/how-
inclusive-societies-boost-economic-growth. Date of Access: 07 May 2018
68
Luyt, D. (2008). Governance, Accountability and Poverty Alleviation in South Africa.
Rhodes University: Centre for Social Accountability.
Markus, A. (2014). Mapping Social Cohesion: The Scanlon Foundation Surveys 2014.
Australia: ACJC, Faculty of Arts, Monash University.
Mohr and Associates. (2015). Economics For South African Students. 5th Edition.
Pretoria: Van Schaik Publishers.
Mulunga, S., & Yazdanifard, R. (2014). Review of Social Inclusion, Social Cohesion
and Social Capital in Modern Organization. Global Journal of Management
and Business Research: A Administration and Management,14 (3).
Naituli, G., & Nasimiyu, K. (2018). Perceptions of social cohesion: Evidence from
Kenya. International Journal of Development and Sustainability ISSN: 2186-
8662 – www.isdsnet.com/ijds,7 (1): 34-59.
National Gender and Equality Commission (NGEC). (2016). Status of Equality and I
Inclusion in Kenya . https: //www.Ngeckenya.org/Downloads /Status%20
of%20 Equality%20and%20Inclusion%20in%20Kenya.pdf . Date of access:
10 March 2018
Organisation for Economic Cooperation and Development. (2011). Perspectives on
Global Development 2012: Social Cohesion In A Shifting World. OECD
Publishing.
Oxfam- Briefing note on inclusive development. (2012). Inclusive development:
Esuring Benefits for all. https://www.oxfam. Org /sites/ www. oxfam. org/files
/inclusive_development.pdf. Date of access: 23 Feb 2018
Palmary, I. (2018). Reflections on social cohesion in contemporary South Africa.
African Centre for Migration & Society, University of the Witwatersrand,
Johannesburg, PINS, 2015, 49: 62-69.
Pardi, F., Salleh, A., & Nawi, A. (2015). A Conceptual Framework on Adjusted Net
Saving Rate as the Indicator for Measuring sustainable development in
Malaysia. Journal of Technology Management and Business (ISSN: 2289-
7224), 02 (02).

69
Pervais, Z., & Chaudhary, A. (2015). Social Cohesion and Economic Growth: An
Empirical Investigation. Melbourne: The Australian Economic Review, 48(4):
369-81.
Pouw, N., & Gupta, J. (2017). Inclusive Development: A multi Disciplinary Approach.
Current Opinion in Environmental Sustainability, 24: 104-108.
Rao, P. (1971). Some Notes on Misspecification in Multiple Regressions. The
American Statistician, 25 (5): 37-39.
Ritzen, J., 2001, Social cohesion, public policy and economic growth: implications for
OECD countries, in: J. Helliwell, ed., The Contribution of Human and Social
Capital to Sustained Economic Growth and Well‐Being (Human Resources
Development Canada, Ottawa)
Sachs, I. (2004). Inclusive development strategy in. World Commission on the Social
Dimension of Globalization, Working Paper no. 35: 8-10.
Samans, R., Blanke, J., Corrigan, G., & Drzeniek, M. (2015). Benchmarking Inclusive
Growth and Development Discussion Paper. Switzerland.
Sedgwick, P. (2012). Pearson,s Correlation Coefficient. Centre for Health Care
Education, St Georges, University of
London.BMJ2012:345:e443doi:10.1136/bmj.4483.
Shakur, G., & Mantalos, P. (2004). Size and Power of the RESET Test as Applied to
Systems of Equations: A Bootstrap Approach. Journal of Modern Applied
Statistical Methods, 3 (2), Article 10: 370-385
STATSSA. (2015). Poverty on the Rise in South Africa. Pretoria: Statistics South
Africa. http://www.statssa.gov.za/?p=10334. Date of access: 22 March 2018
Stern, D., Common, M., & Barbier, E. (1996). Economic Growth and Environmental
Degradation: The Environmental Kuznets Curve and Sustainable development.
World Development, 21(7): 1151.
United Nations data. (2018). GINI index (World Bank estimate). http: //data.
Un.org/ Data.aspx?d=WDI&f=Indicator_Code%3ASI.POV.GINI. Date of
Access: 25 Oct 2018

70
United Nations Development Programme (UNDP). (2015). Predicting Peace The
Social Cohesion and Reconciliation Index as a Tool for Conflict
Transformation. United Nations Development Programme
United Nations Economic Commission for Africa. (UNECA) (2018). Social Cohesion
In Eastern Africa. Addis Ababa, Ethiopia: United Nations Economic
Commission for Africa.
Williams, R. (2015). Heteroskedasticity. Indiana,USA: University of Notre Dame.
World Bank. (2012). Societal Dynamics & Fragility: Engaging Societies in Responding
to Fragile Situations. Washington DC: The World Bank Group.
World Bank (2018). The Worldwide Governance Indicators.
https://info.worldbank.org/governance/wgi/#home. Date of access: 14
Sep 2018
World Economic Forum. (2018). Inclusive Development Index: Summary and Data
Highlights. http://www3.weforum.org/docs/WEF_Forum_IncGrwth_2018.pdf.
Date of Access: 03 Mar 2018
World Economic Forum. (2016). Why does inclusive growth Matter. https: //www .
weforum.org/agenda/2016/01/why-does-inclusive-growth-matter/. Date of
access: 10 Feb. 2018
World Economic Forum. (2017). Inclusive Growth and development t Report. http:
//www3.weforum.org/docs/WEF_Forum_IncGrwth_2017.pdf. Date of
access:10 Feb.2018
Vijaykumar, S. (2012). Challenges Ahead For Inclusive Growth In India. IJRDMS, 6
(1).
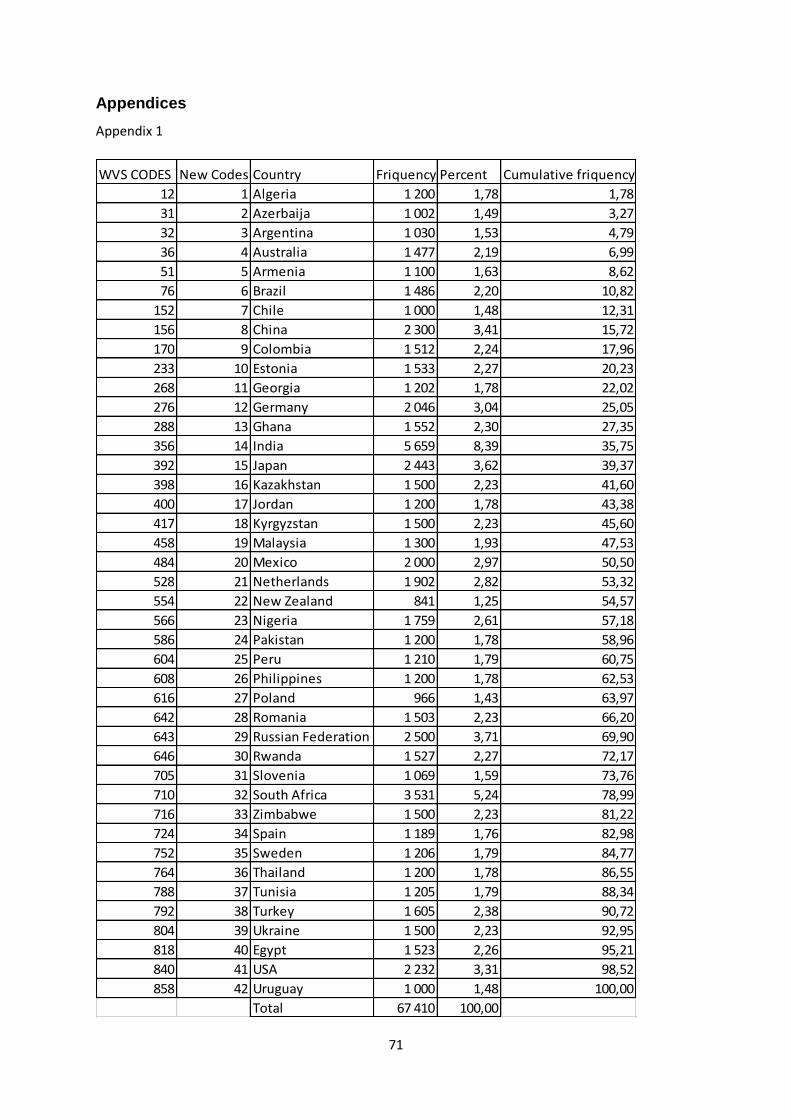
71
Appendices
Appendix 1
WVS CODES New Codes Country Friquency Percent Cumulative friquency
12 1 Algeria 1 200 1,78 1,78
31 2 Azerbaija 1 002 1,49 3,27
32 3 Argentina 1 030 1,53 4,79
36 4 Australia 1 477 2,19 6,99
51 5 Armenia 1 100 1,63 8,62
76 6 Brazil 1 486 2,20 10,82
152 7 Chile 1 000 1,48 12,31
156 8 China 2 300 3,41 15,72
170 9 Colombia 1 512 2,24 17,96
233 10 Estonia 1 533 2,27 20,23
268 11 Georgia 1 202 1,78 22,02
276 12 Germany 2 046 3,04 25,05
288 13 Ghana 1 552 2,30 27,35
356 14 India 5 659 8,39 35,75
392 15 Japan 2 443 3,62 39,37
398 16 Kazakhstan 1 500 2,23 41,60
400 17 Jordan 1 200 1,78 43,38
417 18 Kyrgyzstan 1 500 2,23 45,60
458 19 Malaysia 1 300 1,93 47,53
484 20 Mexico 2 000 2,97 50,50
528 21 Netherlands 1 902 2,82 53,32
554 22 New Zealand 841 1,25 54,57
566 23 Nigeria 1 759 2,61 57,18
586 24 Pakistan 1 200 1,78 58,96
604 25 Peru 1 210 1,79 60,75
608 26 Philippines 1 200 1,78 62,53
616 27 Poland 966 1,43 63,97
642 28 Romania 1 503 2,23 66,20
643 29 Russian Federation 2 500 3,71 69,90
646 30 Rwanda 1 527 2,27 72,17
705 31 Slovenia 1 069 1,59 73,76
710 32 South Africa 3 531 5,24 78,99
716 33 Zimbabwe 1 500 2,23 81,22
724 34 Spain 1 189 1,76 82,98
752 35 Sweden 1 206 1,79 84,77
764 36 Thailand 1 200 1,78 86,55
788 37 Tunisia 1 205 1,79 88,34
792 38 Turkey 1 605 2,38 90,72
804 39 Ukraine 1 500 2,23 92,95
818 40 Egypt 1 523 2,26 95,21
840 41 USA 2 232 3,31 98,52
858 42 Uruguay 1 000 1,48 100,00
Total 67 410 100,00

72
Appendix 2
Measure Indicators WVS codes and description
1. Economic measure Inequality V96: Income inequality
2. Societal level of
cohesiveness
Social justice & equity
Acceptance and
rejection
V115: Confidence: the
government (in your
nation’s capital)
V39: Would not like to
have as neighbours:
immigrants/ Foreign
workers
3. Measures of well being Worth V23 Satisfaction with
your life
V11: State of health
(subjective)
4. Measures of social
capital
Participation
Interpersonal trust
V29: Active/ inactive
memberships: political party
V32 Active/ inactive of
humanitarian or charitable
organisation
Most people can be
trusted

73
Appendix 3
World Values Survey questions
Measures of well-being
All things considered, how satisfied are
you with your life as a whole these
days? Using this card on
which 1 means you are “completely
dissatisfied” and 10 means you are
“completely satisfied”
where would you put your satisfaction
with your life as a whole?
10
Proportion of people who answered five to ten
(Satisfied:1: cohesion)
9
8
7
6
5
4
Proportion of people who answered one to four
(Not satisfied:0: no cohesion)
3
2
1
All in all, how would you describe your
state of health these days? Would you
say it is
4 Proportion of people who answered three and
four (poor health: 0: no cohesion) 3
2 proportion of people who answered one and two
(good health: 1: cohesion) 1
Measure of social capital
Now I am going to read off a list of
voluntary organisations. For each
organisation, could you tell me
whether you are an active member, an
inactive member or not a member of
that type of organisation?
2
Proportion on people who answered 2 ( Active:1:
cohesion)
1
Proportion of people who answered 1 (inactive
member) and 0 (don’t belong) :0: no cohesion 0
Now I am going to read off a list of
voluntary organisations. For each
organisation, could you tell me
whether you are an active member, an
inactive member or not a member of
that type of organisation?
2
Proportion on people who answered 2 (active:1:
cohesion)
1
Proportion of people who answered 1 (inactive
member) and 0 (don’t belong) :0: no cohesion 0
Generally speaking, would you say that
most people can be trusted or that you 1
Proportion of people who answered 1 (trust:
1:Cohesion)

74
need to be very
careful in dealing with people? 2
Proportion of people who answered 2 ( no trust:
0: no cohesion)
Societal level of cohesiveness
On this list are various groups of
people. Could you please mention any
that you would not like to have as
neighbours?
2
A proportion of people who answered 2 (not
mentioned:1: cohesion)
1
A proportion of people who answered 1
(mentioned: 0: no cohesion)
I am going to name a number of
organisations. For each one, could you
tell me how much confidence you
have in them: is it a great deal of
confidence, quite a lot of confidence,
not very much confidence or none at
all?
1 A proportion of people who answered one
(satisfied:1:cohesion) 2
3
A proportion of people who answered two (not
satisfied: 0: no cohesion) 4
Economic Measure
Now I'd like you to tell me your views
on various issues. How would you place
your views on this scale? 1
means you agree completely with the
statement on the left; 10 means you
agree completely with the
statement on the right; and if your
views fall somewhere in between, you
can choose any number in
between.
10
Proportion of people who answered 5 to 10
(equality:1:cohesion)
9
8
7
6
5
4
Proportion of people who answered 1 to 4
(inequality:0: no cohesion)
3
2
1
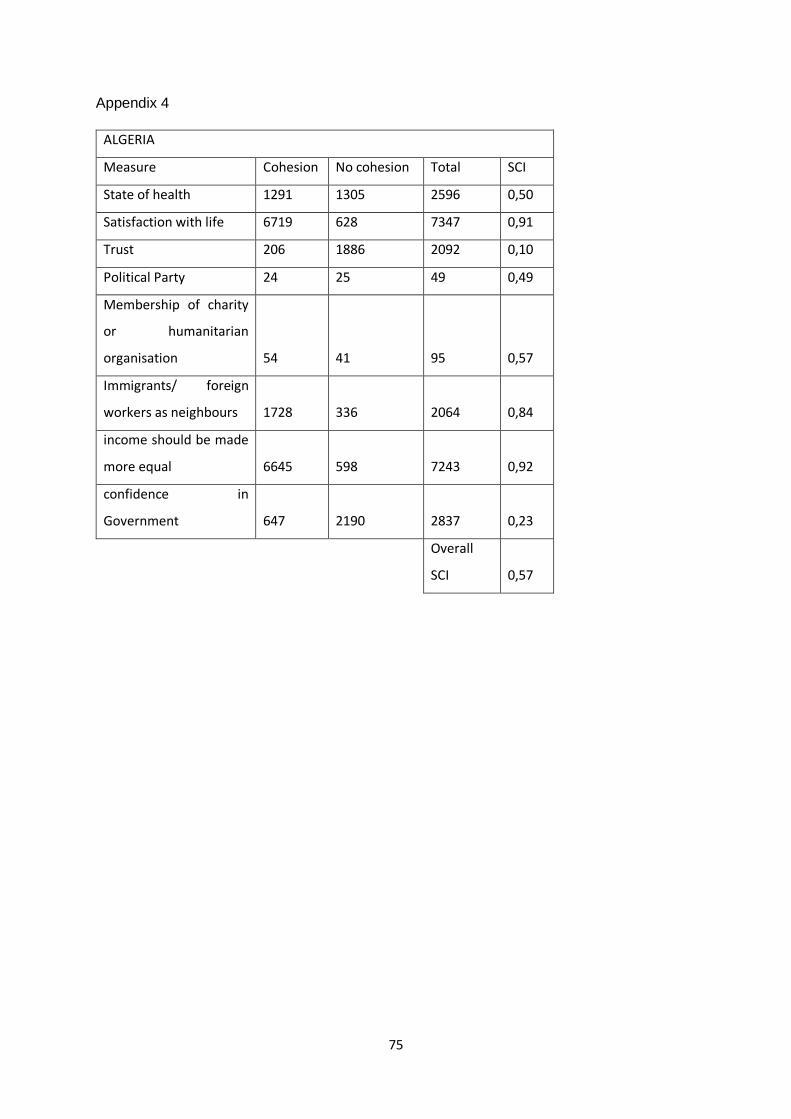
75
Appendix 4
ALGERIA
Measure Cohesion No cohesion Total SCI
State of health 1291 1305 2596 0,50
Satisfaction with life 6719 628 7347 0,91
Trust 206 1886 2092 0,10
Political Party 24 25 49 0,49
Membership of charity
or humanitarian
organisation 54 41 95 0,57
Immigrants/ foreign
workers as neighbours 1728 336 2064 0,84
income should be made
more equal 6645 598 7243 0,92
confidence in
Government 647 2190 2837 0,23
Overall
SCI 0,57

76
Appendix 5
Countries SCI IDI EF CD ROL GE COC DV
1 Algeria 0,57 4,22 0,32 0,24 -0,86 -0,6 -0,61 1
2 Azerbaijan 0,62 4,69 0,19 0,19 -0,25 -0,16 -0,88 1
3 Argentina 0,87 4,13 0,23 0 -0,25 -0,16 -0,26 1
4 Australia 0,62 5,36 0,15 0,15 1,68 1,54 1,8 0
5 Armenia 0,53 3,66 0,13 0,12 -0,16 -0,1 -0,56 1
6 Brazil 0,64 3,93 0,55 0,02 -0,28 -0,29 -0,53 1
7 Chile 0,54 4,44 0,45 0,17 1,01 0,85 1,04 1
8 China 0,65 4,09 0,15 0,15 -0,26 0,42 -0,27 1
9 Colombia 0,62 4,01 0,67 0,02 -0,36 -0,07 -0,37 1
10 Estonia 0,49 4,74 0,51 0,49 1,28 1,12 1,24 0
11 Georgia 0,48 3,99 0,49 0,4 0,33 0,57 0,74 1
12 Germany 0,59 5,27 0,1 0,09 1,61 1,72 1,84 0
13 Ghana 0,63 3,34 0,85 0,39 0,13 -0,11 0,23 1
14 India 0,56 3,09 0,81 0,67 0 0,09 -0,24 1
15 Japan 0,55 4,53 0,01 0,01 1,57 1,62 1,52 0
16 Kazakhstan 0,61 4,26 0,66 0,62 -0,41 0,01 -0,82 1
17 Jordan 0,56 3,4 0,51 0,05 0,26 0,12 0,26 1
18 Kyrgyzstan 0,63 3,36 0,68 0,62 -0,41 0,17 -1,05 1
19 Malaysia 0,66 4,3 0,6 0,56 0,41 0,84 0,03 1
20 Mexico 0,63 4,12 0,54 0,43 -0,57 -0,03 -0,93 1
21 Netherlands 0,6 5,61 0,08 0,07 1,83 1,85 1,87 0
22 New Zealand 0,66 5,25 0,36 0,36 1,92 1,77 2,24 0
23 Nigeria 0,6 3,08 0,8 0,66 -0,87 -0,96 -1,02 1
24 Pakistan 0,6 3,55 0,53 0,29 -1,29 -0,58 -0,78 1
25 Peru 0,56 4,29 0,64 0,51 -0,5 -0,13 -0,5 1
26 Philippines 0,62 3,83 0,16 0,12 -0,41 -0,06 -0,48 1
27 Poland 0,59 4,61 0,05 0,04 0,47 0,63 0,73 1
28 Romania 0,56 4,43 0,3 0,27 0,39 -0,17 -0,03 1
29 Russian Fed 0,5 4,2 0,33 0,31 -0,79 0,08 -0,89 1
30 Rwanda 0,59 3,24 0,18 0 0,13 0,26 0,63 1
31 Slovenia 0,53 4,93 0,23 0,17 1,02 1,17 0,81 0
32 South Africa 0,56 2,94 0,88 0,53 -0,01 0,28 -0,01 1
33 Zimbabwe 0,6 2,84 0,37 0,14 -1,38 -1,19 -1,27 1
34 Spain 0,58 4,4 0,5 0,26 1,01 1,03 0,49 0
35 Sweden 0,67 5,76 0,19 0,19 1,94 1,84 2,14 0
36 Thailand 0,61 4,24 0,43 0,43 0,04 0,38 -0,39 1
37 Tunisia 0,57 3,82 0,04 0,03 0,07 -0,07 -0,11 1
38 Turkey 0,61 4,26 0,3 0,3 -0,25 0,07 -0,19 1
39 Ukraine 0,47 3,42 0,42 0,26 -0,71 -0,46 0,78 1
40 Egypt 0,5 2,84 0,16 0 -0,53 -0,62 -0,54 1
41 USA 0,64 4,6 0,49 0,27 1,64 1,55 1,38 0
42 Uruguay 0,64 4,46 0,22 0 0,59 0,42 0,29 1

77
Appendix 6A (Regression Model 1)
Dependent Variable: IDI
Method: Least Squares
Date: 04/06/19 Time: 11:11
Sample: 1 42
Included observations: 42
Variable Coefficient Std. Error t-Statistic Prob.
C 3.379051 1.010874 3.342703 0.0018
SCI 2.809357 1.661600 1.690754 0.0989
DV -1.315664 0.258706 -5.085552 0.0000
R-squared 0.423995 Mean dependent var 4.042857
Adjusted R-squared 0.394456 S.D. dependent var 0.917665
S.E. of regression 0.714097 Akaike info criterion 2.233152
Sum squared resid 19.88742 Schwarz criterion 2.357271
Log likelihood -43.89620 Hannan-Quinn criter. 2.278647
F-statistic 14.35385 Durbin-Watson stat 1.606443
Prob(F-statistic) 0.000021
Appendix 6B (Regression Model2)
Dependent Variable: IDI
Method: Least Squares
Date: 04/06/19 Time: 11:15
Sample: 1 42
Included observations: 42
Variable Coefficient Std. Error t-Statistic Prob.
C 3.761618 0.953750 3.944031 0.0003
SCI 2.690209 1.549886 1.735746 0.0907
DV -1.120109 0.252495 -4.436168 0.0001
EF -1.190504 0.454424 -2.619806 0.0126
R-squared 0.512114 Mean dependent var 4.042857
Adjusted R-squared 0.473597 S.D. dependent var 0.917665
S.E. of regression 0.665799 Akaike info criterion 2.114735
Sum squared resid 16.84497 Schwarz criterion 2.280228
Log likelihood -40.40944 Hannan-Quinn criter. 2.175395
F-statistic 13.29570 Durbin-Watson stat 1.811036
Prob(F-statistic) 0.000004

78
Appendix 6C (Regression Model 3)
Dependent Variable: IDI
Method: Least Squares
Date: 04/06/19 Time: 11:20
Sample: 1 42
Included observations: 42
Variable Coefficient Std. Error t-Statistic Prob.
C 3.714483 1.021622 3.635870 0.0008
SCI 2.521538 1.648713 1.529398 0.1344
DV -1.266941 0.257027 -4.929214 0.0000
CD -0.799783 0.542304 -1.474788 0.1485
R-squared 0.455178 Mean dependent var 4.042857
Adjusted R-squared 0.412166 S.D. dependent var 0.917665
S.E. of regression 0.703577 Akaike info criterion 2.225112
Sum squared resid 18.81076 Schwarz criterion 2.390605
Log likelihood -42.72736 Hannan-Quinn criter. 2.285772
F-statistic 10.58254 Durbin-Watson stat 1.697312
Prob(F-statistic) 0.000034
Appendix 6D (Regression Model 4)
Dependent Variable: IDI
Method: Least Squares
Date: 04/06/19 Time: 11:24
Sample: 1 42
Included observations: 42
Variable Coefficient Std. Error t-Statistic Prob.
C 2.847181 1.024486 2.779132 0.0084
SCI 2.965244 1.678695 1.766398 0.0854
EF*DV -2.368370 0.500505 -4.731958 0.0000
CD 0.816861 0.685543 1.191554 0.2408
R-squared 0.437986 Mean dependent var 4.042857
Adjusted R-squared 0.393616 S.D. dependent var 0.917665
S.E. of regression 0.714591 Akaike info criterion 2.256181
Sum squared resid 19.40435 Schwarz criterion 2.421673
Log likelihood -43.37980 Hannan-Quinn criter. 2.316841
F-statistic 9.871324 Durbin-Watson stat 1.871326
Prob(F-statistic) 0.000060

79
Appendix 6E (Regression Model 5)
Dependent Variable: IDI
Method: Least Squares
Date: 04/06/19 Time: 11:30
Sample: 1 42
Included observations: 42
Variable Coefficient Std. Error t-Statistic Prob.
C 3.251836 1.009994 3.219660 0.0027
SCI 2.844129 1.534680 1.853239 0.0718
DV -0.692529 0.394472 -1.755585 0.0874
EF -1.064360 0.457777 -2.325062 0.0257
COC 0.251440 0.179738 1.398926 0.1702
R-squared 0.536623 Mean dependent var 4.042857
Adjusted R-squared 0.486528 S.D. dependent var 0.917665
S.E. of regression 0.657571 Akaike info criterion 2.110814
Sum squared resid 15.99876 Schwarz criterion 2.317680
Log likelihood -39.32710 Hannan-Quinn criter. 2.186638
F-statistic 10.71215 Durbin-Watson stat 1.934405
Prob(F-statistic) 0.000007
Appendix 6G (Regression Model 6)
Dependent Variable: IDI
Method: Least Squares
Date: 04/06/19 Time: 11:33
Sample: 1 42
Included observations: 42
Variable Coefficient Std. Error t-Statistic Prob.
C 3.161865 0.974638 3.244145 0.0025
SCI 2.203874 1.515124 1.454584 0.1544
DV -0.281453 0.434506 -0.647755 0.5213
EF -1.073577 0.441284 -2.432846 0.0201
COC -0.042049 0.229246 -0.183425 0.8555
GE 0.606165 0.310063 1.954973 0.0584
R-squared 0.581096 Mean dependent var 4.042857
Adjusted R-squared 0.522915 S.D. dependent var 0.917665

80
S.E. of regression 0.633844 Akaike info criterion 2.057535
Sum squared resid 14.46328 Schwarz criterion 2.305773
Log likelihood -37.20823 Hannan-Quinn criter. 2.148524
F-statistic 9.987701 Durbin-Watson stat 1.971700
Prob(F-statistic) 0.000005
Appendix 6G (Regression Model 7)
Dependent Variable: IDI
Method: Least Squares
Date: 04/06/19 Time: 11:36
Sample: 1 42
Included observations: 42
Variable Coefficient Std. Error t-Statistic Prob.
C 3.099687 0.945773 3.277411 0.0023
SCI 2.258057 1.484013 1.521588 0.1368
DV -0.225212 0.439140 -0.512848 0.6112
EF -1.050268 0.436186 -2.407843 0.0213
GE 0.440901 0.414431 1.063870 0.2945
ROL 0.136029 0.363462 0.374261 0.7104
R-squared 0.582329 Mean dependent var 4.042857
Adjusted R-squared 0.524320 S.D. dependent var 0.917665
S.E. of regression 0.632910 Akaike info criterion 2.054585
Sum squared resid 14.42069 Schwarz criterion 2.302824
Log likelihood -37.14629 Hannan-Quinn criter. 2.145575
F-statistic 10.03847 Durbin-Watson stat 2.034654
Prob(F-statistic) 0.000004
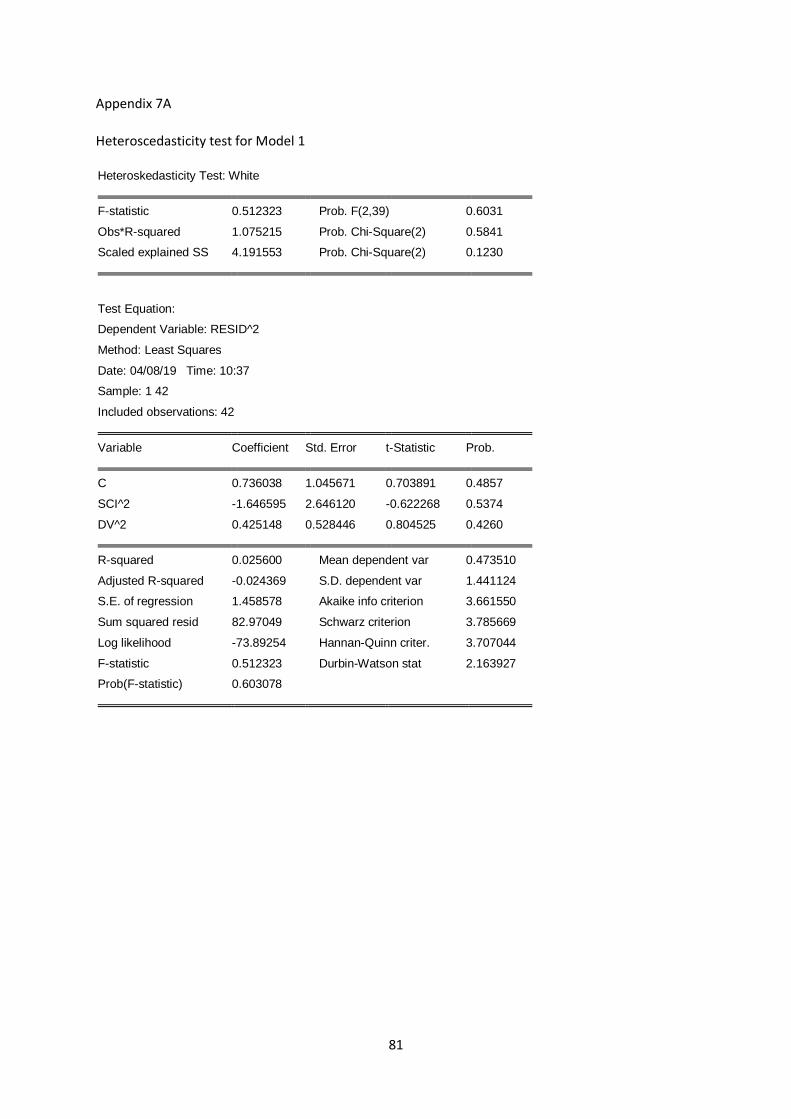
81
Appendix 7A
Heteroscedasticity test for Model 1
Heteroskedasticity Test: White
F-statistic 0.512323 Prob. F(2,39) 0.6031
Obs*R-squared 1.075215 Prob. Chi-Square(2) 0.5841
Scaled explained SS 4.191553 Prob. Chi-Square(2) 0.1230
Test Equation:
Dependent Variable: RESID^2
Method: Least Squares
Date: 04/08/19 Time: 10:37
Sample: 1 42
Included observations: 42
Variable Coefficient Std. Error t-Statistic Prob.
C 0.736038 1.045671 0.703891 0.4857
SCI^2 -1.646595 2.646120 -0.622268 0.5374
DV^2 0.425148 0.528446 0.804525 0.4260
R-squared 0.025600 Mean dependent var 0.473510
Adjusted R-squared -0.024369 S.D. dependent var 1.441124
S.E. of regression 1.458578 Akaike info criterion 3.661550
Sum squared resid 82.97049 Schwarz criterion 3.785669
Log likelihood -73.89254 Hannan-Quinn criter. 3.707044
F-statistic 0.512323 Durbin-Watson stat 2.163927
Prob(F-statistic) 0.603078

82
Appendix 7B
Heteroscedasticity test Model 2
Heteroskedasticity Test: White
F-statistic 0.420438 Prob. F(3,38) 0.7394
Obs*R-squared 1.349297 Prob. Chi-Square(3) 0.7175
Scaled explained SS 5.027206 Prob. Chi-Square(3) 0.1698
Test Equation:
Dependent Variable: RESID^2
Method: Least Squares
Date: 04/08/19 Time: 10:44
Sample: 1 42
Included observations: 42
Variable Coefficient Std. Error t-Statistic Prob.
C 0.537623 0.907277 0.592568 0.5570
SCI^2 -1.326520 2.273040 -0.583588 0.5629
DV^2 0.331965 0.472485 0.702595 0.4866
EF^2 0.402926 0.960583 0.419460 0.6772
R-squared 0.032126 Mean dependent var 0.401071
Adjusted R-squared -0.044285 S.D. dependent var 1.224740
S.E. of regression 1.251565 Akaike info criterion 3.377059
Sum squared resid 59.52372 Schwarz criterion 3.542551
Log likelihood -66.91823 Hannan-Quinn criter. 3.437718
F-statistic 0.420438 Durbin-Watson stat 2.160552
Prob(F-statistic) 0.739383

83
Appendix 7C
Heteroscedasticity tests for Model 3
Heteroskedasticity Test: White
F-statistic 0.420438 Prob. F(3,38) 0.7394
Obs*R-squared 1.349297 Prob. Chi-Square(3) 0.7175
Scaled explained SS 5.027206 Prob. Chi-Square(3) 0.1698
Test Equation:
Dependent Variable: RESID^2
Method: Least Squares
Date: 04/08/19 Time: 10:44
Sample: 1 42
Included observations: 42
Variable Coefficient Std. Error t-Statistic Prob.
C 0.537623 0.907277 0.592568 0.5570
SCI^2 -1.326520 2.273040 -0.583588 0.5629
DV^2 0.331965 0.472485 0.702595 0.4866
EF^2 0.402926 0.960583 0.419460 0.6772
R-squared 0.032126 Mean dependent var 0.401071
Adjusted R-squared -0.044285 S.D. dependent var 1.224740
S.E. of regression 1.251565 Akaike info criterion 3.377059
Sum squared resid 59.52372 Schwarz criterion 3.542551
Log likelihood -66.91823 Hannan-Quinn criter. 3.437718
F-statistic 0.420438 Durbin-Watson stat 2.160552
Prob(F-statistic) 0.739383

84
Appendix 7D
Heteroscedastidity test for Model 4
Heteroskedasticity Test: White
F-statistic 0.267363 Prob. F(3,38) 0.8485
Obs*R-squared 0.868194 Prob. Chi-Square(3) 0.8331
Scaled explained SS 2.544313 Prob. Chi-Square(3) 0.4673
Test Equation:
Dependent Variable: RESID^2
Method: Least Squares
Date: 04/08/19 Time: 11:22
Sample: 1 42
Included observations: 42
Variable Coefficient Std. Error t-Statistic Prob.
C 0.547080 0.893810 0.612076 0.5441
SCI^2 -0.777639 2.340228 -0.332292 0.7415
EF*DV^2 0.598023 0.950634 0.629078 0.5331
CD^2 -0.022117 2.020994 -0.010944 0.9913
R-squared 0.020671 Mean dependent var 0.462008
Adjusted R-squared -0.056644 S.D. dependent var 1.251239
S.E. of regression 1.286188 Akaike info criterion 3.431636
Sum squared resid 62.86265 Schwarz criterion 3.597128
Log likelihood -68.06435 Hannan-Quinn criter. 3.492295
F-statistic 0.267363 Durbin-Watson stat 2.114608
Prob(F-statistic) 0.848497

85
Appendix 7E
Heteroscedasticity test for Model 5
Heteroskedasticity Test: White
F-statistic 0.314721 Prob. F(4,37) 0.8663
Obs*R-squared 1.381982 Prob. Chi-Square(4) 0.8473
Scaled explained SS 5.110769 Prob. Chi-Square(4) 0.2761
Test Equation:
Dependent Variable: RESID^2
Method: Least Squares
Date: 04/08/19 Time: 11:11
Sample: 1 42
Included observations: 42
Variable Coefficient Std. Error t-Statistic Prob.
C 0.427980 1.028047 0.416304 0.6796
SCI^2 -1.177292 2.266947 -0.519329 0.6066
DV^2 0.359866 0.695746 0.517237 0.6081
EF^2 0.424874 0.950745 0.446885 0.6576
COC^2 0.011242 0.238104 0.047216 0.9626
R-squared 0.032904 Mean dependent var 0.380923
Adjusted R-squared -0.071647 S.D. dependent var 1.190212
S.E. of regression 1.232112 Akaike info criterion 3.366680
Sum squared resid 56.16968 Schwarz criterion 3.573545
Log likelihood -65.70027 Hannan-Quinn criter. 3.442504
F-statistic 0.314721 Durbin-Watson stat 2.137881
Prob(F-statistic) 0.866299

86
Appendix 7F
Heteroscedasticity test for Model 6
Heteroskedasticity Test: White
F-statistic 0.270013 Prob. F(5,36) 0.9265
Obs*R-squared 1.518143 Prob. Chi-Square(5) 0.9110
Scaled explained SS 6.706821 Prob. Chi-Square(5) 0.2434
Test Equation:
Dependent Variable: RESID^2
Method: Least Squares
Date: 04/08/19 Time: 11:17
Sample: 1 42
Included observations: 42
Variable Coefficient Std. Error t-Statistic Prob.
C 0.831728 1.271503 0.654130 0.5172
SCI^2 -1.276299 2.333939 -0.546843 0.5879
DV^2 -0.076858 1.025818 -0.074923 0.9407
EF^2 0.534602 0.979044 0.546045 0.5884
COC^2 0.118474 0.412450 0.287245 0.7756
GE^2 -0.267868 0.677523 -0.395364 0.6949
R-squared 0.036146 Mean dependent var 0.344364
Adjusted R-squared -0.097722 S.D. dependent var 1.208687
S.E. of regression 1.266369 Akaike info criterion 3.441748
Sum squared resid 57.73284 Schwarz criterion 3.689986
Log likelihood -66.27671 Hannan-Quinn criter. 3.532737
F-statistic 0.270013 Durbin-Watson stat 2.113781
Prob(F-statistic) 0.926536
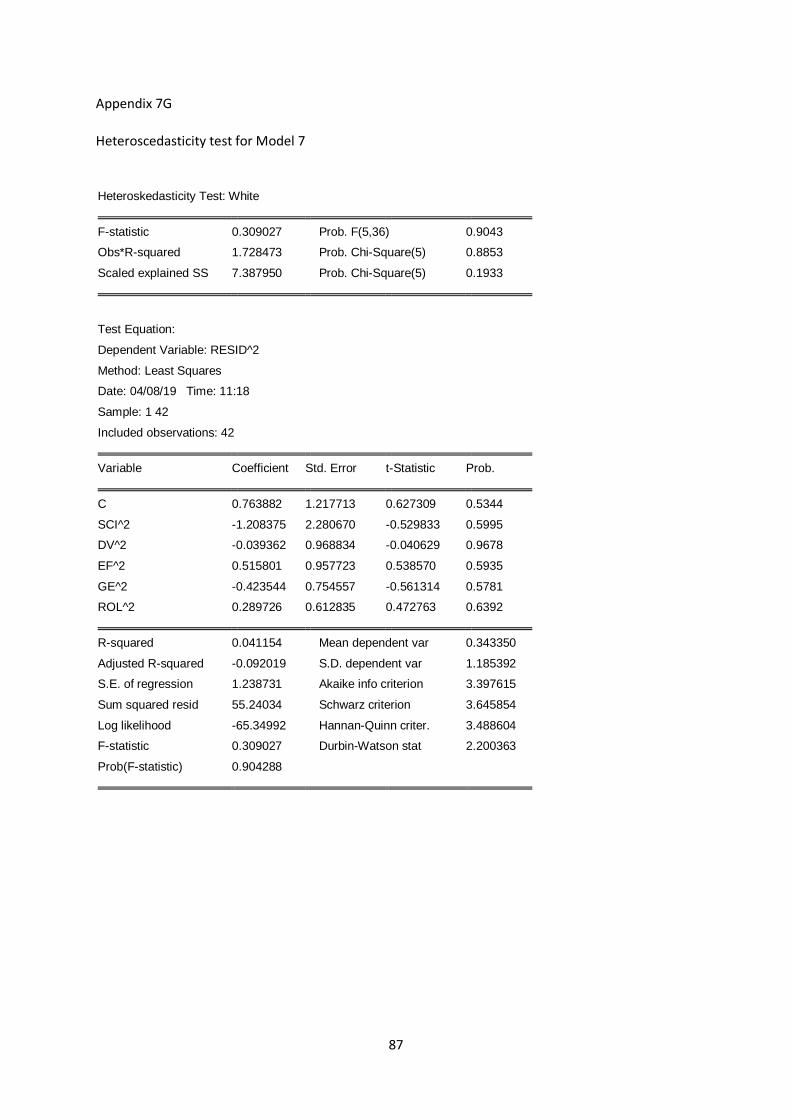
87
Appendix 7G
Heteroscedasticity test for Model 7
Heteroskedasticity Test: White
F-statistic 0.309027 Prob. F(5,36) 0.9043
Obs*R-squared 1.728473 Prob. Chi-Square(5) 0.8853
Scaled explained SS 7.387950 Prob. Chi-Square(5) 0.1933
Test Equation:
Dependent Variable: RESID^2
Method: Least Squares
Date: 04/08/19 Time: 11:18
Sample: 1 42
Included observations: 42
Variable Coefficient Std. Error t-Statistic Prob.
C 0.763882 1.217713 0.627309 0.5344
SCI^2 -1.208375 2.280670 -0.529833 0.5995
DV^2 -0.039362 0.968834 -0.040629 0.9678
EF^2 0.515801 0.957723 0.538570 0.5935
GE^2 -0.423544 0.754557 -0.561314 0.5781
ROL^2 0.289726 0.612835 0.472763 0.6392
R-squared 0.041154 Mean dependent var 0.343350
Adjusted R-squared -0.092019 S.D. dependent var 1.185392
S.E. of regression 1.238731 Akaike info criterion 3.397615
Sum squared resid 55.24034 Schwarz criterion 3.645854
Log likelihood -65.34992 Hannan-Quinn criter. 3.488604
F-statistic 0.309027 Durbin-Watson stat 2.200363
Prob(F-statistic) 0.904288

88
Appendix 8A
RAMSEY RESET test for Model 1
Ramsey RESET Test
Equation: UNTITLED
Specification: IDI C SCI DV
Omitted Variables: Squares of fitted values
Value df Probability
t-statistic 0.250293 38 0.8037
F-statistic 0.062647 (1, 38) 0.8037
Likelihood ratio 0.069184 1 0.7925
F-test summary:
Sum of Sq. df
Mean
Squares
Test SSR 0.032732 1 0.032732
Restricted SSR 19.88742 39 0.509934
Unrestricted SSR 19.85469 38 0.522492
LR test summary:
Value
Restricted LogL -43.89620
Unrestricted LogL -43.86160
Unrestricted Test Equation:
Dependent Variable: IDI
Method: Least Squares
Date: 04/09/19 Time: 10:31
Sample: 1 42
Included observations: 42
Variable Coefficient Std. Error t-Statistic Prob.
C 1.473295 7.682550 0.191772 0.8489
SCI -0.839758 14.67607 -0.057220 0.9547
DV 0.526200 7.363490 0.071461 0.9434
FITTED^2 0.159748 0.638242 0.250293 0.8037
R-squared 0.424943 Mean dependent var 4.042857
Adjusted R-squared 0.379543 S.D. dependent var 0.917665
S.E. of regression 0.722836 Akaike info criterion 2.279124
Sum squared resid 19.85469 Schwarz criterion 2.444616
Log likelihood -43.86160 Hannan-Quinn criter. 2.339783
F-statistic 9.360123 Durbin-Watson stat 1.606970

89
Prob(F-statistic) 0.000092

90
Appendix 8B
RAMSEY RESET test for Model 2
Ramsey RESET Test
Equation: UNTITLED
Specification: IDI C SCI DV EF
Omitted Variables: Squares of fitted values
Value df Probability
t-statistic 0.345184 37 0.7319
F-statistic 0.119152 (1, 37) 0.7319
Likelihood ratio 0.135036 1 0.7133
F-test summary:
Sum of Sq. df
Mean
Squares
Test SSR 0.054072 1 0.054072
Restricted SSR 16.84497 38 0.443289
Unrestricted SSR 16.79089 37 0.453808
LR test summary:
Value
Restricted LogL -40.40944
Unrestricted LogL -40.34193
Unrestricted Test Equation:
Dependent Variable: IDI
Method: Least Squares
Date: 04/09/19 Time: 10:33
Sample: 1 42
Included observations: 42
Variable Coefficient Std. Error t-Statistic Prob.
C 5.528025 5.207491 1.061553 0.2953
SCI 5.391854 7.982246 0.675481 0.5036
DV -2.320461 3.486805 -0.665498 0.5099
EF -2.313946 3.286940 -0.703982 0.4859
FITTED^2 -0.120440 0.348915 -0.345184 0.7319
R-squared 0.513680 Mean dependent var 4.042857
Adjusted R-squared 0.461105 S.D. dependent var 0.917665
S.E. of regression 0.673653 Akaike info criterion 2.159139
Sum squared resid 16.79089 Schwarz criterion 2.366005
Log likelihood -40.34193 Hannan-Quinn criter. 2.234964

91
F-statistic 9.770413 Durbin-Watson stat 1.820528
Prob(F-statistic) 0.000017
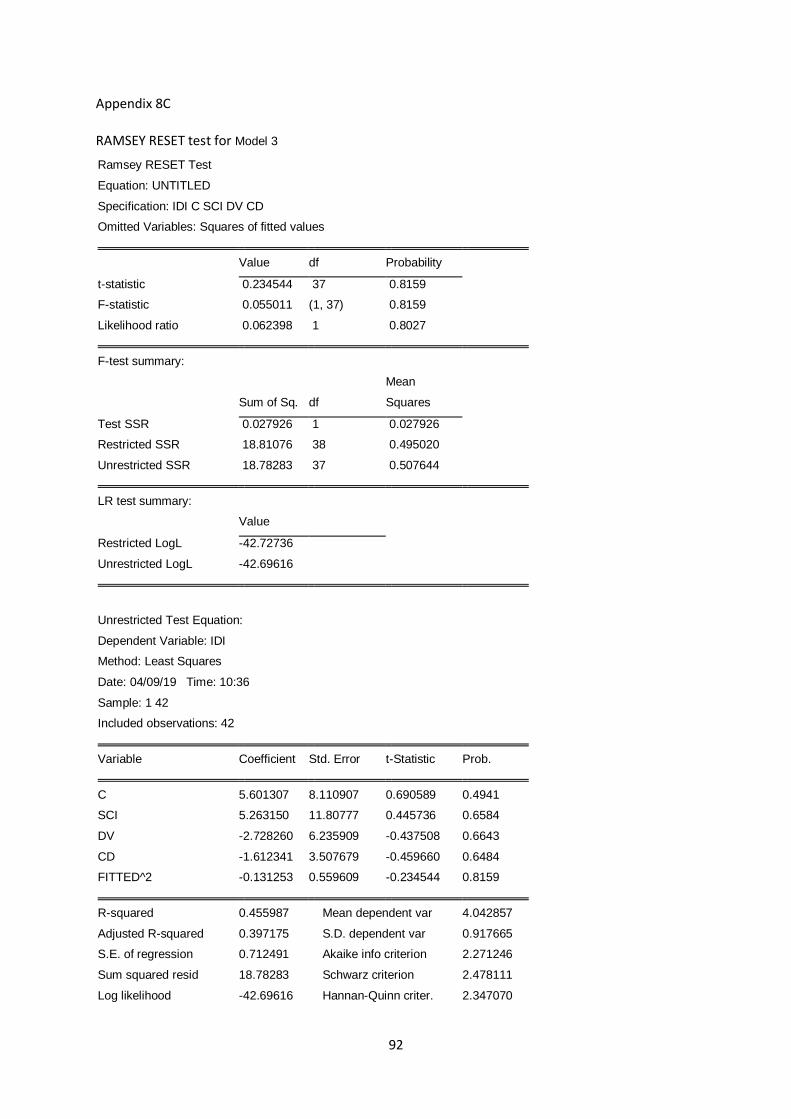
92
Appendix 8C
RAMSEY RESET test for Model 3
Ramsey RESET Test
Equation: UNTITLED
Specification: IDI C SCI DV CD
Omitted Variables: Squares of fitted values
Value df Probability
t-statistic 0.234544 37 0.8159
F-statistic 0.055011 (1, 37) 0.8159
Likelihood ratio 0.062398 1 0.8027
F-test summary:
Sum of Sq. df
Mean
Squares
Test SSR 0.027926 1 0.027926
Restricted SSR 18.81076 38 0.495020
Unrestricted SSR 18.78283 37 0.507644
LR test summary:
Value
Restricted LogL -42.72736
Unrestricted LogL -42.69616
Unrestricted Test Equation:
Dependent Variable: IDI
Method: Least Squares
Date: 04/09/19 Time: 10:36
Sample: 1 42
Included observations: 42
Variable Coefficient Std. Error t-Statistic Prob.
C 5.601307 8.110907 0.690589 0.4941
SCI 5.263150 11.80777 0.445736 0.6584
DV -2.728260 6.235909 -0.437508 0.6643
CD -1.612341 3.507679 -0.459660 0.6484
FITTED^2 -0.131253 0.559609 -0.234544 0.8159
R-squared 0.455987 Mean dependent var 4.042857
Adjusted R-squared 0.397175 S.D. dependent var 0.917665
S.E. of regression 0.712491 Akaike info criterion 2.271246
Sum squared resid 18.78283 Schwarz criterion 2.478111
Log likelihood -42.69616 Hannan-Quinn criter. 2.347070

93
F-statistic 7.753280 Durbin-Watson stat 1.702074
Prob(F-statistic) 0.000121
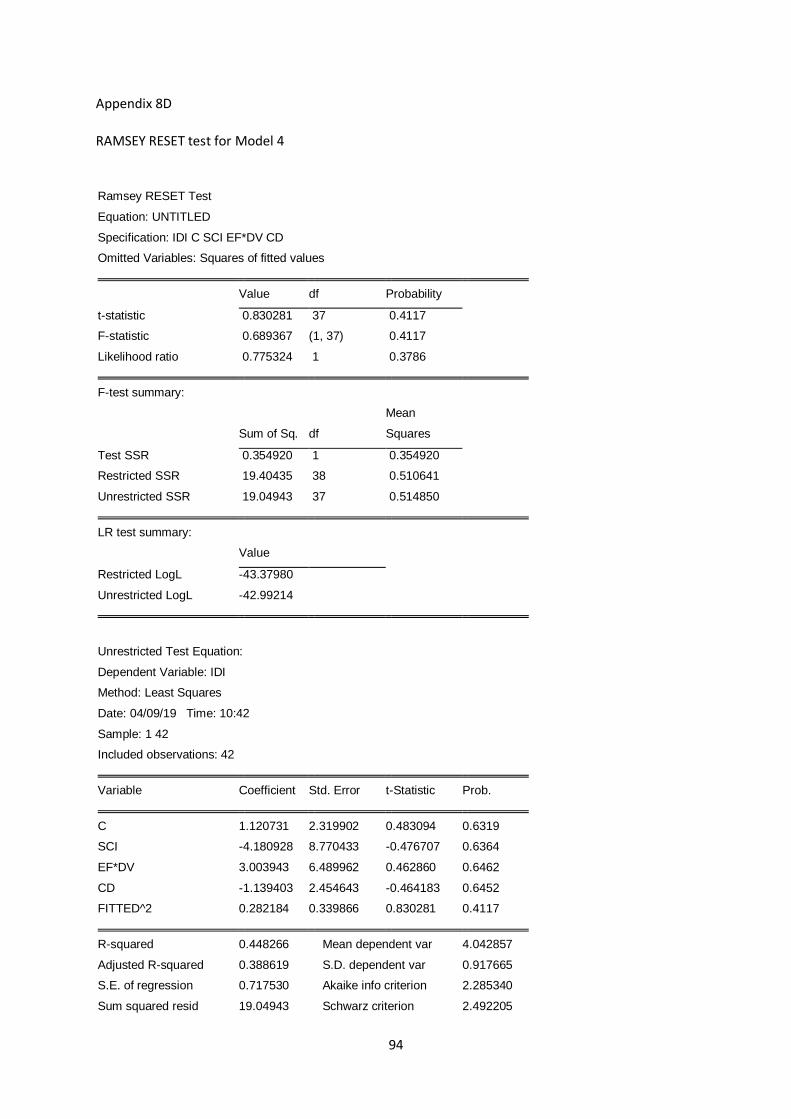
94
Appendix 8D
RAMSEY RESET test for Model 4
Ramsey RESET Test
Equation: UNTITLED
Specification: IDI C SCI EF*DV CD
Omitted Variables: Squares of fitted values
Value df Probability
t-statistic 0.830281 37 0.4117
F-statistic 0.689367 (1, 37) 0.4117
Likelihood ratio 0.775324 1 0.3786
F-test summary:
Sum of Sq. df
Mean
Squares
Test SSR 0.354920 1 0.354920
Restricted SSR 19.40435 38 0.510641
Unrestricted SSR 19.04943 37 0.514850
LR test summary:
Value
Restricted LogL -43.37980
Unrestricted LogL -42.99214
Unrestricted Test Equation:
Dependent Variable: IDI
Method: Least Squares
Date: 04/09/19 Time: 10:42
Sample: 1 42
Included observations: 42
Variable Coefficient Std. Error t-Statistic Prob.
C 1.120731 2.319902 0.483094 0.6319
SCI -4.180928 8.770433 -0.476707 0.6364
EF*DV 3.003943 6.489962 0.462860 0.6462
CD -1.139403 2.454643 -0.464183 0.6452
FITTED^2 0.282184 0.339866 0.830281 0.4117
R-squared 0.448266 Mean dependent var 4.042857
Adjusted R-squared 0.388619 S.D. dependent var 0.917665
S.E. of regression 0.717530 Akaike info criterion 2.285340
Sum squared resid 19.04943 Schwarz criterion 2.492205

95
Log likelihood -42.99214 Hannan-Quinn criter. 2.361164
F-statistic 7.515314 Durbin-Watson stat 1.857296
Prob(F-statistic) 0.000155

96
Appendix 8E
RAMSEY RESET test for Model 5
Ramsey RESET Test
Equation: EQ05
Specification: IDI C SCI DV EF COC
Omitted Variables: Squares of fitted values
Value df Probability
t-statistic 0.702461 36 0.4869
F-statistic 0.493452 (1, 36) 0.4869
Likelihood ratio 0.571784 1 0.4496
F-test summary:
Sum of Sq. df
Mean
Squares
Test SSR 0.216330 1 0.216330
Restricted SSR 15.99876 37 0.432399
Unrestricted SSR 15.78243 36 0.438401
LR test summary:
Value
Restricted LogL -39.32710
Unrestricted LogL -39.04120
Unrestricted Test Equation:
Dependent Variable: IDI
Method: Least Squares
Date: 04/09/19 Time: 10:44
Sample: 1 42
Included observations: 42
Variable Coefficient Std. Error t-Statistic Prob.
C 5.286541 3.069881 1.722067 0.0936
SCI 7.974437 7.465026 1.068240 0.2925
DV -1.997960 1.900341 -1.051369 0.3001
EF -2.798974 2.511991 -1.114245 0.2726
COC 0.707013 0.673318 1.050044 0.3007
FITTED^2 -0.207962 0.296048 -0.702461 0.4869
R-squared 0.542889 Mean dependent var 4.042857
Adjusted R-squared 0.479401 S.D. dependent var 0.917665
S.E. of regression 0.662119 Akaike info criterion 2.144819
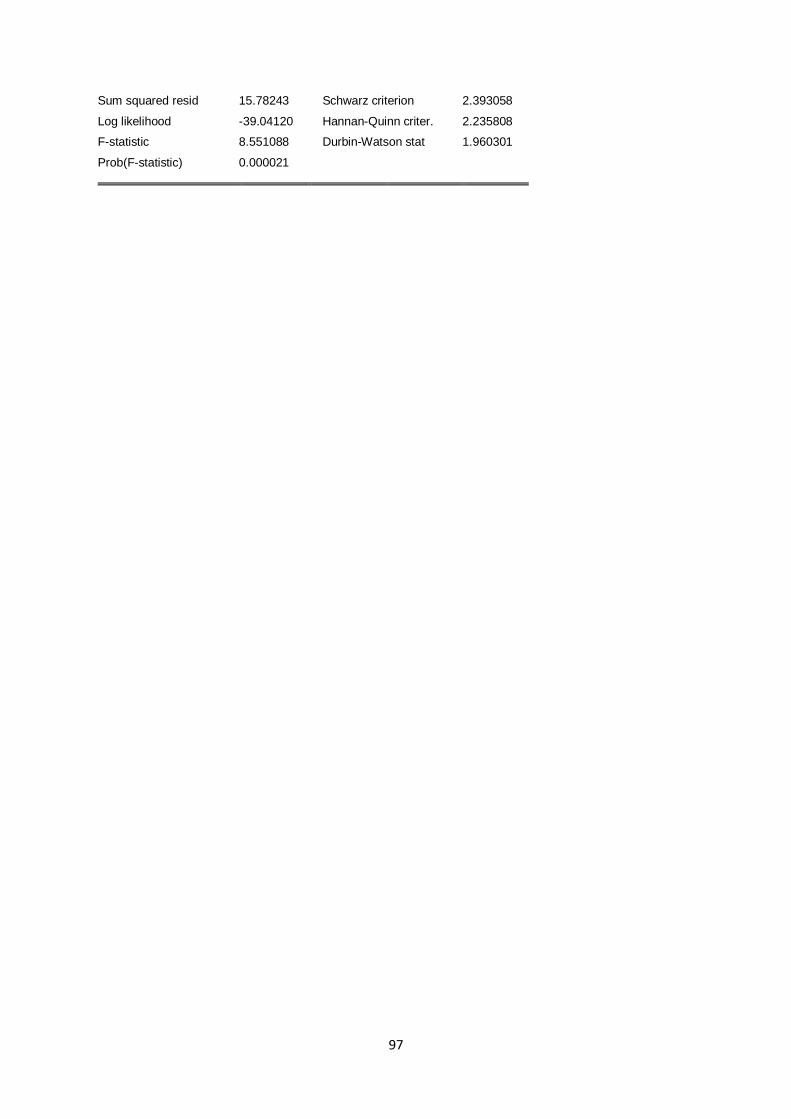
97
Sum squared resid 15.78243 Schwarz criterion 2.393058
Log likelihood -39.04120 Hannan-Quinn criter. 2.235808
F-statistic 8.551088 Durbin-Watson stat 1.960301
Prob(F-statistic) 0.000021
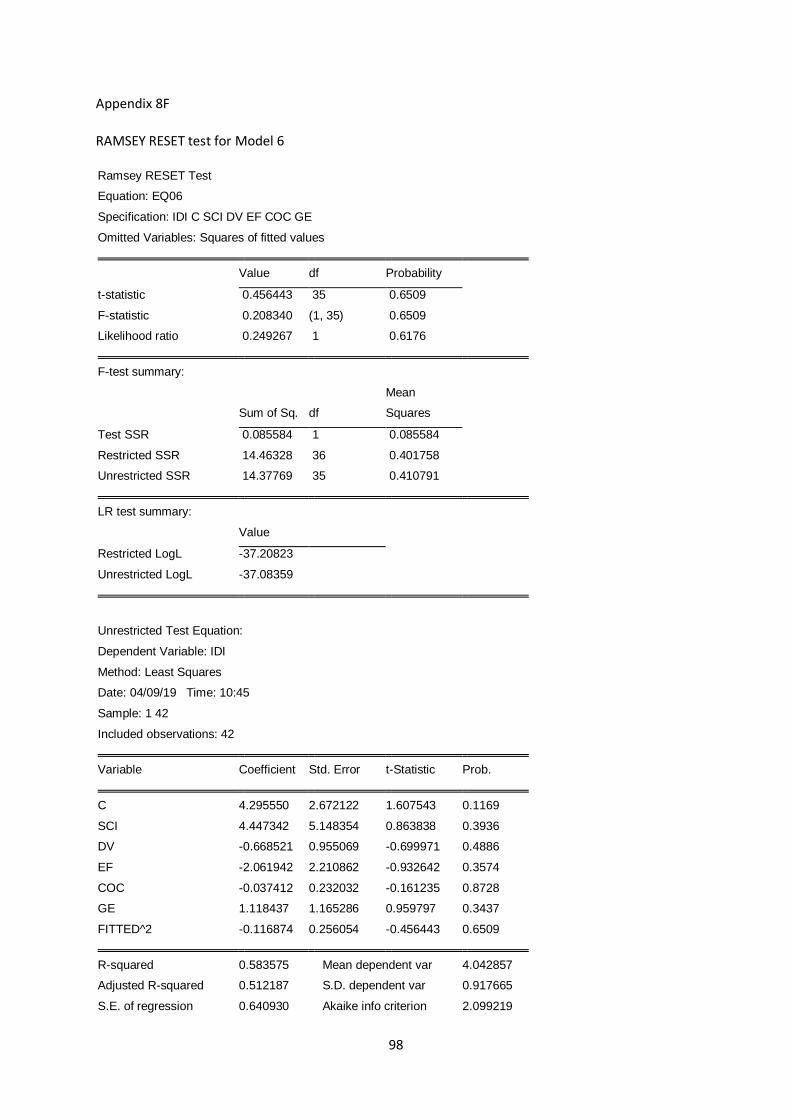
98
Appendix 8F
RAMSEY RESET test for Model 6
Ramsey RESET Test
Equation: EQ06
Specification: IDI C SCI DV EF COC GE
Omitted Variables: Squares of fitted values
Value df Probability
t-statistic 0.456443 35 0.6509
F-statistic 0.208340 (1, 35) 0.6509
Likelihood ratio 0.249267 1 0.6176
F-test summary:
Sum of Sq. df
Mean
Squares
Test SSR 0.085584 1 0.085584
Restricted SSR 14.46328 36 0.401758
Unrestricted SSR 14.37769 35 0.410791
LR test summary:
Value
Restricted LogL -37.20823
Unrestricted LogL -37.08359
Unrestricted Test Equation:
Dependent Variable: IDI
Method: Least Squares
Date: 04/09/19 Time: 10:45
Sample: 1 42
Included observations: 42
Variable Coefficient Std. Error t-Statistic Prob.
C 4.295550 2.672122 1.607543 0.1169
SCI 4.447342 5.148354 0.863838 0.3936
DV -0.668521 0.955069 -0.699971 0.4886
EF -2.061942 2.210862 -0.932642 0.3574
COC -0.037412 0.232032 -0.161235 0.8728
GE 1.118437 1.165286 0.959797 0.3437
FITTED^2 -0.116874 0.256054 -0.456443 0.6509
R-squared 0.583575 Mean dependent var 4.042857
Adjusted R-squared 0.512187 S.D. dependent var 0.917665
S.E. of regression 0.640930 Akaike info criterion 2.099219

99
Sum squared resid 14.37769 Schwarz criterion 2.388830
Log likelihood -37.08359 Hannan-Quinn criter. 2.205373
F-statistic 8.174779 Durbin-Watson stat 1.981106
Prob(F-statistic) 0.000015
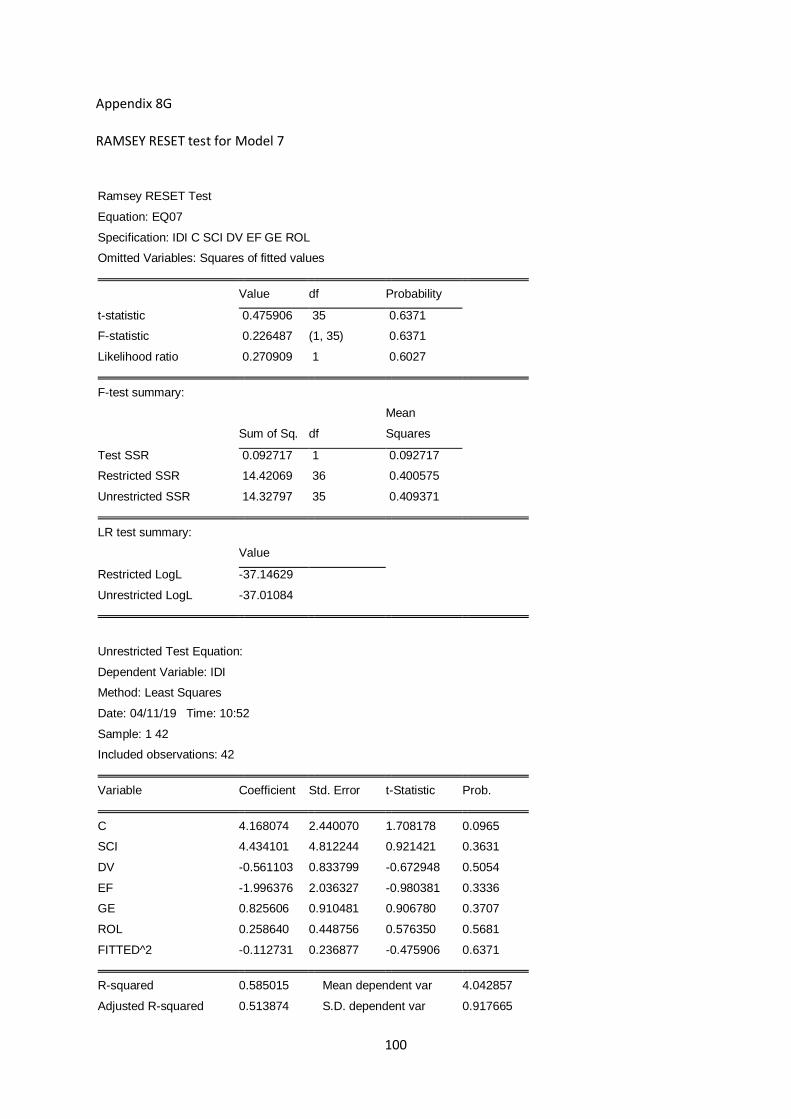
100
Appendix 8G
RAMSEY RESET test for Model 7
Ramsey RESET Test
Equation: EQ07
Specification: IDI C SCI DV EF GE ROL
Omitted Variables: Squares of fitted values
Value df Probability
t-statistic 0.475906 35 0.6371
F-statistic 0.226487 (1, 35) 0.6371
Likelihood ratio 0.270909 1 0.6027
F-test summary:
Sum of Sq. df
Mean
Squares
Test SSR 0.092717 1 0.092717
Restricted SSR 14.42069 36 0.400575
Unrestricted SSR 14.32797 35 0.409371
LR test summary:
Value
Restricted LogL -37.14629
Unrestricted LogL -37.01084
Unrestricted Test Equation:
Dependent Variable: IDI
Method: Least Squares
Date: 04/11/19 Time: 10:52
Sample: 1 42
Included observations: 42
Variable Coefficient Std. Error t-Statistic Prob.
C 4.168074 2.440070 1.708178 0.0965
SCI 4.434101 4.812244 0.921421 0.3631
DV -0.561103 0.833799 -0.672948 0.5054
EF -1.996376 2.036327 -0.980381 0.3336
GE 0.825606 0.910481 0.906780 0.3707
ROL 0.258640 0.448756 0.576350 0.5681
FITTED^2 -0.112731 0.236877 -0.475906 0.6371
R-squared 0.585015 Mean dependent var 4.042857
Adjusted R-squared 0.513874 S.D. dependent var 0.917665
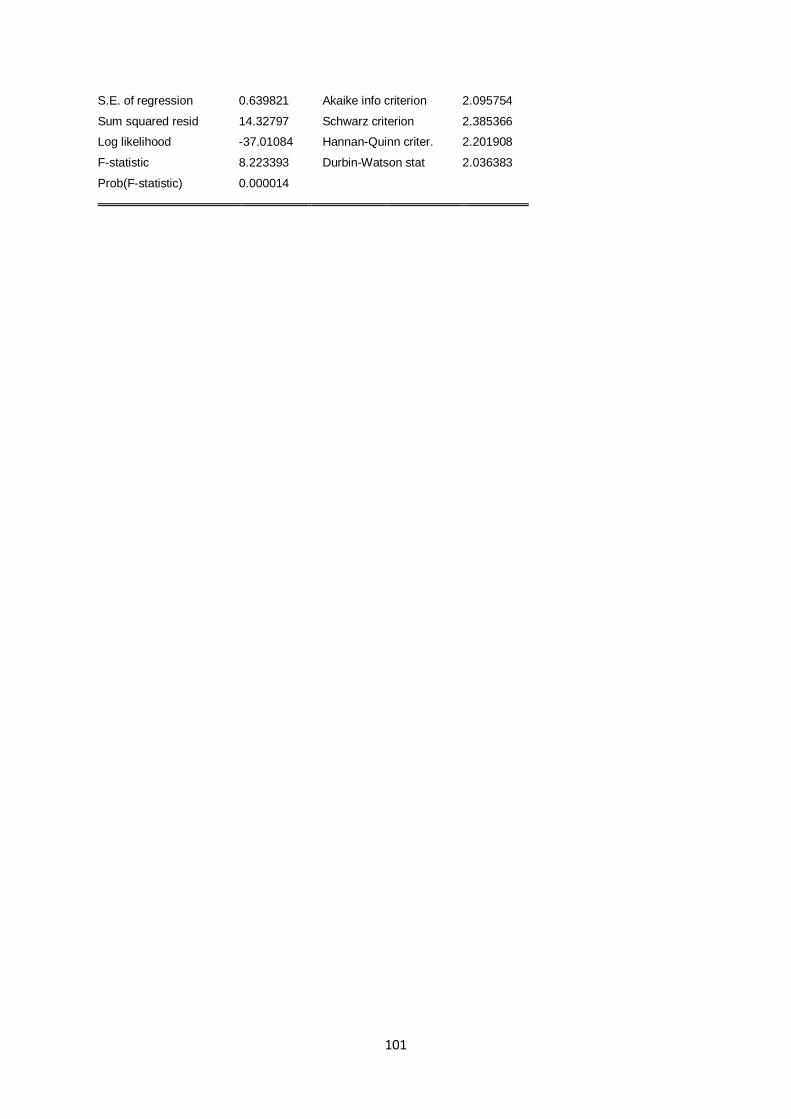
101
S.E. of regression 0.639821 Akaike info criterion 2.095754
Sum squared resid 14.32797 Schwarz criterion 2.385366
Log likelihood -37.01084 Hannan-Quinn criter. 2.201908
F-statistic 8.223393 Durbin-Watson stat 2.036383
Prob(F-statistic) 0.000014