an analysis of the impact of an advanced aero-hydro- servo
TRANSCRIPT

The University of Manchester Research
An analysis of the impact of an advanced aero-hydro-servo-elastic model of dynamics on the generator-converter dynamics, for an offshore fixed 5MW PMSG windturbine
Document VersionFinal published version
Link to publication record in Manchester Research Explorer
Citation for published version (APA):Carmona Sanchez, J., Barnes, M., Marjanovic, O., Lin, Z., Collu, M., & Cevasco, D. (2019). An analysis of theimpact of an advanced aero-hydro-servo-elastic model of dynamics on the generator-converter dynamics, for anoffshore fixed 5MW PMSG wind turbine. 1-6. Paper presented at IET AC/DC Conference, Coventry, UnitedKingdom.Citing this paperPlease note that where the full-text provided on Manchester Research Explorer is the Author Accepted Manuscriptor Proof version this may differ from the final Published version. If citing, it is advised that you check and use thepublisher's definitive version.
General rightsCopyright and moral rights for the publications made accessible in the Research Explorer are retained by theauthors and/or other copyright owners and it is a condition of accessing publications that users recognise andabide by the legal requirements associated with these rights.
Takedown policyIf you believe that this document breaches copyright please refer to the University of Manchester’s TakedownProcedures [http://man.ac.uk/04Y6Bo] or contact [email protected] providingrelevant details, so we can investigate your claim.
Download date:09. Dec. 2021

1
An analysis of the impact of an advanced aero-hydro-servo-elastic
model of dynamics on the generator-converter dynamics, for an
offshore fixed 5MW PMSG wind turbine
J Carmona-Sanchez*, Z Lin†, M Collu
†, M Barnes*, O Marjanovic*, D Cevasco
††
*School of Electrical & Electronic Engineering, University of Manchester, Manchester, UK, † Department of Naval Architecture, Ocean and Marine
Engineering, University of Strathclyde, Glasgow, UK, † †Offshore Energy Engineering Centre-REMS CDT, Cranfield University, UK.
Keywords: PMSG, Aero-Hydro-Servo-Elastic, Wind
Turbine, Direct Drive, Electromechanically Dynamics, Pitch Control, Coupled analysis
Abstract
This paper gives a comparative analysis of the performance of
a wind turbine direct drive train system with PMSG and fully
rated converters when two different wind turbine models are
used for its assessment. The impact of the advanced Aero-
Hydro-Servo-Elastic model, and the most common analytical function wind turbine model, on the generator-converter
dynamics are assessed. Results corresponding to the system
response to steps up/down in wind speed and turbulent wind
speed conditions are presented and discussed in the paper. It
is found that below rated speed there is no significant
difference between results obtained from both models. Above
rated wind speed there exist some differences among results.
1. Introduction
The UK wind power installed capacity is expected to rise
from 20 GW [1] to 40GW in the next few decades with an
estimated initial capital cost of £120 billion and with an
operation and maintenance (O&M) industry worth of £2
billion per year by 2025 [2]. The UK has the largest offshore
wind resource in Europe, which is estimated to be a third of
the total European offshore wind resource [3]. As of May
2018, there were 36 offshore wind energy operational power stations representing 7GW of installed capacity in the UK [4].
Many of these power stations use high voltage AC (HVAC)
technology to transmit the energy from offshore to main land.
However, many future offshore wind farms will be very far
from mainland, as an example, Dogger Bank, contemplated
for UK Round 3, is located 125-290 km from the UK shore.
Traditional AC transmission systems would be uneconomical
and practically unfeasible at this distance [5]; requiring
deployment of HVDC transmission for such projects. Fig. 1 outlines the typical hardware configuration used to interface
offshore wind power generation to AC systems by means of
VSC-HVDC transmission technology. Wind farm turbine
locations, Stage 1 in Fig. 1, are chosen according to strong
and stable wind conditions [6]. The offshore
substations/platforms are intended to be unmanned, operated
from onshore [3] and visited infrequently. Harsh weather can
make it difficult to inspect and perform maintenance on both turbines and substations [6]. Even if there are favourable
weather conditions, transport of personnel to/from offshore
substations implies high costs [6]. O&M of such substations
accounts for approximately 20-25 % of their total life-time
costs [7] compared to 10%-15% of onshore substations [6].
Therefore, the use of predictive maintenance could allow
scheduling minor repairs to prevent major work and
subsequently enhance the reliability and achieve better cost-effective O&M practices for such systems. For model driven
predictive maintenance, a simple yet realistic/accurate model
of the system’s components and coupled electromechanical
dynamics is critical given that aging and system’s failures are
strongly related to thermal cycling, vibration and electrical
stresses. Of particular interest are the wind turbine electric
generator and its corresponding AC/DC converters.
Regarding this, the wind energy industry is already very aware of best condition monitoring (CM) and O&M practices
for present systems such as:
Type 1: Fixed speed wind turbines
Type 2: Limited variable-speed wind turbines
(variable slip-resistors)
Type 3: Variable speed wind turbines with partial-
scale power converter
1 2 3 4 5 6 7
Off-shore Onshore
DC
AC
Onshore HVDC
Substation
Offshore AC
Substation
ACAC
ACDC
Offshore HVDC
Substation
ACAC
AC cable HVDC cable
From/to another terminal
Fig. 1: Offshore wind power generation interfaced to the AC systems by VSC-HVDC transmission.

2
Network VSC Side
a
b
c
Three-phase output
&n nP Q
ndci
ani
bni
cni
PMSG VSC Side Mechanical Side
a
b
cPMSG
wP
&gen genP Q
Cdc
gendci
ageni
bgeni
cgenidcv
DC Link
anv
bnv
cnv
Network Side
Wind turbine and converters control
w
Firing signals Firing signals
Collector/Offshore
substationThree-phase input
Wind
turbine
Figure 2: Variable-speed wind turbine direct-drive-train PMSG with full rated VSCs – without gearbox (Type 4)
EXTERNAL
CONDITIONS
APPLIED
LOADS
WIND
TURBINE
Wave & Current
Soil-Earth
Aero-dynamics
Wind-Inflow
Rotor dynamics
Drive Train dynamics
Power Generation
Nacelle dynamics
Tower(platform) dynamics
Soil dynamics
Control System
Hydro-dynamics
#\\
Turbulent
Wind
Waves
Current
Figure 3: Offshore wind turbine dynamics - bottom-fixed. Such dynamics are also the ones considered by the AHSE model (Adapted from [15]).
Hence, this paper focuses on the analysis of future systems to be used in 5+ years, i.e. Type 4 (outlined in Fig. 2):
Type 4: Variable speed wind turbines with full-scale
power converter with and without gearbox.
For Type 4 systems, the present leading electric generator technology is/will likely be the permanent magnet
synchronous generator (PMSG) [8] which is the one used in
this paper. One of the most comprehensive offshore wind
turbine modelling approaches is the aero-hydro-servo-elastic
(AHSE) modelling which captures a very wide range of
dynamics that accurately describe the wind turbine in the real
world. However, detailed wind turbine models, such as the
AHSE model, have been mainly used for wind turbine design purposes, generally coupling geared drive-train with a
doubly-fed induction generator (DFIG) and partially rated
back-to-back converters. Little research has focused on the
dynamics of the AHSE wind turbine model coupled via a
direct-drive-train with permanent magnet synchronous
generator (PMSG) and full rated back-to-back converters. In
fact, to the best of the authors’ knowledge there are only two
papers that considers this case [9]-[10]. Furthermore, the most common wind turbine aerodynamic model found in the
literature [11]-[12], and used for the assessment of the wind turbine and its associated electric generator and converters,
provides expression of generated mechanical power as an
analytical function of pitch angle, wind speed and turbine
speed. This analytical wind turbine model (AWTM) is
described in Subsection 2.2 of this paper. The use of a very
simplified wind turbine model, such as the AWTM, might
render misleading dynamic responses of the system to real
world disturbances. Hence, a comparative analysis and results of the Type 4 system, when the AHSE and AFWT models are
used for its assessment, are presented in Section 4 of this
paper.
2. Wind Turbine Direct Drive Train Model and
its Control
In the wind turbine direct-drive train topology shown in
Fig. 2, the wind turbine converts the kinetic energy from the
wind to mechanical energy. The mechanical energy is then
transformed to electric energy by the electric generator (i.e.
PMSG). This energy is finally converted/regulated by the
voltage source converters (VSC) to the appropriate electric
levels to be injected to the grid-collector. The next sections of the paper describe the model of each component used for the
assessment of such system.

3
l
A
wv
w
kP
wPw
Wind turbine side viewWind turbine front view
gJ
wJ
wgk
wgd
w
wT
gm
eT
wP
Wind turbine
Electric
generator
(PMSG)
Figure 4: Wind turbine elements-components considered in the AFWT model (left) and two-mass mechanical drive train model (right).
2.1 Wind Turbine Modelling
2.1.1. Aero-Hydro-Servo-Elastic (AHSE) Wind Turbine
Model
For accurate assessment of offshore wind turbines (OWTs)
performance, consideration of the stochastic nature of the
aerodynamic and hydrodynamic loads acting on the wind
turbine is paramount. Modelling of the mechanical aspects of
OWTs encompasses consideration of aero, hydro and
structure dynamics [13] as well as the non-linear dynamics of
the main mechanical components, such as blades, hub, low and high speed shafts, gearbox, etc., as exemplified in Fig. 3.
Within the present work, the dynamics of these stochastic
loads and of the wind turbine mechanical components are
modelled using a state-of-the-art AHSE model of dynamics
by FAST-NREL [14]. Figure 3 shows an overview of the
modules and capabilities of this AHSE model, and detailed
information can be found in [15]. For the purpose of this
paper, the AHSE model of FAST is coupled, through the shaft, whit the direct-drive-train PMSG with full rated VSCs
(type 4) already introduced in Fig. 2.
2.1.2. Analytical Function Wind Turbine (AFWT) Model
In the most common and widely used wind turbine model
found in the literature, the non-linear dynamics of the wind
turbine are substantially simplified down to an analytical
function of blade pitch angle ( in degrees), wind speed
( wv in m/s) and turbine angular speed ( w in rad/s) as given
by (1)-(5) [11]-[12]. In (1), kP is the total kinetic power, in
watts, available from the wind entering the wind turbine rotor
as shown in Fig. 4. A is the turbine swept area in 2m . is
the air density in 3kg/m . The actual captured power, i.e. shaft
power wP , from the wind is obtained by considering the
power conversion coefficient PC as given by (2), where l is
the turbine radius in meters. The analytical expression for PC
is as given by (3), where is the tip speed ratio as given by
(5). The mechanical torque corresponding to the captured
power at a given wv and w is defined by (6).
312k wP Av (1)
2 312w w PP l v C (2)
21
1160.5176 0.4 5 0.0068i
iPC e
(3)
3
1 1 0.035
0.008 1i
(4)
w
w
l
v
(5)
2 312 w
w w PT l v C
(6)
wgww w wg wg wg
ddJ T k d
dt dt
(7)
gm wg
g wg wg wg e
d dJ k d T
dt dt
(8)
wg
w gm
d
dt
(9)
To account for the inertia of the wind turbine wJ , electric
generator rotor inertia gJ and the mechanical drive train
dynamics, the torque given by (6) is usually coupled to single
or two-mass models. In this paper, a two-mass model (as
outlined in Fig. 4), which completes the AFWT model, is
implemented as given by (7)-(9), where wgk and wgd
represent the stiffness and damping of the shaft and gm is
the electric generator mechanical angular speed [12][16].
2.2 PMSG, Generator-Side-VSC and Control System
Modelling
The PMSG electric dynamics are modelled by the well-
known qd model given by (10)-(11), where qL and dL are
the generator stator q and d axes inductances respectively and
R represents the stator resistance.
dd d d ge q q
diL v Ri L i
dt (10)
q
q q q ge d d ge m
diL v Ri L i
dt (11)
ge p gmp (12)
32e p m q d q d qT p i L L i i
(13)
The relationship between generator mechanical and electrical
( ge ) angular speed is given by (12), where pp represents
4
qv
dv
1
1
*qv
*dv
VSC effect on
synthesized voltage
*qi
*di
*eT
32 pp
ND
N
D
m
2
optK
Torque
Control
1w
Current
Vector-
Control
*dcv
qe
de
n ndvnqv
*qe
*de
*
ndi
*
nqi
nqi
ndi
PMSG
Electric
Dynamics
qi
di
Wind
turbine
model
(AHSE or
AFWT)
eT
gm
Pitch Control
*w
w
w
wv
1
1
VSC effect on
synthesized voltage
Current
Vector-
Control
Network
Side
Dynamics
DC Link
Dynamics
DC
Voltage
Control dcvX
32
ndi nP
X
gm_g shaftP
Point of Common Coupling Dynamics
(Determined by the offshore substation/collector)
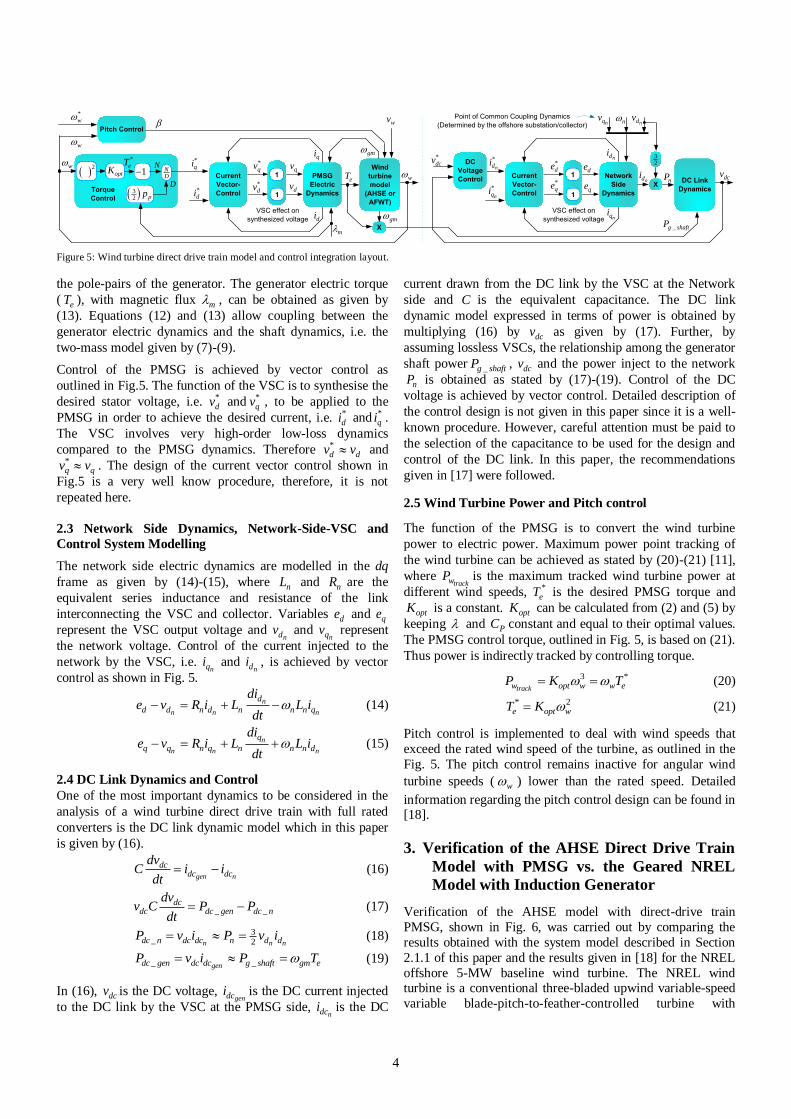
Figure 5: Wind turbine direct drive train model and control integration layout.
the pole-pairs of the generator. The generator electric torque
( eT ), with magnetic flux m , can be obtained as given by
(13). Equations (12) and (13) allow coupling between the
generator electric dynamics and the shaft dynamics, i.e. the
two-mass model given by (7)-(9).
Control of the PMSG is achieved by vector control as
outlined in Fig.5. The function of the VSC is to synthesise the
desired stator voltage, i.e. *dv and *
qv , to be applied to the
PMSG in order to achieve the desired current, i.e. *di and *
qi .
The VSC involves very high-order low-loss dynamics
compared to the PMSG dynamics. Therefore *d dv v and
*q qv v . The design of the current vector control shown in
Fig.5 is a very well know procedure, therefore, it is not
repeated here.
2.3 Network Side Dynamics, Network-Side-VSC and
Control System Modelling
The network side electric dynamics are modelled in the dq
frame as given by (14)-(15), where nL and nR are the
equivalent series inductance and resistance of the link
interconnecting the VSC and collector. Variables de and qe
represent the VSC output voltage and ndv and
nqv represent
the network voltage. Control of the current injected to the
network by the VSC, i.e. nqi and
ndi , is achieved by vector
control as shown in Fig. 5.
n
n n n
d
d d n d n n n q
die v R i L L i
dt (14)
n
n n n
q
q q n q n n n d
die v R i L L i
dt (15)
2.4 DC Link Dynamics and Control
One of the most important dynamics to be considered in the
analysis of a wind turbine direct drive train with full rated
converters is the DC link dynamic model which in this paper
is given by (16).
gen n
dcdc dc
dvC i i
dt (16)
_ _dc
dc dc gen dc n
dvv C P P
dt (17)
3_ 2n n ndc n dc dc n d dP v i P v i (18)
_ _gendc gen dc dc g shaft gm eP v i P T (19)
In (16), dcv is the DC voltage, gendci is the DC current injected
to the DC link by the VSC at the PMSG side, ndci is the DC
current drawn from the DC link by the VSC at the Network
side and C is the equivalent capacitance. The DC link
dynamic model expressed in terms of power is obtained by
multiplying (16) by dcv as given by (17). Further, by
assuming lossless VSCs, the relationship among the generator
shaft power _g shaftP , dcv and the power inject to the network
nP is obtained as stated by (17)-(19). Control of the DC
voltage is achieved by vector control. Detailed description of
the control design is not given in this paper since it is a well-
known procedure. However, careful attention must be paid to
the selection of the capacitance to be used for the design and
control of the DC link. In this paper, the recommendations
given in [17] were followed.
2.5 Wind Turbine Power and Pitch control
The function of the PMSG is to convert the wind turbine
power to electric power. Maximum power point tracking of
the wind turbine can be achieved as stated by (20)-(21) [11],
where trackwP is the maximum tracked wind turbine power at
different wind speeds, *eT is the desired PMSG torque and
optK is a constant. optK can be calculated from (2) and (5) by
keeping and PC constant and equal to their optimal values.
The PMSG control torque, outlined in Fig. 5, is based on (21).
Thus power is indirectly tracked by controlling torque.
3 *
trackw opt w w eP K T (20)
* 2e opt wT K (21)
Pitch control is implemented to deal with wind speeds that
exceed the rated wind speed of the turbine, as outlined in the
Fig. 5. The pitch control remains inactive for angular wind
turbine speeds ( w ) lower than the rated speed. Detailed
information regarding the pitch control design can be found in [18].
3. Verification of the AHSE Direct Drive Train
Model with PMSG vs. the Geared NREL
Model with Induction Generator
Verification of the AHSE model with direct-drive train
PMSG, shown in Fig. 6, was carried out by comparing the
results obtained with the system model described in Section
2.1.1 of this paper and the results given in [18] for the NREL
offshore 5-MW baseline wind turbine. The NREL wind turbine is a conventional three-bladed upwind variable-speed
variable blade-pitch-to-feather-controlled turbine with

5
Power Rotor Diameter Rated wind speed Rotor speed
5 MW 126 m 11.4 m/s 12.1 rpm
(1.267 rad/s)
Table 1: Wind turbine rated parameters
Figure 6: Results of the present AHSE wind turbine direct-drive train with
PMSG versus results of the NREL offshore 5-MW baseline wind turbine [18]
presented in page 32.
induction generator. The rated parameters are as given in
Table 1. Further details for the wind turbine can be found in
[18]. Parameters used in this paper for the PMSG were
adapted from [19]. It can be observed in Fig. 6 that there is
close match between results obtained with the present model
and those presented in [18] for torque, rotor speed and blade pitch angle under a wind speed range of 5m/s to 15m/s, steady
wind conditions.
4. Case study – Performance of the AHSE vs the
AFWT Direct-Drive Train with PMSG
The dynamic system response was assessed under three
different scenarios. First the system was subjected to a step-
down in wind speed from 11.4 m/s to 8.5 m/s with results
shown in Figs. 7a-h. As observed, the response of the system
under this condition is the same for both AHSE and AFWT
models. Since the pitch angle is kept to zero, results shown in
Figs. 8a-h suggest that the AFWT model provides an accurate
representation of the relationship among wind speed, wind turbine speed and torque/power.
The system was also tested under a step-up in wind speed
from 11.4 m/s to 12.5 m/s with comparative results shown in
Figs. 7aa-hh. As observed in Figs.7aa-hh, there exist
deviations under transient conditions between results obtained
from AHSE and AFWT models. Although, both systems
reach the same wind turbine speed, power and torque, there is
a significant difference between the pitch angle obtained from the AHSE model and that corresponding to the AFWT model.
This can be explained by the fact that when using the AFWT
model there could be an identical value of PC for the same
tip speed ratio but a different pitch angle, as explained in
[20]. The generic AFWT model could be adjusted to meet the
characteristics of a specific wind turbine, which in theory
would imply to be adjusted to match the AHSE model.
However, this is a highly time consuming task that requires
considerable effort, “even for those with a long experience of performing such approximations” [20]. Results presented in
Fig. 7 and 8, can be considered as example of the
a) Wind speed aa) Wind speed
b) Wind turbine speed bb) Wind turbine speed
c) Pitch angle cc) Pitch angle
d) Electric torque dd) Electric torque
e) PMSG q-axis current ee) PMSG q-axis current
f) PMSG-converter dc current ff) PMSG-converter dc current
g) DC voltage gg) DC voltage
h) Injected network power hh) Injected network power
Fig. 7: System response to a step up and down in wind speed. a)-h) Response
to a step down in wind speed from 11.4m/s to 8.5m/s at 30s and aa)-hh)
Response to a step up in wind speed from 11.4m/s to 12.5m/s at 30s.
discrepancies that can be found among results when
evaluating a wind turbine direct drive train system with a
typical AFWT model and those obtained with a more

6
Fig. 8: System response to turbulent wind conditions.
complete wind turbine model such as the AHSE model.
Furthermore, the system was tested under turbulent wind
conditions with comparative results presented in Fig. 8.
Differences in results can be explained by the discussion
given in the previous paragraph. As can be observed, the pitch
control attempts to keep the wind turbine speed constant at the rated value whilst maximum optimum power tracking is
attempted. However, both constraints cannot be met under
these circumstances. Of particular interest is that the DC
voltage is virtually unaffected even under these very high
transient conditions.
5. Conclusions
The AHSE model is one of the most complete wind turbine models currently available. However, it is very computational
intensive. Simpler AFWT models are less computationally
intensive. However, they might not be able to represent an
accurate relationship among the wind turbine variables under
some circumstances; especially above rated wind speed.
Furthermore, although typical AFWT models consider the
relationship among wind speed, turbine speed and pitch angle
which might be sufficient for an onshore wind turbine
representation, for an offshore wind turbine, consideration of
the hydrodynamics might be paramount.
In this work, the stochastic nature of the wind has been taken
into account. Future work will look at integrating also
stochastic wave loads (i.e. hydrodynamics) which are important dynamics to be considered in operational
conditions for floating offshore wind turbines.
Acknowledgements
This work was supported by the Engineering and Physical Sciences Research
Council (EPSRC) through grants EP/P009743/1 and EP/L021463/1. The last
author is also supported by grant EP/L016303/1. The authors would like to
acknowledge EngD student Dawn Ward for her help in the pitch control
implementation.
References
[1] RenewableUK. "Wind Energy Statistics". Accessed on 11/09/2018: https://www.
renewableuk.com/page/UKWEDhome
[2] Home Offshore. “Technology Drivers in Windfarm Asset Management”. Position
Paper, 2018.
[3] The Crown Estate. “Transmission Infrastructure Associated with Connecting
Offshore Generation”. 2013. Available at: https://www.transmissioninfrastructure-
offshoregen.co.uk/media/9384/the_crown_estate_transmission_infrastructure_print
_april.pdf
[4] Department for Business, Energy & Industrial Strategy. “Digest of UK Energy
Statistics (DUKES) 2018: main report”. National Statistics, GOV.UK, July 2018.
[5] C. Maciver and K.R.W. Bell. “Reliability Analysis of Design Options for Offshore
HVDC Networks”. Paper presented at 2014 CIGRE Session, Paris, France.
[6] Øyvind Netland. "Remote Inspection of Offshore Wind Turbines: A Study of the
Benefits, Usability and Feasibility". Doctoral Theses. Norwegian University of
Science and Technology. Faculty of Information Technology, Mathematics and
Electrical Engineering Department of Engineering Cybernetics. 2014.
[7] “Scottish Enterprise” and “The Crown State”. “A Guide to UK Offshore Wind
Operations and Maintenance”. 2013.
[8] Carroll, J., McDonald, A., Dinwoodie, I., McMillan, D., Revie, M., and Lazakis, I.
“Availability, operation and maintenance costs of offshore wind turbines with
different drive train configurations”. Wind Energ., 2017, 20: 361–378.
[9] A. Hemeida, A. A. Farag, and O. A. Mahgoub, “Modeling and control of direct
driven PMSG for ultra large wind turbines,” World Academy of Science,
Engineering and Technology, vol. 59, pp. 918–924, 2011.
[10] D. S. Ochs, R. D. Miller and W. N. White, "Simulation of Electromechanical
Interactions of Permanent-Magnet Direct-Drive Wind Turbines Using the FAST
Aeroelastic Simulator," in IEEE Transactions on Sustainable Energy, vol. 5, no. 1,
pp. 2-9, Jan. 2014.
[11] Y. Xia, K. H. Ahmed and B. W. Williams, "Wind Turbine Power Coefficient
Analysis of a New Maximum Power Point Tracking Technique," in IEEE
Transactions on Industrial Electronics, vol. 60, no. 3, pp. 1122-1132, March 2013.
[12] Ye, H., Yue, B., Li, X., and Strunz, K. “Modelling and simulation of multi-scale
transients for PMSG-based wind power systems”. Wind Energ. 2017, 20: 1349–
1364.
[13] Bing Feng Ng, Rafael Palacios & J. Michael R. Graham. “Model-based aeroelastic
analysis and blade load alleviation of offshore wind turbines”, International Journal
of Control, Vol. 90, No. 1, pages 15-36. Taylor & Francis, 2017.
[14] NWTC Information Portal (FAST v8). https://nwtc.nrel.gov/FAST8. Last modified
04-January-2018; Accessed 10-September-2018
[15] Jonkman, J.M. 2013, "The new modularization framework for the FAST wind
turbine CAE tool", 51st AIAA Aerospace Sciences Meeting including the New
Horizons Forum and Aerospace Exposition 2013.
[16] S. M. Muyeen, M. H. Ali, R. Takahashi, T. Murata, J. Tamura, Y. Tomaki, A.
Sakahara, and E. Sasano, "Comparative study on transient stability analysis of wind
turbine generator system using different drive train models," IET Renewable Power
Generation, vol. 1(2), pp. 131-141, 2007.
[17] Hansen, A. D. and Michalke, G. “Modelling and control of variable-speed multi-
pole permanent magnet synchronous generator wind turbine”. Wind Energ. 2008,
11: 537-554.
[18] J. Jonkman, S. Butterfield, W. Musial, and G. Scott. “Definition of a 5-MW
Reference Wind Turbine for Offshore System Development”. Technical Report
NREL/TP-500 38060, February 2009.
[19] J. Zhang, Z. Chen and M. Cheng, "Design and comparison of a novel stator interior
permanent magnet generator for direct-drive wind turbines," in IET Renewable
Power Generation, vol. 1, no. 4, pp. 203-210, December 2007.
[20] S. Heier. “Grid integration of wind energy onshore and offshore conversion
systems”. Third Edition, John Wiley & Sons Ltd, 2014.