an analysis of the growth, pattern and determinants of ...euacademic.org/uploadarticle/549.pdfan...
TRANSCRIPT
2093
ISSN 2286-4822
www.euacademic.org
EUROPEAN ACADEMIC RESEARCH
Vol. II, Issue 2/ May 2014
Impact Factor: 3.1 (UIF)
DRJI Value: 5.9 (B+)
An Analysis of the Growth, Pattern and
Determinants of Public Expenditure in Assam
DR. MOON MOON HUSSAIN Assistant Professor in Economics
School of Social Sciences and Humanities
B.S Abdur Rahman University, Chennai – 48
India
Abstract:
Governments in the recent years are increasingly realizing the
importance of public expenditure as a tool for achieving their
objectives, particularly in the area of poverty reduction. Most of the
state governments in India have been experiencing severe budgetary
pressures of varying magnitude, resulting in an explosive growth of
public expenditure and the case is no different for the State of Assam.
Assam is one of the largest and the most populous states in the north-
eastern region with an international boundary of 400 km and a
geographical area of over 79,000 sq km, shelters a population of 2.66
crores as per census of 2001. For the past several years, Assam has
been facing acute financial crisis caused by raising non-plan
expenditure, inadequate resource mobilization and increasing
budgetary deficits. Even after more than six decades of ‘planning and
development’, Assam, which was all-India average in terms of per-
capita SDP at the beginning of the First Plan, is now one of the most
backward states in the country judged by the indicators of
development. The objective of the present study is to provide a skeleton
on public expenditure of Assam emphasizing on the growth, pattern
and determinants of public expenditures in Assam.
Key words: Public expenditure, Public expenditure of Assam.
Moon Moon Hussain- An Analysis of the Growth, Pattern and Determinants of
Public Expenditure in Assam
EUROPEAN ACADEMIC RESEARCH - Vol. II, Issue 2 / May 2014
2094
Introduction
Governments in the recent years are increasingly realizing the
importance of public expenditure as a tool for achieving their
objectives, particularly in the area of poverty reduction. Most of
the state governments in India have been experiencing severe
budgetary pressures of varying magnitude, resulting in an
explosive growth of public expenditure and the case is no
different for the State of Assam. Assam is one of the largest
and the most populous states in the north-eastern region with
an international boundary of 400 km and a geographical area of
over 79,000 sq km, shelters a population of 2.66 crores as per
census of 2001. For the past several years, Assam has been
facing acute financial crisis caused by raising non-plan
expenditure, inadequate resource mobilization and increasing
budgetary deficits. Even after more than six decades of
‘planning and development’, Assam, which was all-India
average in terms of per-capita SDP at the beginning of the First
Plan, is now one of the most backward states in the country
judged by the indicators of development. The objective of the
present study is to provide a skeleton on public expenditure of
Assam emphasizing on the growth, pattern and determinants of
public expenditure in Assam.
Review of Literature
The available literature on growth and determinants of public
expenditure is rich and varied. A number of studies were
carried out in India and abroad to identify the determinants of
public expenditure growth. Almost all the studies in the past
employed the regression analysis approach to explain the
functional relationship between the determinant variables and
public expenditure. Whatever related literature available with
us has been put to review to examine their relevance to our
present study and also to improve upon their limitations if

Moon Moon Hussain- An Analysis of the Growth, Pattern and Determinants of
Public Expenditure in Assam
EUROPEAN ACADEMIC RESEARCH - Vol. II, Issue 2 / May 2014
2095
necessary to suit the objectives of the present study. Adolf
Wagner’s (1883) hypothesis states that owing to the “pressure
for social progress” in a welfare state, as the economy expands,
public expenditure will also tend to increase persistently.
Wagner also argued that expenditure on government
administration rises faster than the GNP due to the increasing
bureaucratization of the state. Fabricant (1952) was the first to
make an empirical study on the growth pattern and
determinants of local and state level public expenditures. In
analyzing the inter-state differentials in the level of public
expenditure in the United States, he suggested three
independent variables namely per capita income, population
density and urbanization and used a multiple regression model
to establish the functional relationship between them. With the
help of the regression model, Fabricant succeeded in explaining
that a state with high level of per capita personal income would
incur the same increase in per capita expenditure as
urbanization increases by a given amount. Peacock and
Wiseman (1961) studied the growth of public expenditure in
U.K. Their hypothesis states that public expenditure grows due
to the growth in revenue. Okafor and Eiya (2011) studied the
determinants of growth in Government Expenditure in Nigeria.
As such four variables namely inflation, public debt, tax
revenue and population were used in the study to determine
the growth in public expenditure. The results indicate that
population; public debt and tax revenue has a significant
positive relationship with total government expenditure while
inflation has a negative relationship with total government
expenditure. Some of the other important foreign studies are
Keynes (1936), Strayer (1949)Samuelson (1954), Kurnov (1963),
Sacks and Harris(1964), Fisher (1964) Kee (1965), Adam (1965),
Bahland Saunders (1965), Abizadeh and Yousefi (1968),Weicher
(1970), Booms (1971), Goffman and Mahar(1971), Sandford
(1984), Mahmood (1988), Joulfian andMukherjee (1990),
Abizadeh and Basilevsk (1990), Bosland Pandiello (1995),
Moon Moon Hussain- An Analysis of the Growth, Pattern and Determinants of
Public Expenditure in Assam
EUROPEAN ACADEMIC RESEARCH - Vol. II, Issue 2 / May 2014
2096
Ahmed, Sohail and Akhtar (2001), Mupimpela (2005),
Busemeyar,(2007), etc.
As far as studies on North eastern region of India is
concerned, the following studies were undertaken.
Bhuyan (1984) estimated the trends and fluctuation
pattern of revenue and expenditures of the government of
Assam for thirty consecutive years, i.e., from 1951-53 to 1978-
79.The methodology adopted by his study is both descriptive
and analytical and statistical techniques of time series analysis
have been used. His study asserts that the human capital
formation has increased tremendously during the period 1951-
52 to 1978-79 but the physical capital formation did not
increase the same way. According to him, out of the expenditure
on economic services, much emphasis was given on agriculture
but industry and transport remained neglected all through. His
study however concludes that no budget of the government of
Assam were policy oriented.
Nongbri (2002) studied the growth, pattern and
determinants of public expenditure for the State of Meghalaya
for a period of thirty years, viz, from 1972-73 to 2001-2002. He
had used a number of explanatory variables for this purpose.
After making an empirical analysis of the variables, Nongbri
concluded that per capita income, NSDP, Consumer price index,
the tertiary sector and the primary sector are the main
variables which determine the growth of public expenditure in
an underdeveloped State like Meghalaya. All these factors have
led to an increasing growth of public expenditure resulting in
poverty of the State.
Mishra and Suresh (2005) studied the growth and
determinants of public expenditure in north-eastern states in
general and Nagaland in particular for thirty-eight years, ie,
from 1963-64 to 2000-01. The study takes into account public
expenditure as a dependent variable whereas a combination of
both economic variables and political variables on
manufacturing sector, service sector, the sectoral incomes
Moon Moon Hussain- An Analysis of the Growth, Pattern and Determinants of
Public Expenditure in Assam
EUROPEAN ACADEMIC RESEARCH - Vol. II, Issue 2 / May 2014
2097
originating in agricultural sector and the remaining sectors are
taken as the independent variables. The result of the study
suggests that both Congress and non-congress regimes have
negative impact on the growth of non-developmental
expenditure in the state. The study further concludes that
ideological leanings of the parties in power or a change of
government from non congress to congress does not seem to
make any systematic difference to the determination of public
expenditure in the state of Nagaland.
Scope and Objectives of the Study
The study covers a period of thirty six years from 1973-74 to
2008-09. The rationale for choosing the period 1973-74 to 2008-
09 is that, it is intended to study the pattern of public
expenditure during thirty six year period. This period in the
state economy has underscored substantial changes in the
expenditure policies.
The specific objectives of the study are-
1. To examine the extent to which state income causes
public expenditure, mainly through an increase in
demand for public expenditure.
2. To explain the pattern of public expenditure growth in
the thirty year time period.
3. To find out the factors responsible for determining the
level and size of public expenditure.
Hypotheses of the study:
The study intends to test the following hypotheses:
1. There is a direct relationship between the level of public
expenditure and level of NSDP.
2. Changes in Consumer Price Index (CPI) influence the
level and quantum of public expenditure.
3. The growth of public expenditure and the quantity of
Moon Moon Hussain- An Analysis of the Growth, Pattern and Determinants of
Public Expenditure in Assam
EUROPEAN ACADEMIC RESEARCH - Vol. II, Issue 2 / May 2014
2098
public services provided bear a functional relationship.
Methodology
The study is based on secondary data. The study covers a time
period of thirty-six years, i.e., from 1973-74 to 2008-09. As such
the relevant statistical data for thirty-six year period were
collected from various government publications and annual
budgets of Assam State Government, including their
Memoranda. The major sources of secondary data include
budgetary data relating to the State Government as published
from time to time in the Assam Development Report, The
Economic Survey of Assam, Statistical Handbook of Assam,
Statistical Abstract of Assam, etc. This is an empirical study
and data were collected, tabulated, processed and analyzed by
applying appropriate statistical techniques like multivariate
linear regression analysis.
The Models
In order to find out the likely determinants of public
expenditure of Assam the following multivariate linear
regression models have used by trial and error method. So from
the results of these regressions, the main determinants will be
chosen and they will be included in a final model.
1. PE = a0 + a1 PCNSDP + a2 CPI + a3 PCTREC + a4 DOP+ t + D
2. PE = a0 + a1 PCCE + a2 TRNSDP + a3 PCUPTP + t + D
3. PE = a0 + a1 NSDP + a2PCREGS + a3PCRESS + a4 PCREES+
t + D
4. PE = a0 + a1NSDP + a2 PCREGS + a3PCRESS + a4PCREES +
a5 LR+ t + D
5. PE = a0 + a1PCNSDP + a2PCCEGS + a3PCCESS +
a4PCCEES+ a5LR. + t + D
Where
PE = Total Public Expenditure
NSDP = Net State Domestic Product

Moon Moon Hussain- An Analysis of the Growth, Pattern and Determinants of
Public Expenditure in Assam
EUROPEAN ACADEMIC RESEARCH - Vol. II, Issue 2 / May 2014
2099
CPI = Consumer Price Index
LR = Literacy rate
PCTREC = Per Capita Total Receipts
DOP = Density of Population
PCNSDP = Per Capita Net State Domestic Product
TRNSDP= Percentage of Total Receipts to NSDP
UPTP= Percentage of Urban Population to total population
PCCE= Per Capita Capital Expenditure
PCRE= Per Capita Revenue expenditure
PCREGS = Per Capita Revenue Expenditure on General Services
PCRESS =Per Capita Revenue expenditure on Social Services
PCCEEC =Per Capita Revenue Expenditure on Economic Services
PCCEGS= Per Capita Capital Expenditure on General Services
PCCESS =Per Capita Capital Expenditure Social Services
PCCEEC =Per Capita Capital Expenditure Economic Services
t = time variable
D = dummy variable.
The main thrust of the paper is to find out the major
determinants of State’s public expenditure in Assam. As such
the total public expenditure is taken as the dependent variable
while 18 other independent variables have been used based on
their theoretical relevance as well as empirical importance as
emerged out of the earlier studies conducted by various
economists both in India and abroad.
Growth of Public Expenditure in Assam
Public expenditure in a developing economy has certain notable
trends and public expenditure in Assam has shown these
trends in a marked way. Since the commencement of planning
in India, there has been rapid growth of expenditure in the
State either due to the adoption of economic planning to achieve
higher rate of economic growth or due to the inability of the
State government to mobilize resources effectively. The
government has been widening its economic and social
activities in economic and social spheres and has assumed

Moon Moon Hussain- An Analysis of the Growth, Pattern and Determinants of
Public Expenditure in Assam
EUROPEAN ACADEMIC RESEARCH - Vol. II, Issue 2 / May 2014
2100
many new responsibilities. Its administrative services have
been strengthened and it’s participating in an ever-increasing
measure. In order to have a better idea of the growth of total
expenditure in the state of Assam, an attempt has been made to
study the trends of public expenditure, per capita expenditure
and state income for the period of our study , i.e., from 1973-74
to 2008-09 at constant prices taking 2004-05 as the base year.
An attempt has been made to analyze the growth and pattern of
public expenditure in the State of Assam and the changes,
which were creeping therein during the reference period. Both
intensive and extensive expansion in the activities of the
government during the planning period has resulted in a
spectacular rise in public expenditure. In order to have a better
idea of the size of total expenditures of Assam, let us analyze its
trends and pattern for the period of from 1973-74 to 2008-09
with the help of Table No.1.
Table 1 Trends of Total Public Expenditure, NSDP and Per capita
expenditure
YEAR TOTAL EXPENDITURE
(Rs.Crore)
NSDP
(Rs.Crore)
COL 2as % of Col 3
1 2 3 4
1973-74 2.01 10.29 19.53
1974-75 2.04 10.51 19.41
1975-76 1.95 10.90 17.88
1976-77 2.19 11.54 18.97
1977-78 3.02 12.16 24.83
1978-79 3.44 12.28 28.01
1979-80 3.91 11.71 33.39
1980-81 7.54 12.07 62.46
1981-82 8.07 13.44 61.41
1982-83 4.78 14.06 33.99
1983-84 6.62 14.67 45.12
1984-85 8.10 14.74 54.95
1985-86 9.01 15.71 57.35
1986-87 10.86 15.27 71.11
1987-88 12.95 15.95 81.19
1988-89 13.36 16.07 83.13
1989-90 16.28 17.26 94.32
1990-91 33.05 64.73 51.05
1991-92 31.14 67.78 45.94
1992-93 32.25 68.02 47.41
1993-94 36.30 70.78 51.28
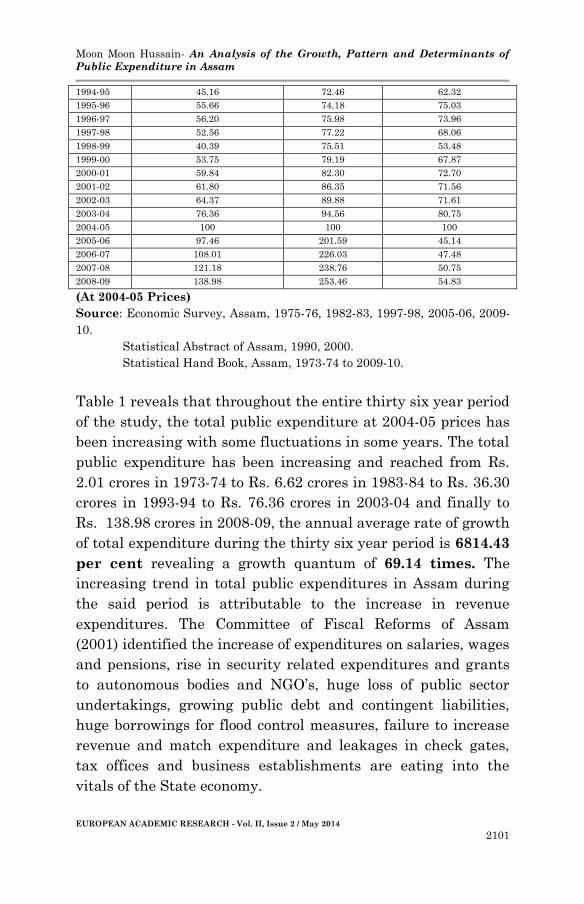
Moon Moon Hussain- An Analysis of the Growth, Pattern and Determinants of
Public Expenditure in Assam
EUROPEAN ACADEMIC RESEARCH - Vol. II, Issue 2 / May 2014
2101
1994-95 45.16 72.46 62.32
1995-96 55.66 74.18 75.03
1996-97 56.20 75.98 73.96
1997-98 52.56 77.22 68.06
1998-99 40.39 75.51 53.48
1999-00 53.75 79.19 67.87
2000-01 59.84 82.30 72.70
2001-02 61.80 86.35 71.56
2002-03 64.37 89.88 71.61
2003-04 76.36 94.56 80.75
2004-05 100 100 100
2005-06 97.46 201.59 45.14
2006-07 108.01 226.03 47.48
2007-08 121.18 238.76 50.75
2008-09 138.98 253.46 54.83
(At 2004-05 Prices)
Source: Economic Survey, Assam, 1975-76, 1982-83, 1997-98, 2005-06, 2009-
10.
Statistical Abstract of Assam, 1990, 2000.
Statistical Hand Book, Assam, 1973-74 to 2009-10.
Table 1 reveals that throughout the entire thirty six year period
of the study, the total public expenditure at 2004-05 prices has
been increasing with some fluctuations in some years. The total
public expenditure has been increasing and reached from Rs.
2.01 crores in 1973-74 to Rs. 6.62 crores in 1983-84 to Rs. 36.30
crores in 1993-94 to Rs. 76.36 crores in 2003-04 and finally to
Rs. 138.98 crores in 2008-09, the annual average rate of growth
of total expenditure during the thirty six year period is 6814.43
per cent revealing a growth quantum of 69.14 times. The
increasing trend in total public expenditures in Assam during
the said period is attributable to the increase in revenue
expenditures. The Committee of Fiscal Reforms of Assam
(2001) identified the increase of expenditures on salaries, wages
and pensions, rise in security related expenditures and grants
to autonomous bodies and NGO’s, huge loss of public sector
undertakings, growing public debt and contingent liabilities,
huge borrowings for flood control measures, failure to increase
revenue and match expenditure and leakages in check gates,
tax offices and business establishments are eating into the
vitals of the State economy.
Moon Moon Hussain- An Analysis of the Growth, Pattern and Determinants of
Public Expenditure in Assam
EUROPEAN ACADEMIC RESEARCH - Vol. II, Issue 2 / May 2014
2102
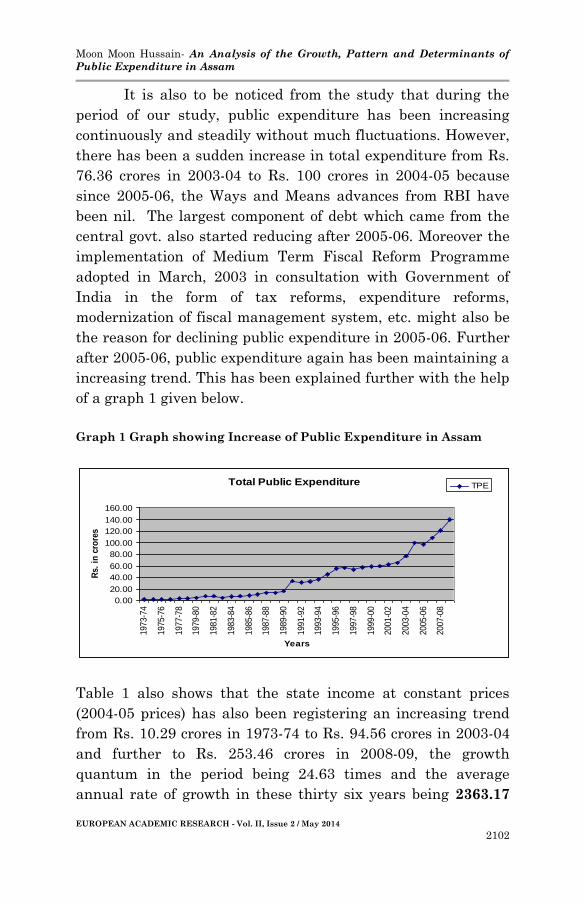
It is also to be noticed from the study that during the
period of our study, public expenditure has been increasing
continuously and steadily without much fluctuations. However,
there has been a sudden increase in total expenditure from Rs.
76.36 crores in 2003-04 to Rs. 100 crores in 2004-05 because
since 2005-06, the Ways and Means advances from RBI have
been nil. The largest component of debt which came from the
central govt. also started reducing after 2005-06. Moreover the
implementation of Medium Term Fiscal Reform Programme
adopted in March, 2003 in consultation with Government of
India in the form of tax reforms, expenditure reforms,
modernization of fiscal management system, etc. might also be
the reason for declining public expenditure in 2005-06. Further
after 2005-06, public expenditure again has been maintaining a
increasing trend. This has been explained further with the help
of a graph 1 given below.
Graph 1 Graph showing Increase of Public Expenditure in Assam
Total Public Expenditure
0.00
20.00
40.00
60.00
80.00
100.00
120.00
140.00
160.00
1973-7
4
1975-7
6
1977-7
8
1979-8
0
1981-8
2
1983-8
4
1985-8
6
1987-8
8
1989-9
0
1991-9
2
1993-9
4
1995-9
6
1997-9
8
1999-0
0
2001-0
2
2003-0
4
2005-0
6
2007-0
8
Years
Rs.
in c
rore
s
TPE
Table 1 also shows that the state income at constant prices
(2004-05 prices) has also been registering an increasing trend
from Rs. 10.29 crores in 1973-74 to Rs. 94.56 crores in 2003-04
and further to Rs. 253.46 crores in 2008-09, the growth
quantum in the period being 24.63 times and the average
annual rate of growth in these thirty six years being 2363.17

Moon Moon Hussain- An Analysis of the Growth, Pattern and Determinants of
Public Expenditure in Assam
EUROPEAN ACADEMIC RESEARCH - Vol. II, Issue 2 / May 2014
2103
per cent which is much lesser than the average annual growth
rate of public expenditure being 6814.42 per cent. The share of
total expenditure in the state income has been maintaining an
increasing but fluctuating trend. The share of total expenditure
to NSDP has been increasing but it has been maintaining a
fluctuating trend in the decade 1983-94. Since 1993-94, the
share of total expenditure to NSDP started increasing from
51.25 per cent in 1983-84 to 80.75 per cent in 2003-04. However
since 2005-06, the share of total expenditure to NSDP started
declining and reached to 54.83 per cent in 2008-09.
Public expenditure and state income are interrelated
and a change in income will definitely lead to a change in public
expenditure. In a developing state like Assam where state
income has been steadily increasing, increase in absolute
amount of public expenditure is quite natural. Though State
income may not be the only factor to bring about changes in the
total public expenditure, it plays a very important role in
shaping public expenditure. If we follow the trends of public
expenditure and NSDP portrayed in the above table, we find
that from the beginning of the period of our study, public
expenditure has been increasing with the increase in State
income. Such income expenditure growth is in conformity with
the Wagner’s doctrine of increase in state activities which says
that government expenditure in any society will grow at a
faster rate than community output will do. This is also because
of the fact that in a comparatively backward State like Assam,
government expenditure has been the prime mover of its socio-
economic growth. Thus, a major chunk of public expenditure
can be derived from the State income and as such more the
State income more is the public expenditure.
Revenue Expenditures of Assam
Revenue expenditures are recurring kind of expenditures
incurred in running the administration. They are basically of
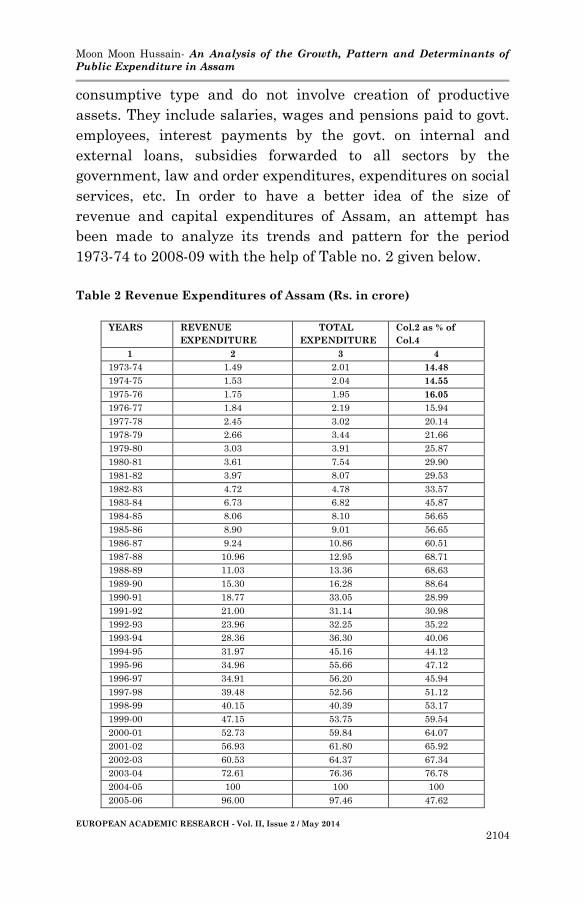
Moon Moon Hussain- An Analysis of the Growth, Pattern and Determinants of
Public Expenditure in Assam
EUROPEAN ACADEMIC RESEARCH - Vol. II, Issue 2 / May 2014
2104
consumptive type and do not involve creation of productive
assets. They include salaries, wages and pensions paid to govt.
employees, interest payments by the govt. on internal and
external loans, subsidies forwarded to all sectors by the
government, law and order expenditures, expenditures on social
services, etc. In order to have a better idea of the size of
revenue and capital expenditures of Assam, an attempt has
been made to analyze its trends and pattern for the period
1973-74 to 2008-09 with the help of Table no. 2 given below.
Table 2 Revenue Expenditures of Assam (Rs. in crore)
YEARS REVENUE
EXPENDITURE
TOTAL
EXPENDITURE
Col.2 as % of
Col.4
1 2 3 4
1973-74 1.49 2.01 14.48
1974-75 1.53 2.04 14.55
1975-76 1.75 1.95 16.05
1976-77 1.84 2.19 15.94
1977-78 2.45 3.02 20.14
1978-79 2.66 3.44 21.66
1979-80 3.03 3.91 25.87
1980-81 3.61 7.54 29.90
1981-82 3.97 8.07 29.53
1982-83 4.72 4.78 33.57
1983-84 6.73 6.82 45.87
1984-85 8.06 8.10 56.65
1985-86 8.90 9.01 56.65
1986-87 9.24 10.86 60.51
1987-88 10.96 12.95 68.71
1988-89 11.03 13.36 68.63
1989-90 15.30 16.28 88.64
1990-91 18.77 33.05 28.99
1991-92 21.00 31.14 30.98
1992-93 23.96 32.25 35.22
1993-94 28.36 36.30 40.06
1994-95 31.97 45.16 44.12
1995-96 34.96 55.66 47.12
1996-97 34.91 56.20 45.94
1997-98 39.48 52.56 51.12
1998-99 40.15 40.39 53.17
1999-00 47.15 53.75 59.54
2000-01 52.73 59.84 64.07
2001-02 56.93 61.80 65.92
2002-03 60.53 64.37 67.34
2003-04 72.61 76.36 76.78
2004-05 100 100 100
2005-06 96.00 97.46 47.62
Moon Moon Hussain- An Analysis of the Growth, Pattern and Determinants of
Public Expenditure in Assam
EUROPEAN ACADEMIC RESEARCH - Vol. II, Issue 2 / May 2014
2105
2006-07 102.00 108.01 45.12
2007-08 120.59 121.18 50.50
2008-09 129.24 138.98 50.99
Source: Economic Survey, Assam, 1975-76 to 2008-09 Statistical Abstract of Assam, 1990, 2000.
Statistical Hand Book, Assam, 1973, 1976, 1980, 1984, 2003, 2008.
Table 2 above reveals the trends and pattern of revenue
expenditures for the period 1973-74 to 2008-09 at 2004-05
prices. So far as the expenditure under revenue account is
concerned, it has been noticed that the total expenditure from
revenue heads have recorded a considerable rise from Rs. 1.49
crores in 1973-74 to Rs. 6.73 crores in 1983-84 to Rs. 28.36
crores in 1993-94 to Rs. 72.61 crores in 2003-04 and ultimately
to Rs. 129.24 crores in 2008-09. The annual average growth
rate in the period of our study, i.e., from 1973-74 to 2008-09 is
8573.82 per cent while the quantum of growth is 86.73 times.
Thus, revenue expenditures as a percentage to total
expenditure has been increasing with some fluctuations in some
years as shown in column 4 of the above table. The above table
(Table 2) also reveals that during the thirty six year period of
the study, the revenue expenditures to total expenditures
constituted for more than 70 per cent for the said period and
more than 90 per cent for thirteen years. Thus, with the
increase in revenue expenditures in the State of Assam, we can
say that the State has been trying hard and making best
possible effort to develop the economy.
The main reason the uncontrollable growth of revenue
expenditure is the rise in pensions, wages, salaries, dearness
allowances and dearness relief and interest payments due to
revised Pay Commissions from time to time. While the wage
bill is rising due to both rising number of employees and higher
wages, the State government has not been efficient enough to
meet the expenditure from its own resources. High level of
financial support to public sector undertakings necessitated by
their inability to meet their current obligations also led to its
increase. Increase in general and social and community services
Moon Moon Hussain- An Analysis of the Growth, Pattern and Determinants of
Public Expenditure in Assam
EUROPEAN ACADEMIC RESEARCH - Vol. II, Issue 2 / May 2014
2106
with a view to fulfill the objectives of Five Year Plans like
alleviate poverty, improve upon the education art and culture,
provide minimum basic needs to the masses like drinking
water, sanitation, health care, energy, roads, generate
employment, etc. have also lead to its growth. Moreover, high
level of financial support to the PSU’s necessitated by their
inability to meet their current obligations and by their
continuing defaults on government guaranteed loans and bonds
have also contributed to the increase. In 2005-06, revenue
expenditures declined mainly due to the compression measures
of revenue expenditure undertaken by the State government in
the recent years wherever possible without affecting public
interest but started increasing again from 2006-07 due to the
increase in total revenue receipts. This has been explained
further with the help of graph 2 given below.
Graph 2 Graph showing growth of Revenue Expenditures in Assam
REVENUE EXPENDITURE
0.00
20.00
40.00
60.00
80.00
100.00
120.00
140.00
160.00
1973
-74
1975
-76
1977
-78
1979
-80
1981
-82
1983
-84
1985
-86
1987
-88
1989
-90
1991
-92
1993
-94
1995
-96
1997
-98
1999
-00
2001
-02
2003
-04
2005
-06
2007
-08
YEARS
Rs.
in c
rore
s
REV_EXP
Capital Expenditures of Assam
Capital expenditure on the other hand is a very important fiscal
instrument which forms the foundation of economic
development for an under developed State like Assam. It
includes the expenditure of the government, which is incurred
Moon Moon Hussain- An Analysis of the Growth, Pattern and Determinants of
Public Expenditure in Assam
EUROPEAN ACADEMIC RESEARCH - Vol. II, Issue 2 / May 2014
2107
for increasing the volume of production. Capital expenditure is
of capital type. Since the expenditures are incurred once for all,
so they are of non-recurring type. The expenditures on setting
up iron and steel plants, multipurpose projects or building
multipurpose projects are in the head of capital expenditure.
Capital expenditure mainly relates to expenditure on account of
capital outlay on development relating to social and community
services and economic services, capital outlay on non-
development activities, repayment of loans to centre, discharge
of internal debt and loans and advances by state government.
In order to have a better idea of the size of capital
expenditures of Assam, let us analyze its trends and pattern for
the period of the study from 1973-74 to 2008-09 with the help of
Table 3.
Table 3 Capital Expenditures of Assam (Rs.crore)
YEARS CAPITAL EXPENDITURE TOTAL
EXPENDITURE
Col.2 as % of
Col.4
1 2 3 4
1973-74 1.09 2.01 54.22
1974-75 1.06 2.04 51.96
1975-76 1.52 1.95 77.94
1976-77 1.42 2.19 64.84
1977-78 2.11 3.02 69.86
1978-79 3.15 3.44 91.56
1979-80 2.57 3.91 65.72
1980-81 3.27 7.54 43.36
1981-82 3.78 8.07 46.84
1982-83 4.12 4.78 86.19
1983-84 4.85 6.82 73.76
1984-85 6.29 8.10 77.65
1985-86 6.29 9.01 69.81
1986-87 7.03 10.86 64.73
1987-88 10.44 12.95 80.61
1988-89 7.68 13.36 57.48
1989-90 13.10 16.28 80.46
1990-91 11.33 33.05 34.28
1991-92 13.08 31.14 42.00
1992-93 10.88 32.25 33.73
1993-94 11.50 36.30 31.68
1994-95 12.71 45.16 28.14
1995-96 13.93 55.66 25.02
1996-97 11.11 56.20 19.60
1997-98 15.10 52.56 28.72
Moon Moon Hussain- An Analysis of the Growth, Pattern and Determinants of
Public Expenditure in Assam
EUROPEAN ACADEMIC RESEARCH - Vol. II, Issue 2 / May 2014
2108
1998-99 16.68 40.39 41.29
1999-00 22.13 53.75 41.17
2000-01 25.75 59.84 43.03
2001-02 25.99 61.80 42.05
2002-03 27.91 64.37 43.35
2003-04 32.53 76.36 42.60
2004-05 100 100 100
2005-06 49.77 97.46 51.06
2006-07 66.64 108.01 61.69
2007-08 77.42 121.18 63.88
2008-09 108.83 138.98 78.30
Source: Economic Survey, Assam, 1975-76 to 2008-09
Statistical Abstract of Assam, 1990, 2000.
Statistical Hand Book, Assam, 1973, 1976, 1980, 1984, 2003, 2008.
Table 3 above clearly portrays the growth in capital
expenditures also. It can be noted from the above table that
capital expenditures have been increasing steadily with some
fluctuations during some years. The main reason for the growth
of capital expenditure in Assam is mainly due to increase in
economic services, social and community services, and general
services. The growth in the volume of expenditure under capital
account has been faster than the expenditure under revenue
account during the period of our study. The capital expenditure
at 2004-05 prices increased from Rs. 4.09 crores in 1973-74 to
Rs. 32.53 crores in 2003-04 to Rs. 108.83 crores in 2008-09, the
annual average growth rate of capital expenditures in these
thirty six years is 9884.40 per cent which is less than the
growth rate of revenue expenditures being 8573.82 per cent.
Moreover, the quantum of growth of capital expenditures in the
said period is just 99.84 times which is greater than the
quantum of growth of revenue expenditures being 86.73 times.
This speaks aloud of the inability of the State to pursue public
expenditure policies in proportion to the achievement of long
term goals and objectives from the Economic services which
generates employment ultimately leading to increase in the per
capita income of the people of the State. As proportion to the
total budgetary expenditure, the capital expenditure on
development which is directly related to economic growth have
been also increasing accounting for more than 50 per cent for
Moon Moon Hussain- An Analysis of the Growth, Pattern and Determinants of
Public Expenditure in Assam
EUROPEAN ACADEMIC RESEARCH - Vol. II, Issue 2 / May 2014
2109
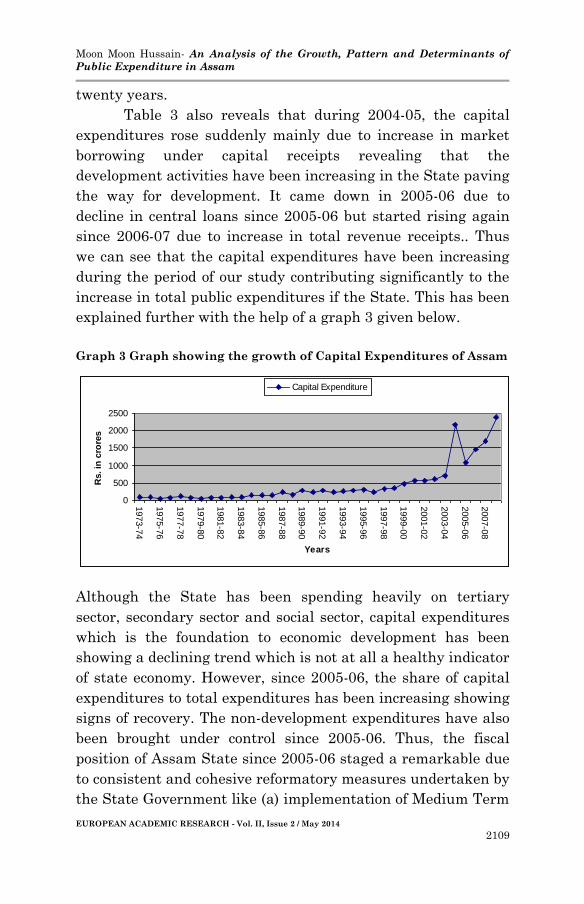
twenty years.
Table 3 also reveals that during 2004-05, the capital
expenditures rose suddenly mainly due to increase in market
borrowing under capital receipts revealing that the
development activities have been increasing in the State paving
the way for development. It came down in 2005-06 due to
decline in central loans since 2005-06 but started rising again
since 2006-07 due to increase in total revenue receipts.. Thus
we can see that the capital expenditures have been increasing
during the period of our study contributing significantly to the
increase in total public expenditures if the State. This has been
explained further with the help of a graph 3 given below.
Graph 3 Graph showing the growth of Capital Expenditures of Assam
Although the State has been spending heavily on tertiary
sector, secondary sector and social sector, capital expenditures
which is the foundation to economic development has been
showing a declining trend which is not at all a healthy indicator
of state economy. However, since 2005-06, the share of capital
expenditures to total expenditures has been increasing showing
signs of recovery. The non-development expenditures have also
been brought under control since 2005-06. Thus, the fiscal
position of Assam State since 2005-06 staged a remarkable due
to consistent and cohesive reformatory measures undertaken by
the State Government like (a) implementation of Medium Term
0
500
1000
1500
2000
2500
1973-7
4
1975-7
6
1977-7
8
1979-8
0
1981-8
2
1983-8
4
1985-8
6
1987-8
8
1989-9
0
1991-9
2
1993-9
4
1995-9
6
1997-9
8
1999-0
0
2001-0
2
2003-0
4
2005-0
6
2007-0
8
Years
Rs. in
cro
res
Capital Expenditure
Moon Moon Hussain- An Analysis of the Growth, Pattern and Determinants of
Public Expenditure in Assam
EUROPEAN ACADEMIC RESEARCH - Vol. II, Issue 2 / May 2014
2110
Fiscal Reform Programme adopted in March, 2003 in
consultation with Government of India, (b) implementation of
comprehensive fiscal restructuring programme titled Assam
Governance and Public Resource Management Programme
sponsored by the Asian Development Bank and Government of
India from 2004, (c) enactment and implementation of Assam
Fiscal Responsibility and Budget Management Act, 2005, (d)
tax augmentation measures, (e) compression measures of
revenue expenditure wherever possible without affecting public
interest and (f) containment of public debt including
Government Guarantees.
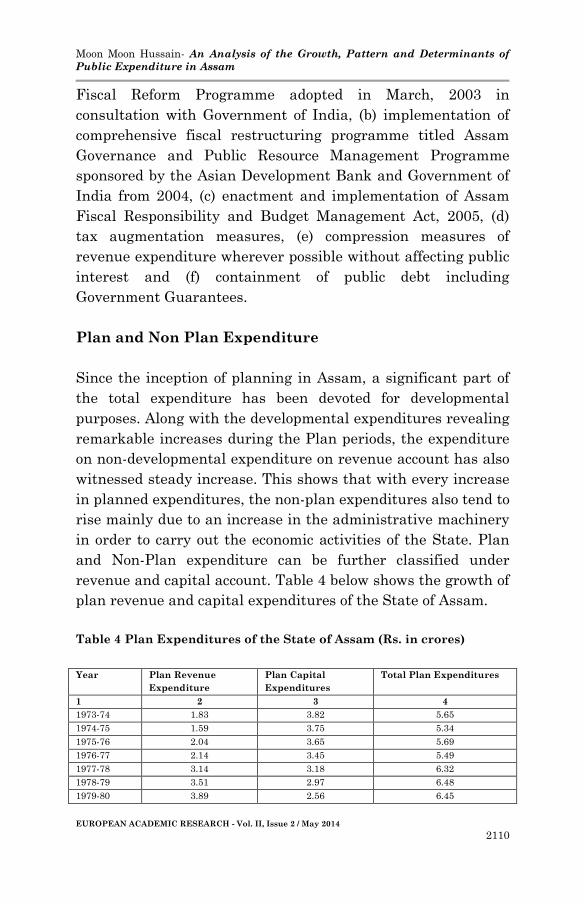
Plan and Non Plan Expenditure
Since the inception of planning in Assam, a significant part of
the total expenditure has been devoted for developmental
purposes. Along with the developmental expenditures revealing
remarkable increases during the Plan periods, the expenditure
on non-developmental expenditure on revenue account has also
witnessed steady increase. This shows that with every increase
in planned expenditures, the non-plan expenditures also tend to
rise mainly due to an increase in the administrative machinery
in order to carry out the economic activities of the State. Plan
and Non-Plan expenditure can be further classified under
revenue and capital account. Table 4 below shows the growth of
plan revenue and capital expenditures of the State of Assam.
Table 4 Plan Expenditures of the State of Assam (Rs. in crores)
Year Plan Revenue
Expenditure
Plan Capital
Expenditures
Total Plan Expenditures
1 2 3 4
1973-74 1.83 3.82 5.65
1974-75 1.59 3.75 5.34
1975-76 2.04 3.65 5.69
1976-77 2.14 3.45 5.49
1977-78 3.14 3.18 6.32
1978-79 3.51 2.97 6.48
1979-80 3.89 2.56 6.45
Moon Moon Hussain- An Analysis of the Growth, Pattern and Determinants of
Public Expenditure in Assam
EUROPEAN ACADEMIC RESEARCH - Vol. II, Issue 2 / May 2014
2111
1980-81 4.93 3.25 8.18
1981-82 5.00 3.71 8.71
1982-83 6.12 3.98 10.1
1983-84 9.18 4.69 13.87
1984-85 10.71 6.20 16.91
1985-86 11.96 6.18 18.14
1986-87 14.78 6.67 21.45
1987-88 17.14 10.18 27.32
1988-89 18.10 7.54 25.64
1989-90 20.44 12.85 33.29
1990-91 24.27 11.24 35.51
1991-92 29.58 12.93 42.51
1992-93 29.11 10.67 39.78
1993-94 34.19 11.33 45.52
1994-95 37.82 12.43 50.25
1995-96 43.23 13.23 56.46
1996-97 41.50 11.02 52.52
1997-98 45.73 15.00 60.73
1998-99 51.85 16.96 68.81
1999-00 62.26 21.67 83.93
2000-01 67.37 24.44 91.81
2001-02 72.28 25.85 98.13
2002-03 77.55 27.37 104.92
2003-04 90.90 31.93 122.83
2004-05 100 100 200.00
2005-06 157.91 45.27 203.18
2006-07 117.21 65.70 182.91
2007-08 144.17 76.35 220.52
2008-09 130.78 107.51 238.29
Source: Economic Survey, Assam, 1975-76, 1982-83, 1997-98, 2005-06, 2009-
10.
Statistical Abstract of Assam, 1990, 2000.
Statistical Hand Book, Assam, 1973-74 to 2009-10.
The above table 4 reveals the plan expenditures under both
revenue and capital account at 2004-05 prices for the thirty six
year period of our study, i.e., from 1973-74 to 2008-09. The
table shows that the plan expenditures under revenue account
increased from Rs. 1.83 crores in 1973-74 to Rs. 130.78 crores in
2008-09, the annual average growth rate during the period of
the study being 7046.44 per cent while the quantum of growth
being 71.46 times. On the other hand, the plan expenditures
under capital account increased from Rs. 3.82 crores in 1973-74
to Rs. 107.51 crores in 2008-09, the annual average growth rate
during the period of the study being 2714.39 per cent while
the quantum of growth being 28.14 times. The table also shows
Moon Moon Hussain- An Analysis of the Growth, Pattern and Determinants of
Public Expenditure in Assam
EUROPEAN ACADEMIC RESEARCH - Vol. II, Issue 2 / May 2014
2112
that the total plan expenditures increased from Rs. 5.65 crores
in 1973-74 to Rs. 238.29 crores in 2008-09, the annual average
growth rate being 4117.52 per cent while the quantum of
growth being 42.17 times. Thus it is clear from the above table
that the plan expenditures under revenue expenditures have
not only been increasing in absolute figures but also in terms of
average annual growth rate and growth quantum which seems
to be higher than the plan expenditures under capital account.
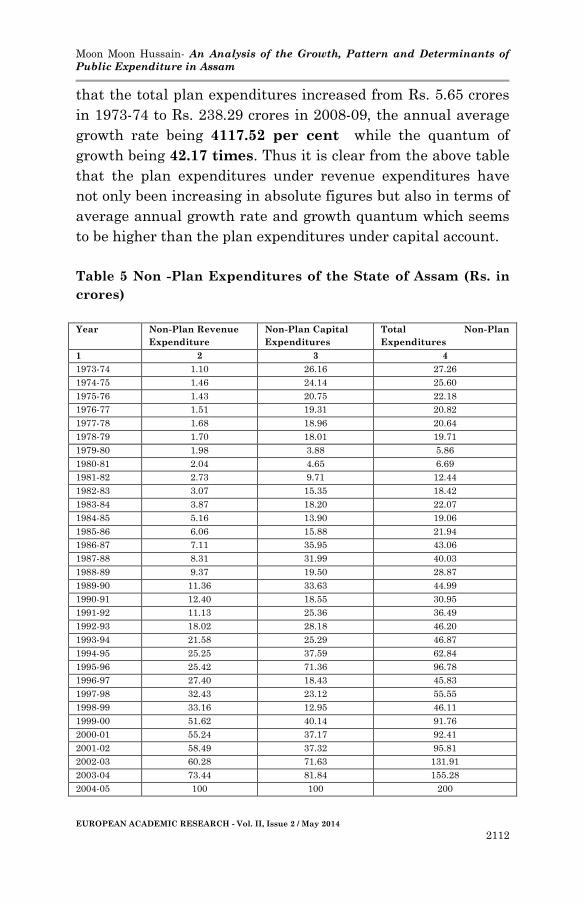
Table 5 Non -Plan Expenditures of the State of Assam (Rs. in
crores)
Year Non-Plan Revenue
Expenditure
Non-Plan Capital
Expenditures
Total Non-Plan
Expenditures
1 2 3 4
1973-74 1.10 26.16 27.26
1974-75 1.46 24.14 25.60
1975-76 1.43 20.75 22.18
1976-77 1.51 19.31 20.82
1977-78 1.68 18.96 20.64
1978-79 1.70 18.01 19.71
1979-80 1.98 3.88 5.86
1980-81 2.04 4.65 6.69
1981-82 2.73 9.71 12.44
1982-83 3.07 15.35 18.42
1983-84 3.87 18.20 22.07
1984-85 5.16 13.90 19.06
1985-86 6.06 15.88 21.94
1986-87 7.11 35.95 43.06
1987-88 8.31 31.99 40.03
1988-89 9.37 19.50 28.87
1989-90 11.36 33.63 44.99
1990-91 12.40 18.55 30.95
1991-92 11.13 25.36 36.49
1992-93 18.02 28.18 46.20
1993-94 21.58 25.29 46.87
1994-95 25.25 37.59 62.84
1995-96 25.42 71.36 96.78
1996-97 27.40 18.43 45.83
1997-98 32.43 23.12 55.55
1998-99 33.16 12.95 46.11
1999-00 51.62 40.14 91.76
2000-01 55.24 37.17 92.41
2001-02 58.49 37.32 95.81
2002-03 60.28 71.63 131.91
2003-04 73.44 81.84 155.28
2004-05 100 100 200
Moon Moon Hussain- An Analysis of the Growth, Pattern and Determinants of
Public Expenditure in Assam
EUROPEAN ACADEMIC RESEARCH - Vol. II, Issue 2 / May 2014
2113
2005-06 107.98 110.74 218.72
2006-07 106.11 143.37 249.48
2007-08 102.49 164.81 267.30
2008-09 148.80 217.17 365.97
Source: Economic Survey, Assam, 1975-76, 1982-83, 1997-98, 2005-06, 2009-
10.
Statistical Abstract of Assam, 1990, 2000.
Statistical Hand Book, Assam, 1973-74 to 2009-10.
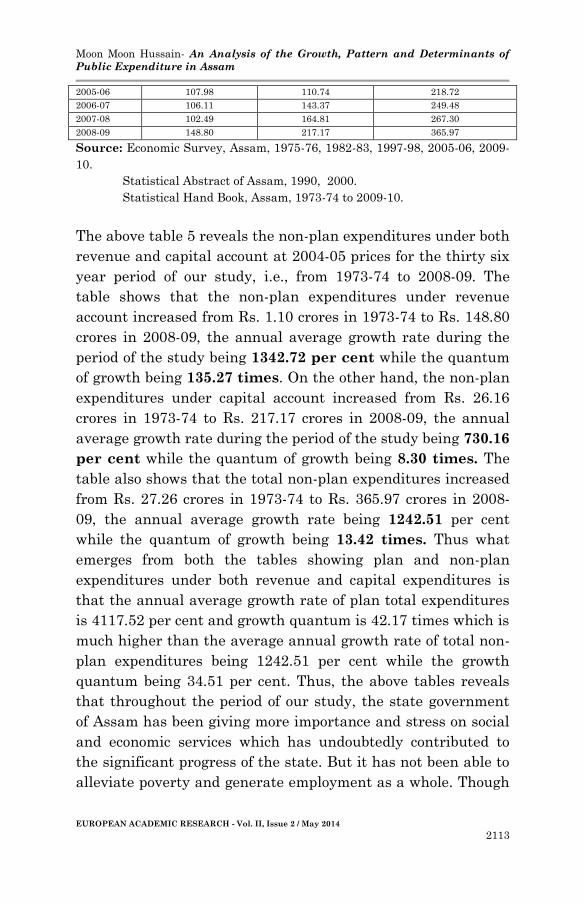
The above table 5 reveals the non-plan expenditures under both
revenue and capital account at 2004-05 prices for the thirty six
year period of our study, i.e., from 1973-74 to 2008-09. The
table shows that the non-plan expenditures under revenue
account increased from Rs. 1.10 crores in 1973-74 to Rs. 148.80
crores in 2008-09, the annual average growth rate during the
period of the study being 1342.72 per cent while the quantum
of growth being 135.27 times. On the other hand, the non-plan
expenditures under capital account increased from Rs. 26.16
crores in 1973-74 to Rs. 217.17 crores in 2008-09, the annual
average growth rate during the period of the study being 730.16
per cent while the quantum of growth being 8.30 times. The
table also shows that the total non-plan expenditures increased
from Rs. 27.26 crores in 1973-74 to Rs. 365.97 crores in 2008-
09, the annual average growth rate being 1242.51 per cent
while the quantum of growth being 13.42 times. Thus what
emerges from both the tables showing plan and non-plan
expenditures under both revenue and capital expenditures is
that the annual average growth rate of plan total expenditures
is 4117.52 per cent and growth quantum is 42.17 times which is
much higher than the average annual growth rate of total non-
plan expenditures being 1242.51 per cent while the growth
quantum being 34.51 per cent. Thus, the above tables reveals
that throughout the period of our study, the state government
of Assam has been giving more importance and stress on social
and economic services which has undoubtedly contributed to
the significant progress of the state. But it has not been able to
alleviate poverty and generate employment as a whole. Though
Moon Moon Hussain- An Analysis of the Growth, Pattern and Determinants of
Public Expenditure in Assam
EUROPEAN ACADEMIC RESEARCH - Vol. II, Issue 2 / May 2014
2114
agriculture and industries consume a major portion of the plan
expenditure, industrial production and productivity have
remained one of the lowest in India.
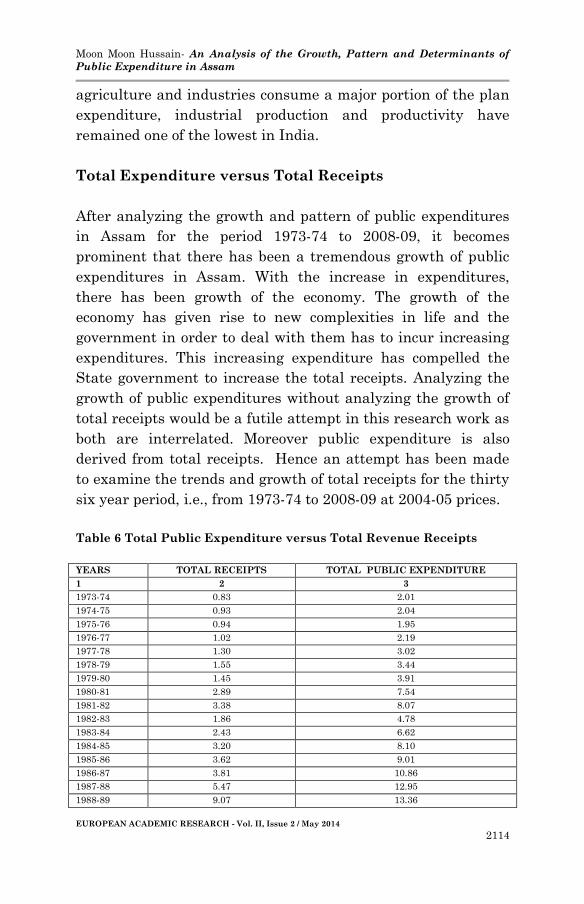
Total Expenditure versus Total Receipts
After analyzing the growth and pattern of public expenditures
in Assam for the period 1973-74 to 2008-09, it becomes
prominent that there has been a tremendous growth of public
expenditures in Assam. With the increase in expenditures,
there has been growth of the economy. The growth of the
economy has given rise to new complexities in life and the
government in order to deal with them has to incur increasing
expenditures. This increasing expenditure has compelled the
State government to increase the total receipts. Analyzing the
growth of public expenditures without analyzing the growth of
total receipts would be a futile attempt in this research work as
both are interrelated. Moreover public expenditure is also
derived from total receipts. Hence an attempt has been made
to examine the trends and growth of total receipts for the thirty
six year period, i.e., from 1973-74 to 2008-09 at 2004-05 prices.
Table 6 Total Public Expenditure versus Total Revenue Receipts
YEARS TOTAL RECEIPTS TOTAL PUBLIC EXPENDITURE
1 2 3
1973-74 0.83 2.01
1974-75 0.93 2.04
1975-76 0.94 1.95
1976-77 1.02 2.19
1977-78 1.30 3.02
1978-79 1.55 3.44
1979-80 1.45 3.91
1980-81 2.89 7.54
1981-82 3.38 8.07
1982-83 1.86 4.78
1983-84 2.43 6.62
1984-85 3.20 8.10
1985-86 3.62 9.01
1986-87 3.81 10.86
1987-88 5.47 12.95
1988-89 9.07 13.36
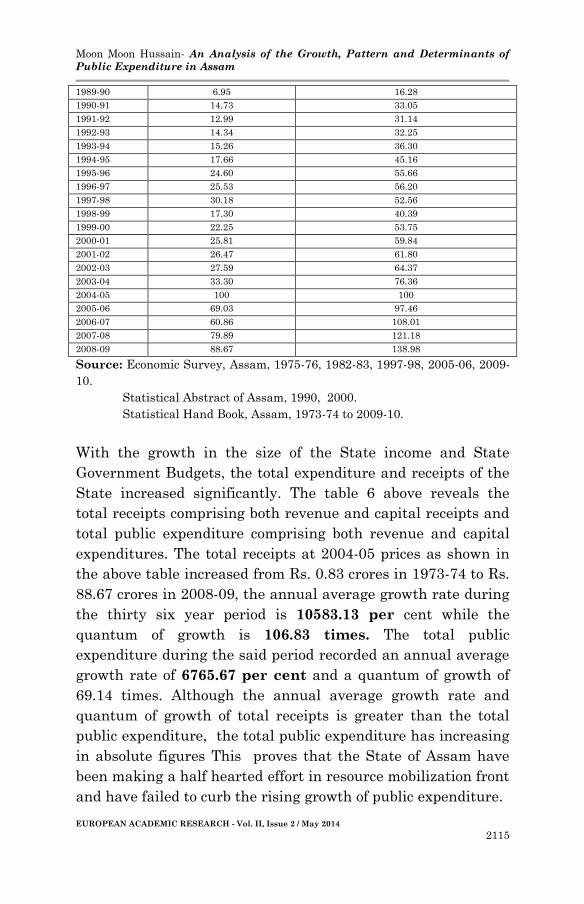
Moon Moon Hussain- An Analysis of the Growth, Pattern and Determinants of
Public Expenditure in Assam
EUROPEAN ACADEMIC RESEARCH - Vol. II, Issue 2 / May 2014
2115
1989-90 6.95 16.28
1990-91 14.73 33.05
1991-92 12.99 31.14
1992-93 14.34 32.25
1993-94 15.26 36.30
1994-95 17.66 45.16
1995-96 24.60 55.66
1996-97 25.53 56.20
1997-98 30.18 52.56
1998-99 17.30 40.39
1999-00 22.25 53.75
2000-01 25.81 59.84
2001-02 26.47 61.80
2002-03 27.59 64.37
2003-04 33.30 76.36
2004-05 100 100
2005-06 69.03 97.46
2006-07 60.86 108.01
2007-08 79.89 121.18
2008-09 88.67 138.98
Source: Economic Survey, Assam, 1975-76, 1982-83, 1997-98, 2005-06, 2009-
10.
Statistical Abstract of Assam, 1990, 2000.
Statistical Hand Book, Assam, 1973-74 to 2009-10.
With the growth in the size of the State income and State
Government Budgets, the total expenditure and receipts of the
State increased significantly. The table 6 above reveals the
total receipts comprising both revenue and capital receipts and
total public expenditure comprising both revenue and capital
expenditures. The total receipts at 2004-05 prices as shown in
the above table increased from Rs. 0.83 crores in 1973-74 to Rs.
88.67 crores in 2008-09, the annual average growth rate during
the thirty six year period is 10583.13 per cent while the
quantum of growth is 106.83 times. The total public
expenditure during the said period recorded an annual average
growth rate of 6765.67 per cent and a quantum of growth of
69.14 times. Although the annual average growth rate and
quantum of growth of total receipts is greater than the total
public expenditure, the total public expenditure has increasing
in absolute figures This proves that the State of Assam have
been making a half hearted effort in resource mobilization front
and have failed to curb the rising growth of public expenditure.

Moon Moon Hussain- An Analysis of the Growth, Pattern and Determinants of
Public Expenditure in Assam
EUROPEAN ACADEMIC RESEARCH - Vol. II, Issue 2 / May 2014
2116
The table 6 also reveals that there has been continuous
increase in both total expenditure and total receipts in the said
period at 2004-05 prices and with the increase in total receipts,
the total expenditure have also been increasing. It can be seen
from the above table that in the year 1998-99, with the decline
of total receipts from Rs. 30.18 crores in 1997-98 to Rs. 17.30
crores in 1998-99, the total expenditure also declined to Rs.
40.39 crores in 1998-99 from Rs. 52.56 crores in 1997-98. This is
mainly because of the decline of central taxes under revenue
receipts during the particular year. Both total receipts and total
expenditure started increasing since 1999-00. The total receipts
increased suddenly in 2004-05 leading to the increase in total
expenditures due to the increase of State taxes, Central Taxes,
Non-Tax Revenue and Grants-in –aid under revenue receipts. It
came down in 2005 -06 and further to 2006-07 as the central
loans under capital receipts started declining since the said
period. Moreover, since 2005-06, the Ways and Means advances
from RBI had been nil. This has been explained further with
the help of a graph 4.
Graph 4 Graph showing the growth of Total Receipts and Total
Expenditures
Public Expenditure and Total Receipts
0.00
20.00
40.00
60.00
80.00
100.00
120.00
140.00
160.00
1973-74
1975-76
1977-78
1979-80
1981-82
1983-84
1985-86
1987-88
1989-90
1991-92
1993-94
1995-96
1997-98
1999-00
2001-02
2003-04
2005-06
2007-08
YEARS
rs.
in c
rore
s
TPE
TOTAL_REC
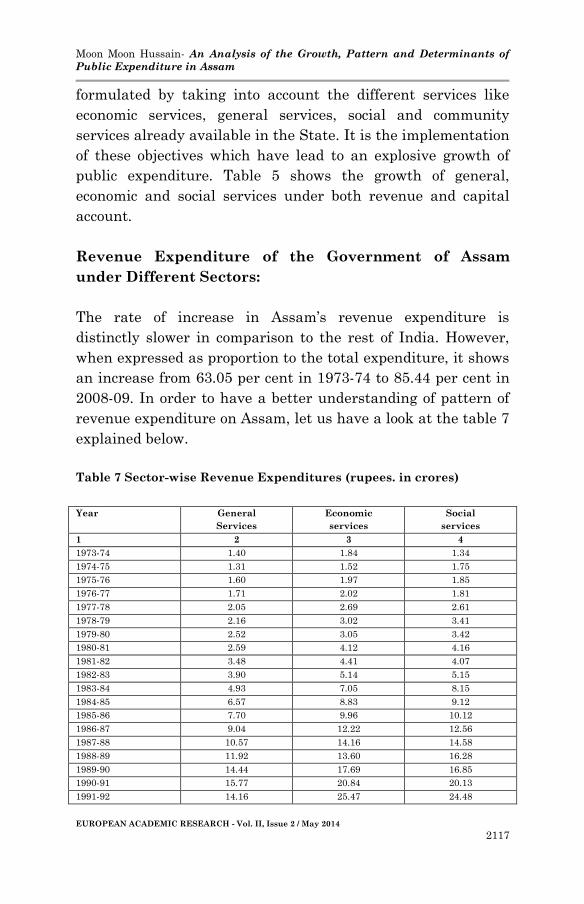
Pattern of Public Expenditure in Assam
A general pattern of the objectives of public expenditure can be
Moon Moon Hussain- An Analysis of the Growth, Pattern and Determinants of
Public Expenditure in Assam
EUROPEAN ACADEMIC RESEARCH - Vol. II, Issue 2 / May 2014
2117
formulated by taking into account the different services like
economic services, general services, social and community
services already available in the State. It is the implementation
of these objectives which have lead to an explosive growth of
public expenditure. Table 5 shows the growth of general,
economic and social services under both revenue and capital
account.
Revenue Expenditure of the Government of Assam
under Different Sectors:
The rate of increase in Assam’s revenue expenditure is
distinctly slower in comparison to the rest of India. However,
when expressed as proportion to the total expenditure, it shows
an increase from 63.05 per cent in 1973-74 to 85.44 per cent in
2008-09. In order to have a better understanding of pattern of
revenue expenditure on Assam, let us have a look at the table 7
explained below.
Table 7 Sector-wise Revenue Expenditures (rupees. in crores)
Year General
Services
Economic
services
Social
services
1 2 3 4
1973-74 1.40 1.84 1.34
1974-75 1.31 1.52 1.75
1975-76 1.60 1.97 1.85
1976-77 1.71 2.02 1.81
1977-78 2.05 2.69 2.61
1978-79 2.16 3.02 3.41
1979-80 2.52 3.05 3.42
1980-81 2.59 4.12 4.16
1981-82 3.48 4.41 4.07
1982-83 3.90 5.14 5.15
1983-84 4.93 7.05 8.15
1984-85 6.57 8.83 9.12
1985-86 7.70 9.96 10.12
1986-87 9.04 12.22 12.56
1987-88 10.57 14.16 14.58
1988-89 11.92 13.60 16.28
1989-90 14.44 17.69 16.85
1990-91 15.77 20.84 20.13
1991-92 14.16 25.47 24.48

Moon Moon Hussain- An Analysis of the Growth, Pattern and Determinants of
Public Expenditure in Assam
EUROPEAN ACADEMIC RESEARCH - Vol. II, Issue 2 / May 2014
2118
1992-93 22.91 23.13 25.36
1993-94 27.45 24.90 31.29
1994-95 32.11 28.82 33.77
1995-96 32.33 34.61 37.50
1996-97 34.84 27.18 39.99
1997-98 41.24 28.64 44.93
1998-99 42.18 33.15 50.51
1999-00 65.16 38.95 61.20
2000-01 67.44 40.76 72.46
2001-02 77.44 47.35 69.68
2002-03 82.37 42.67 74.60
2003-04 93.72 60.29 86.54
2004-05 100.00 100.00 100.00
2005-06 110.54 87.85 105.68
2006-07 121.05 100.82 110.57
2007-08 130.34 111.22 127.59
2008-09 189.23 161.38 214.57
Source: Economic Survey, Assam, 1975-76, 1982-83, 1997-98, 2005-06, 2009-
10.
Statistical Abstract of Assam, 1990, 2000.
Statistical Hand Book, Assam, 1973-74 to 2009-10.
Directorate of Economics and Statistics
Table 7 reveals the sector wise revenue expenditure from 1973-
74 to 2008-09 at 2004-05 prices. The table shows that that the
general services under revenue account which was Rs. 1.40
crores in 1973-74 increased to Rs. 93.72 crores in 2003-04 and
ultimately to Rs. 189.23 crores 2008-09, the average annual
growth rate during the thirty six year period being 9654.59
per cent while the quantum of growth during the period is
135.16 times. The economic services under revenue
expenditure which was Rs. 1.84 crores in 1973-74 increased to
Rs. 161.38 crores in 2008-09, the annual average growth rate
during the thirty six year period being 8670.65 per cent while
quantum of growth is 87.70 times. The social and
community service under total revenue expenditures which
was Rs. 1.34 crores in 1973-74 increased to Rs. 214.57 crores in
2008-09, the annual average growth rate during the thirty six
year period being 15912.68 per cent and the quantum of
growth being 160.12 times. Thus, from the above analysis, it is
clear that during the period of our study from 1973-74 to 2008-
09, the revenue expenditures on social and community services
Moon Moon Hussain- An Analysis of the Growth, Pattern and Determinants of
Public Expenditure in Assam
EUROPEAN ACADEMIC RESEARCH - Vol. II, Issue 2 / May 2014
2119
account for growth quantum of 160.12 times followed by
revenue expenditures on general services with growth quantum
of 135.16 times and economic services with 87.70 times. The
social and community services under revenue account have not
only increased by leaps and bounds in absolute figures but also
in terms of average annual growth rate, the annual average
growth rate during the thirty six year period being 15912.68
per cent followed by general services being 372.67 percent and
economic services being 8670.65 per cent. This makes it
evident that the Government of Assam is spending a
substantial amount on education, medical, family planning,
public health and sanitation so as to improve the living
standard and productivity of the people of the State. The
literacy rate which was just 29.9 per cent in 1971 census
increased to 52.89 per cent in 1991 census and further to 63.25
percent in 2001 census as the State Government has been
implementing various educational programmes. To enhance
educational progress in the state, Universal Elementary
Education (UEE) and Sarva Siksha Abhijan (SSA) is being
pursued. Some other schemes under the State Plan such as
community ownership of elementary schools operationalized
through formation of School Managing Committees and Mother
Groups has been introduced. Free textbooks have been given to
all the students, MIS known as District Information System on
Education (DISE) has been operationalized, etc to give more
thrust on the issue of education. As far as health service is
concerned, the State Government has been undertaking various
programmes and continuously increasing allocation of fund to
the health sector in State plans. The fund allocation under the
Annual Plan 2008-09 was Rs. 92.95 crores of which Rs. 80.30
crores was earmarked for continuing different schemes under
Health Services. Various new schemes have been launched to
bring Health care nearer to the people during the Tenth Plan.
During this period, as many as 69 CHCs, 34 PHCs and 1000
Sub-Centres have been upgraded. Initiatives have been taken
Moon Moon Hussain- An Analysis of the Growth, Pattern and Determinants of
Public Expenditure in Assam
EUROPEAN ACADEMIC RESEARCH - Vol. II, Issue 2 / May 2014
2120
to establish three more Medical Colleges besides providing
funds for upgrading the three existing Medical Colleges. The
State Government has launched various schemes and
undertaken various steps through Public Private Partnership
(POP) to improve the health status of the population of
undeserved and uncovered area. Mention can be made of
Emergency Response Service called “Mritunjoy” introduced by
the State government to take care of people who are in need of
emergency care arising out of medical, police or fire situations.
Further providing safe drinking water and safe sanitation
facilities to the uncovered and under served rural population is
the major and prime task to cater the needs for health and
improve the quality of life. Out of the total 70669 habitations in
the State, 68213 habitations were provided with full water
supply benefit and 2425 habitations provided with partial
benefit till the end of the Tenth Plan period. In addition to the
human habitations, 8152 schools have also been provided with
drinking water supply facilities.
The main reason for the growth rate of economic services
is that despite slow growth due to various constraints a
favorable industrial climate is gradually being created in the
State as discernible from the increasing interest shown by
investors both from the increasing interest shown by investors
both from within the State as well as outside. Development of
industrial sector is one of the prime goal of the State
government and to achieve this goal through the
implementation of various schemes, an amount of Rs. 284.54
crore was allocated in the State during the last nine years, i.e.,
from 2000-01 to 2008-09.
Now we shall analyze the pattern of capital
expenditures according to the general, economic and social
services during the period of our study.

Moon Moon Hussain- An Analysis of the Growth, Pattern and Determinants of
Public Expenditure in Assam
EUROPEAN ACADEMIC RESEARCH - Vol. II, Issue 2 / May 2014
2121
Capital Expenditure of the Government of Assam under
Different Sectors:
The sector wise growth of capital expenditures have also been
showing an increasing trend but it has not been able to increase
in the same speed as the sector wise growth of revenue
expenditures which makes the fact apparent that the
government of Assam have been curtailing its expenditures on
development projects essential for overall growth and
development of the economy. Table 8 shows the sector-wise
growth of capital expenditures during the period of the study.
Table 8 Sector-wise Capital expenditure (rupees. in crores)
Year General
Services
Social
Services
Economic
Services
1 2 3 4
1973-74 15.73 14.41 2.99
1974-75 19.15 13.16 3.41
1975-76 10.75 11.47 1.98
1976-77 9.64 7.07 3.16
1977-78 4.23 4.42 5.15
1978-79 15.89 9.04 2.69
1979-80 3.43 4.40 2.48
1980-81 4.10 8.19 3.02
1981-82 8.57 10.76 3.38
1982-83 13.54 11.07 3.66
1983-84 16.06 15.98 4.16
1984-85 12.26 18.11 5.64
1985-86 14.01 14.24 5.80
1986-87 31.72 29.51 5.60
1987-88 28.23 46.50 8.48
1988-89 17.20 23.23 6.81
1989-90 29.67 39.74 11.60
1990-91 16.36 31.45 10.30
1991-92 22.38 25.80 12.34
1992-93 24.87 23.12 10.10
1993-94 22.31 27.72 10.58
1994-95 33.17 34.25 11.40
1995-96 62.97 41.09 11.93
1996-97 162.63 16.82 10.76
1997-98 203.97 28.80 14.38
1998-99 114.25 47.75 15.29
1999-00 35.42 52.99 20.47
2000-01 26.88 15.43 20.76
2001-02 32.93 35.31 22.84
Moon Moon Hussain- An Analysis of the Growth, Pattern and Determinants of
Public Expenditure in Assam
EUROPEAN ACADEMIC RESEARCH - Vol. II, Issue 2 / May 2014
2122
2002-03 63.21 51.17 52.97
2003-04 72.21 56.79 53.34
2004-05 100.00 100.00 100.00
2005-06 110.08 123.86 45.39
2006-07 134.04 162.76 61.11
2007-08 145.43 273.18 67.16
2008-09 191.63 617.14 83.56
Source: Economic Survey, Assam, 1975-76, 1982-83, 1997-98, 2005-06, 2009-
10.
Statistical Abstract of Assam, 1990, 2000.
Statistical Hand Book, Assam, 1973-74 to 2009-10.
Directorate of Economics and Statistics
The above table 8 gives the trend of sector-wise growth of
capital expenditure during the period of our study. The above
table reveals that the general services under total capital
expenditures which was merely Rs. 15.73 crores in 1973-74
increased to Rs. 191.63 crores 2008-09, the annual average
growth rate during the thirty six year period being 1118.24 per
cent and the quantum of growth in the said period being 12.18
times. The social service which was Rs. 14.01 crores in 1973-
74 increased to Rs. 617.14 crores in 2008-09, the annual
average growth rate during the thirty six year period being
4304.99 per cent while the quantum of growth in the said
period being 44.04 times. The economic services under
capital account which was Rs.2.99 crores in 1973-74 increased
to Rs. 83.56 crores in 2008-09, the annual average growth rate
during the thirty six year period being 2694.64 per cent while
quantum of growth being 27.94 times. The above analysis also
reveals that the highest growth rate under capital account is
registered by social services with annual average growth rate
during the thirty six year period being 4304.99 per cent and
growth quantum of 44.04 times followed by economic services
with growth quantum of 27.94 times and general services with
growth quantum of 12.18 times in the said period. Thus, in
terms of absolute figures as well as growth quantum, the social
services services show the highest increase and growth. This
means the State Government has been spending a major chunk
of capital expenditures on agriculture and allied services,
Moon Moon Hussain- An Analysis of the Growth, Pattern and Determinants of
Public Expenditure in Assam
EUROPEAN ACADEMIC RESEARCH - Vol. II, Issue 2 / May 2014
2123
industry and minerals, water and power development,
transport and communication, etc. The above analysis also
shows that the sector-wise growth of capital expenditures is
much less than the sector-wise growth rates of revenue
expenditures. This means government of Assam have been
curtailing on capital expenditure which is not at all a good sign
for economic development.
The sector-wise growth of capital expenditures is much
less than the sector-wise growth rates of revenue expenditures.
However it cannot be denied that the sector-wise analysis
shows that revenue and capital expenditures have grown
manifold times during the period of our study which has
definitely contributed to the tremendous growth of public
expenditure in Assam.
Results and Discussion
In this section, an attempt is made to find out the determinants
of public expenditure in the state of Assam. All the five models
given in section VIII are estimated by the method of OLS. The
dummy variable is included to account for the sudden increase
in the expenditure during the year 2004-05. It may be pointed
out here that the above mentioned model specifications are
estimated by OLS. In almost all the estimated regression
equations, it is observed that the Durbin – Watson d statistic
indicated the presence of either positive or negative auto
correlation. Although, OLS estimators remain unbiased as well
as consistent, they are no longer efficient when autocorrelation
is present in the model [Gujarati, D (2009)]. Also, we cannot
apply the t and F tests of significance legitimately. Hence we
have to resort to some remedial measures to correct for this
auto correlation problem. The remedy depends on what
knowledge one has about the nature of interdependence among
the disturbance terms.
The remedy for auto-correlation involves in finding out
Moon Moon Hussain- An Analysis of the Growth, Pattern and Determinants of
Public Expenditure in Assam
EUROPEAN ACADEMIC RESEARCH - Vol. II, Issue 2 / May 2014
2124
the coefficient of auto-correlation ρ and then using the
estimated ρ to transform the original data by doing some
manipulations. There are many methods in the literature which
are used to calculate ρ. Durbin-Watson d statistic, Theil-Nagar
d statistic, Durbin’s two-step procedure and the Cochrane-
Orcutt iterative method are some of the well known methods.
However, the Cochrane-Orcutt iterative method is very popular
in applied econometric research and as such we have used this
C-O method to estimate the parameters of the above five
models.
The model specifications 1 to 5 are hence estimated
using the Cochrane-Orcutt iterative method and are given
below.
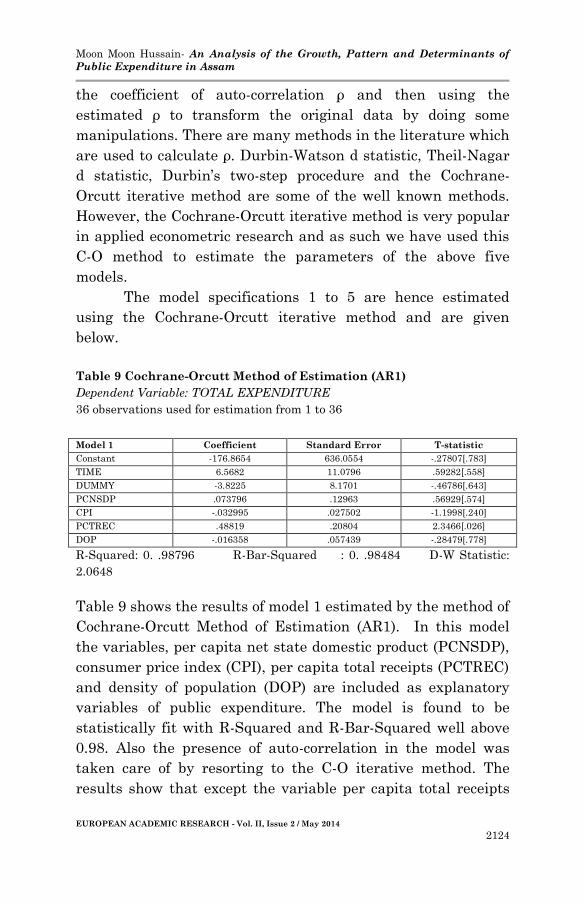
Table 9 Cochrane-Orcutt Method of Estimation (AR1)
Dependent Variable: TOTAL EXPENDITURE
36 observations used for estimation from 1 to 36
Model 1 Coefficient Standard Error T-statistic
Constant -176.8654 636.0554 -.27807[.783]
TIME 6.5682 11.0796 .59282[.558]
DUMMY -3.8225 8.1701 -.46786[.643]
PCNSDP .073796 .12963 .56929[.574]
CPI -.032995 .027502 -1.1998[.240]
PCTREC .48819 .20804 2.3466[.026]
DOP -.016358 .057439 -.28479[.778]
R-Squared: 0. .98796 R-Bar-Squared : 0. .98484 D-W Statistic:
2.0648
Table 9 shows the results of model 1 estimated by the method of
Cochrane-Orcutt Method of Estimation (AR1). In this model
the variables, per capita net state domestic product (PCNSDP),
consumer price index (CPI), per capita total receipts (PCTREC)
and density of population (DOP) are included as explanatory
variables of public expenditure. The model is found to be
statistically fit with R-Squared and R-Bar-Squared well above
0.98. Also the presence of auto-correlation in the model was
taken care of by resorting to the C-O iterative method. The
results show that except the variable per capita total receipts

Moon Moon Hussain- An Analysis of the Growth, Pattern and Determinants of
Public Expenditure in Assam
EUROPEAN ACADEMIC RESEARCH - Vol. II, Issue 2 / May 2014
2125
(PCTREC), all the other variables, i.e., per capita net state
domestic product (PCNSDP), consumer price index (CPI), and
density of population (DOP) including the constant are found to
be statistically insignificant. The dummy along with the time
variable is also found to be statistically insignificant.
The results of the model specification 2 estimated by the
method of Cochrane-Orcutt Method of Estimation (AR1) are
given in table 10.
Table 10 Cochrane-Orcutt Method of Estimation (AR1)
Dependent Variable: TOTAL EXPENDITURE
36 observations used for estimation from 1 to 36
Model 2 Coefficient Standard Error T-statistic
Constant -64.4553 92.2709 -.69854[.490]
TIME 3.9992 2.6928 1.4851[.148]
DUMMY -24.6158 9.9794 -2.4667[.020]
PCCE .50621 .15088 3.3550[.002]
TRNSDP .22774 .063686 3.5759[.001]
PCUPTP -1.1282 2.1843 -.51651[.609]
R- Squared : 0. 98893 R-Bar-Squared : 0. 98656 D-W Statistics :
2.089
Table 10 above shows the results of model 2 estimated by the
method of Cochrane-Orcutt Method of Estimation (AR1). Here,
the variables per capita capital expenditures (PCCE), total
receipts to net state domestic product (TRNSDP), and
percentage of urban population to total population (PCUPTP)
are included. The model is found to be satisfactory in explaining
the variation in dependent variable as reflected by R2 of 0.
98893 and R-Bar-Squared of 0. 98656. Here, only per capita
capital expenditures (PCCE) and total receipts to net state
domestic product (TRNSDP) are highly significant and exerting
a positive influence on the dependent variable, i.e., total public
expenditure. While the other variables including the percentage
of urban population to total population (PCUPTP), Constant
and time variable are insignificant in determining public
expenditure .The dummy variable though significant has a
negative influence on the dependent variable.
Moon Moon Hussain- An Analysis of the Growth, Pattern and Determinants of
Public Expenditure in Assam
EUROPEAN ACADEMIC RESEARCH - Vol. II, Issue 2 / May 2014
2126
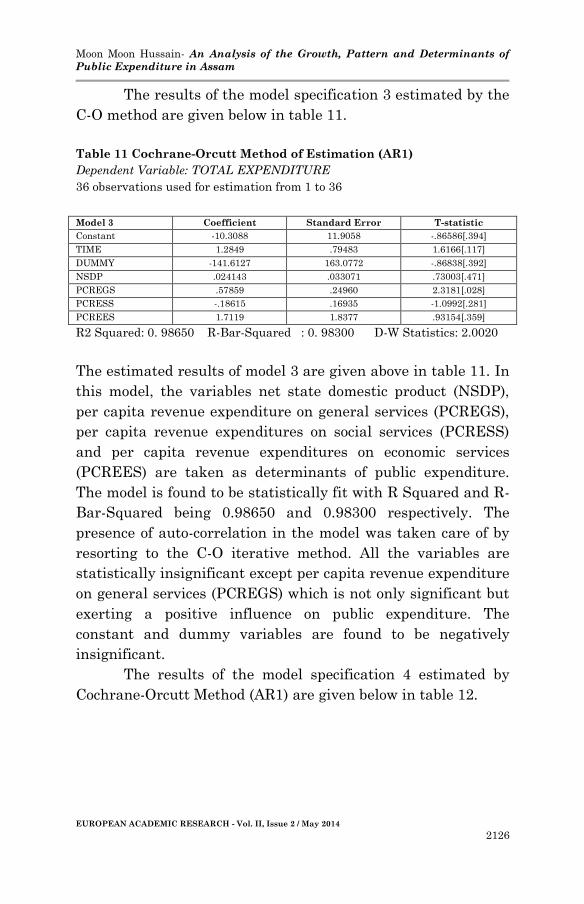
The results of the model specification 3 estimated by the
C-O method are given below in table 11.
Table 11 Cochrane-Orcutt Method of Estimation (AR1)
Dependent Variable: TOTAL EXPENDITURE
36 observations used for estimation from 1 to 36
Model 3 Coefficient Standard Error T-statistic
Constant -10.3088 11.9058 -.86586[.394]
TIME 1.2849 .79483 1.6166[.117]
DUMMY -141.6127 163.0772 -.86838[.392]
NSDP .024143 .033071 .73003[.471]
PCREGS .57859 .24960 2.3181[.028]
PCRESS -.18615 .16935 -1.0992[.281]
PCREES 1.7119 1.8377 .93154[.359]
R2 Squared: 0. 98650 R-Bar-Squared : 0. 98300 D-W Statistics: 2.0020
The estimated results of model 3 are given above in table 11. In
this model, the variables net state domestic product (NSDP),
per capita revenue expenditure on general services (PCREGS),
per capita revenue expenditures on social services (PCRESS)
and per capita revenue expenditures on economic services
(PCREES) are taken as determinants of public expenditure.
The model is found to be statistically fit with R Squared and R-
Bar-Squared being 0.98650 and 0.98300 respectively. The
presence of auto-correlation in the model was taken care of by
resorting to the C-O iterative method. All the variables are
statistically insignificant except per capita revenue expenditure
on general services (PCREGS) which is not only significant but
exerting a positive influence on public expenditure. The
constant and dummy variables are found to be negatively
insignificant.
The results of the model specification 4 estimated by
Cochrane-Orcutt Method (AR1) are given below in table 12.
Moon Moon Hussain- An Analysis of the Growth, Pattern and Determinants of
Public Expenditure in Assam
EUROPEAN ACADEMIC RESEARCH - Vol. II, Issue 2 / May 2014
2127
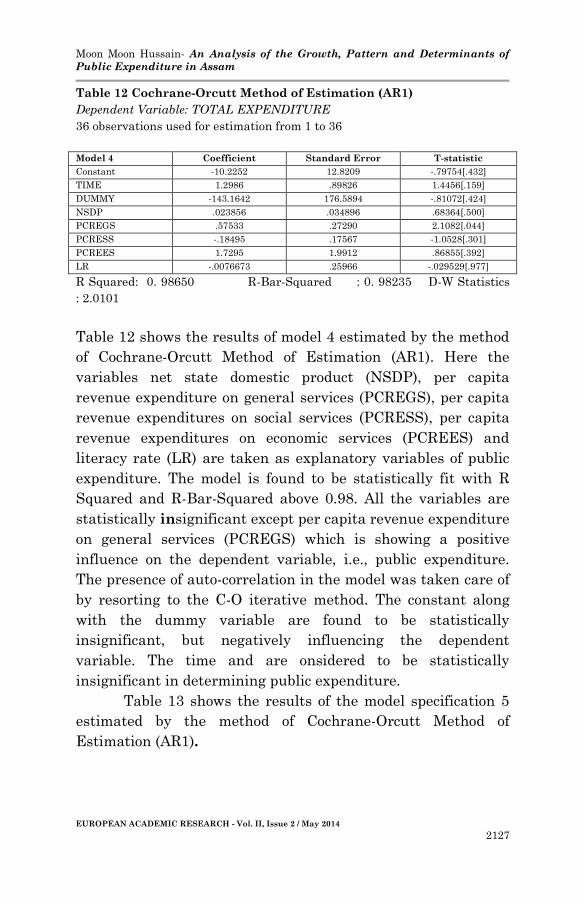
Table 12 Cochrane-Orcutt Method of Estimation (AR1)
Dependent Variable: TOTAL EXPENDITURE
36 observations used for estimation from 1 to 36
Model 4 Coefficient Standard Error T-statistic
Constant -10.2252 12.8209 -.79754[.432]
TIME 1.2986 .89826 1.4456[.159]
DUMMY -143.1642 176.5894 -.81072[.424]
NSDP .023856 .034896 .68364[.500]
PCREGS .57533 .27290 2.1082[.044]
PCRESS -.18495 .17567 -1.0528[.301]
PCREES 1.7295 1.9912 .86855[.392]
LR -.0076673 .25966 -.029529[.977]
R Squared: 0. 98650 R-Bar-Squared : 0. 98235 D-W Statistics
: 2.0101
Table 12 shows the results of model 4 estimated by the method
of Cochrane-Orcutt Method of Estimation (AR1). Here the
variables net state domestic product (NSDP), per capita
revenue expenditure on general services (PCREGS), per capita
revenue expenditures on social services (PCRESS), per capita
revenue expenditures on economic services (PCREES) and
literacy rate (LR) are taken as explanatory variables of public
expenditure. The model is found to be statistically fit with R
Squared and R-Bar-Squared above 0.98. All the variables are
statistically insignificant except per capita revenue expenditure
on general services (PCREGS) which is showing a positive
influence on the dependent variable, i.e., public expenditure.
The presence of auto-correlation in the model was taken care of
by resorting to the C-O iterative method. The constant along
with the dummy variable are found to be statistically
insignificant, but negatively influencing the dependent
variable. The time and are onsidered to be statistically
insignificant in determining public expenditure.
Table 13 shows the results of the model specification 5
estimated by the method of Cochrane-Orcutt Method of
Estimation (AR1).
Moon Moon Hussain- An Analysis of the Growth, Pattern and Determinants of
Public Expenditure in Assam
EUROPEAN ACADEMIC RESEARCH - Vol. II, Issue 2 / May 2014
2128
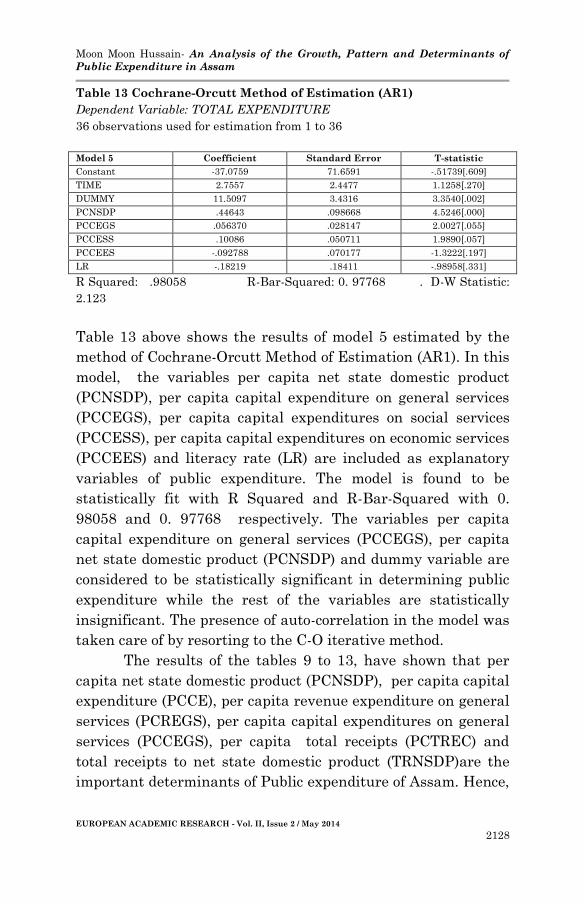
Table 13 Cochrane-Orcutt Method of Estimation (AR1)
Dependent Variable: TOTAL EXPENDITURE
36 observations used for estimation from 1 to 36
Model 5 Coefficient Standard Error T-statistic
Constant -37.0759 71.6591 -.51739[.609]
TIME 2.7557 2.4477 1.1258[.270]
DUMMY 11.5097 3.4316 3.3540[.002]
PCNSDP .44643 .098668 4.5246[.000]
PCCEGS .056370 .028147 2.0027[.055]
PCCESS .10086 .050711 1.9890[.057]
PCCEES -.092788 .070177 -1.3222[.197]
LR -.18219 .18411 -.98958[.331]
R Squared: .98058 R-Bar-Squared: 0. 97768 . D-W Statistic:
2.123
Table 13 above shows the results of model 5 estimated by the
method of Cochrane-Orcutt Method of Estimation (AR1). In this
model, the variables per capita net state domestic product
(PCNSDP), per capita capital expenditure on general services
(PCCEGS), per capita capital expenditures on social services
(PCCESS), per capita capital expenditures on economic services
(PCCEES) and literacy rate (LR) are included as explanatory
variables of public expenditure. The model is found to be
statistically fit with R Squared and R-Bar-Squared with 0.
98058 and 0. 97768 respectively. The variables per capita
capital expenditure on general services (PCCEGS), per capita
net state domestic product (PCNSDP) and dummy variable are
considered to be statistically significant in determining public
expenditure while the rest of the variables are statistically
insignificant. The presence of auto-correlation in the model was
taken care of by resorting to the C-O iterative method.
The results of the tables 9 to 13, have shown that per
capita net state domestic product (PCNSDP), per capita capital
expenditure (PCCE), per capita revenue expenditure on general
services (PCREGS), per capita capital expenditures on general
services (PCCEGS), per capita total receipts (PCTREC) and
total receipts to net state domestic product (TRNSDP)are the
important determinants of Public expenditure of Assam. Hence,
Moon Moon Hussain- An Analysis of the Growth, Pattern and Determinants of
Public Expenditure in Assam
EUROPEAN ACADEMIC RESEARCH - Vol. II, Issue 2 / May 2014
2129
we have decided to include all these important variables along
with some other variables in a single model to further verify
their significance. Accordingly, all these variables are included
as explanatory variables in model 14, and the model is
estimated by Cochrane-Orcutt method. The model is given
below.
PE = a0 + a1 NSDP + a2 DOP + a3 PCCE + a4 PCREGS + a5 PCCEGS +
a6 PCCEES + a7LR + a8 TREC + a9 PCRE + a10PCNDRE + t 11+ D12.
…… (6)
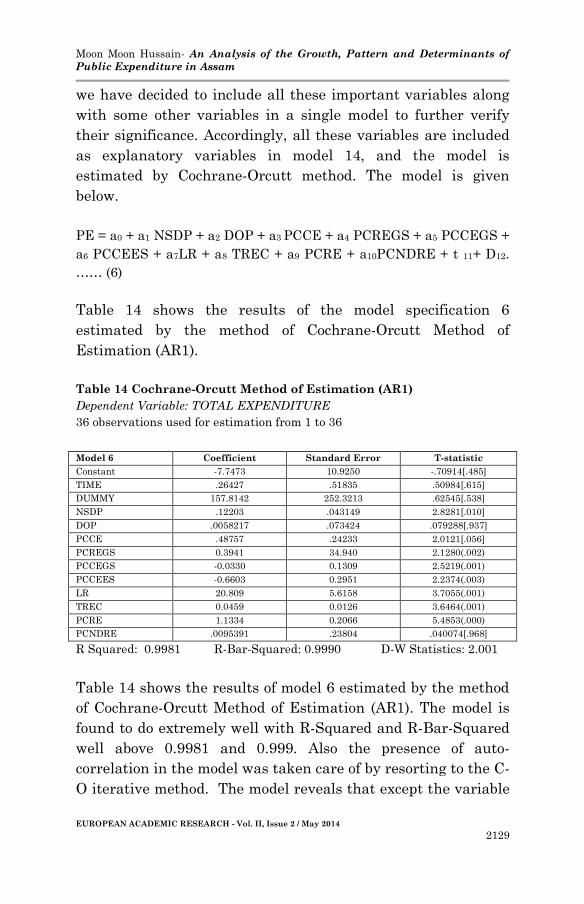
Table 14 shows the results of the model specification 6
estimated by the method of Cochrane-Orcutt Method of
Estimation (AR1).
Table 14 Cochrane-Orcutt Method of Estimation (AR1)
Dependent Variable: TOTAL EXPENDITURE
36 observations used for estimation from 1 to 36
Model 6 Coefficient Standard Error T-statistic
Constant -7.7473 10.9250 -.70914[.485]
TIME .26427 .51835 .50984[.615]
DUMMY 157.8142 252.3213 .62545[.538]
NSDP .12203 .043149 2.8281[.010]
DOP .0058217 .073424 .079288[.937]
PCCE .48757 .24233 2.0121[.056]
PCREGS 0.3941 34.940 2.1280(.002)
PCCEGS -0.0330 0.1309 2.5219(.001)
PCCEES -0.6603 0.2951 2.2374(.003)
LR 20.809 5.6158 3.7055(.001)
TREC 0.0459 0.0126 3.6464(.001)
PCRE 1.1334 0.2066 5.4853(.000)
PCNDRE .0095391 .23804 .040074[.968]
R Squared: 0.9981 R-Bar-Squared: 0.9990 D-W Statistics: 2.001
Table 14 shows the results of model 6 estimated by the method
of Cochrane-Orcutt Method of Estimation (AR1). The model is
found to do extremely well with R-Squared and R-Bar-Squared
well above 0.9981 and 0.999. Also the presence of auto-
correlation in the model was taken care of by resorting to the C-
O iterative method. The model reveals that except the variable

Moon Moon Hussain- An Analysis of the Growth, Pattern and Determinants of
Public Expenditure in Assam
EUROPEAN ACADEMIC RESEARCH - Vol. II, Issue 2 / May 2014
2130
per capita non development revenue expenditures (PCNDRE)
and density of population (DOP), all the other variables
included have been found statistically significant. The time and
dummy variable are found to be statistically insignificant. The
constant is found to be statistically significant and negatively
influencing public expenditure.
A cursory look of all the results reported in tables 9 to 14
reveals that out of six models estimated by Cochrane-Orcutt
Method of Estimation (AR1), all the models 1, 2, 3, 4, 5 and 6
performed well. They have reported high R2 and R2 of well
above 0.95 showing good statistical fit. All the results are free
from the problem of auto-correlation as they are estimated by
C-O procedure assuming first order auto-regressive scheme.
One striking feature of all the results is that, density of
population and per capita revenue expenditure on social
services are insignificant in determining public expenditure
while net state domestic product, per capita revenue
expenditures on general services , per capita revenue
expenditures on economic services, per capita capital
expenditure, per capita capital expenditure on economic
services, per capita total receipts, total receipts, per capital
expenditure on general services, total receipts to net state
domestic product, per capita net state domestic product and
literacy rate have fared very well indicating positive influence
on public expenditure.
Summary of Findings:
In the present study, an attempt has been taken to
analyse the growth, pattern and determinants of public
expenditure of Assam for thirty six year period, i.e., from
1973-74 to 2008-09. The study is conducted for time
series data pertaining to public expenditure of Assam.
The study reveals that total public expenditure both
under revenue and capital account have been growing

Moon Moon Hussain- An Analysis of the Growth, Pattern and Determinants of
Public Expenditure in Assam
EUROPEAN ACADEMIC RESEARCH - Vol. II, Issue 2 / May 2014
2131
and increasing tremendously during the period of the
study.
Revenue expenditures have been increasing
uncontrollably in absolute figures due to relentless
increase on salaries, wages, pensions, debt servicing,
financial support to PSU’s The capital expenditures
which is a very important fiscal instrument and forms
the foundation of economic development for an under
developed State like Assam has also been increasing, the
growth quantum of capital expenditures being 99.84
times which is higher than the growth quantum of
revenue expenditures being 86.73 times.. The annual
average growth rate of capital expenditures in these
thirty six years is 15912.68 per cent which is higher
than the growth rate of revenue expenditures which is
8573.82 per cent.
From the very beginning of our study, the plan
expenditures have always been higher than the non-plan
expenditures not only in terms of absolute figures but
also as percentage to total expenditures. The analysis
reveals that throughout the period of our study, the
state government of Assam has been giving more
importance and stress on social and economic services
which has undoubtedly contributed to the significant
progress of the state. But it has not been able to
alleviate poverty and generate employment as a whole.
Though agriculture and industries consume a major
portion of the plan expenditure, industrial production
and productivity have remained one of the lowest in
India. The non plan expenditures also increased mainly
because of excessive expenses to deal with emergencies
like yearly floods and draughts, influx, infiltration,
militancy, terrorism and law and order problems.
A general pattern of the objectives of public expenditure
had been formulated by taking into account the different

Moon Moon Hussain- An Analysis of the Growth, Pattern and Determinants of
Public Expenditure in Assam
EUROPEAN ACADEMIC RESEARCH - Vol. II, Issue 2 / May 2014
2132
services like economic services, general services, social
and community services already available in the State.
The sector-wise growth of capital expenditures is much
less than the sector-wise growth rates of revenue
expenditures. However it cannot be denied that the
sector-wise analysis shows that revenue and capital
expenditures have grown manifold times during the
period of our study which has definitely contributed to
the tremendous growth of public expenditure in Assam.
In order to find out the determinants of public
expenditure of Assam, six multivariate linear regression
models have been used which were estimated by OLS.
Since the results of these models showed the presence of
auto correlation, the Cochrane-Orcutt method was used
to estimate the parameters of the models to rectify this
problem. The results of the analysis showed that net
state domestic product, literacy rate, per capita revenue
expenditure on general services, per capita revenue
expenditure on economic services, per capita capital
expenditure on economic services, total receipts, per
capita capital expenditure and per capita revenue
expenditure were the main determinants of public
expenditure in Assam.
The analysis of the results show that the formulated
hypothesis, i.e., there is a direct relationship between
the level of public expenditure and level of NSDP was
proved to be correct as NSDP variable was found to be
statistically significant in determining public
expenditure of Assam.
The analysis of the results also show that the formulated
hypothesis , i.e., changes in Consumer Price Index (CPI)
influence the level and quantum of public expenditure
was proved to be incorrect as the variable CPI was
found to be statistically insignificant in determining
public expenditure of Assam.
Moon Moon Hussain- An Analysis of the Growth, Pattern and Determinants of
Public Expenditure in Assam
EUROPEAN ACADEMIC RESEARCH - Vol. II, Issue 2 / May 2014
2133
Further, the analysis of the results also show that the
formulated hypothesis, i.e., the growth of public
expenditure and the quantity of public services provided
bear a functional relationship was proved to be correct
as depicted by the statistically significant variables
namely per capita revenue expenditure on general
services (PCREGS), per capita capital expenditures on
general services (PCCEGS) and per capita capital
expenditures on economic services (PCCEES).
Concluding Remarks:
Since the commencement of planning in India, there has been a
very rapid growth of expenditure in the state of Assam. Much
fund has flowed from the Assam government exchequer into the
state’s economy in the period of our study. However, such
massive budgetary expenditure notwithstanding, the benefits
could not flow equitably in the desired directions. The revenue
expenditure of the state has disproportionately increased while
the proportion of capital outlay has gradually been on the
decline. The state budget of Assam has been experiencing huge
deficits in recent years due to the gap in gross receipts and
gross expenditures. With the enormous expansion of social and
development services and all other activities of the state
government under the impact of planning widened. After five
decades of ‘planning and development’, Assam, which was all-
India average in terms of per-capita SDP at the beginning of
the First Plan, is now one of the most backward states in the
country judged by the indicators of development. It is true that
present Assam Government has inherited the financial crisis
from its predecessor. As such it becomes essential to carry out
certain fiscal reforms followed out by other States like
Maharashtra, Kerala and Madhya Pradesh. Temporary
palliatives such as doubling the Ways and Means advances,
devolution of more revenue from the divisible pool and
Moon Moon Hussain- An Analysis of the Growth, Pattern and Determinants of
Public Expenditure in Assam
EUROPEAN ACADEMIC RESEARCH - Vol. II, Issue 2 / May 2014
2134
increased monthly installments of Central plan fund allocations
will not be enough. It has to be recognized by all concerned that
the real problem is the present mismatch between the total
expenditure and total receipts which needs to be bridged.
The phenomenal growth of public expenditures has no
doubt resulted in striking development in the State of Assam in
the recent years. However it is indeed common for the people to
regret the increase in public expenditures. As such various
public expenditure management policies have been introduced
from time to time to restrict its growth. Prevention of any
further increases in government expenditures would require
the halt all changes in our technology and our institutions, the
acceptance of an inadequate scale of public services, etc.
Instead there is every reason to believe that such expenditures
will continue to increase and the inevitability of the increase
should be recognized and accepted.
REFERENCES:
Burhhead, Jesse and Miner, Jerry. 1971. Public Expenditure.
London: Macmillan.
Bhargava, R.N. 1967. The Theory and Working of Union
Finance in India. Allahbad: Chaitanya Publishing
House.
Bhuyan, Prafulla. Kumar. 1977. State Finances of Assam
Government during the Plan Period. Ph.D. thesis,
Dibrugarh University, Dibrugarh.
Bhuyan, Prafulla. Kumar. 1984. Regional Fiscal Economies of
Assam. Allahbad: Chugh Publications.
Bhat, Sham K. and Varalakshmi, S. 1994. “The Impact of
Political Economy on Public Expenditure in Indian
States.” The Indian Journal of Economics LXXIV(295):
407-415.
Dar, Usha. 1964. Public Expenditure Control. Allahbad:
Moon Moon Hussain- An Analysis of the Growth, Pattern and Determinants of
Public Expenditure in Assam
EUROPEAN ACADEMIC RESEARCH - Vol. II, Issue 2 / May 2014
2135
Chaitanya Publishing House.
Fabricant, Solomon. 1952. “The Trend of Government Activity
in the United States since 1900.” New York: National
Bureau of Economic Research.
Dhar, P.K. 1981. Financing Assam’s Plan. Ph.D thesis, Gauhati
University, Guwahati.
Dhar, P.K. 1987. The Economy of Assam Including Economy of
North-East India. Ludhiana: Kalyani Publishers.
Das, Bhakta. 1992. Unemployment in Assam. New Delhi:
Cosmo Publications.
Datta, Ray B. and Agarwal, S.P. 1996. Reorganization of North-
East India since 1947. New Delhi: Concept Publishing
House.
Deb, Bimal. 2002. Development Priorities in Northeast India.
New Delhi: Concept Publishing Company.
Das, H.N. 2003. “The Present Financial Crisis in Assam.”
Dialogue Quarterly, A Journal of Astha Bharati 4(1): 85-
101.
Das, H.N. 2003. “Good Governance in Assam: The Need for
Fiscal Responsibility Legislation.” Dialogue Quarterly, A
Journal of Astha Bharati V (4): 65-71.
Dhar, P.K. 2005. The Economy of Assam Including Economy of
North-East India. Ludhiana: Kalyani Publishers.
Gujrati, Damodar N. 2009. Basic Econometrics. McGraw-Hill,
Inc.
Hussain, M.M. 2013. Public Expenditure of Assam: An
Empirical Analysis. EBH Publishers.
Hussain, M.M. 2013. “Determinants of Public Expenditure in
Assam: An Econometric Study.” IJBMEIT 4(2): 141-156.
Lewis, A. Rice. 1965. The Theory of Economic Growth. London:
Richard D. Irwin, pp.403.
Mithani, D.M. 1985. Money, Banking, International Trade and
Public Finance. Mumbai: Himalaya Publishing House,
pp. 932-945.
Mishra, B. and Suresh, P.S. 2005. “Political Economy of Public
Moon Moon Hussain- An Analysis of the Growth, Pattern and Determinants of
Public Expenditure in Assam
EUROPEAN ACADEMIC RESEARCH - Vol. II, Issue 2 / May 2014
2136
Expenditure Growth in North-Eastern States of India: A
Case Study of Nagaland.” Asian-African Journal of
Economics and Econometrics 5(1): 17-33.
Nongbri, E. 2002. Growth, Pattern and Determinants of Public
Expenditure in Meghalaya, Ph.D Thesis, North Eastern
Hill University, Shillong.
Peacock, A.T. and Wiseman. 1961. The Growth of Public
Expenditure in United Kingdom. Princeton University
Press.
Sandford, C. 1984. Reasons for growth in Government
Spending. Economics of Public Finance, Pergamon
Press.
Sarma, Atul and Tulasidhar, V.B. 1984. Government
Expenditures as an Instrument for Utilizing Excess
Capacities. New Delhi: Concept Publishing Company,
pp.145-158.
Singh, M.P. 1988. Economies of Government Expenditure
Growth. Reliance Publishing House, pp. 117-121.
Singh, Gulab. 1997. “Wagner’s Law- a Time-Series Evidence
from the India’s Economy.” The Indian Journal of
Economics LXXVII(306): 349-356.
Wagner, Adolph. 1983. “Finanzwissenschaft.” In Fiscal
Systems, edited by Richard A. Musgrave, 4-16. London:
Yale University Press.
Zahir, Mohammed. 1972. Public Expenditure and Income
Distribution in India. New Delhi: Associated Publishing
House.