an analysis of the effect of lowered basic test battery selection ... · •...
TRANSCRIPT

AN ANALYSIS OF THE EFFECT OFLOWERED BASIC TEST BATTERY SELECTION SCORES
ON REPHASALS AND DISENROLLMENTS ATSELECTED COAST GUARD CLASS A SCHOOLS
Daniel E. Kal letta


GHOOL
Monterey, Californi
THESA?; ANALYSIS 0? THE EFFECT OF LOWERED BASIC 1
mT7c; T BATTERY SELECTION SCORES ON REPHASALSAND DISENROLLI^/IENTS AT S
COAST GUARD CLASS A S
Daniel E. Kallstt
December 197S
ELECTEDCHCOLS
a
Thesis Advisor: J.K. Arima
Approved for public release ; distribution unlimited
T18 62i


SECURITY CLASSIFICATION OF THIS PAGE f^timn Oala Bnl»r»d)
f
REPORT DOCUMENTATION PAGE READ INSTRUCTIONSBEFORE COMPLETWG FORM
1. MEPORT NUMBER 2. GOVT ACCESSION NO. 1. RECIPIENT'S CATALOG NUMBER
4. TITLE (and Sublltim)
An Analysis of the Effect of LoweredBasic Test Battery Selection Scores onRephasals arid Disenrollments at SelectedCoast Guard Class A Schools
5. TYPE OF REPORT ft PERIOD COVERED
Master's ThesisDecember 1978
«. PERFORMING ORG. REPORT NUMBER
7. AUTmORC«>
Daniel E. Kalletta
• . CONTRACT OR GRANT HUMSERCaj
• . PERFORMINO OROANIZATION NAME AND ADDRESS
Naval Postgraduate SchoolMonterey, California 939^0
to. PROGRAM ELEMENT, PROJEC-, TASKAREA « WORK UNIT NUMBERS
11. CONTROLLING OFFICE NAME AND ADDRESS
Naval Postgraduate SchoolMonterey, California 939^0
12. REPORT DATE
December, 197813. NUMSER OF PAGES
5114. MONITORING AGENCY NAME * A00RE5S<'(r (HUtrmtt /ran Conlfollint Ome9)
Naval Postgraduate SchoolMonterey, California 939^0
IS. SECURITY CLASS, lol tht* ripon)
UnclassifiedtS«. DECLASSIFICATION' DOWNGRADING
SCHEDULE
16. DISTRIBUTION STATEMENT (ol tttit R*part)
Approved for public release distributiorL unlimited.
17. DiSTRiauTION STATEMENT (ol tA« aMatrmcl wnfnd In Bto<k 30, II dlUmrmtt trmm Rap«rfJ
IS. SUPPLEMENTARY NOTES
14. KEY WORDS (Caniinu* on r*v9ra« tid* II n«c«a««rr aid ldt\tltr ^ block nimiit)
Coast GuardClass A SchoolsClass A trainingAcademic attrition
AttritionDisenrollmentRephasal
Enlisted trainingTechnical trainingBasic Test Battery Scores
'raining
20. ABSTRACT (Contlmf an rovtram »ld» 11 nmcfury and Idmnlltr by bld<M ntmib^e)
This thesis investigates and evaluates the effect of loweredBasic Test Battery (3TB) selection scores on rephasals and dis-enrollments at selected Coast Guard Class A schools. It analyzesthe differences in rephasal rate and disenrollment rate forStorekeeper, Subsistence Specialist, and Radioman Schools forthe year prior to (FY 1976) and the year after (FY 1977) thelowering of the BTB selection scores (which occurred in July, 197(
DO , :°r., 1473(Page 1)
EDITION OF t NOV SS IS OBSOLZTCS/N 0102-014* 6«0l I
SECURITY CLASSIFICATION OF THIS PAO€ (Whan Data «i»««


tgeu>WTV CL AHiriOTlQN or TwiS »40KfW».«w n»im Kmitf^d
It compares the performance of students entering these schoolswith the lower BTB scores with those students entering withthe higher BTB scores during FY 1977 • In addition, it an-alyzes the relationship "between the successful comipletion ofthese schools and the BTB selection scores.
The results indicate that students with BTB scores lowerthan the earlier (higher) cutoff tend to have higher re-phasal and disenrollment rates than students with the higherBTB scores. If the input percentage of the lower-scoringstudents should increase, there is likely to be a significantincrease in both the rephasal and disenrollment rates forall three schools.
DD Form 14731 Jan 73
3/ N 0102-014-6601 2 jicu^fv ctAMirieATiow o' "'x'* ^^ok''''''*'' o«'* '"'•'•*'


Approved for public release; distribution unlimited.
An Analysis of the Effect of Lowered Basic Test Battery
Selection Scores on Rephasals and Disenrollraents
at Selected Coast Guard Class A Schools
by
Daniel E. KallettaLieutenant, United States Coast Guard
B.S., United States Coast Guard Academy, 1971
Submitted in partial fulfillment of therequirements for the degree of
r/IASTER OF SCIENCE IN MNAGEr/EENT
from the
NAVAL POSTGRADUATE SCHOOLDecember 1978


ABSTRACT
This thesis investigates and evaluates the effect of
lowered Basic Test Battery (BTB) selection scores on re-
phasals and disenrollments at selected Coast Guard Class A
schools. It analyzes the differences in rephasal rate and
disenrollment rate for Storekeeper, Subsistence Specialist,
and Radioman Schools for the year prior to (FY 1976) and
the year after (FY 1977) the lov/ering of the BTB selection
scores (which occurred in July, 1976) . It compares the
performance of students entering these schools with the
lower BTB scores with those students entering with the
higher BTB scores during FY 1977. In addition, it analyzes
the relationship "between the successful completion of these
schools and the BTB selection scores.
The results indicate thai: students with BTB scores low-
er than the earlier (higher) cutoff tend to have higher re-
phasal and disenrollment rates than students with the
higher BTB scores. If the input percentage of the lower-
scoring students should increase, there is likely to be a
significant increase in both the rephasal and disenrollment
rates for all three schools.
k


TABLE OF CONTENTS
I. INTRODUCTION 8
A. BACKGROUND 8
B. PURPOSE .11
C. DATA COLLECTION 12
D. ANALYSIS METHODOLOGY 12
E. CONCLUSIONS 1^
II. STUDY O^rE 16
A. METHODOLOGY 16
B. RESULTS 18
1. Means and Standard Deviations 18
2. Analysis of Variance 18
C. Sm/IMARY 21
III. STUDY TWO 23
A. IVIETHODOLCGY 23
B. RESULTS AND DISCUSSION 2?
1. Analysis of Students by BTB SelectionScore 27
2. Regression Analysis 32
a. All Schools 3^
b. Storekeeper School 37
c. Subsistence Specialist School ^0
d. Radioman School ^•3
C. SUT/IMARY ^5
IV. CONCLUSIONS ^8
BIBLIOGRAPHY 50
INITIAL DISTRIBUTION LIST 51
5

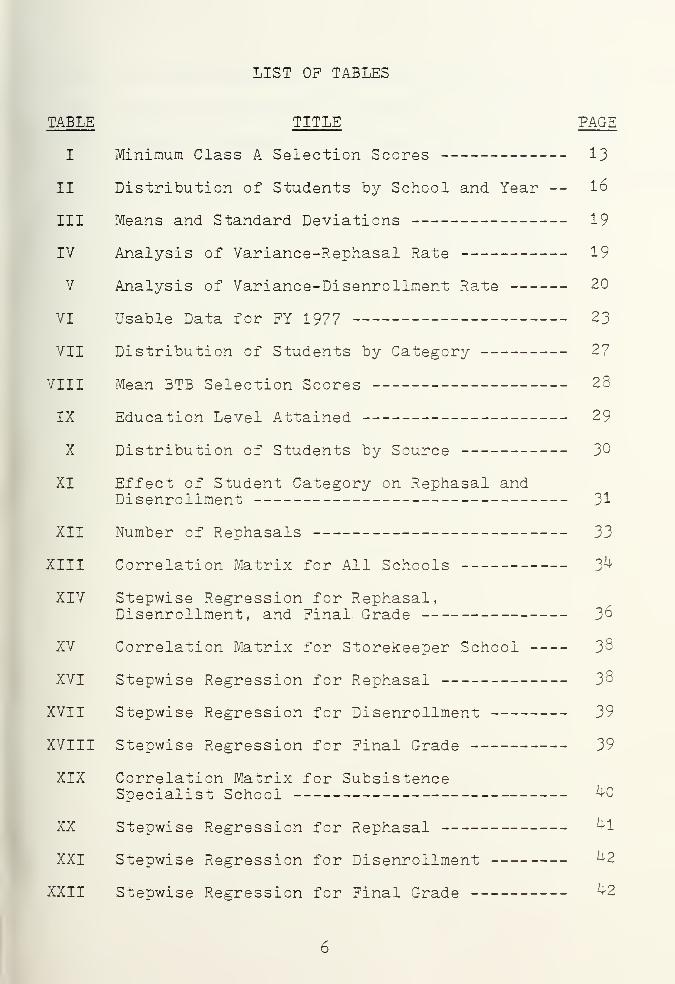
LIST OF TABLES
TABLE TITLE PAGE
I Minimum Class A Selection Scores 13
II Distribution of Students by School and Year -- l6
III Means and Standard Deviations 19
IV Analysis of Variance-Rephasal Rate 19
V Analysis of Variance-Disenrollment Rate 20
VI Usable Data for FY 1977 23
VII Distribution of Students by Category 27
VIII Mean BTB Selection Scores 28
IX Education Level Attained 29
X Distribution of Students by Source 30
XI Effect of Student Category on Rephasal andDisenrollment 31
XII Number of Rephasals 33
XIII Correlation Matrix for All Schools 3^
XIV Stepwise Regression for Rephasal,Disenrollment, and Final. Grade 3^
XV Correlation Matrix for Storekeeper School 33
XVI Stepwise Regression for Rephasal 38
XVII Stepwise Regression for Disenrollment 39
XVIII Stepwise Regression for Final Grade 39
XIX Correlation Matrix for SubsistenceSpecialist School ^0
XX Stepwise Regression for Rephasal ^1
XXI Stepwise Regression for Disenrollment "^2
XXII Stepwise Regression for Final Grade ^2


XXIII Correlation Matrix for Radioman School ^3
XXIV Stepwise Regression for Rephasal ^4
XXV Stepwise Regression for Disenrollment 14-^
XXVI Stepwise Regression for Final Grade ^5
7


I. INTRODUCTION
A. BACKGROUND
The primary objective of Class A training in the
United States Coast Guard is to meet manpower training
requirements at the technical speciality level. With the
increasing technological demands of the Coast Guard, more
trained personnel are "becoming a necessity. Class A train-
ing also assists in fulfilling the Coast Guard's obligation
to provide career opportunities for its enlistees. Without
a speciality a career is impossible. In a study (Muldrow,
1969) conducted for the U.S. Navy, it was discovered that
the opportunity to obtain technical training was one of
the major personal reasons influencing enlistment into the
Armed Forces. Considering these points, the Coast Guard
had to ensure that a steady influx of Class A school eligi-
ble personnel would be available to meet its service
requirements
.
Prior to the implementation of the All-Volunteer Force
(AVF) this was not a major problem; in fact, the Coast
Guard enjoyed a rather favorable recruiting and selection
climate. However, with the advent of the AVF and the at-
tention that was given to insuring that all individuals in
the Coast Guard had equal opportunities for training and
advancement, it was anticipated that Class A school selec-
tion standards would have to be modified to accommodate
8


less qualified personnel. These standards as stated in the
Coast Guard Personnel Manual (CG-3II) require that a Class A
school applicant meet:
1) The minimum Basic Test Battery scores required by
the school.
2) Any special physical requirements (normal hearing,
color perception, etc.) required by the school.
3) Appropriate action to obtain the security clearance
required by the school.
Of these requirements, a combination of the test scores
attained on the Basic Test Battery is the primary selection
tool utilized for personnel assignment to Class A training.
The Basic Test Battery (BTB) consists of five tests
administered to incoming recruits at Recruit Training
Centers. These fivs tests include the:
1) General Classification Test (GCT) which measures
the ability to understand words and the relationships
between them.
2) Arithmetic Test (ARI) which measures the ability
to use numbers and apply mathematical reasoning in prac-
tical problems.
3) Mechanical Test (MECH) which measures some aspects
of mechanical and electrical knowledge in addition to the
ability to understand mechanical principles.
4) Clerical Test (CLR) which measures the ability to
observe rapidly and accurately.


5) Electronics Technican Selection Test (ETST) deter-
mines abilities specifically related to successful comple-
tion of electronics type" training.
A Coast Guard study (West, _et al. , 1975) addressed the
subject of the validity of the BTB composites utilized as
selection score standards for Class A schools. The study
examined BTB scores and performance data for students at-
tending 10 selected Coast Guard Class A schools during
fiscal year (FY) 1973. It was determined that the BTB was
a reliable predictor of performance at these 10 schools.
Through regression analysis alternate selection composites
considered more effective were identified for many of the
schools
.
Another study (Lang, 1976) conducted by the Coast
Guard evaluated the effectiveness of selection tests in
predicting performance at Class A schools. The particular
school examined was the Machinery Technician School (r/K) .
Lang analyzed the validity of both the BTB and Armed Forces
Vocational Aptitude Battery (ASYAB) in predicting perform-
ance at MK School. The data utilized was collected from
13^ students attending this school during the last part of
FY 197^ and the beginning of FY 1975- The study revealed
that the BTB and ASVAB are valid predictors of performance
at MK School. Also, new selection composites for MK school
were presented.
10


From the information gathered through the alDove-
mentioned studies, lower BTB selection composites were
established. These new composites were determined by the
personnel working at the Psychological Research Center at
the Office of Personnel located at Coast Guard Headquarters
in Washington, D.C. IVIr. Joseph Cowan, head of the Research
Center, stated that the lower selection scores were arrived
at "by extending the regression lines determined by Lang
and West, et al . The present and previous selections
scores are shown in Table I
.
The lowering of the selection scores had a positive
effect on the Glass A eligible population. Specifically,
the overall population eligibility increased from S^% "to
QOfo while the qualified disadvantaged went from lOfo to 50^.
B. PURPOSE
Since the implementation of the lower selection stand-
ards for Class A schools, no research has been conducted to
evaluate the effect of lower selection scores on rephasals
and disenrollraents . It is the opinion of the Coast Guard
Training Centers that rephasals and disenrollments have
increased and that students of lower ability are requiring
more attention. No data has been produced to support or
disprove this opinion. This study was undertaken to in-
vestigate and evaluate the effects of lowered selection
scores on rephasals and disenrollments. Attention v/as
11


also given to the outcome of students entering with the
lower selection scores.
C. DATA COLLECTION
The data utilized in this study were collected from
the Storekeeper School, Subsistence Specialist School, and
Radioman School, all located at Petaluma, California. The
time period included one year prior to (FY 1976) and one
year after (FY 1977) the lowering of the selection scores
(which occurred in July, 1976). For FY 1976 the data was
collected from the Weekly Training Reports issued by the
individual schools and included the number of students per
class, number of rephasals per class, number of disenroll-
raents per class, and the number of graduates per class.
The FY 1977 data was on individual students and gathered
from Student Classification Sheets, Class Convening Ros-
ters, and Graduation Statistic Sheets. Variables included
the student's class, number of rephasals, disenrollment
,
BTB scores, education level completed, source (field or
boot camp), and final grade.
D. ANALYSIS METHODOLOGY
The Statistical Package for the Social Sciences (SPSS)
on the IBM 360 Computer System located at the Naval Post-
graduate School was utilized to accomplish the statistical
calculations required in this study. Study One analyzed
the data provided by class. The means and standard
12


TABLE I
MINIMUM CLASS A SELECTION SCORES
RATING
DC
DT
ET
ETN
FT
GM
HM
MK
MST
RD
RM
ST
SK
SS
TT
YN
AE
AT
AD
AM
ASM
QM
EM
PREVIOUS SCORES
GCT+ARI=105
GCT+ARI=100
GCT+ARI+ETST=170
GCT+ARI+ETST=170
GCT+ARI+ETST=170
ARI+MECH=100
GCT+ARI=100
ARI+MECH=105
GCT+ARI+CLER=l65
GCT+ARI=105
GCT+ARI=100
ARI+2X ETST=171
GCT+ARI=105
GCT+ARI=100
GGT+ARI+ETST=170
GCT+ARI=105;CLER=55
ARI+2X ETST =l60
GCT+ARI+ETST=170
ARI+MECH-110
ARI+MECH=105
GCT+MECH=105
PRESENT SCORES
GCT+ARI=90
GCT+ARI=90
GCT+ARI+ETST=155
GCT+ARI+ETST=155
NO CHANGE
GCT-^MECH=90
GCT+ARI=90
GCT+MECH=90
GCT+ARI+CLER=150
GCT+ARI=90
GCT+ARI=90
NO CHANGE
GCT+ARI=90
GCT+ARI=90
GCT+ARI+ETST=155
GCT+ARI=90;CLER=50
NO CHANGE
GCT+ARI+ETST=155
ARI+MECH=100
NO CHANGE
NO CHANGE
GCT+ARI+CLER=l65;CLER=50 GCT+ARI+ETST=l65 ;55 IN EACH
ARI+MECH=105 ARI+]VECH=90
13


deviations for the rephasal rates and disenrollment rates
were calculated for each school for FY's 1976 and 1977.
This data was tested to ensure that it meet the criteria
for an analysis of variance (which it did) . An analysis
of variance was accomplished for "both the rephasal rates
and disenrollment rates with the main effects being school
and year.
Study Two focused on the analysis of the data collected
on individual students. The purpose of this study was to
investigate and evaluate the outcome of the students enter-
ing with the lower 3TB scores. This analysis was accom-
plished by analyzing the effect that these students had
on rephasals and disenrollments . Also, a stepwise regres-
sion was carried out for all the schools together and each
school individually. Of primary interest was the relation-
ship between the 3TB selection scores and the three depend-
ent variables, rephasal, disenrollment, and final grade.
Other variables included school, source, education level
completed, and quarter in which a student starxed a school.
E. CONCLUSIONS
From the analysis completed in Study One it was deter-
mined that lowering the BTB selection score had a small but
statistically significant effect on rephasal rate but not
disenrollment rate. Through the results of Study Two it
was shown that students entering Storekeeper, Subsistence
m'

Specialist, and Radioman Schools with lower BTB scores had
a greater incidence of rephasals and disenrollments
.
During FY 1977 l/3 of the students attending these schools
entered with lower BTB selection scores than those in ef-
fect prior to July, 1976. If the input percentage of these
students increased there should be a significant increase
in both the rephasal and disenrollment rates for these
schools
.
15


II. STUDY ONE
A. METHODOLOGY
The purpose of Study One was to investigate and evaluate
the effect that lowering the BTB selection scores for en-
trance to Class A schools had on rephasals and disenroll-
ments. The data utilized was collected by class, and a
breakdown by school and fiscal year is provided in Table II.
TABLE II
SCHOOL NUT/BER OF CI.^SSES NUr-/IBER OF CLASSES
FY 1976 FY 1977
STOREKEEPER 13 13
SUBSISTENCE SPECIALIST 12 12
RADIOMAN 13 12
The variables utilized were:
1) Rephasal Rate - defined as the number of rephasals
(not the number of students rephased) per total number of
students. In other words, if a student was rephased three
times this would be equivalent to three rephasals. Defining
the rephasal rate in this manner was required be&ause the
data collected for FY 1976 was by class.
2) Disenrollment Rate - defined as the number of
students disenrolled per total number of students.
3) School - defined as -the three schools, Storekeeper
School, Subsistence Specialist School, and Radioman School,
from which the data was collected.
16

^') Year - defined as the year prior to or after the
BTB selection standards were lowered. The prior year was
FY 1976 and the year after was FY 1977.
The first task of this study was to determine the basic
distributional characteristics of each of the variables to
be used in the subsequent statistical analysis. Informa-
tion on the distribution, variability, and central tenden-
cies of the variables was calculated utilizing the SPSS
system. This data was evaluated to ensure that it met the
necessary conditions for a Two-way Analysis of Variance.
The next task was to isolate and identify the percent-
age of variation in the rephasal rate and disenrollment
rate (dependent variables) due to the different schools and
years {independent variables). A similar but separate
analysis was accomplished for each of the dependent vari-
ables. The 2x3 factorial design utilized ^/vas as follows:
Independent Variable and Category
School
:
1) Storekeeper
2) Subsistence Specialists
3) Radioman
Year
:
1) FY 1976
2) FY 1977
The first step in this analysis was to determine
whether the two factors, school and year, as a whole as
17

well as individually have a statistically significant effect
on the variation in either the rephasal rate or disenroll-
ment rate. In conjunction with this the proportion of
variance due to each factor was determined. The next step
was to examine whether the interaction effect (school x
year) was significant. Through this analysis, it could be
determined whether the school, year, or both had an effect
on rephasal rate or disenrollment rate.
B. RESULTS
1
.
Means and Standard Deviations
The means and standard deviations for the rephasal
and disenrollment rates are shown by school and year in
Table III.
2. Analysis of Variance
A Two-way Analysis of Variance was conducted to
evaluate the effect of year and school on rephasal rate.
The results are shown in Table IV.
In Table IV the joint effect and individual main
effects are both significant while the interaction effect
is of marginal significance. This marginal significance
might prove either significant or insignificant if a larger
sample was utilized. To speculate on this near-signifi-
cance is unwise; therefore, in this analysis the inter-
action was considered not significant. Because there is
no significant interaction, the effects of the two factors
18


TABLE III
SCHOOL YEAR (FY) REPHASAL RATE DISENROLLMENT RATEMEAN STD DEV MEAN STD DEV
STOREKEEPER 1976 .061 .059 .038 .040
1977 .180 .156 .056 .058
TOTAL .120 .130 .047 .050
SUBSISTENCE 1976 .142 .102 .134 .097
1977 .l'^3 .107 .140 .090
TOTAL .142 .102 .137 .092
RADIOMAN 1976 .673 .179 .208 .116
1977 .849 .208 .219 .070
TOTAL .760 .208 .214 .095
1976 TOTAL .298 .305 .127 .113
1977 TOTAL .385
TABLE IV
.365 .136 .099
ANALYSIS OF VARIANCE - REPHASAL RATE
SOURCE OFVARIATION
SUM OFSQUARES
DF MEANSQUARE
F SIGNIFOF F
MAIN EFFECTS 6 793 3 2. 264 109. 159 0.000
SCHOOL 650 2 3- 325 160. 297 0.000
YEAR 182 1 0. 182 8. 765 0.004
2-WAY INTERACTIONS
SCHOOL X YEAR .093 2 047 2. 247 0.113
EXPLAINED 6 .886 5 1 377 66. 394 0.000
RESIDUAL 1 .431 (S9 021
TOTAL 8 .317 ^^4 112
19


on rephasal rate are independent. Consequently, it is
possible to make statements about the effects of each of
the factors without having to refer to the other. From
Table III it can be seen that the rephasal rate increased
for all schools in FY 1977 • The joint effect accounts for
81.7% (6.793/8.317) of the variation in the rephasal rate.
The school factor explains about 79-9?^ of the variation in
rephasal rate, while the year factor explains about Z.lfo.
The total explained variation was 82.3% while the unex-
plained variation (residual) was 17.2%.
The results of the Two-way Analysis of Variance
comDleted on the disenrollment rate is shown in Table V.
TABLE V
ANALYSIS OF VARIANCE - DISENROLLMEN^r RATE
SOURCE OF SUM OF DF MEAN F SIGNIFVARIATION SQUARES SQUARE OF F
MAIN EFFECTS 0.357 3 0.119 17.^90 0.000
SCHOOL 0.355 2 0.117 26.110 O.COO
YEAR 0.003 1 0.003 0.376 0.5^2
2-WAY INTERACTIONS
SCHOOL X YEAR 0.000 2 0.000 0.029 0.971
EXPLAINED 0.357 5 0.071 10.506 0.000
RESIDUAL 0.^69 69 0.007
TOTAL 0.826 74 0.011
20


From Table V it can be determined that the joint
effect is significant while the interaction is not. Be-
cause there is no significant interaction effect the two
main factors can be considered independently. Of the two
main factors, only the school factor is significant in ex-
plaining variation in the disenrollment rate. The year
factor is not significant, as indicated by the F test
probability of 0.5^2. From Table III it can be seen that
the disenrollment rate increased for all three schools for
FY 1977. The joint effect explains k^.Zfo of the variation
in disenrollment rate with the school factor accounting for
k2.9fo of this variation. The total explained variation is
^'}.2fo and the unexplained variation is 56.8^.
C . SUMMARY
Through the analysis of the data collected for this
study, it was determined that the lowering of xhe Class A
selection scores did have a significant effect on rephasal
rate but not on disenrollment rate. From Table IV it can
be seen that botli the school and year factors are signifi-
cant in predicting rephasal rate. However, the school
factor explains 79-9^ of the variation in rephasal rate
while the year factor only explains 2.1%. Concerning dis-
enrollment rate, Table V indicates that the school factor
is significant in predicting disenrollments but the year
factor is not. For both these rates the interaction effect
21


is not significant; therefore, each factor can be consid-
ered independently of the other. An examination of this
information indicates that while the school a student at-
tends will have a significant effect on both the rephasal
and disenrollment rates, the year a student attends, either
prior to or after the lowering of the selection scores, has
an effect on only the rephasal rate. This effect, however,
is relatively small.
22

III. STUDY TWO
A. METHODOLOGY
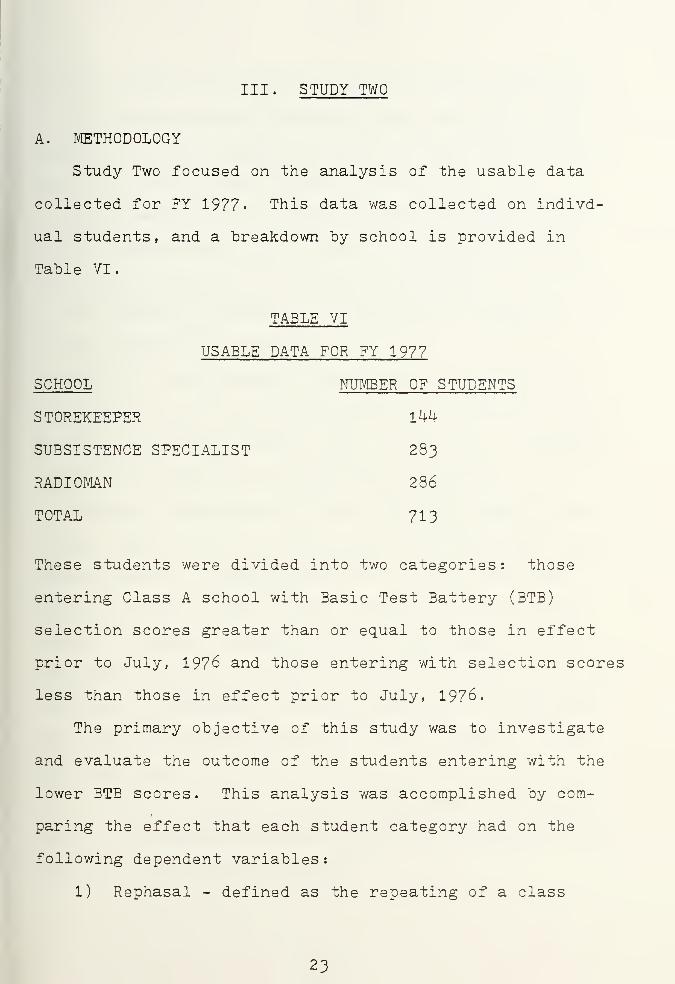
Study Two focused on the analysis of the usable data
collected for FY 1977' This data was collected on indivd-
ual students, and a breakdown by school is provided in
Table VI.
TABLE VI
USABLE DATA FOR FY 1977
SCHOOL NUTffiER OF STUDENTS
STOREKEEPER m,i^
SUBSISTENCE SPECIALIST 283
RADIOMAN 286
TOTAL 713
These students were divided into two categories: those
entering Class A school with Basic Test Battery (BTB)
selection scores greater than or equal to those in effect
prior to July, 1976 and those entering with selection scores
less than those in effect prior to July, 1976.
The primary objective of this study was to investigate
and evaluate the outcome of the students entering with the
lower BTB scores. This analysis was accomplished by com-
paring the effect that each student category had on the
following dependent variables
:
1) Rephasal - defined as the repeating of a class
23


because of academic, administrative, or medical problems.
2) Rephasal Rate - defined as the number of students
rephased per total number of students (note: the rephasal
rate for Study One was defined differently)
.
3) Disenrollment - defined as attrition from a school.
^) Disenrollment Rate - defined as the number of stu-
dents disenrolled per total number of students.
5) Number of Rephasals - defined as the number of
times a student had rephased.
A profile of the entering students was prepared for each
individual school to provide background information. The
background variables studied were divided into two groups,
nuisance variables and the BTB selection scores.
Nuisance variables were those which might have an im-
portant impact on the previously mentioned dependent vari-
ables; however, a thorough analysis of this impact v/as
beyond the scope of this study. These variables were in-
cluded to remove or control effects other than BTB on the
dependent variables in order to obtain a better estimate of
the unique contribution of the BTB variables. They were
also included to provide data for future research. These
variables were
:
1) School - defined as the three schools. Storekeeper
School, Subsistence Specialist School, and Radioman School,
from which the data was collected.
2^-


2) Source - students entered Class A school from
either boot camp or a field unit.
3) Education - defined as the highest education level
in years a student had completed.
^) Quarter - defined as the quarter a student com-
menced a school.
The third set of variables studied were the BTB selec-
tion scores. The scores utilized were*.
1) GCT - General Classification Test score.
2) ARI - Arithmetic Test score.
3) COMB - defined as the combination of the GCT and
ARI scores.
The final phase of Study Two was the analysis of the
relationship between different variables for all three
schools taken together and for each school considered in-
dividually. Of primary concern was the relationship with
rephasal, disenrollment , and final grade. The first step
was measuring the linear relationship between any two of
the variables to determine how well each variable pre-
dicted the others. The second step was to study the linear
relationship between a set of independent variables and a
dependent variable while taking into account the interre-
lationships among the independent variables. The independ-
ent variables studied were school, source, education level,
GCT score, ARI score, COMB score, and quarter. The
dependent variables were rephasal, disenrollment, and
25

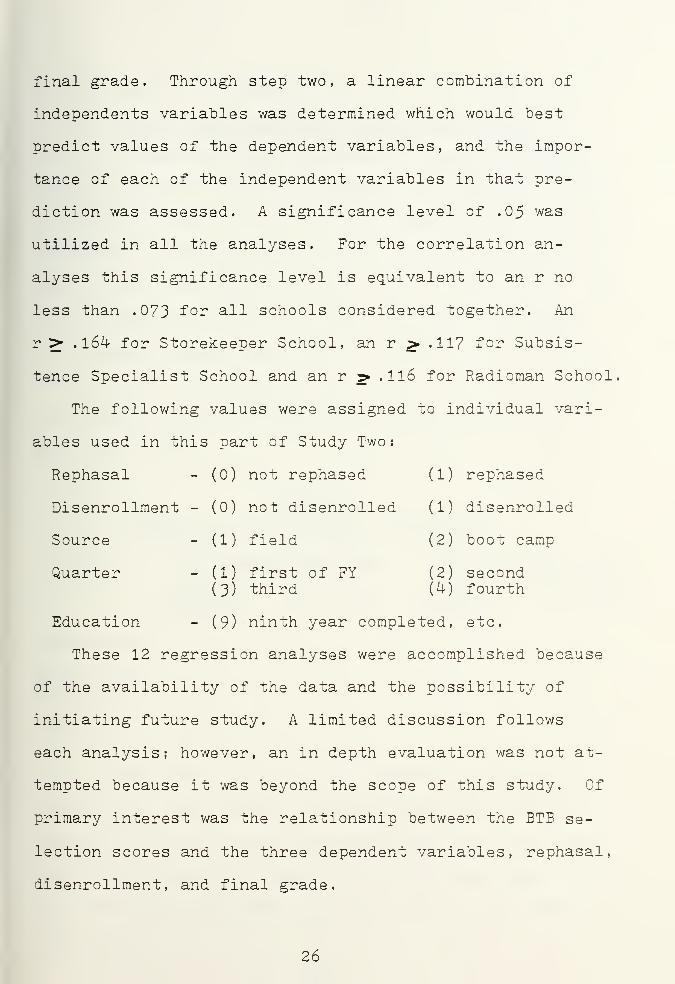
final grade. Through step two, a linear combination of
independents variables was determined which would best
predict values of the dependent variables, and the impor-
tance of each of the independent variables in that pre-
diction was assessed. A significance level of .05 was
utilized in all the analyses. For the correlation an-
alyses this significance level is equivalent to an r no
less than .073 ^o^ all schools considered together. An
r > .l6k for Storekeeper School, an r ^ .117 for Subsis-
tence Specialist School and an r > .116 for Radioman School
The following values were assigned to individual vari-
ables used in this part of Study Two:
Rephasal - (0) not rephased (1) rephased
Disenrollment - (0) not disenrolled (1) disenrolled
Source - (1) field (2) boot camp
Quarter - (1) first of FY (2) second(3) third (^) fourth
Education - (9) ninth year completed, etc.
These 12 regression analyses were accomplished because
of the availability of the data and the possibility of
initiating future study. A limited discussion follows
each analysis; however, an in depth evaluation was not at-
tempted because it was beyond the scope of this study. Of
primary interest was the relationship between the BTB se-
lection scores and the three dependent variables, rephasal,
disenrollment, and final grade.
26


B. RESULTS AND DISCUSSION
1 . Analysis of Students "by BTB Selection Score
A breakdown of the students entering Storekeeper
School, Subsistence Specialist School, and Radioman School
is shown in Table VII. The students were divided into two
categories determined by BTB selection scores being greater
than or less than those in effect prior to July, 1976. The
previous selection score for both Subsistence Specialist
and Radioman Schools was a GCT + ARI of 100 while the pre-
vious score for Storekeeper School was a GCT + ARI of 105
.
The present selection score for all three schools is a
GCT + ARI of 90.
TABLE VII
DISTRIBUTION OF STUDENTS BY CATEGORY
SCHOOL
STOREKEEPER
SUBSISTENCESPECIALIST
RADIOMAN
SCORE -^PREVIOUS SCORE
NUMBER OF PERCENTAGESTUDENTS
99
173
216
69
61
SCORERPREVIOUS SCORE
NUMBER OF PERCENTAGESTUDENTS
^5
110
70
31
39
From Table VII it can be determined that approxi-
mately 32^ of the students entering these three schools
during FY 1977 had a GCT + ARI combination less than that
which was required for selection prior to July, 1976. The
mean BTB scores for these schools for FY 1977 are shown in
Table VIII.
27


TABLE VIII
MEAN BTB SELECTION SCORES
SUBSISTENCESPECIALIST 55.03 ^9.89
RADIOMAN 58.20 51.69
TOTAL 56.66 51.33
SCHOOL GOT ARI COMBINATION
STOREKEEPER 57-29 53-56 110.79
10^.88
109.81
107.92
Entering students' education level was available
for only the Storekeeper and Subsistence Specialist Schools.
The distribution of number and percentage of students by
category and highest education level attained is shown in
Table IX. From this table it can be seen that students en-
tering Storekeeper School with the lower BTB scores had a
higher mean education level than the students entering with
the higher BTB scores. The reverse is true for Subsistance
Specialist School. However, the education level was unknown
for 20^ of the students attending this school.
Students in Class A schools originate from two
different sources. Some of the students come from boot
camp without going to a field unit while the remaining have
acquired some field experience- Table X shows the dis-
tribution of students entering Class A school from these
two sources.
From Table X it can be determined that there may
be an important relationship between source and student
28

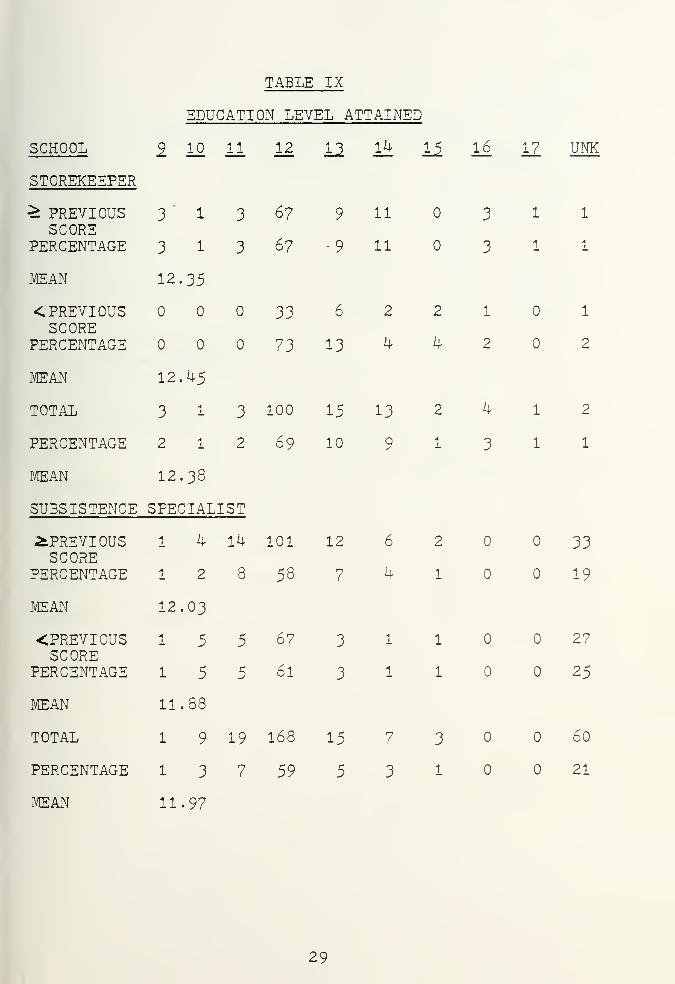
TABLE IX
EDUCATION LEVEL ATTAINED
SCHOOL 2 10 11 12 13 14 li 16 17 UNK
STOREKEEPER
> PREVIOUSSCORE
PERCENTAGE
3 1
3 1
3
3
67
67
9
911
11
3
3
1
1
1
1
MEAN 12.35
< PREVIOUSSCORE
PERCENTAGE
33
73
6
13
2
4
2
4
1
2
1
2
MEAN 12.45
TOTAL 3 1 3 100 15 13 2 4 1 2
PERCENTAGE 2 1 2 69 10 Q 1 3 1 1
r/EAN 12.38
SUBSISTENCE SPECIALIST
^PREVIOUSSCORE
PERCENTAGE
1 4
1 2
14
3
101
58
12
7
6
4
2
1
33
19
MEAN 12.03
<PREVIOUSSCORE
PERCENTAGE
1 5
1 5
5
5
67
61
3
3
1
1
1
1
27
25
MEAN 11.88
TOTAL 1 9 19 168 15 7 3 60
PERCENTAGE 1 3 7 59 5 3 1 21
MEAN 11.97
29

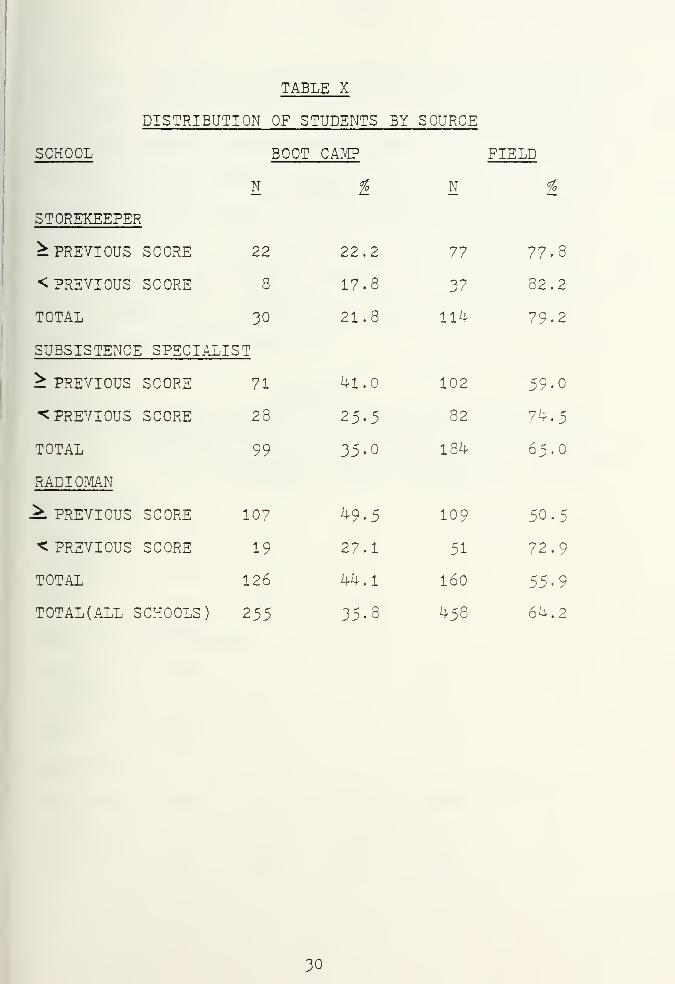
TABLE X
DISTRIBUTION OF STUDENTS BY SOURCE
SCHOOL BOOT CAMP FIELD
N ^ N ^
STOREKEEPER
^PREVIOUS SCORE 22 22.2 77 77.8
< PREVIOUS SCORE 8 17.8 37 82.2
TOTAL 30 21.8 11^ 79.2
SUBSISTENCE SPECIAL1ST
^ PREVIOUS SCORE 71 ij-l.O 102 59.0
•< PREVIOUS SCORE 28 25.5 82 7^.5
TOTAL 99 35.0 18^ 65.0
RADIOMAN
^ PREVIOUS SCORE 107 ^9.5 109 50.5
< PREVIOUS SCORE 19 27.1 51 72.9
TOTAL 126 ^'^.l 160 55.9
TOTAL (ALL SCHOOLS) 255 35.8 -^58 6^.2
30

category. A thorough analysis of this relationship plus
the effect of the variable source on training performance
at Class A schools would be beneficial. This was not the
objective of this study. Source was considered a nuisance
variable, as was explained in the Methodology Section of
this study.
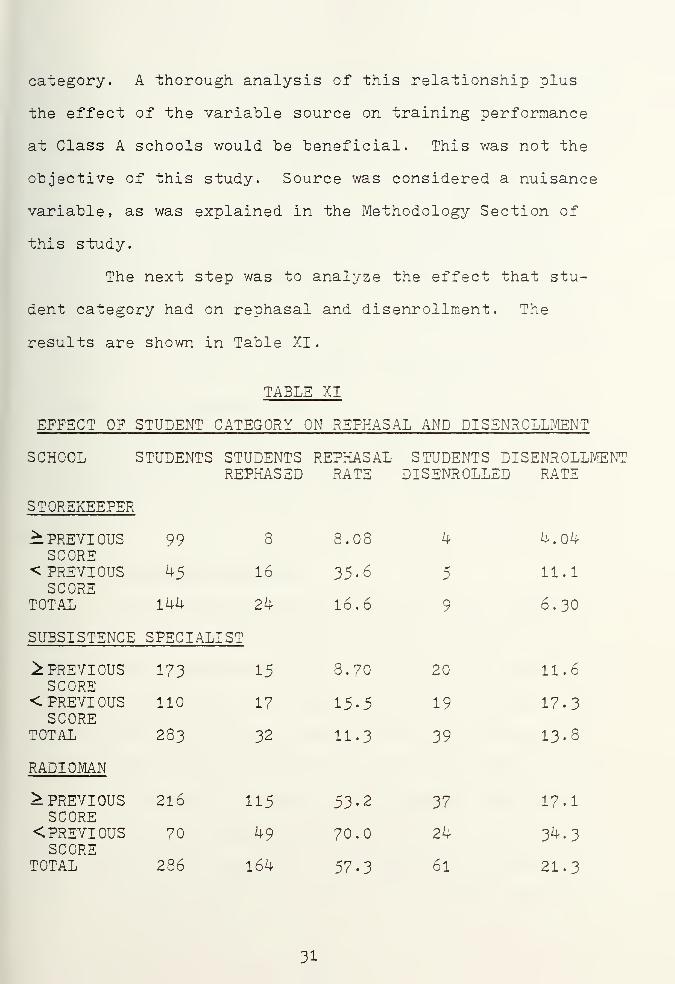
The next step was to analyze the effect that stu-
dent category had on rephasal and disenrollment . The
results are shown in Table XI
.
TABLE XI
EFFECT OF STUDENT CATEGORY ON REPHASAL AND DISENROLLMENT
SCHOOL STUDENTS STUDENTS REPHASAL STUDENTS DISENROLLMENTREPHASED RATE DISENROLLED RATE
STOREKEEPER
^PREVIOUS 99 8
SCORE-"^ PREVIOUS h5 16SCORE
TOTAL 1^^ 2^
SUBSISTENCE SPECIALIST
^PREVIOUS 173 15SCORE
< PREVIOUS 110 17SCORE
TOTAL 283 32
RADIOMAN
8.08 k- ij-.O^l
35.6 5 11.1
16.6 9 6.30
8.70 20 11.6
15.5 19 17.3
11.3 39 13.8
> PREVIOUS 216 115 53.2 37 17.1SCORE
<PREVIOUS 70 ^9 70.0 2^}- 34.3SCORE
TOTAL 286 l6^ 57-3 6I 21.
3
31


From Table XI it can be seen that students entering
these schools with GCT + ARI combinations less than the
previous selection scores had a higher incident of re-
phasals and disenrollments . The rephasal rate for these
students versus students entering with the higher selec-
tion scores was ^.4 times greater for Storekeeper School,
1.8 times greater for Subsistence Specialist School and
1.3 times greater for Radioman School. The disenrollment
rates for these same students were 2.?, 1.5. and 2.0 times
greater for Storekeeper, Subsistence Specialist and
Radioman Schools respectively.
The incidence of multiple rephasals (>1), however,
was not generally higher for students entering these
schools with lower selection scores. This is shown in
Table XII.
2. Regression Analysis
The regression analyses reported in this section
utilized the following variables: final grade (FG) , re-
phasal (REP), disenrollment (DI), quarter (QT) , source (SOU),
education level (ED), GCT, ARI , and GCT + ART (COMB). The
primary objective of these analyses was to determine the
relationship between the BTB selection scores and the three
dependent variables, rephasal, disenrollment, and final
grade. The other variables were included to remove or con-
trol effects other than BTB on the dependent variables in
order to obtain a better estimate of the unique contribution
32


TABLE XII
NUMBER OF REPHASALS
SCHOOL 1 fo 2 % 3 %
STOREKEi^PER
^PREVIOUS 8 8.1SCORE
< PREVIOUS 16 35.6 1 2.2 .
SCORETOTAL 24 16.6 1 0.7
SUBSISTENCE SPECIALIST
^PREVIOUS 15 8.6 2 1.2SCORE
<PREVIOUS 17 15.5 2 1.8 2 1.8SCORE
TOTAL 32 11.3 4 1.4 2 0.7
RADIOMAN
^PREVIOUS 115 53.2 37 17.1 8 3.7SCORE
< PREVIOUS 49 70.0 11 15.7 7 10.0SCORE
TOTAL 164 57.3 48 16.8 15 5^2
33


of the BTB variables. They were also included to provide
data for future research.
a. All Schools
The variable education level (ED) was not in-
cluded in the following analyses for all three schools be-
cause it was not available for the students attending
Radioman School. A correlation matrix determined for all
the schools is shown in Table XIII.
TABLE XIII
C
GCT
ORRELATION r/IATRI]<: FOR ALL SCHOOLS
ARI COMB sou QT DI
GCT 1.0
ARI .510 1.0
COMB .883 .850 1.0
SOU .2^3 .12-^ .212 1.0
QT -.016 .010 -.005 .068 1.0
DI -.106 -.163 -.158 - .012 .006 1.0
REP -.039 -.m-k -.100 -.066 .063 .097
FG .090 .169 .1^9 .o^6 .0^3 -.368
REP FG
1.0
From Table XIII it can be determined that of
the BTB selection scores, the best single predictor of re-
phasal , disenrollment , and final grade was the ARI score.
This table also shows the high inter-correlations among
GCT, ARI, and COMB.
34


A stepwise multiple regression was completed to
determine the "best predictors of rephasal , disenrollment
,
and final grade. The results are shown in Table XIV. A
set of dummy variables was created to account for the three
schools. Dummy variable SI refers to Storekeeper School
and S2 refers to Subsistence Specialist School, with Radio-
man School utilized as the reference category.
The results of the stepwise multiple regres-
sion analysis shown in Table XIV indicates that the individ-
ual schools are very important in predicting rephasal, dis-
enrollment, and final grade. This is consistent with the
findings in Table XI which shows that each school has a
considerably different rephasal rate and disenrollment rate.
Therefore, by knowing the mean rephasal rate, disenrollment
rate, and final grade and which school a student is attend-
ing, one could predict the chances of the student's suc-
cessful completion of that school. 'yi/hy there is an :.._. -
individual school difference in these three dependent
variables could be a subject for further study. Such fac-
tors as diversification of material being taught, percentage
of students from the two BTB categories (Table VII),
training and personnel management problems of the individ-
ual schools, etc., could be analyzed. As stated previously,
school was considered a nuisance variable.
The ARI score was also statistically signifi-
cant in predicting the dependent variables. The remaining
35


TABLE XIV
STEPWISE REGRESSION FOR REPHASAL, DISENROLLMENT
AND FINAL GRADE
DEPENDENT INDEPENDENT MULTIPLE SIMPLE B BETAVARIABLE VARIABLES r r
REPHASAL S2 0.3616 -0.3616 -0.5022 -0.5306
SI 0.4872 -0.1531 -0.3825 -0.3367
ARI 0.5195 -0.1436 -0.0126 -0.1843
(constant) 1.2213
DISENROLLMENT ARI 1681
S2 1911
SI .2344
Y' = 1.2213 -0.5022(S2 dummy) -0.3825(S1 dummy) -0.0126(ARI)
F = 85.26 d.f. = 3, 692
-0.1681 -0.0088 -0.1708
-0.0590 -0.1077 -0.1499
-0.1166 -0.1285 -0.1490
(constant) O.6636
Y' = 0.6636 -.0088(ARI) -0.1077(S2 dummy) -0.1285(S1 dummy)
F = 13.41 d.f. = 3, 692
FINAL GRADE S2 0.2234 0.2234 6.1247 . 3215
ARI 0.3112 0.1692 0.2927 0.2127
SI 0.3324 0.0205 2.8980 0.1302
(constant) 65.623O
Y' = 65.623 + 6.1247(S2 dummy) +0.2927 (ARI) +2. 898 (SI dummy)
F = 24.55 d.f. = 3. 593
36


independent variables: quarter, source, GCT, and COMB were
found not statistically significant and therefore not
included in Table XIV.
b. Storekeeper School
A correlation matrix determined for Storekeeper
School is shown in Table XV. This table shows that of the
^
BTB selection scores, COMB is the best single predictor
of final grade and rephasal while the GCT score is the best
predictor of disenrollment . It also shows the high inter-
correlations among the GCT, ARI , and COMB scores.
A stepwise multiple regression was completed to
find the best predictors of the dependent variables, re-
phasal, diserirollment , and final grade. The results are
shown in Tables XVI, XVII, and XVIII.
37


TABLE XV
CORRELATION MATRIX FOR STOREKEEPER SCHOOL
FG REP DI QT SOU. GOT ARI COMB ED
FG 1.0
REP - . 2^4 1 .
DI -.961 .141 1.0
QT .077 .133 -.056 1.0
SOU -.0^3 .053 .023 -.0^2 1.0
GCT .^^60 -.211 -.153 -.116 .219 1.0
ARI .519 -.234 -.058 -.136 .083 .418 1.0
COMB .590 -.266 -.127 -.149 .185 .847 .832 1.0
ED .125 -.096 -.081 -.073 .054 .105 .177 .149 1.0
TABLE XVI
STEPWISE REGRESSION FOR REPHASAL
DEPENDENT INDEPENDENT MULTIPLE SIMPLE B BETAVARIABLE VARIABLES r r
REPHASAL COMB 0.2657 -O.2657 -O.OO89 -O.2657
(constant) I.IIO3
Y' = 1.1103 -0.0089(C0MB score)
F =10.64 d.f. = 1, 140
This analysis shows that only the 3 associated
with the combination score was statistically significant in
predicting rephasal . The Bs associated with GCT, ARI,
quarter, source and education were found not statistically
significant.
38


TABLE XVII
STEPWISE REGRESSION FOR PISENROLLMENT
DEPENDENT INDEPENDENT MULTIPLE SIMPLE B BETAVARIABLE VARIABLES r r
DISENROLLMENT OCT O.I528 -O.I528 -O.OO53 -O.I528
(constant) 0.359^
Y* = 0.359^ -0.0053(GCT)
F = 3.95 d.f. = 1, 1^0
The GOT score was the only significant predictor
of disenrollment . The other independent variables were
found to be not significant.
TABLE XVIII
STEPWISE REGRESSION FOR FINAL GRADE
DEPENDENT INDEPENDENT MULTIPLEVARIABLE VARIABLES r
SIMPLEr
B BETA
FINAL GRADE COr/EB 0-5895 0.5895 0.2882 0.6332
QT 0.6097 0.0768 0.6039 0.1526
SOU 0.625'!4- -o.o^'3^ -1.7298 -0.1^15
(constant) 52.79^0
Y' = 52.79^ +0.2882(C0MB) +0.1526(QT score) -0.1^15(S0U score)
F = 27.84 d.f. = 3. 130
The combination score contributed most toward
predicting final grade. Although the variables GCT and ARI
,
when considered alone, were highly correlated with final
grade, when they are considered in a stepwise multiple
39


regression with the other independent variables their con-
tribution is statistically insignificant. This reflects
the inter-correlation among the BTB selection scores.
The nuisance variables quarter and source pro-
vided additional information for predicting final grade.
However, further analysis of these variables was not at-
tempted in this study. The contribution from the remaining
independent variables was not statistically significant,
c. Subsistence Specialist School
A correlation matrix determined for Subsistence
Specialist School is shown in Table XIX.
TABLE XIX
CORRELATION MTRIX FOR SUBSISTENCE SPECIALIST SCHOOL
FG REP DI QT SOU GOT ARI COP/EB ED
FG 1.0
REP -.08^ 1.0
DI -.991 .265 1.0
QT .262 .066 .102 1.0
SOU -.029 -.001 -.077 -.0^4 1.0
GOT .246 -.018 -.088 .062 .202 1.0
ARI .314 -.112 -.185 .072 .099 .521 1.0
COMB .325 -.069 -.150 .082 .172 .897 .842 1.0
ED .256 -.050 -.044 .139 -.033 .154 .090 .143 1.0
This analysis indicates that of the BTB
selection scores, the combination is the best single
40


predictor of final grade while the ARI score is the best
predictor of disenrollment . The ARI score, though the "best
predictor of rephasal, is not statistically significant at
the .05 level. There is also a high correlation between
the nusiance variable education and the variable final
grade. This relationship is not analyzed in this study.
Table XIX also shows the high inter-correlations between
the BTB selection scores.
A stepwise multiple regression was completed
on the dependent variables rephasal, disenrollment, and
final grade. The results are shown in Tables XX, XXI,
and XXII.
TABLE XX
STEPWISE REGRESSION FOR R5PHASAL
DEPENDENT INDEPENDENT MULTIPLE SIMPLE B BETAVARIABLE VARIABLES r r
REPHASAL ARI 0.1122 -0.1122 -0.00^9 -0.1122
(constant) O.3292
Y' = 0.3292 -0.00'^9(ARI score)
F = 3.96 d.f. = 1, 217
This analysis shows that only the B associated
with the ARI score was statistically significant in pre-
dicting rephasal. The Bs associated with the other inde-
pendent variables were found not statistically significant.
kl


TABLE XXI
STEPWISE REGRESSION FOR DISENROLLI^NT
DEPENDENT INDEPENDENT MULTIPLE SIMPLE B BETAVARIABLE VARIABLES r r
DISENROLLMENT ARI 0.18^5 -0.18^5 -O.OO9I -0.1928
QT 0.2175 0.1017 0.0338 0.1155
(constant) 0.^650
Y' = 0.4650 -0.0091(ARI score) +0.0338(QT score)
F = 5.36 d.f. = 2, 216
The ARI score contributed most towards pre-
dicting disenrollment . The nuisance variable quarter pro-
vided additional information for predicting disenrollment.
However, further analysis of this variable was not attempted
in this study. The contribution from the remaining inde-
pendent variables was not statistically significant.
TABLE XXII
STEPWISE REGRESSION FOR FINAL GRADE
DEPENDENT INDEPENDENT MULTIPLE SIP^LE B BETAVARIABLE VARIABLES r r
FINAL GRADE COMB 0.32'^9 0.32^9 0.0844 0.2727
QT 0.3932 0.2624 0.7089 0.1950
ED 0.4324 0.2562 0.8115 0.1839
(constant) 65.6339
Y' = 65.6339 +0.0844(C0MB) +0.7089(QT score) +0.8ll5(ED score)
F = 14.71 d.f. = 3, 192
42

The combination score was the best predictor
of final grade. Although the variables GCT and ARI , when
considered alone, were highly correlated with final grade,
when they are considered in a stepwise regression with the
other independent variables their contribution is statis-
tically insignificant. This reflects the high inter-
correlations among the BTB selection scores.
The nuisance variables quarter and education
provided additional information for predicting final grade.
However, further analysis of these variables was not at-
tempted in this study. The contribution from the remaining
independent variables was not statistically significant.
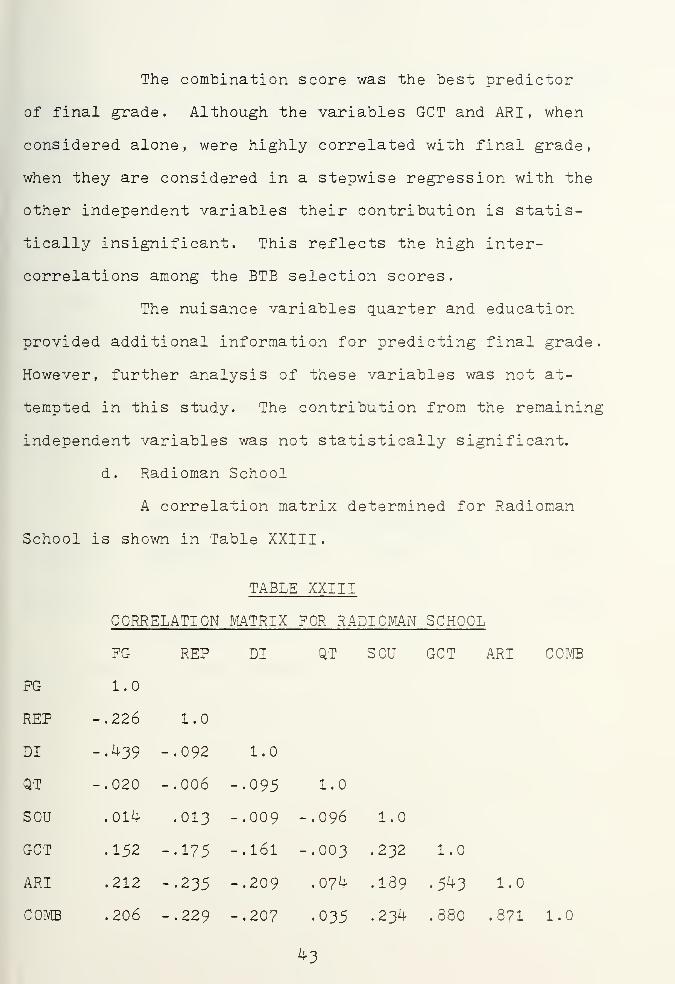
d. Radioman School
A correlation matrix determined for Radioman
School is shown in Table XXIII.
TABLE XXIII
CORRELATION MATRIX FOR RADIOMAN SCHOOL
FG REP DI QT SOU GCT ARI COMB
FG 1.0
REP -.226 1.0
DI -.^39 -.092 1.0
QT -.020 -.006 -.095 1.0
SOU .01^ .013 -.009 -.096 1.0
GCT .152 -.175 -.161 -.003 .232 1.0
ARI .212 -.235 -.209 .07^ .189 .5^3 1.0
COMB .206 -.229 -.207 .035 .23^ .880 .871 1.0
43


This analysis indicates that of the BTB selection
scores, the ARI score is the best single predictor of re-
phasal, disenrollment , and final grade. It also shows a
high inter-correlation among the BTB selection scores.
A stepwise multiple regression was completed
on the dependent variables rephasal, disenrollment, and
final grade. The results are shown in Tables XXIV, XXV,
and XXVI. These results show that only the B associated
with the ARI score was statistically significant in pre-
dicting the three dependent variables. The Bs associated
with the other independent variables were found not statis-
tically significant in all three cases.
TABLE XXIV
STEPWISE REGRESSION FOR REPHASAL
DEPENDENT INDEPENDENT MULTIPLE SIMPLE 3 BETAVARIABLE VARIABLES r r
REPHASAL ARI 0.2353 -0.2353 -0.0171 -0.2353
(constant) 1.^553
Y' = 1.^553 -.0171(ARI score)
F = 16.59 d.f. = 1, 283
^k

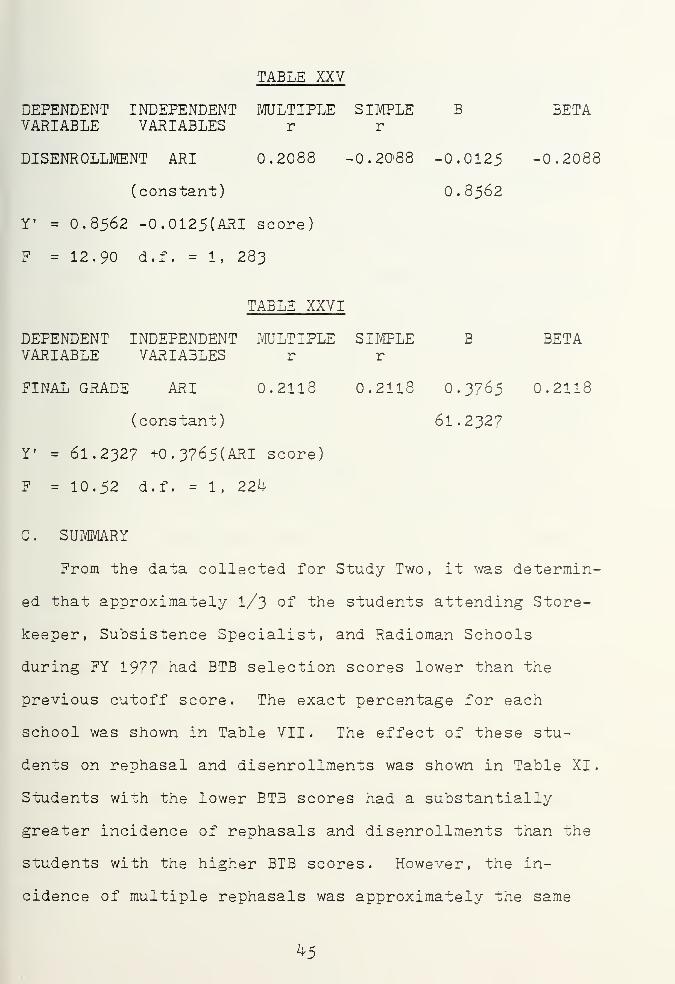
TABLE XXV
DEPENDENT INDEPENDENT MULTIPLE SIMPLE BVARIABLE VARIABLES r r
DISENROLLJVENT ARI 0.2088 -0.20-88 -0.0125
(constant) . 8562
Y' = 0.8562 -0.0125(ARI score)
F = 12.90 d.f. = 1, 283
TABLE XXVI
DEPENDENT INDEPENDENT MULTIPLE SI TRIPLE BVARIABLE VARIABLES r r
BETA
-0.2088
BETA
0.2118FINAL GRADE ARI 0.2118 0.2118 O.3765
(constant) 61.232?
Y' = 61.2327 +0.3765(ARI score)
F = 10.52 d.f. = 1, 22^]-
C . SUMMARY
From the data collected for Study Two, it was determin-
ed that approximately I/3 of the students attending Store-
keeper, Subsistence Specialist, and Radioman Schools
during FY 1977 had BTB selection scores lower than the
previous cutoff score. The exact percentage for each
school was shown in Table VII. The effect of these stu-
dents on rephasal and disenrollments was shown in Table XI.
Students with the lower BTB scores had a substantially
greater incidence of rephasals and disenrollments than the
students with the higher BTB scores. However, the in-
cidence of multiple rephasals was approximately the same
45


for both student categories. In the future, if the input
changes are such that there is an increase in the percent-
age of students entering these schools with the lower BTB
selection scores, there could be a significant increase in
both rephasal and disenrollment rates.
The analysis completed in this study also showed that
the best predictors for rephasal, disenrollment, and final
grade when all the schools were considered together was
knowing the individual school a student was attending and
his ARI score. However, from Table XIV it can be seen
that only a small amount of the variance of these dependent
variables could be accounted for. For rephasal, 21% {2^fo
by the schools and 3f° "by ARI score) of the variance was
accounted for while 73% was not. For disenrollment, only
5.^'fo {2.6fo by the schools and 2.8fo by ARI score) of the
variance was accounted for while 9^-0% was not. For final
grade, 11^ (^-5% ^y the schools and 6. S% by ARI score) was
accounted for while 89/^ was not.
When an analysis was completed for individual schools,
it was discovered that other variables besides the ARI score
were good predictors of the dependent variables. For Radio-
man School alone the ARI score was the only statistically
significant predictor of all three dependent variables. It
was also the best predictor of rephasal and disenrollment
but not final grade in Subsistence School. The ARI score
was not a statistically significant predictor for any of
^6


the three dependent variables for Storekeeper School. In
each of these analyses only a small amount of the variance
in the dependent variables could be explained. However,
an analysis by individual school is necessary to determine
the significant predictors of rephasal , disenrollment , and
final grade for each school.
There were several variables mentioned but not analyzed
in this study that could have an effect on the training
performance of students attending Class A schools. These
were labeled nuisance variables and included the variables
school, source, quarter, and education. Further analysis
of each of these variables should prove beneficial in
predicting success at Class A schools.
^7


IV. CONCLUSIONS
The purpose of this analysis was to investigate and
evaluate the effect that lowering the BTB selection scores
in July, 1976, had on rephasals and disenrollments from
Class A schools. Further attention was also given to the
outcome of students entering with the lower BTB scores.
From the data that was available for Study One it was de-
termined that lowering the BTB selection score had a small
but statistically significant effect on rephasal rate but
not disenrollm^ent rate. Rephasal rate increased from
FY 1976 to FY 1977.
Through the results of Study Two it was shown that
students entering Storekeeper, Subsistence Specialist, and
Radioman Schools with lower BTB scores had a greater inci-
dence of rephasals and disenrollments. During FY 1977.
1/3 of the students attending these schools entered with
lower BTB selection scores than those in effect prior to
July, 1976. If the input percentage of these students
increased there should be a significant increase in both the
rephasal and disenrollraent rates for these schools, and not
just the rephasal rate as indicated in Study One.
If it becomes necessary in the future of the Coast
Guard to accommodate a higher percentage of less qualified
personnel for Class A school, further study for all schools
will have to be carried out concerning rephasal and
^•8


disenrollment . A thorough analysis for each individual
school and not generalized assumptions from a study of
selected schools would be required to determine the best
predictors of success. Other variables besides BTB scores
should be considered. Lang (Ref. 2) determined that an
ASVAB composite or an ASVAB and BTB composite might be a
better predictor of success than just a BTB composite.
Boot camp grades should be taken into consideration. Based
on a thorough analysis of selection criteria for Class A
school, rephasal and disenrollment rates could be kept to
a minimum for personnel determined as less qualified.
^9


LIST OF REFERENCES
1. Kerlinger, F. N. and Pedhazur, E. J., MultipleRegression in Behavioral Research , Holt, Rinehartand Winston, Inc., 1973.
2. Lang, D. A., "The Effectiveness of Selection Testsin Predicting Performance at Coast Guard Class ASchools: I. Machinery Technician School Yorktown,Virginia," Washington, D. C., 1976.
3- Muldrow, T. W. , "The Motivational Factors InfluencingEnlistment Decision," Unpublished Study, NavalPersonnel Research and Development Laboratory,Washington, D. C, I969.
^. Nie, N. H., Hull, C. H., Jenkins, J. G., Steinbrenner
,
K. and Brent, D. H. , Statistical Package for theSocial Sciences , 2nd ed . , McGrawKill, 1970.
5. Personnel Manual , (U. S. Coast Guard) (CG-207)
6. West, A. S., Williams, R. E. , Lantz , A. E. , andBleistein, S., "A Study of Selected Class A Schools,Volume II," Department of Transportation, U. S.
Coast Guard, Washington, D. C, 1975-
50


INITIAL DISTRIBUTION LISTNo. Copies
1. Defense Documentation Center 2Cameron StationAlexandria, Virginia 2231^
2. Library, Code 01^2 2Naval Postgraduate SchoolMonterey, California 939^0
3. Department Chairman, Code 5^ 1
Department of Administrative SciencesNaval Postgraduate SchoolMonterey, California 939^0
^. Professor J.K. Arima, Code 5^ Aa 1
Department of Administrative SciencesNaval Postgraduate SchoolMonterey, California 93940
5. Defense Logistics Studies Information Exchange 1
U.S. Army Logistics Management CenterFort Lee, Virginia 238OI
6. Commandant (PTE - 1/72) 2U.S. Coast Guard HeadquartersWashington, D.C. 20590
7. Mr. J. Cowan 1
c/o Commandant (G-P - 1/2/62)Psychological Research BranchU.S. Coast Guard HeadquartersWashington, D.C. 20590
8. Commanding Officer 4U.S. Coast Guard Training CenterPetaluma, California 9^952
9. Lt. Daniel E. Kalletta, U.S.C.G. 31561 East 12 StreetBrooklyn, New York II23O
51


Thes f s
KII75c.l
179U94Kal letta
An analysis of theeffect of lowered basictest battery selection
29 Sf^cpres on rephas,a4s, and28 SMiSHnrolIments S?feU8 '
lected Coast Guard class^A schools.
21 SEP 84a^^ff P
Thfesis
KII75c.l
Kal letta'79194
An analysis of theeffect of lowered basictest battery selectionscores on rephasals anddisenrol Iments at se-lected Coast Guard classA schools.

thesK1175
An analysis of the effect of lowered bas
3 2768 002 11372 2DUDLEY KNOX LIBRARY