an analysis of the achievement of the water and sanitation ...©line... · an analysis of the...
TRANSCRIPT

An Analysis of the Achievement of the Water and Sanitation Target of the Millennium Development Goals in Sub-Saharan Africa
Céline Monfils (3030099)
A Major Research Paper submitted to the
Faculty of Graduate and Postdoctoral Studies
In partial fulfillment of the requirements for the
MA in Globalization and International Development
School of International Development and Global Studies
Faculty of Social Sciences
University of Ottawa
© Céline Monfils, Ottawa, Canada, 2015
2
Disclaimer & Inquiries:
This document represents part of the author’s study programme while at the School of International Development and Global Studies (SIDGS). The views stated therein are those of the author and not necessarily those of SIDGS.
Contact Information:
School of International Development and Global Studies Faculty of Social Sciences University of Ottawa 120 University Social Sciences Building Room 8005 Ottawa, Ontario, Canada K1N 6N5
Tel.: 613-562-5680 Fax: 613-562-5817 Email: [email protected]

3
Acknowledgements
First, I would like to thank my academic supervisor Professor Syed Sajjadur Rahman for his time, continuous support, encouragement and guidance throughout this research project. I would also like to thank my reader Professor Melissa Marschke for her time, helpful insights and feedback. I would like to extend my gratitude to the faculty members of SIDGS for their teaching and inspiring conversations both in and out of the classroom.
Secondly, I want to take the time to thank to my colleagues at my previous and current workplaces for their support throughout the years of my study program. Thank you to Diane Frasier, Sarah Beaupré, Michelle Morrison and Margaret McCuaig-Johnston. Also, I want to specially thank my manager Alain Houde for his helpful advices and understanding. Thank you to my team at Environment Canada: Karen Turcotte, Imm Yong, Jenny C. Liu and Nick Neely.
Without the support of my friends and family, my studies at Ottawa University would not have been the same. I want to give special thanks to my parents Micheline and Claude, my siblings Nicholas and Mélanie as well as Jean-Philippe, Dominique and my friends Karen Sleiman and Arianne Bordeleau for their encouragements.
Finally, on a more personal note, thank you to Austin who is always there for me. You have been the most supportive, encouraging, caring and understanding partner throughout my studies. Thank you a thousand times for everything you have done for me.
4
Abstract Since 2000, countries around the world have worked towards the achievement of the Millennium Development Goals (MDG). This major research paper will analyze the achievement or non-achievement of MDG Target 7.C of “halving, by 2015, the proportion of the population without sustainable access to safe drinking water and basic sanitation” (United Nations, 2015) in Sub-Saharan Africa (SSA) in general and two case study countries in particular – Nigeria and South Africa. The achievement of target 7.C will play a crucial role in poverty alleviation. Water and sanitation are key elements to several aspects of human health, development and well-being. For example, access to safe drinking water and basic sanitation can help reduce the incidence of diseases resulting from the consumption of contaminated water.
In SSA and the case study countries, while there have been progress in meeting the access to safe drinking water target, the record on meeting the sanitation target is highly unsatisfactory. There are currently 32 percent of the population living without access to safe drinking water and 70 percent of the population who do not have access to basic sanitation in the SSA. The evidence suggests that while there are no physical barriers to meeting the MDG 7.C targets in SSA, the region will not be able to attain the targets primarily due to human induced causes and continuing issues of poor governance, weak legislation, and lack of financial and human resources.

5
List of Acronyms FAO Food and Agriculture Organization
IDG International Development Goal
IMF International Monetary Fund
JMP Joint Monitoring Programme
NGO Non-Governmental Organisation
MDG Millennium Development Goal
MRP Major Research Paper
OECD Organization of Economic Co-operation and Development
OECD DAC Organization of Economic Co-operation and Development - Development Assistance Committee
RUHEPAI Rural Health Promotion and Poverty Alleviation Initiative
SDG Sustainable Development Goal
UN United Nations
UNEP United Nations Environmental Programme
UNESCO United Nations Educational, Scientific and Cultural Organization
UNICEF United Nations International Children’s Fund
UNW-DPAC United Nations-Water Decade Programme on Advocacy and Communication
VIP Ventilated Pit Latrine
WHO World Health Organization
WSSCC Water Supply and Sanitation Collaborative Council
WWAP World Water Assessment Programme

6
List of Charts
Chart 2.2.1: Percentage of Population Using an Improved Drinking Water Source in Sub-Saharan Africa p. 27
Chart 2.2.2: Percentage of Population Using Improved Sanitation in Sub-Saharan Africa p. 29
Chart 2.3.1: Percentage of Population Using an Improved Drinking Water Source in Nigeria p. 32
Chart 2.3.2: Percentage of Population Using Improved Sanitation in Nigeria p. 33
Chart 2.4.1: Percentage of Population Using an Improved Drinking Water Source in South Africa p. 35
Chart 2.4.2: Percentage of Population Using Improved Sanitation in South Africa p. 36
Chart 3.1.1: Percentage of Population Using an Improved Drinking Water Source in Sub-Saharan Africa p. 39
Chart 3.1.2: Percentage of Population Using Improved Sanitation in Sub-Saharan Africa p. 40
Chart 3.2.1: Percentage of Population Using an Improved Drinking Water Source in Nigeria p. 44
Chart 3.2.2: Percentage of Population Using Improved Sanitation in Nigeria p. 45
Chart 3.3.1: Percentage of Population Using an Improved Drinking Water Source in South Africa p. 48
Chart 3.3.2: Percentage of Population Using Improved Sanitation in South Africa p. 48

7
Table of Contents Acknowledgements ............................................................................................................................................... 3
Abstract ..................................................................................................................................................................... 4
List of Acronyms..................................................................................................................................................... 5
List of Charts ............................................................................................................................................................ 6
1 Introduction .................................................................................................................................................... 9
1.1 Drinking Water and Sanitation Challenges ................................................................................... 9
1.1.1 Sustainable Access to Safe Drinking Water........................................................................... 9
1.1.2 Issues in Sustainable Access to Basic Sanitation ................................................................. 15
1.1.3 International Initiatives to Address Water and Sanitation Concerns ................................. 17
1.2 Millennium Development Goal 7: Ensure Environmental Sustainability .................................... 18
1.2.1 Millennium Development Goal 7: Target C ........................................................................ 20
1.3 Research Question ...................................................................................................................... 22
1.4 Research Methodology ............................................................................................................... 22
1.5 Organisation of the Major Research Proposal ............................................................................ 24
2 Status of Access to Safe Drinking Water and Basic Sanitation Prior to 2000 in Sub-Saharan African Countries .............................................................................................................................. 25
2.1 Definitions ................................................................................................................................... 25
2.2 Sub-Saharan Africa ...................................................................................................................... 27
2.2.1 Access to Safe Drinking Water Prior to 2000 (Quantitative Data) ...................................... 27
2.2.2 Access to Basic Sanitation Prior to 2000 (Quantitative Data) ............................................. 29
2.2.3 Cause for Lack of Access to Safe Drinking Water and Sanitation in SSA ............................. 30
2.3 Nigeria ......................................................................................................................................... 32
2.3.1 Access to Safe Drinking Water Prior to 2000 ...................................................................... 32
2.3.2 Access to Basic Sanitation Prior to 2000 (Quantitative Data) ............................................. 33
2.3.3 Cause for Lack of Access to Safe Drinking Water and Sanitation ....................................... 34
2.4 South Africa ................................................................................................................................. 35
2.4.1 Access to Safe Drinking Water Prior to 2000 ...................................................................... 35
2.4.2 Access to Basic Sanitation Prior to 2000 (Quantitative Data) ............................................. 36
2.4.3 Cause for Lack of Access to Safe Drinking Water and Sanitation ....................................... 37
3 The situation in Sub-Saharan Africa and the case study countries since 2000 ................... 39
3.1 Sub-Saharan Africa ...................................................................................................................... 39

8
3.1.1 Progress on Access to Safe Drinking Water and Basic Sanitation Since 2000 .................... 40
3.1.2 2015 Status on Access to Safe Drinking Water and Basic Sanitation ................................. 43
3.2 Nigeria ......................................................................................................................................... 44
3.2.1 Progress on Access to Safe Drinking Water and Basic Sanitation Since 2000 .................... 45
3.2.2 2015 Status on Access to Safe Drinking Water and Basic Sanitation ................................. 47
3.3 South Africa ................................................................................................................................. 48
3.3.1 Progress on Access to Safe Drinking Water and Basic Sanitation Since 2000 .................... 49
3.3.2 2015 Status on Access to Safe Drinking Water and Basic Sanitation ................................. 51
4 The Achievement of MDG Target 7.C in Sub-Saharan Africa and the Case Study Countries: Analysis .................................................................................................................................................................. 51
4.1 Achievement of MDG Target 7.C in Sub-Saharan Africa ............................................................. 51
4.2 Performance in the Case Study Countries .................................................................................. 54
5 Conclusion .................................................................................................................................................... 56
Annex 1: Millennium Development Goals and Post-2015 Sustainable Development Goals ... 58
Selected Bibliography ....................................................................................................................................... 62

9
1 Introduction Despite significant international efforts, availability and access to safe water1 and sanitation
practices continues to remain a global challenge. A major proportion of the global population
lacks access to safe drinking water and basic sanitation. In 2000, 18 percent of the global
population lacked access to safe drinking water while 50 percent lacked access to basic
sanitation (United Nations, 2001). Twelve years later, in 2012, 11 and 36 percent of the global
population still lacks access to safe drinking water and basic sanitation respectively (WHO &
UNICEF, 2014).
The purpose of this major research paper (MRP) will be to examine how, why and where the
international community has lagged behind in meeting these fundamental challenges. It will
examine the achievement or non-achievement of target 7.C of the Millennium Development
Goals; “halve, by 2015, the proportion of the population without sustainable access to safe
drinking water and basic sanitation” (United Nations, 2015). More precisely, this MRP will
analyse whether the target was achieved in Sub-Saharan African countries.
1.1 Drinking Water and Sanitation Challenges
1.1.1 Sustainable Access to Safe Drinking Water
“Freshwater is vital for practically every aspect of lives of humans, animals, plants, environments and ecosystems. It can be the difference between life and death” (Sivakumar, 2011, p. 532).
In 1990, the percentage of world population with access to improved drinking water sources
was 76 percent; in 2015 it is 91 percent (UNICEF & WHO, 2015). In other words, since 1990, 2.6
billion people have gained access to safe drinking water. The global expected target of 88
percent was reached five years before the 2015 MDG deadline. However, Caucasus and Central
Asia, Northern Africa, Oceania and Sub-Saharan Africa (SSA) did not reach their respective
targets in 2015. Currently, there are 663 million people worldwide living without access to safe
1 Water in the context of this MRP refers to freshwater defined as water that is not seawater i.e. salted water. Freshwater is naturally occurring on Earth in lakes, rivers, ponds, groundwater, glaciers, ice sheet, snow and several kinds of wetlands. Approximately 2.4 percent of the Earth’s water is fresh water; the rest is seawater (Cunningham, Cunningham & Saigo, 2005).

10
drinking water. The lowest levels of coverage of access to safe drinking water are found in the
48 least developed countries. The population most affected are poor people living in rural areas
in developing countries in 2015; eight out of ten people in these areas were living without
access to safe drinking water (UNICEF & WHO, 2015).
The inability to satisfy basic human water needs can be mainly due to physical and human
causes. Some authors argue that water scarcity is caused by a mismanagement of water
resources rather than an actual natural physical lack of water (Gleik & Palaniappan, 2010;
Sivakumar, 2011; Lu, Ocampo-Raeder & Crow, 2014). To them, the scarcity of safe drinking
water often results from the absence of efficient water resource management, functional
services and good governance. Some others argue that it is actually a question of natural
physical lack of water (Cook, Fisher, Tiemann & Vidal, 2011). No matter how water scarcity is
caused, access to safe drinking water and basic sanitation are both required to satisfy basic
human needs to live a healthy life (United Nations Development Programme, 2006; Jain &
Singh, 2010).
1.1.1.1 Physical Aspects of Water Scarcity
Even though the Earth is covered by a lot of water, only a small percentage is actually available
for human consumption. The majority of water found on Earth is in the oceans (precisely 97.4
percent) and therefore saline. It is difficult to convert sea water for human consumption
without the use of expensive technology and treatment (Jury & Vaux, 2007). The remaining 2.6
percent is fresh water, but most of it is trapped in glaciers, permanent snow cover or deep
groundwater. Just a small fraction is readily available for human consumption in surface water
such as rivers or lakes and in accessible groundwater (Jury & Vaux, 2007; Gleik & Palaniappan,
2010). The amount of freshwater available is not evenly distributed around the world. Some
regions are rich in freshwater while others are not (Niemczynowicz, 2000; Jared, 2003;
Cunningham, Cunningham & Saigo, 2005). For example, a fifth of the world’s resources of
freshwater are found in Canada (Keen, 2003). Water scarcity occurs in mostly arid and semi-arid
regions, where there are natural shortages of water due to climatic, geographical and
environmental conditions (Cunningham, Cunningham & Saigo, 2005).
11
Water is described as a renewable natural resource because it can be recycled and recharged
naturally via the hydrological cycle (Gleick and Palaniappan, 2010). For example, rain falling
from the sky replenishes surface water such as lakes, rivers and streams. Also when it
percolates into the soil, it recharges groundwater. However, water can also be considered non-
renewable when resources of water are extracted faster than the natural recharge rate. For
example, freshwater found in groundwater aquifers have a very slow recharge rate and when
the water is pumped out faster at a rate faster than the recharge rate, the water is no longer
renewable (Gleick and Palaniappan, 2010). According to the Lavoisier’s Law of Conservation of
Mass, no quantity of water can be lost or created but only transformed. Water is transformed
from either solid, liquid or gas forms to another through natural sequences but it can also be
transformed by human activities and pollution. Water is degraded to a very poor level of quality
via pollution such as agricultural and industrial waste, making it toxic for any living being to use
and consequently increasing the scarcity of freshwater. Geographical distribution of water,
climate change and natural disasters also contribute to water scarcity (Cunningham,
Cunningham & Saigo, 2005).
1.1.1.2 Human induced water scarcity
Availability of freshwater is affected by human activity. Since the 1950s, the global demand for
freshwater has tripled and will continue to increase as world population grows (Hanigra &
Qureshi, 2010). Population growth puts tremendous pressure on freshwater resources (Melloul
& Collin, 2001) and is an important driver for water-related problems. In particular, it can
jeopardize the ability to meet the current and future global needs for water when combined
with mismanagement of water resources (Gawel & Bernsen, 2011). “An increase in population
normally leads to an increase in water demands in almost all sectors (domestic, industrial,
agricultural, energy and recreation), unless water management practices become more
efficient” (Sivakumar, 2011, p. 532). Agricultural needs for freshwater increases as more food is
needed; by the year 2050, it is predicted that 70 percent more food will be needed (Cook et al,
2011). In reality the agricultural sector “is overwhelmingly the dominant consumer of fresh
water” (Jury & Vaux, 2007, p.9). Most of the water is used for irrigation purposes - almost 85
percent of the world’s consumption of water is for irrigation (Kanwar, 2010; Duarte, Pinilla &

12
Serrano, 2014). The expansion of urban population, especially in mega cities in developing
countries, also increases the demand for water and the need for more efficient means to
distribute water to all including the poorest people (Niemczynowicz, 2000). Overall the growing
demands for water from all sectors, especially agricultural, domestic and industrial, reduce the
amount of water available to address basic human needs and ecosystems requirements (for
plants, animals, rivers, etc.) (Gurría, 2009; Hanigra & Qureshi, 2010; Organization for Economic
Co-operation and Development, 2010).
Human actions and inactions that cause freshwater scarcity include those of the government as
well as the people. Government inactions or inabilities to provide safe drinking water and basic
sanitation can result from the lack of governance, financial resources and/or infrastructure and
physical installations. These services cover the provision of safe drinking water, the coverage,
treatment, quality control and the maintenance of the infrastructure (OECD, 2010). Continuous
poor governance and mismanagement of water resources exacerbate the problems of access
to, coverage, use and conservation of safe drinking water in developing countries (Sivakumar,
2011; Koutsoyanis, 2011; Lu et al., 2014). Water services and sanitation are often low in
government policy priorities. There is also a lack of government capacities and political will to
put in place and implement policies, regulations and institutions to efficiently and effectively
manage water resources as well as provide safe drinking water and adequate sanitation
services to all citizens (UNICEF, WHO & WSSCC, 2008; Lenton, Lewis & Wright, 2008; Krause,
2009; Jain & Singh, 2010; Sivakumar, 2011; Halleröd, Rothstein & Daoud, 2013; WWAP, 2015).
Current water management practices used in many developing countries, especially in Sub-
Saharan African countries, are inefficient and suboptimal to provide the level of quality and
quantity of safe drinking water needed (Jain & Singh, 2010; Sivakumar, 2011). Major
institutional constraints also worsen the situation creating more disparities in access to safe
drinking water (Cook et al., 2011). The key institutional constraint is the absence of appropriate
institutions at all levels that work in coordination to manage water resources and the demands
from each sector. The existing institutions, formal and informal, do not have adequate capacity,
accountability and transparency and sound regulatory systems to properly manage drinking
water services (Lenton et al., 2008).
13
Lack of sufficient and sustainable financial resources to provide safe drinking water and
adequately manage water resources as well as the ability to purchase the water on the part of
the people are major issues in many developing countries (Rheigans, Dreibelbis & Freeman,
2006; Lenton et al., 2008; Koustsoyiannis, 2011; Sivakumar, 2011). Corruption is an important
part of the problem (WWAP, 2015). Also the price of drinking water paid by people in
developing countries is often very high and represents a large portion of their household
income (Rheigans et al., 2006; United Nation Development Programme, 2006). The lack of
proper water infrastructures and technologies usually goes hand in hand with the problem of
insufficient financial resources. The development and maintenance of water infrastructures and
technologies require a lot of money and developing countries lack the funds to do it (Rheigans
et al., 2006; Lenton et al., 2008).
There are major disparities in the availability of infrastructure and services between rural and
urban communities (WHO & UNICEF, 2006). A much higher percentage of urban households
have access to drinking water than rural households. The causes for such disparities include
lower incomes of rural households, the high costs of extending services in rural areas, the
expansion of cities and consequently increasing needs and, the rural communities’ lower level
of political influence and power (Rheigans et al., 2006). However there are discrepancies
between users in urban settings as well, especially due to the rapid expansion of cities where
the provision of services cannot keep up with the demand. The rural to urban migration and
subsequently the rapid expansion of urban centres in developing countries is forcing millions of
people to live in in slums where there is minimal or no access to safe drinking water and basic
sanitation. The number of people living in such conditions is increasing (WHO & UNICEF, 2006;
United Nations, 2014). “Poor people living in the slums often pay five to ten times more for a
liter of water than the wealthy people living in the same city” (Jain & Vijay, 2010, p.221).
In regions and countries affected by wars, conflicts and political instability, access to safe
drinking water and basic sanitation to the population is greatly disturbed and consequently
diminished (WHO & UN-Water, 2012; WWAP, 2015). For example, several years of political
instability and numerous conflicts in Gaza are degrading the environment and the local water

14
resources. Consequently, the provision of safe drinking water to the population is becoming
more and more of a problem (Shomar, 2011) and sustainable solutions are only possible within
a stable political environment.
Availability of freshwater also depends on who owns or is assigned the right to it as in the case
of transboundary water sources where tensions and/or conflicts can arise and cause more
scarcity (Zeitoun & Mirumachi, 2008). Countries sharing water resources (both surface water
and groundwater resources) each want to use the amount of water required to meet the needs
for their citizens; however one country’s use of shared water resources will impact the usage of
another country and the ability to meet its needs (Jay & Singh, 2010; Linton & Brooks, 2011).
Without good cooperation and collaboration between countries, sharing the same water
resources, the effective management of the resources is impossible (Linton & Brooks, 2011;
Leb, 2014).
The inefficient use and waste of water is a major contributing factor to water scarcity.
Increasing demands on water resources require adequate and efficient water management
practices so that there is no waste. As the world population grows, more demand will have to
be met with the same amount of water we have today. Sharp increases in water use by all
production sectors (such as the manufacturing, energy and food industry) are often inefficient
and unsustainable causing unnecessary waste of the precious resources (WWAP, 2015).
Climate change contributes to intensifying water scarcity through changing the availability of
water supply. The amount of freshwater available for human use can vary depending on the
level of degradation of the water (for example through pollution). Consequences of climate
change contributing to water scarcity are an increase in frequency and magnitude of extreme
climatic events such as floods and droughts; an alteration of precipitation patterns; a decrease
in snow cover and; a faster and widespread melting of ice (World Bank, 2015; United Nations,
2014; Schiermeier, 2014; Alavian et al, 2009). It is expected that by 2025, 1.8 billion people will
live in countries or regions where there will be a state of absolute water scarcity (World Bank,
2015; United Nations, 2014). The United Nations describes absolute water scarcity as a

15
situation where annual water supplies of a country or region become less than 500 cubic
metres per person (United Nations, 2015).
1.1.2 Issues in Sustainable Access to Basic Sanitation
In broad terms, sanitation is defined by the World Health Organization (WHO) as the “provision
of facilities and services for the safe disposal of human urine and faeces” (WHO, 2015).
However the term sanitation also includes the maintenance of hygienic conditions through
services and activities such as the management, collection, use and/or recycling of household
wastewater (often referred to as sullage or grey water) and industrial waste, drainage of storm
water, management, reuse and/or recycling of solid waste, etc. (UNICEF, WHO & WSSCC, 2008;
WHO, 2015). The WHO/UNICEF Joint Monitoring Programme for water supply and sanitation
(JMP) defines “improved sanitation facility” as a facility “that hygienically separates human
excreta from human contact” (WHO/UNICEF JMP.). This definition is widely adopted among the
UN system.
The challenges that communities, regions and countries face due to the lack of sanitation
cannot be addressed with a “one-size fit all” type of solution; mostly because these challenges
are not the same everywhere. Each community, region or country needs to prioritize their
challenges and use pragmatic and flexible solutions to address them (UNICEF, WHO & WSSCC,
2008).
In 1990, the percentage of the world’s population who had access to improved sanitation
facilities was 54 percent; in 2015 it is 68 percent (UNICEF & WHO, 2015). There was an increase
in access to sanitation in developing countries except in Oceania where sanitation coverage has
remained the same since 1990. However in 46 countries, more than half of the population lack
access to improved sanitation facilities. The regions with the lowest sanitation coverage
continue to be South Asia and SSA (WHO & UNICEF, 2014; WHO 2014). There are still 2.4 billion
people in the world who do not have access to basic sanitation (UNICEF & WHO, 2015) and of
those, one billion practice open defecation i.e. “defecate in the open, for example in street
gutters, behind bushes or into open bodies of water” (WHO 2014).

16
The reasons for such a high number of the world’s population is living without access to basic
sanitation are the lack of infrastructures, services, financing and governance (Bartram, Lewis,
Lenton & Wright, 2005; Lenton et al., 2008; Mara, Lane, Scott & Trouba, 2010). As mentioned
earlier, addressing the sanitation crisis is often not a government policy priority. Both at the
international and national levels, sanitation do not get much attention. International aid
devotes a smaller percentage of budgets to address sanitation issues compared to other more
popular issues such health and education (Cumming, 2009; Cairncross, Bartram, Cumming &
Brocklehurst, 2010). At the national level, governments do not commit enough financial
resources to enable significant actions to solve sanitation issues. Being a low priority item on
national budgets, sanitation gets funded mostly through international aid (Lenton et al., 2008;
Cairncross et al., 2010).
Several institutional constraints further inhibit the enhancement of sanitation coverage.
National policies and plans for sanitation are generally nonexistent. Governments do not
develop or implement adequate and transparent regulations that oversee sanitation coverage
and services. Often, there are no appropriate institutions to administer the services and the
existing ones are highly dysfunctional. The lack of accountability and inadequate capacity are
also part of the problem (Lenton et al., 2008; Fry, Mihelcic & Watkins, 2008; Cumming, 2009;
Cairncross et. al, 2010).
Financial insufficiency is at the core of the problem as several developing countries depend on
external support to finance sanitation infrastructures and services (UNICEF, WHO & WSSCC,
2008; Fry, Mihelcic & Watkins, 2008; Krause, 2009; Jain & Singh, 2010; Halleröd, Rothstein &
Daoud, 2013; WWAP, 2015). Financial resources are needed to build improved sanitation
infrastructure, to refurbish existing ones and to provide the services that include the collection,
processing and treatment of waste (Rouse, 2014). In urban centers, the sanitation coverage is
better due to the higher levels of infrastructures and services however cities and government
fail to provide the same in slums and rural areas (Mara et al., 2010; Okuruta, Kulabakob,
Chenowetha & Charlesa, 2015).

17
The adverse social, economic and environmental consequences of the lack of sanitation are
very high. The discharge and/or accumulation of excreta, wastewater and other waste is the
root cause of several infectious diseases such as diarrheal disease, cholera, hepatitis (A and E)
and typhoid fever just to name a few (UNICEF, WHO & WSSCC, 2008; Fry, Mihelcic & Watkins,
2008; Barry & Hugues, 2008; WHO, 2014; Prüss-Ustün et al., 2014; WWAP 2015). It is estimated
that, in low and middle income countries, more than 840,000 people die each year due to the
lack of water, sanitation and hygiene (WHO, 2104). The lack of sanitation significantly
contributes each year to the high levels of child mortality (Cumming, 2009).
History has proven on numerous occasions that sanitation “is the single most cost-effective
major public health intervention” (Cumming, 2009 p12) and yet it is highly neglected. The
economy is also impacted by the lack of sanitation. The population suffering from the related
diseases have reduced and/or no capacities to be part of the active workforce or attend school
(in the case of students). With appropriate sanitation, people would be less sick and they would
then be able to focus their energy on their normal activities. Plus, it would reduce the burden
on health systems reducing expenses and therefore the need for financial resources which
could be redirected elsewhere (Cumming, 2009; Mara et al., 2010). The lack of sanitation
further increases pollution, especially water pollution since common practices are to directly
discharge untreated wastewater in the surrounding environment. Pollution from untreated
wastewater contaminates natural water resources like lakes and rivers and adversely impacts
fauna and flora. It even contaminates crops if they are irrigated or washed by polluted waters
(UNICEF, WHO & WSSCC, 2008; Baum, Luh & Bartram, 2013; WHO, 2104; WWAP, 2015).
1.1.3 International Initiatives to Address Water and Sanitation Concerns
Several initiatives were undertaken over the years to address the global water crisis: there was
the United Nation Water Conference in 1977, where access to water by “all peoples whatever
their stage of development and social and economic conditions” (UN-Water Decade
Programme on Advocacy and Communication (UNW-DPAC), 2014, p.1) was recognised as a
human right for the first time. The Conference was followed by the International Drinking
Water Supply and Sanitation Decade (1981 to 1990) during which approximately 1.3 billion

18
people living in developing countries gained access to safe drinking water (UNW-DPAC, 2014).
Water scarcity was one of the four main issues addressed in the Earth Summit of Rio de Janeiro
in 1992. The year 2003 was declared the “International Year of Freshwater” (UNW-DPAC, 2014).
Afterwards UN-Water, an inter-agency body of the United Nations responsible for the
coordination of all issues related to freshwater and sanitation was established (UN-Water,
2014). UN-Water is composed of 31 members that are UN entities such as the World Health
Organization (WHO), the Food and Agriculture Organization (FAO), United Nations International
Children’s Fund (UNICEF), United Nations Educational, Scientific and Cultural Organization
(UNESCO) and United Nations Environment Programme (UNEP). It also works in partnership
with 37 partner organisations that are not part of the UN systems. Some of those partners are
the World Wildlife Fund (WWF), WaterAid and Water.Org (UN-Water, 2014). Finally, the period
from the year 2005 to the year 2015 was proclaimed as the “International Decade for Water –
Water for Life” (UNW-DPAC, 2014).
1.2 Millennium Development Goal 7: Ensure Environmental
Sustainability In 2000, at the United Nations Millennium Summit, leaders of 189 countries agreed to take
action and commit to a global partnership in order to reduce extreme poverty (United Nations,
2015). Following the Summit, a group of experts from the UN, World Bank, International Money
Fund (IMF) and the Development Assistance Committee from the Organization of Economic Co-
operation and Development (OECD) worked together to identify measurable targets for the
MDGs (Hulme, 2007; Waage et al., 2010; Vandemoortele, 2011; Fehling, Nelson &
Venkatapuran, 2013; Brolan, Lee; Kim & Hill, 2014; United Nations, 2015). These targets were
drawn from not only the Millennium Declaration but also previous UN conferences and summit.
Also the International Development Goals (IDG) developed and published by the OECD in the
year 1996 strongly influenced the selection of the UN targets. A total of eighteen targets were
identified and grouped under eight objectives, each aligned to a specific theme, that were to be
achieved by 2015. These eight objectives became the Millennium Development Goals (MDG)
(Annex 1) (Hulme, 2007; Waage et al., 2010; Vandemoortele, 2011; Brolan, Lee; Kim & Hill,
2014). The group of experts determined that the MDGs would be measured using a span of

19
twenty-five years – using 1990 as the baseline year and 2015 as the end year (Vandermoortele,
2011; United Nations, 2001). The MDGs2 were “included in the Road map towards the
implementation of the United Nations Millennium Declaration, presented to the UN by
Secretary-General Kofi Annan on 6 September 2001, and endorsed the next year at the
International Conference on Financing for Development at Monterrey” (Brolan et al., 2014).
The seventh MDG aimed at ensuring environmental sustainability by 2015 (United Nations
2015). Environmental sustainability is not an easy concept to define. Goodland (1995) defines it
as the “maintenance of natural capital” where waste emissions is not produced faster than the
ability of the environment to assimilate in the present or in the future and where renewable
resources and non-renewable resources are used either within or below their regenerating
capacities and while better renewable substitute are developed. Environmental sustainability is
defined by the United Nations as “meeting current human needs without undermining the
capacity of the environment to provide for those needs over the long term” (UN Millennium
Project, 2005). Therefore “achieving environmental sustainability requires carefully balancing
human development activities while maintaining a stable environment that predictably and
regularly provides resources such as freshwater, food, clean air, wood, fisheries, and productive
soils and that protects people from floods, droughts, pest infestations, and disease” (UN
Millennium Project, 2005).
Environmental sustainability was to be ensured through four targets addressing the integration
of sustainable development principles into country policies and programmes. The four targets
were – (i) the reversion of environmental resources loss, (ii) reduction of biodiversity loss, (iii)
increase in sustainable access to safe drinking water and sanitation as well as the (iv)
improvement in the lives of the slum dwellers (Hulme, 2007; Waage et al., 2010; United Nations
2015). Each target had a set of indicators that measured their actual achievement through time
and at the deadline in 2015 (Hulme, 2007; Waage et al., 2010). Past initiatives by the United
Nations on environmental issues such as the Earth Summit in Rio de Janeiro and the Kyoto
Protocol agreement help forge the targets and indicators of MDG 7 (Castelló, Gil-González,
2 Please refer to Annex 1 for a description of each MDG.

20
Alvarez-Dardet & Hernández-Aguado, 2010; Waage et al., 2010). The IDGs developed by the
OECD in the year 1996 contained several targets addressing environmental issues such as water
and environmental sustainability (OECD-DAC, 1996). Subsequently, each country identified their
own MDG targets based on the global targets.
1.2.1 Millennium Development Goal 7: Target C
This MRP will focus on the assessment of the third target (Target C) of the seventh MDG, which
consists of reducing by half the number of people living without sustainable access to drinking
water and basic sanitation (United Nations, 2015). Initially when the eight MDGs were
presented in the Road map towards the implementation of the United Nations Millennium
Declaration in 2001, only the target for water was introduced. It is only during the United
Nations Summit on Sustainable Development held in 2002 in Johannesburg (South Africa) that
the target for sanitation was added to the seventh MDG (Salman, 2005).
As outlined before, it was estimated that in 2000, 18 percent of the world population or 1.1
billion people lacked access to safe drinking water; and approximately 50 percent of the world
population lacked basic sanitation (United Nations, 2001). Target C of the seventh MDG was set
to reduce by half by the year 2015 the proportion of the world population living without
sustainable access to safe drinking water and basic sanitation in 1990 (United Nations, 2015). It
meant that by 2015, the proportion of population living without access to safe drinking water
and/or sanitation was to be reduced to at least 9 percent and 25 percent respectively.
The achievement of target 7.C will play a crucial role in poverty alleviation. As argued before,
water and sanitation are key elements to several aspects of human health, development and
well-being (Annan, 2000; Jain & Singh, 2010). Indeed, the achievement of all the other MDGs
will depend on the achievement of this target. The collateral damages of living without safe
drinking water and/or basic sanitation are far greater than just health damages - the natural
environment, the quality of life, the education and the economic development of people and of
entire communities are also highly affected (Jain & Singh, 2010; United Nations World Water
Assessment Programme (WWAP), 2105). Access to safe drinking water and basic sanitation can
help eradicate extreme poverty and hunger (MDG 1) by reducing the burden of diseases

21
resulting from the consumption of contaminated water and food by wastes, including human
wastes, and contaminants (chemicals such as arsenic and lead, industrial pollutants and
solvents). Improved sanitation and drinking water reduces the exposure to intestinal helminths
(intestinal parasitic worms), occurrence of diarrheal diseases and other water-borne diseases
(MDG 6) (Rheingans, et al., 2006; Brocklehurst & Bartram, 2010; Jain & Singh, 2010; Marwah &
Marwah, 2013). Consequently, families will be in better health, and less of their income will be
put towards medical expenses. The morbidity and mortality caused by diarrheal diseases and
other water-borne diseases in children, especially under the age of 5, will be reduced (MDG 4).
Adults will be able to spend more time on economic and income generation activities and
children, be able to attend school (MDG 2) thus helping to reduce poverty by raising income
and skill levels (Rheingans, Dreibelbis & Freeman, 2006; Marwah & Marwah, 2013). Also
households will be able to use safe water for bathing and cooking which reduces health
complications and the burden of diseases (Marwah & Marwah, 2013).
Furthermore, Target 7.C was intended to help increase gender equality (MDG 3) as its
achievement would reduce the burden on women and children, mostly girls, to collect water. In
some cases, women and girls spend several hours of their day in fetching water thereby
reducing the time spent on other more productive activities like caring for their children,
handicrafts, farming and other income generating activities (MDG 1). Girls will be able to attend
school and continue their education (MDG 2) if target 7.C is met (Rheingans, Dreibelbis &
Freeman, 2006; Brocklehurst & Bartram, 2010; Jain & Singh, 2010; Marwah & Marwah, 2013).
Plus adding adequate toilets in schools can provide girls with privacy for menstrual hygiene and
therefore encouraging them to continue their education instead of stopping school once they
start their menstruations (MDG 2 and 3) (Brocklehurst & Bartram, 2010). The reduction of the
burden of fetching water on women and children increase their safety as it reduces the chance
of injuries that be caused during this task (Rheingans, Dreibelbis & Freeman, 2006). A better
health and the reduction of injuries for women also contribute to improve maternal health
(MDG 5) (Rheingans, Dreibelbis & Freeman, 2006; Brocklehurst & Bartram, 2010).

22
1.3 Research Question The MRP will concentrate on analysing the implementation of target 7.C in SSA generally and
through case studies of two countries – Nigeria and South Africa. It will inquire:
i) Whether the MDG Target 7.C - halve, by 2015, the proportion of the population without
sustainable access to safe drinking water and basic sanitation - has been met in this
region;
ii) Are there differences in performance among the case study countries?
a. Where was it met and why; and,
b. Where was it not met and why?
The MRP will conclude with recommendations on how to improve performance beyond 2015 in
SSA in order to contribute to the current discussion on post-2015 sustainable development
goals.
1.4 Research Methodology The analysis in this MRP is based on secondary data and extensive literature review. The
research is structured sequentially as follows:
1. A literature survey will outline challenges and issues related to safe drinking water and
sanitation. The literature survey was conducted by undertaking extensive search using the
databases available via the University of Ottawa library. The survey also used key word
searches (such as “drinking water”, “sewage”, “sanitation” and “open defecation”) in order
to better target the search results. After the literature is selected, a thorough scanning of it
is done based on specific key themes to help build the assessment of the MRP research
questions.
2. The literature survey and the United Nations’ official data on the MDGs will be used to
create a baseline on the state of access to safe drinking water and basic sanitation in the
selected sub-Saharan African countries prior to the year 2000 in order to assess the
achievement of the MDG Target 7.C in these countries.

23
3. The literature survey will also be used to determine what actions and/or initiatives the
international community and countries themselves have undertaken to achieve the target,
including the reasons behind the choices of these actions/initiatives and what the
outcomes were.
4. The MRP will then provide an analysis on whether the target 7.C was met in the selected
countries and in SSA in general, and why or why not. The analysis will illustrate where there
are gaps in achieving the target and what the causes are.
5. Finally, this MRP concludes with a series of recommendations for action in the water and
sanitation sectors for the new Sustainable Development Goals (SDG) to be set post-2015.
All quantitative data used in the MRP will be from the official data on the MDG indicators
prepared by the United Nations Statistics Division to ensure consistency. This data is based on
computations by the WHO and UNICEF Joint Monitoring Programme (JMP) for Water Supply
and Sanitation. All definitions used in the MRP are also taken from the official definition used
by the United Nations.
The selection of the case study countries was based their progress on the accessibility of
drinking water and sanitation since 1990. SSA was chosen as the case study region because it is
where the achievement of the MDGs Target 7.C was the least successful. The MRP proposal had
suggested that the case studies would be of two countries that were successful in the
achievement of Target 7.C and two others that were not successful in order to identify the good
and bad practices and formulate stronger recommendations. The countries originally selected
in the MRP proposal were Nigeria, Somalia, South Africa and the Democratic Republic of the
Congo. However, on further examination of the data, it was found that it would not be possible
to do a substantive analysis for Somalia and the Democratic Republic of the Congo due to
insufficient data and literature. For example, the UN data on Somalia is not complete and does
not lend itself to useful analysis. Therefore, the countries of the case study presented in the
MRP are Nigeria and South Africa for which a large quantity of quality information is available.

24
1.5 Organisation of the Major Research Proposal The MRP consists of 5 chapters,
• Chapter 1 has provided the contextual information for the MRP in describing the drinking
water and sanitation challenges and the MDG 7 and Target 7.C respectively. The first
chapter also provided the research question, the research methodology and the
organisation of the MRP.
• Chapter 2 presents the status of access to safe drinking water and basic sanitation prior to
2000 in SSA and the case study countries based on available quantitative information on
access to safe drinking water and basic sanitation as well as explanations for the causes of
the good and/or bad status.
• Chapter 3 presents progress on the access to safe drinking and basic sanitation since 2000
in SSA and the case study countries and their current status.
• Chapter 4 of the MRP consists of an analysis of the achievement of MDG Target 7.C in SSA
and case study countries and the remaining gaps.
• Finally, Chapter 5 provides recommendations for future actions in the water and sanitation
sectors in the post- 2015 period.

25
2 Status of Access to Safe Drinking Water and Basic Sanitation
Prior to 2000 in Sub-Saharan African Countries
2.1 Definitions The official indicators used to monitor the progress of Target 7.C, for access to safe drinking
water and basic sanitation are respectively the “proportion of population using an improved
drinking water source” and “the proportion of population using an improved sanitation facility”
(United Nations, 2015). The definitions are determined by UNICEF and WHO, the two agencies
responsible for the monitoring of Target 7.C.
Term Definition
Improved Drinking Water Source
Source of water “that, by the nature of its construction and when properly used, adequately protects the source from outside contamination, particularly faecal matter” (UNICEF & WHO, n.d, para. 1).
It includes: • “piped water into dwelling, yard or plot; • public tap or standpipe; • tubewell or borehole; • protected dug well; • protected spring; and rainwater” (UNICEF & WHO, n.d, para. 2).
Unimproved Drinking Water Source
It includes: • “unprotected spring; • unprotected dug well; • cart with small tank/drum; tanker-truck; • surface water (rivers, dams, lakes, ponds, streams, canals, and irrigation
channels); • bottled water” (UNICEF & WHO, n.d, para. 3).
Improved Sanitation Facility
Sanitation facility that hygienically separates human excreta from human contact” (UNICEF & WHO, n.d, para. 1).
It includes: • “flush toilet; • piped sewer system; • septic tank; • flush/pour flush to pit latrine; • ventilated improved pit latrine (VIP); • pit latrine with slab; • composting toilet” (UNICEF & WHO, n.d, para. 3).

26
Unimproved Sanitation Facility
It includes: • “flush/pour flush to elsewhere (that is, not to piped sewer system,
septic tank or pit latrine); • pit latrine without slab; • bucket; • hanging toilet or hanging latrine and no facilities or bush or field” (which
result in open defecation) (UNICEF & WHO, n.d, para. 4).
These definitions only focus on the infrastructural aspects of the water source or the sanitation
facility per se. They do not provide a sense of the depth of the complexity the concepts of
drinking water and sanitation entail. These definitions contain several gaps that are essential
components required to do comprehensive assessment of the access to safe drinking water and
adequate sanitation in any given country. First, they do not include the water quality. For
example, an improved drinking water source could in fact provide water contaminated with
faecal matter or chemicals. The definitions need to be widened to assess microbial water
quality (which include faecal matter assessment) and chemical water quality as well (Onda,
LoBuglio & Bartram, 2012; Kayes, Moriarty, Fonseca & Bartram, 2013; Bartram et al, 2014).
Second, it would be essential to measure if the delivery services are reliable and continuous
over time or if they fluctuate depending on different contexts like the season. Also the
definitions need to measure if the services are affordable and accessible to all without
discrimination including accessibility and equity of access, especially between genders (Kayes,
Moriarty, Fonseca & Bartram, 2013; Bartram et al, 2014). Finally, these definitions focus only
on the household level and do not consider access in places like schools and workplaces. Extra
household services are another key component to be included in the definitions and
assessment of access to drinking water and sanitation (Bartram et al, 2014). For example,
schools in a given area could lack access to safe drinking water and adequate sanitation
facilities while all the households in that area do have access. Consequently with the current
definitions, the assessment of access would omit that the children going to school in this given
area and their teachers are exposed regularly to unsafe water and inadequate sanitation;
putting their health at risk. Future definitions need to be more comprehensive and complete.
27
2.2 Sub-Saharan Africa
2.2.1 Access to Safe Drinking Water Prior to 2000 (Quantitative Data)
Source: WHO/UNICEF Joint Monitoring Programme for Water Supply and Sanitation
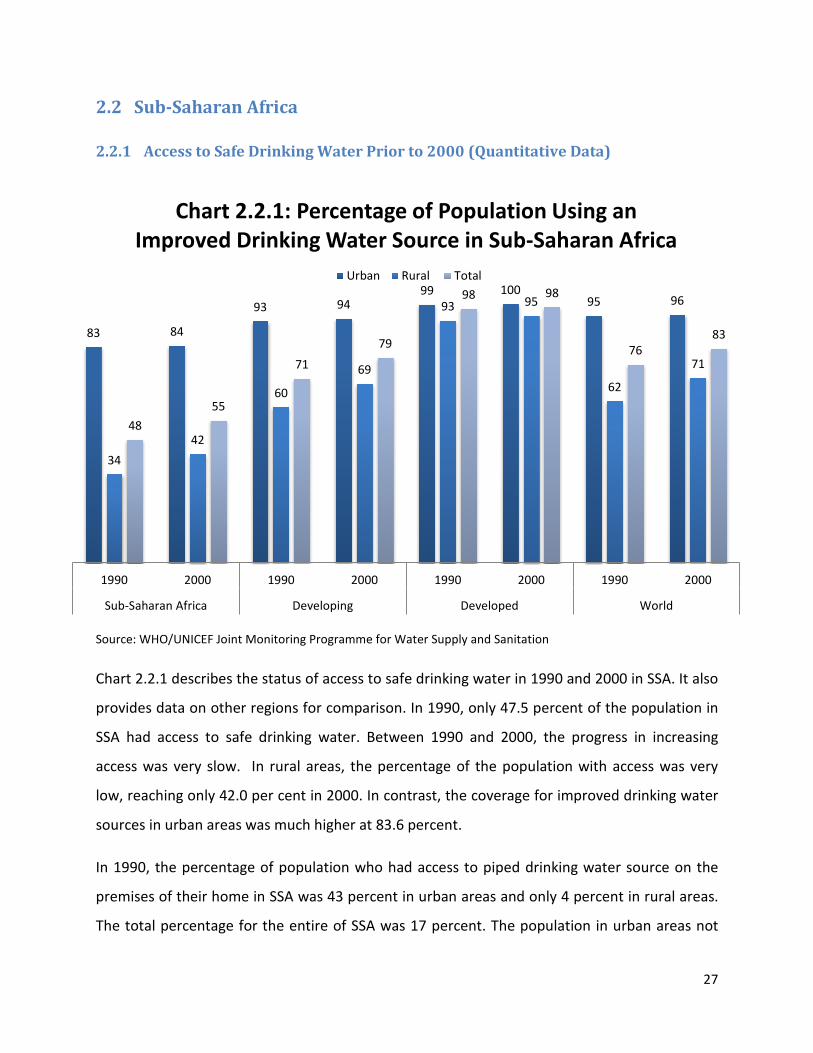
Chart 2.2.1 describes the status of access to safe drinking water in 1990 and 2000 in SSA. It also
provides data on other regions for comparison. In 1990, only 47.5 percent of the population in
SSA had access to safe drinking water. Between 1990 and 2000, the progress in increasing
access was very slow. In rural areas, the percentage of the population with access was very
low, reaching only 42.0 per cent in 2000. In contrast, the coverage for improved drinking water
sources in urban areas was much higher at 83.6 percent.
In 1990, the percentage of population who had access to piped drinking water source on the
premises of their home in SSA was 43 percent in urban areas and only 4 percent in rural areas.
The total percentage for the entire of SSA was 17 percent. The population in urban areas not
83 84
93 94 99 100
95 96
34 42
60
69
93 95
62
71
48 55
71 79
98 98
76 83
1990 2000 1990 2000 1990 2000 1990 2000
Sub-Saharan Africa Developing Developed World
Chart 2.2.1: Percentage of Population Using an Improved Drinking Water Source in Sub-Saharan Africa
Urban Rural Total

28
using improved sources of drinking water was 13 percent and in rural areas, it was 32 percent.
Also the proportion of population directly using surface water from water bodies like lakes and
rivers was only 4 percent in urban areas but 34 percent in rural areas. In SSA, the percentage of
population using unimproved drinking water sources and for surface water usage was 26
percent (UNICEF & WHO, 20153).
Overall, the progress done between the year 1990 and the year 2000 was very slow. There was
only an increase of approximately 7 percent of population who gained access to improved
drinking water sources in SSA. The access increased approximately 8 percent in rural areas
while the portion of population with access to safe drinking water in urban areas remained the
same.
3 UNICEF and WHO are the two agencies in charged for monitoring and reporting the data on drinking water and sanitation via the WHO/UNICEF Joint Monitoring Programme for Water Supply and Sanitation (JMP). The data is then reported to the United Nations Statistics Division which compiles all the data for all the MDC indicators.

29
2.2.2 Access to Basic Sanitation Prior to 2000 (Quantitative Data)
Source: WHO/UNICEF Joint Monitoring Programme for Water Supply and Sanitation
Chart 2.2.2 provides snapshots of the sanitation situation between 1990 and 2000. As shown by
the data above, the progress in access to basic sanitation was almost non-existent between
1990 and 2000, in SSA. In 1990, the percentage of population with access to improved
sanitation was 24 percent and in 2000, it was 25.6 percent. This represented an annual increase
of only 2 percent over the decade. The urban population with access to improved sanitation
remained stagnant over the same period and the rural population gained 1 percent; passing
from 18 percent to 19 percent. The percentage of the population practicing open defecation
decreased from 35 percent to 32 percent (UNICEF & WHO, 2015).
40 40
65 67
96 96
79 80
18 19
28 35
90 90
35 41
24 26
41 48
94 95
54 59
1990 2000 1990 2000 1990 2000 1990 2000
Sub-Saharan Africa Developing Developed World
Chart 2.2.2: Percentage of Population Using Improved Sanitation in Sub-Saharan Africa
Urban Rural Total

30
2.2.3 Cause for Lack of Access to Safe Drinking Water and Sanitation in SSA
2.2.3.1 Physical Aspects of Water Scarcity
As a whole, the SSA has “abundant water resources in large rivers, great lakes, vast wetlands
and limited but widespread groundwater” (Mwanza, 2003, p.102). A large part of the resources
is found in the sub-region of Central Africa. In fact, the Democratic Republic of Congo is one of
the top 10 countries in the world with the largest freshwater supplies (Keen, 2001). However
some regions in SSA experience physical water scarcity due to lower annual rainfalls and dryer
climate. The Sahel region, some Southern African countries like South Africa and Zimbabwe, as
well as Somalia and Kenya experienced water stress and/or water scarcity (Clay, 1994; Keen,
2001; Mwanza, 2003).
Despite the unequal distribution of water, SSA has a lot of water potential as a whole. For a
region to be considered under physical water stress, it needs to exceed the water resources
withdrawal threshold of 25 percent. SSA withdrew less than 3 percent of its total water
resources (United Nations, 2008, 2015). Clearly the scarcity of potable water in the region
mostly resulted from human activity.
2.2.3.2 Human induced water scarcity
Access to safe drinking water and sanitation were attributed a low priority by government and
not much financial resources were allocated to them (Nordberg & Winblad, 1994; Clay, 1994;
Mwanza, 2003; Boadi, Kuitunen, Raheem & Hanninen, 2005). The progress to address the
issues is very slow and almost stagnant in the case of sanitation (Clay, 1994). Policies and
regulations ensuring transparency and accountability were not developed and implemented by
governments to improve the services. Corruption is a continuous problem (Mwanza, 2003;
Boadi et al., 2005). Adequate infrastructures and qualified human resources to maintain the
infrastructures and to manage the services were lacking both in urban and rural areas
(Nordberg & Winblad, 1994; Clay, 1994; Mwanza, 2003). There were large disparities between
the rich and poor populations. In urban areas, only the rich have access to drinking water and
sanitation services with direct household piped connections. The poorest people living in urban
centers were mostly living in slums where drinking water and sanitation services were absent.
31
They had to use either unmaintained shared sanitation facilities and that is when they are
available (Nordberg & Winblad, 1994; Mwanza, 2003; UN, 2005; UNICEF & WHO, 2015).
Environmental problems were also present further worsening the problems. Water pollution
was a major problem during the 1990-2000 period. Pollutants and untreated wastewater from
industry, mining, agriculture contaminated water resources and increased environmental
degradation (Clay, 1994; Mwanza, 2003; UN, 2005; Boadi et al., 2005). Water related diseases
were major public health problems; diarrhoeal diseases were a major cause of child morbidity
and mortality just like today (Nordberg & Winblad, 1994; Clay, 1994; Mwanza, 2003; Boadi et
al., 2005). Water scarcity was starting to become an issue in certain parts of SSA; it was noted
that the number of droughts event had increased considerably (Clay, 1994; Mwanza, 2003).
Population growth also had an impact on the capacity to provide adequate water and
sanitation services. The rapid population growth, especially in urban centers, offset the efforts
of many countries to expand services (Nordberg & Winblad, 1994; Clay, 1994; Mwanza, 2003;
UN, 2005).

32
2.3 Nigeria
2.3.1 Access to Safe Drinking Water Prior to 2000
Source: WHO/UNICEF Joint Monitoring Programme for Water Supply and Sanitation
Chart 2.3.1 describes the access to drinking water situation in Nigeria with data provided for
SSA for comparison. Access to safe drinking water in Nigeria was relatively low in 1990 at only
40 percent. However between 1990 and 2000, Nigeria made a lot of progress and more than
half the population (52 percent) had access to improved drinking water sources by the end of
the decade - an increase of almost 12 percent. Compared to the overall progress in SSA, Nigeria
showed positive progress. Nevertheless, half of the population was still living without safe
drinking water.
In urban areas, 76 percent of the population already had access to safe drinking water in 1990.
Although the increase in access by 2000 was not as significant as the overall country increase, 2
percent more of the population gained access to safe drinking water. In rural areas, the
progress was more significant and the percentage of population with access to improved
76 78 83 84
25
38 34
42 40
52 48
55
1990 2000 1990 2000
Nigeria Sub-Saharan Africa
Chart 2.3.1: Percentage of Population Using an Improved Drinking Water Source in Nigeria
Urban Rural Total

33
sources of drinking water went from 25 percent to 38 percent over the 10 years period. The
percentage of people still collecting drinking water from surface water was high in rural areas in
the year 1990 at 50 percent. In urban areas, the percentage was considerably lower at 7
percent. By 2000, the portion of population using surface water decreased to 36 percent and 5
percent respectively. Overall, the portion of population using surface water lowered from 37
percent to 25 percent (WHO & UNICEF).
2.3.2 Access to Basic Sanitation Prior to 2000 (Quantitative Data)
Source: WHO/UNICEF Joint Monitoring Programme for Water Supply and Sanitation
Chart 2.3.2 describes the sanitation situation in Nigeria with data provided for SSA for
comparison. The access to basic sanitation in Nigeria decreased by 4 percent during 1990-2000.
This is a step back for the country especially when compared to SSA, which had demonstrated
slow but steady progress. In 1990, 38.1 percent of population had access to improved
sanitation and in the year 2000, the proportion declined to 34 percent. Both in urban and rural
areas, population with access to improved sanitation decreased from 37.7 percent and 38.2
percent in 1990 to 35.8 percent and 33.1 percent in 2000 respectively. Consequently, more
people were living with inadequate sanitation facilities at the end of the decade.
38 36 40 40 38
33
18 19
38 34
24 26
1990 2000 1990 2000
Nigeria Sub-Saharan Africa
Chart 2.3.2: Percentage of Population Using Improved Sanitation in Nigeria
Urban Rural Total

34
Fortunately, the number of people practicing open defecation decreased both in urban and
rural areas as well as in the entire country between the years 1990 and 2000. However more
people used other types of unimproved sanitation instead of improved sanitation facilities
(WHO & UNICEF).
2.3.3 Cause for Lack of Access to Safe Drinking Water and Sanitation
2.3.3.1 Physical Aspects of Water Scarcity
Nigeria has abundant supplies of surface and groundwater. However the water resources are
unevenly distributed in the country: the northern regions have a semi-arid and arid climate that
limit the amount of rainfall and water resources (Akujieze, Coker & Oteze, 2003; Olajuyigbe,
2010). As in the whole of SSA, water scarcity in Nigeria is also mainly due to human actions
rather than actual physical water scarcity.
2.3.3.2 Human Induced Water Scarcity
Over the years, Nigerian governments allocated large sums of money in the water and
sanitation sectors. However despite the high level of funding, water services remained weak
and inefficient (Sangodoyin, 1991; Areola & Akintola, 1997). The main causes were first the lack
of qualified water professionals with higher level of education (mainly university and college)
(Areola & Akintola, 1997). Insufficient numbers of qualified professional were working in the
operational and maintenance sectors of the regional water agencies. Therefore the operation
and maintenance of the water technologies were left to unqualified personnel (Areola &
Akintola, 1997; Enabor, Sridhar & Olaseha, 1998).
Another cause for the inefficient services was the lack of transparency and the misuse of funds
in the water agencies. In addition, the investment in expensive and inappropriate technologies
contributed to the waste of government funding in the water and sanitation sector since the
technologies did not cater to the country’s actual needs and were costly to maintain or repair
(Enabor, Sridhar & Olaseha, 1998). Weak policies and the lack of adequate infrastructure both
in urban and rural areas contributed to the problem (Sangodoyin, 1991; Chokor, 1993; Areola &
Akintola, 1997). Rapid urbanization of the Nigerian cities and the oil industries contributed to
35
increasing water pollution in the country (Sangodoyin, 1991; Chokor, 1993; Arimah, 1996;
Enabor, Sridhar & Olaseha, 1998) and reduced availability of safe drinking water.
2.4 South Africa
2.4.1 Access to Safe Drinking Water Prior to 2000
Source: WHO/UNICEF Joint Monitoring Programme for Water Supply and Sanitation
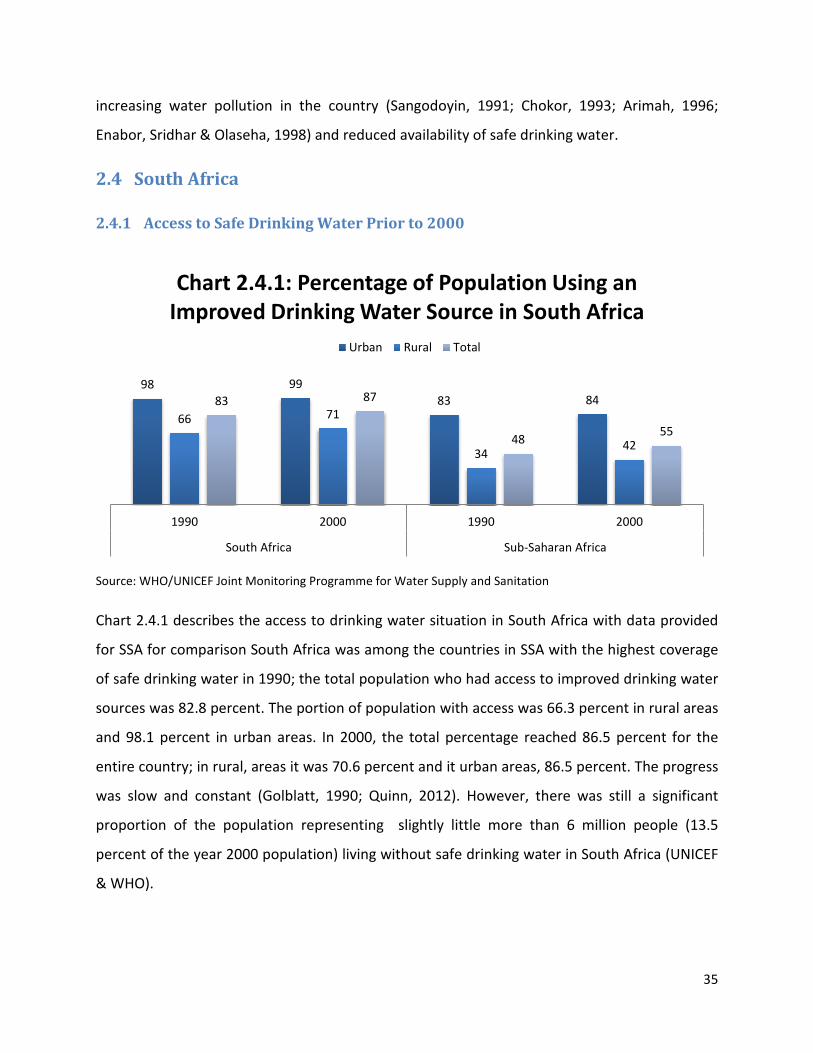
Chart 2.4.1 describes the access to drinking water situation in South Africa with data provided
for SSA for comparison South Africa was among the countries in SSA with the highest coverage
of safe drinking water in 1990; the total population who had access to improved drinking water
sources was 82.8 percent. The portion of population with access was 66.3 percent in rural areas
and 98.1 percent in urban areas. In 2000, the total percentage reached 86.5 percent for the
entire country; in rural, areas it was 70.6 percent and it urban areas, 86.5 percent. The progress
was slow and constant (Golblatt, 1990; Quinn, 2012). However, there was still a significant
proportion of the population representing slightly little more than 6 million people (13.5
percent of the year 2000 population) living without safe drinking water in South Africa (UNICEF
& WHO).
98 99 83 84
66 71
34 42
83 87
48 55
1990 2000 1990 2000
South Africa Sub-Saharan Africa
Chart 2.4.1: Percentage of Population Using an Improved Drinking Water Source in South Africa
Urban Rural Total
36
In the year 1990, 56 percent of the South African population had access to piped-in drinking
water directly either in their house or plot or yard. The portion of population with the same
type of access increased to 62 percent in the year 2000. Only 13 percent of the population used
surface water in the 1990 and it reduced to 3 percent at the end of the decade (UNICEF &
WHO).
2.4.2 Access to Basic Sanitation Prior to 2000 (Quantitative Data)
Source: WHO/UNICEF Joint Monitoring Programme for Water Supply and Sanitation
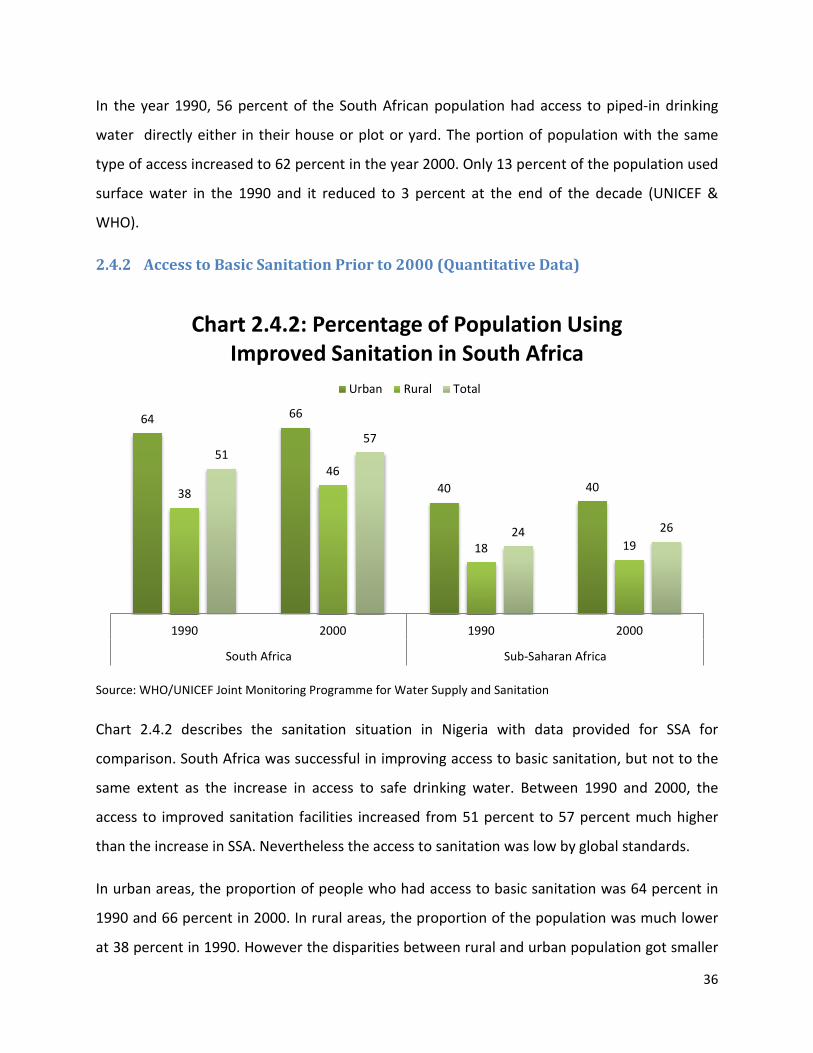
Chart 2.4.2 describes the sanitation situation in Nigeria with data provided for SSA for
comparison. South Africa was successful in improving access to basic sanitation, but not to the
same extent as the increase in access to safe drinking water. Between 1990 and 2000, the
access to improved sanitation facilities increased from 51 percent to 57 percent much higher
than the increase in SSA. Nevertheless the access to sanitation was low by global standards.
In urban areas, the proportion of people who had access to basic sanitation was 64 percent in
1990 and 66 percent in 2000. In rural areas, the proportion of the population was much lower
at 38 percent in 1990. However the disparities between rural and urban population got smaller
64 66
40 40 38
46
18 19
51 57
24 26
1990 2000 1990 2000
South Africa Sub-Saharan Africa
Chart 2.4.2: Percentage of Population Using Improved Sanitation in South Africa
Urban Rural Total
37
as the population who had access to basic sanitation in rural areas increased to 46 percent. In
1990, the proportion of the population practising open defecation was 2 percent in urban
areas, 27 percent in rural areas and 14 percent overall in the country. The proportion of urban
population defecating in the open remained at 2 percent. Both the proportion of rural overall
country’s population decreased to 21 percent and 10 percent respectively (UNICEF & WHO).
2.4.3 Cause for Lack of Access to Safe Drinking Water and Sanitation
2.4.3.1 Physical Aspects of Water Scarcity
South Africa is a water scarce country; most of its regions have a semi-arid climate where
droughts are common and rainfall uneven. The average annual levels of rainfall for the country
are below the global average. Some regions of the country have higher levels of rainfall while
others are really below than the country’s average. Also the high evaporation rates of water
due to the semi-arid climate increase the problems of water scarcity (De Villiers, Schmitz &
Booysen, 1996).
In addition, the country is poor in groundwater with only a low numbers of small aquifers that
have limited quantity of water. South Africa has only a few large aquifers but their distribution
in the country makes it complicated to exploit. The country has big rivers with larger water
volumes located on the east and south coast but unfortunately they are far from most
population concentration points where water demands are high (De Villiers, Schmitz &
Booysen, 1996; Basson & Rooyen, 1998).
2.4.3.2 Human induced water scarcity
During the mid-1990s, South Africa faced many challenges after the end of the apartheid in
1994. Before the election of Nelson Mandela, most water and sanitation services in rural and
urban areas were directed solely to the white population. Black people had barely any access to
these services. However under the new democratic government, the focus of the services
changed and they were made available to all the population regardless of the race (Eberhard &
Quick, 1995; Golbalt, 1996; Naidoo & Constantinides, 2000).

38
There was a need to expend the water and sanitation infrastructure to ensure adequate
services to all. New water legislation, policies and regulations were also required to address the
new reality of the country which recognized the right to drinking water and basic sanitation for
all citizens (Golbalt, 1996; Naidoo & Constantinides, 2000).
Rural and urban areas inhabited by black people were extremely undeveloped and highly
populated. In the mid-1990s approximately 17.5 million black people lived with no access to
piped water compared to only 5,000 white people (Golbalt, 1996). Evening out this unequal
balance required the rapid expansion of the services to provide drinking water and sanitation
services to the neglected population in the post-apartheid period. However, the expansion of
these services faced some significant challenges (Golbalt, 1996; Naidoo & Constantinides,
2000).
First, the management of water resources had to be completely reformed since the water
resources are scarce and more people had to use them. Second the agencies responsible for
the provision of water and sanitation services had to be reformed since they were mostly
unregulated during the apartheid. They had to become more accountable and responsible
towards their consumers, including the new ones. They also had to efficiently use their limited
economic resources as well as address water scarcity and the service backlogs from the
apartheid period. Finally, the reformed agencies had to maintain the infrastructures and ensure
sustainable and affordable services to all (Naidoo & Constantinides, 2000). The new water
policies and legislation had to be developed in order to address the inequalities between races
(Golbalt, 1996; Naidoo & Constantinides, 2000).
The expansion of the sanitation and water services required a huge amount of investment over
a span of the 10 years in order to be successful. The Government of National Unity had to
develop a fair tariff and income policy that took into consideration the poorest people, to
ensure the financial sustainability of the new expended services. This new tariff and income
policy was also needed due to the country’s limited economic resources (Golbalt, 1996; Naidoo
& Constantinides, 2000).

39
Finally, the population growth especially in urban areas also created challenges for the
expansion of the services. The government and water agencies had to address at the same time
the backlogs for access to services coming from the apartheid period and the increasing
demands caused by population growth (De Villiers & Booysen, 1996; Golbalt, 1996; Naidoo &
Constantinides, 2000).
3 The situation in Sub-Saharan Africa and the case study
countries since 2000
3.1 Sub-Saharan Africa Charts 3.1.1 and 3.1.2 describe the scenario in SSA in the post-2000 period for access to clean
water and improved sanitation respectively. The MDG targets for SSA based on 1990 baseline
figures are 74 percent for access to safe drinking water and 62 percent for access to basic
sanitation (UNICEF & WHO, 2015).
Source: WHO/UNICEF Joint Monitoring Programme for Water Supply and Sanitation
84
85
87 94
95
95 10
0
100
100
96
96
96
42 51
56 69
79 83 95
97
98
71 80
85
55 63
68 79
86
89 98
99
99
83 88
91
2000 2010 2015 2000 2010 2015 2000 2010 2015 2000 2010 2015
Sub-Saharan Africa Developing Developed World
Chart 3.1.1: Percentage of Population Using an Improved Drinking Water Source in Sub-Saharan Africa
Urban Rural Total

40
Source: WHO/UNICEF Joint Monitoring Programme for Water Supply and Sanitation
3.1.1 Progress on Access to Safe Drinking Water and Basic Sanitation Since 2000
Many of the challenges faced by the drinking water and sanitation sectors between 1990 and
2000 continue to be the same ones today. Progress on increasing access to safe drinking water
and sanitation has been slow in the Sub-Saharan African Region. Access to safe drinking water
grew at an average of 1 percent per year between the years 2000 and 2015. The average
annual progress on access to basic sanitation was less than 1 percent (Salami, Stampini,
Kamara, Sullivan & Namara, 2014; UNICEF & WHO, 2015). The MDG targets were not met in
either case although the region was close to the desired target in the case of access to safe
drinking water.
The developing countries, as whole, have made positive continuous progress in meeting the
MDG target 7.C and have reached the target to halve the proportion of the population without
access to safe drinking water (United Nations, 2015; UNICEF & WHO, 2015) in advance of the
2015 target date. However, SSA has lagged behind. Globally and in the developing countries,
the gaps between urban and rural population with regard to access to safe drinking water have
40
41
40
69 73 77
96
97
97
80
81
82
19
22
23 32
43 47
90
91
91
41 48
51
26
28
30
47 56
62
95
95
96
59 65
68
2000 2010 2015 2000 2010 2015 2000 2010 2015 2000 2010 2015
Sub-Saharan Africa Developing Developed World
Chart 3.1.2: Percentage of Population Using Improved Sanitation in Sub-Saharan Africa
Urban Rural Total

41
narrowed over the last fifteen years. Unfortunately in SSA, these gaps have barely decreased
during the same period of time.
The scenario on access to basic sanitation is less optimistic. Neither on the global scale nor in
developing countries nor in SSA has the progress been significant to enough to meet the target.
Since the year 2000, SSA was unable to improve the coverage to be even close to the MDG
Target of 62 percent (UNICEF & WHO, 2015). In fact, the access to basic sanitation in the SSA
has been stagnant when the population growth over these years is taken into account –
although the percentage of the population practising open defecation has decreased, the actual
number of people has in fact increased (UNICEF & WHO, 2015). Compared to the overall figure
for the developing countries, the progress done in the Sub-Saharan African region is very low.
Even though environmental causes are partly responsible for the slow progress in meeting the
MDG targets, it is mostly human induced activities that are the root causes for the slow
progress in SSA (Salami, Stampini, Kamara, Sullivan & Namara, 2014; UNICEF & WHO, 2015). As
mentioned in the previous chapter, as a whole SSA has sufficient water resources to meet its
human and environmental needs (Mwanza, 2003). Only some parts of the region experience
water scarcity due to arid and semi-arid climates, lower annual rainfall and low water
availability due to natural causes. However, SSA is globally the most vulnerable region to the
effects of climate change. More Sub-Saharan African countries are at risk of becoming water
stressed because of irregular rainfall, the decrease in water surfaces and the deepening of the
water tables. Over the years, more droughts and floods have been recorded. These new
environmental conditions that the region is facing are causing the slow progress in access to
safe drinking water and sanitation (Frankhauser & Schmidt-Traub, 2011; Pullan, Freeman,
Gething & Brooker, 2014).
While the physical aspects are causes for concern, the major root causes of the slow progress
are human activities or inactivities and most of these causes are the same as those observed in
2000. Poor governance is still a key factor in the slow progress towards the achievement of
MDG Target 7.C (Pullan et al., 2014; Salami et al., 2014; Burki, 2015). Although safe drinking
water and basic sanitation are now included in many national, regional and international

42
policies, development strategies, regulations etc., they are still a low priority for most
governments. On average, water and sanitation occupy a small percentage of national budgets
(Galan, Kim & Graham, 2013; Salami et al., 2014) and the implementation of the policies and
strategies to achieve the targets has been a constant challenge for SSA partly as a result of the
low budgets (Galan et al., 2013). At the local level, the institutions responsible for both drinking
and sanitation are often not equipped to manage and/or do not have the capacity to manage
sanitation issues. As a result, they often focus only on access to drinking water. Consequently, it
is estimated that most of the financial resources intended for both sectors end up only being
used for drinking water services (Galan et al., 2013; Salami et al., 2014; Burki, 2015).
Insufficient financial resources also played a major role in the slow progress over the years. It is
difficult to actually determine how governments allocated and used the financial resources
coming from development aid and national budgets that were originally intended for drinking
water and sanitation. Over the years, SSA received the highest amount of development aid in
the developing world, but a very small portion was aimed at access to safe drinking water and
basic sanitation (Galan et al., 2013; Salami et al., 2014). The lack of adequate financial
resources reduced the ability of Sub-Saharan African countries to expand the water and
sanitation infrastructure. It also prevented the proper operation and maintenance of the
current and new infrastructure. In the region, most investments in infrastructure came from
development aid (Salami et al., 2014). The lack of qualified professionals to manage, operate
and maintain the services and facilities remain an issue (Salami et al., 2014). The involvement of
local communities in the design, implementation and maintenance of drinking water and
sanitation projects remained very low in the region (Salami et al., 2014). All of these factors
contributed to reducing the implementation capacities of the SSA countries for providing safe
drinking water and basic sanitation services and consequently the sustainability of these
services. The result was a slow progress in increasing access to safe drinking water and basic
sanitation in SSA.
There is another factor that contributed to the slow progress. In SSA, water is connected to
various local and indigenous religious, cultural and spiritual beliefs that prevent the

43
implementation of improved drinking water and sanitation practices (Akpabio & Takara, 2014).
Cultural taboos and beliefs around human excreta actually increased the practice of open
defecation in the region. For example, in rural Uganda, there is this belief that it is not good to
use pit latrines because due to their fixed location as it is easier for sorcerers to access people
excreta for evil purposes. People believing this are more inclined to practice open defecation.
Another example coming from rural Madagascar is that the storage of faecal waste in a
structure is a taboo and the storage of faecal matter below ground level contaminates the dead
(Akpabio & Takara, 2014). Working to change cultural taboos and beliefs is very challenging and
not all governments, international organisations and non-governmental organisation (NGO)
programmes are equipped or designed to overcome the challenge (Akpabio & Takara, 2014).
However some programmes do address this challenge. For example in Uganda, the NGO Rural
Health Promotion and Poverty Alleviation Initiative (RUHEPAI) works in rural communities to
promote sustainable access to safe drinking water and educate on sanitation (Rural Health
Promotion and Poverty Alleviation Initiative, 2013). Due to all kinds of cultural, religious and
spiritual beliefs and/or taboos, the implementation of safe drinking water and basic sanitation
practices are not straightforward in some part of SSA and slows down the progress in the
achievement of Target 7.C. (Akpabio & Takara, 2014). In addition to good governance, adequate
infrastructures, financial and human resources, behavioural changes, education and awareness
are also necessary (Akpabio & Takara, 2014).
3.1.2 2015 Status on Access to Safe Drinking Water and Basic Sanitation
Now that the MDG period is coming to an end, it is clear that the drinking water and sanitation
targets will not be met in SSA by the end of the year (Salami et al., 2014; UNICEF & WHO, 2015).
As the data shows, access to safe drinking water in SSA reached 68 percent for the entire
region; only a few percentage points shy from the MDG target of 74 percent (UNICEF & WHO,
2015). In rural areas, the access to safe drinking water reached 56 percent - 11 percent below
the expected target of 67 percent. The proportion of urban population with access to safe
drinking water also narrowly missed the target and reached 87 percent (UNICEF & WHO, 2015).

44
On the other hand, the improvement on access to basic sanitation is almost non-existent in
SSA. From 2000 to 2015, the proportion of population using improved sanitation facilities went
from 26 to 30 percent compared to 24 percent in 1990. In rural areas, the access to basic
sanitation increased by only one percent to reach 23 percent. And in urban areas, the access
stayed the same at 40 percent (UNICEF & WHO, 2015). The non-existent progress can be
attributable to the fact that the focus of investments and projects from national governments
and development aid has been more on water than sanitation in part due to the lack of
capacities and the taboos surrounding human excreta (Galan et al., 2013; Salami et al., 2014;
Akpabio & Takara, 2014; Burki, 2015).
3.2 Nigeria Charts 3.2.1 and 3.2.2 describe the situation in Nigeria in the post-2000 period. The MDG
targets for Nigeria based on 1990 baseline figures are 70 percent4 for access to safe drinking
water and 69 percent for access to basic sanitation (UNICEF & WHO, 2015).
Source: WHO/UNICEF Joint Monitoring Programme for Water Supply and Sanitation
4 Based on the method used by the WHO/UNICEF JMP for Water Supply and Sanitation, if the 2015 result is more or less 1 percent of the country’s target, then the target is met.
78 80 81 84 85 87
38 51
57
42 51 56 52
63 69 55
63 68
2000 2010 2015 2000 2010 2015
Nigeria Sub-Saharan Africa
Chart 3.2.1: Percentage of Population Using an Improved Drinking Water Source in Nigeria
Urban Rural Total

45
Source: WHO/UNICEF Joint Monitoring Programme for Water Supply and Sanitation
3.2.1 Progress on Access to Safe Drinking Water and Basic Sanitation Since 2000
The progress on access to safe drinking water in Nigeria since the year 2000 is slow but positive
enough that the country will meet the MDG Target 7.C by the end of this year. On the down
side, the progress on access to basic sanitation continued to regress since the beginning of the
new millennium. In fact, more people are now using unimproved sanitation facilities (UNICEF &
WHO, 2015). Nigeria is part of the countries around the world with the highest levels of people
practising open defecation (Burki, 2015; UNICEF & WHO, 2015).
The country faces many challenges in both sectors. The main challenge is the poor governance
and the institutional constraints that the Nigerian government must deal with (Omugba, 2009;
Olaseni & Alade, 2012; Oyefara, 2013). The government undertook a reform of the water and
sanitation sector that was implemented over 10 years. The reforms aimed at increasing the
capacity of the responsible institutions to improve the delivery of services in rural and urban
areas, their performance and cost-effectiveness. The reforms were also undertaken so the
government could deliver on its commitment to equitable and sustainable services to all
Nigerians. The outcomes of the reform process were a national water Policy, a water resources
36 34 33
40 41 40
33 28
25 19 22 23
34 31 29
26 28 30
2000 2010 2015 2000 2010 2015
Nigeria Sub-Saharan Africa
Chart 3.2.2: Percentage of Population Using Improved Sanitation in Nigeria
Urban Rural Total

46
bill, a management strategy for water resources and a complete review of the framework
governing water and sanitation institutions in several states (Omugba, 2009).
Despite this progress to improve governance, the efforts were not enough to provide universal
coverage of both services in the country. The government lacks credible data on drinking water
and sanitation to properly inform decision-making on resource allocation and national
investments. It has poorly managed human and natural resources and neglected urban and
rural planning for drinking water and sanitation services (Omugba, 2009; Olaseni & Alade,
2012). The government was not able to demonstrate accountability and transparency with
respect to the use of funds (Olaseni & Alade, 2012; Oyefara, 2013). In fact corruption is major
problem in Nigeria. The embezzlement of funds, especially those intended for the development
of infrastructure, is a recurring practice in public offices (Olaseni & Alade, 2012). These
governance problems are more severe than the lack of funds for both sectors (Omugba, 2009).
Nevertheless, the government devotes inadequate amount of funds to develop, operate and
maintain drinking water and sanitation infrastructures and services. Finally, like in other SSA
countries, the drinking water sector was prioritized over the provision of proper sanitation
facilities (Olaseni & Alade, 2012; Burki 2015).
The rapid population growth in Nigeria also impeded the progress on access to safe drinking
water and sanitation. The increase in population accentuated the pressure on the existing
infrastructure and the limited financial resources of the government. In fact, to make ends
meet, the Nigerian government took out foreign loans which put the country in deep debts
(Ogilviea et al., 2010; Olaseni & Alade, 2012). Also with more than 50 percent of the population
living in urban areas, the government concentrated its effort in the cities leaving the rural areas
behind. As a result the disparities between the rural and urban populations in terms of access
to clean water and appropriate sanitation facilities are still significant (Christenson, Bain,
Wright, Aondoakaa, Hossain & Bartram, 2014).
Finally, environmental degradation of the water resources also contributed to slow down the
progress and reduce freshwater availability. Water pollution caused by domestic, agricultural
and industrial waste discharged into the environment is high. The oil industry is also a major
47
source of pollution and can have an impact on people’s access to safe drinking water.
Unfortunately, the Nigerian government do not have efficient administrative structures to
protect water resources and to impose sanctions to polluter (Adedeji & Ako, 2009; Oyefara,
2013). More sources of freshwater then becomes more polluted and of poor quality, therefore
limiting the access of the population to reliable sources of water.
3.2.2 2015 Status on Access to Safe Drinking Water and Basic Sanitation
Despite several challenges, Nigeria has managed to meet its MDG water target. In 2015, the
proportion of Nigerians who had access to improved drinking water sources in the overall
country is 69 percent. It is only one percent higher than the proportion for the SSA. The urban
population with access to safe drinking water reached 81 percent and the rural one reached 57
percent. There are still households, mostly women, who need to walk on average 65 minutes
per day to fetch water. It is the reality for many poor rural families (UNICEF & WHO, 2015).
In 2015, the proportion of the population using improved sanitation facilities declined from its
1990 level to 29 percent for the entire country, to 25 percent in rural areas and 33 percent in
urban areas. The percentage of the population defecating in the open increased and reached 25
percent (UNICEF & WHO, 2015). This means that one in four people practices open defecation.
In rural areas, it is 34 percent of the population and in urban areas, 16 percent. This is an
increase of 6 percent in urban areas since 2010 (UNICEF & WHO, 2015).
Sanitation has remained a low priority for the Nigerian government which in part explains the
reason for the decline. Also the participation of the civil society is low. Nigerian civil societies
are either not well organized or lack the capacity to implement projects. Civil society could
definitely be a key player in reversing the situation because it can help develop projects that
really address the needs of the community (Oyefara, 2013). The rapid population growth, the
weak institutions, the failure to implement policies and initiatives, the unsustainable public
spending and the inadequate infrastructure all contributed to the decline in access to basic
sanitation (UNICEF & WHO, 2015).
In conclusion, Nigeria did reach the Target 7.C with respect to access to safe drinking water but
failed to decrease the number of people living without access to basic sanitation.

48
3.3 South Africa Charts 3.3.1 and 3.3.2 describe the situation in South Africa. The MDG targets for South Africa
based on 1990 baseline figures are 92 percent for access to safe drinking water and 76 percent
for access to basic sanitation (UNICEF & WHO, 2015).
Source: WHO/UNICEF Joint Monitoring Programme for Water Supply and Sanitation
Source: WHO/UNICEF Joint Monitoring Programme for Water Supply and Sanitation
99 99 100 84 85 87
71 78 81
42 51 56
87 91 93
55 63 68
2000 2010 2015 2000 2010 2015
South Africa Sub-Saharan Africa
Chart 3.3.1: Percentage of Population Using an Improved Drinking Water Source in South Africa
Urban Rural Total
66 68 70
40 41 40 46
56 61
19 22 23
57 64 66
26 28 30
2000 2010 2015 2000 2010 2015
South Africa Sub-Saharan Africa
Chart 3.3.2: Percentage of Population Using Improved Sanitation in South Africa
Urban Rural Total

49
3.3.1 Progress on Access to Safe Drinking Water and Basic Sanitation Since 2000
Since 2000, South Africa was able to continuously increase the access to both drinking water
and sanitation. The progress for drinking water was enabled by the full coverage of the services
in urban areas. 92 percent of urban households have direct access to drinking water on
dwelling. The rest of urban household have access to drinking water via other improved
drinking water sources like public taps and standpipes (UNICEF & WHO, 2015). Access to
sanitation continued to increase gradually since 2000 but a little more slowly. In rural areas, the
access to basic sanitation increased a lot more rapidly than in urban areas. This progress helped
to reduce the inequalities many South African experienced during apartheid (Quinn, 2012).
However, the poorest and vulnerable people still struggle to access adequate services. Public
water infrastructures in poorer areas (slums and rural areas) are often over ground and
therefore the supply is insufficient. Consequently many are forced to use unsafe water for
survival even though there is public improved drinking water sources available (Norman,
Bradshaw, Lewin, Cairncross & Nannan, 2010; Razzaque & Kleingeld, 2013).
By the turn of the millennium, South Africa had developed new legislations on water and
sanitation. First, the National Water Services Act became the main legislative instrument for
water resource management in the country. It is guided by four central principles: equity,
efficiency, sustainability and representativity. The Act provided a mechanism to ensure public
participation at the local level (Kahinda & Taigbenu, 2011; Quinn, 2012). Second, the Water
Service Act became the regulatory framework for the drinking water and sanitation service
delivery. This Act guaranteed the right to safe drinking water and basic sanitation to all South
African citizens. The local governments were given the responsibility for the provision of the
services. The Act also specified how they must fulfil this responsibility towards the community
(Kahinda & Taigbenu, 2011; Quinn, 2012).
On paper, these legislations were comprehensive and ambitious but their actual
implementation turned out to be challenging. The costs for the implementation of the public
participatory processes at the local level exceeded initial estimates. The process planned for the
implementation was difficult, slow and very long. The original plan had to be scaled back and

50
turned into a pilot project (Herrfahrdt-Pähle, 2010; Quinn, 2012; Razzaque & Kleingeld, 2013).
The National Water Act also called for the establishment of an ecological reserve of water since
the country is water stressed due to its semi-arid climate. The implementation for this reserve
was not successful because again the costs ended being much higher than anticipated. Also
several administrative issues contributed to the failure, including the lack of skilled human
resources (Herrfahrdt-Pähle, 2010; Quinn, 2012).
The implementation of the Water Service Act is still not complete due to the increasing
demands for services by the growing population. Also the infrastructures are deficient and
there is a lack of funding because the implementation costs were poorly estimated initially and
they ended up being higher. There is insufficient number of professionals to manage and
operate the services (Norman et al., 2010; Quinn 2012). The population group who suffer the
most from the lack of services are poor and vulnerable people mostly living in slums and rural
areas (Razzaque & Kleingeld, 2013).
As explained in the previous chapter, South Africa is a country with limited water resources due
to its semi-arid climate causing high rates of evaporation and uneven annual rainfall level.
However, new factors are also contributing to increase the scarcity of the water resources. First
water pollution has become a problem (De Villiers, Schmitz & Booysen, 1996; Herrfahrdt-Pähle,
2010; Norman et al., 2010; Razzaque & Kleingeld, 2013). There have reports of illegal discharges
in water bodies by the agricultural and mining sectors. Plus illegal extraction of water for the
same sectors has been also reported. The activities contribute to degrade water resources and
increase water scarcity (Herrfahrdt-Pähle, 2010). Climate change is expected to impact South
Africa water resources by decreasing river flows, annual rates of rainfall and changing water
availability throughout the country (Herrfahrdt-Pähle, 2010). In order to address the impact of
climate change, South Africa has started to do water transfer between regions and store water
in bulk in dams. But, increasing demands for water by the growing population and all economic
sectors as well as the lack of financial resources and some watersheds almost reaching their
limits make this initiative difficult to implement (Herrfahrdt-Pähle, 2010; Quinn 2012).
51
3.3.2 2015 Status on Access to Safe Drinking Water and Basic Sanitation
South Africa was able the meet the access to safe drinking water target in 2015, 93 percent of
all South African had access to improved drinking water sources. The rural population with
access to safe drinking water is now 81 percent and 100 percent of the urban population have
access. These results are way higher than those for SSA (UNICEF & WHO, 2015).
The progress on access for basic sanitation was not as successful. The proportion of the
population with access to improved sanitation facilities is 66 percent for the entire country, 70
percent in urban areas and 61 percent in rural areas. The results are still higher than those for
SSA but not enough for South Africa to meet Target 7.C. The number of people practising open
defecation significantly declined in South Africa: 4 percent in the entire country 14 percent in
1990), 8 percent in rural areas (27 percent in 1990) and 1 percent in urban areas (2 percent in
1990) (UNICEF & WHO, 2015).
4 The Achievement of MDG Target 7.C in Sub-Saharan Africa
and the Case Study Countries: Analysis
4.1 Achievement of MDG Target 7.C in Sub-Saharan Africa The above data from UNICEF/WHO JMP, the authoritative source for data for water supply and
sanitation, demonstrates that the MDG Target 7.C was not met in SSA.
The region did get close to the safe drinking water target. The access reached 68 percent
against a target of 74 percent by 2015. This represents a considerable improvement especially
when considering that the baseline (in 1990) started at 48 percent (UNICEF & WHO, 2015). The
20 percent increase actually represents a more significant improvement in access as the service
is now available to a much higher number of people given the population growth.
The almost successful outcome of SSA in terms of access to safe drinking water can be
attributed to two major causes. Many of the SSA countries did reach their own individual
targets for access to safe drinking water. Nigeria and South Africa are two successful examples
but there are many others that demonstrated positive outcomes like Botswana, Cameroon,
52
Senegal, Ghana, Djibouti and Ethiopia (Quinn, 2012; UNICEF & WHO, 2015). A second cause is
the fact that much more focus and priority has been put on safe drinking water than on
sanitation (Nelson & Murray, 2008; Cumming, Elliott, Overbo & Bartram, 2014; Burki, 2015).
The data provided above strongly supports this assertion and the scientific literature review
confirms it. It appears that many national institutions in the SSA responsible for the provision of
drinking water and sanitation services diverted effort towards addressing drinking water access
needs than sanitation access needs (Chiplunkar, 2009; Salami et al., 2014; Burki, 2015). It was
therefore much easier to divert all the effort on drinking water services only especially given an
inherent cultural reluctance to explicitly consider sanitation as a national problem or issue. The
lack of transparency, accountability, financial and human resources further aggravated the
problem. It prevents governments from upholding their responsibilities to inform the
population of their actions and uses of funds. It weakens its performance to accomplish
projects/programmes and deliver adequate services and to avoid the flourishing of corruption
(Chiplunkar, 2009; Salami et al., 2014; Burki, 2015).
The access to basic sanitation in SSA is now a more pressing concern than it was in 1990 when
the access was already at a low of 24 percent. In 2015, the population with access to basic
sanitation is 30 percent and the target to be achieved was 62 percent. This means that, because
of population growth, the actual number of people living today without basic sanitation is much
higher than in 1990 the baseline year. In that year, approximately 388 million people did not
have access to basic sanitation and today it is almost 700 million people (UNICEF & WHO,
2015). More than two thirds of the SSA population use unimproved sanitation facilities in 2015.
It can be argued that the SSA was actually a failure in terms of achieving the sanitation target of
MDG target 7.C.
No countries in SSA except for three countries with very small populations (Capo Verde,
Seychelles and Reunion) were able to meet their individual sanitation targets. Some countries
did progress but some others, like Nigeria and Djibouti, regressed (UNICEF & WHO, 2015).
These experiences of these two countries suggest that it was not necessary that the
53
achievement of the safe drinking water target led to or was directly correlated to the success in
meeting sanitation targets (Salami et al., 2014).
The causes for this failure are complex and involve political, economic, environmental, social
and cultural factors. Lack of governance, financial resources, infrastructures and qualified
professionals combined with strong cultural and religious beliefs required a more holistic
approach towards a solution (Akpabio & Takara, 2014). It is obvious now that the approach of
just writing new policies and building infrastructure is not the key to solve the issue. Education,
behavioural changes and awareness are equally, if not more important (Aboud & Singla, 2012).
The SSA region has received most of the global development assistance since the establishment
of the MDGs (Galan et al., 2013; Salami et al., 2014). A vast majority of the drinking water and
sanitation project were funded through development aid, especially infrastructure capital
investments (Galan et al., 2013; Salami et al., 2014). However, in SSA, the public and the civil
society organizations were barely involved in developing, implementing and sustaining drinking
water and sanitation projects. The ones who would benefit from these initiatives did not have a
voice to express their actual needs. Also, it was then not possible to prevent the failure of a
project due to cultural beliefs since these were not taken into consideration. Civil society
organizations and the public are key stakeholders in such projects and ignoring them almost
guarantees failure. It is only they who can ensure the sustainability of a project by taking
ownership (Nordtveit, 2010; Aboud & Singla 2012; Sachs, 2012; Langford & Winkler, 2014). A
question must then be raised - if most drinking water and sanitation projects were funded
through development aid and key stakeholders were not involved from the start, does it mean
that the projects were based on the beliefs and assumptions of the donors and not the actual
beneficiaries? Does this failure reinforce the belief that ownership of a development effort
should belong to the people and not to the financiers?
SSA’s experience in terms of meeting target 7.C is indicative of its general development status.
The challenges that SSA faces today are the same as the ones it faced 25 years ago despite all
the international development aid, conventions and summits. Many governments lacked
transparency, accountability, financial, governance and human capacities in 1990 and they still

54
do today (Mwanza, 2003; Galan et al., 2013; Salami et al., 2014). Even with all the development
aid received over the years, most SSA countries except a few (Salami et al., 2014) were unable
to overcome these challenges. Future actions beyond 2015 will need to integrate all factors
(political, economic, environmental, social and cultural) impacting drinking water and sanitation
in finding a sustainable solution. And the integration of all those factors will have to be done
through the involvement of all stakeholders, including civil society organizations, the public and
the private sector (Chenoweth, 2004; Al-Houmd & Edwards, 2005, de Gouvello & Scott, 2012,
Nordtveit, 2010; Aboud & Singla 2012; Sachs, 2012; Langford & Winkler, 2014).
4.2 Performance in the Case Study Countries Both South Africa and Nigeria met or will meet the safe drinking water target by the end of
2015. South Africa increased access to safe drinking water to 93 percent (83 percent in 1990) of
the population in the country. It was also able to decrease the disparities between rural and
urban areas where the access was increased respectively to 81 and 100 percent (66 and 98
percent in 1990). In Nigeria, the access to improved water sources increased to 69 percent
overall, 25 percent in rural areas and 76 percent in the urban areas. In 1990, the access was at
40, 25 and 76 percent respectively (UNICEF & WHO, 2015).
On the other hand, the sanitation target was not met in either country. While South Africa did
demonstrate slow progress, Nigeria regressed. Today, there are more people in Nigeria living
without basic sanitation than with it. In 1990, the access to basic sanitation in the Nigeria as
well as rural and urban areas was about 38 percent. The current access to basic sanitation has
declined to 33 percent in urban areas, 25 percent in rural areas and 29 percent nationwide.
South Africa’s progress was deemed moderate for the entire country (increasing 51 percent in
1990 to 66 per cent in 2015) and in urban areas (increasing from 64 percent to 70 percent).
However the progress accomplished in rural areas was very significant. The proportion of the
population with access to basic sanitation went from 38 percent in 1990 to 61 percent in 2015;
an increase of 23 percentage points (UNICEF & WHO, 2015).
Since 1990, the baseline year for the MDGs, the two national governments undertook major
reforms of their water and sanitation sector (Golbalt, 1996; Naidoo & Constantinides, 2000;

55
Omugba, 2009; Kahinda & Taigbenu, 2011; Quinn, 2012). Following the apartheid, the new
South African government completely reformed not only the water and sanitation sector but
also the overall policy stance for the entire country. The outcomes for the water and sanitation
sectors were two main pieces of legislation that govern water resources management as well
the delivery of water and sanitation solutions. It provided access to safe drinking water and
basic sanitation to all citizens regardless of their racial profiles which was not the case before
1994. It also prescribed a strong civil society and public participation in both provision of the
services and the management of water resources (Golbalt, 1996; Naidoo & Constantinides,
2000; Kahinda & Taigbenu, 2011; Quinn, 2012). Even though the implementation has proven to
be challenging; the new government was able to make progress in the provision of both
services. It has not yet been able to increase public and civil society participation to the
intended scale but the advances made paid a huge dividend (Quinn, 2012; Razzaque &
Kleingeld, 2013). The efforts of the South African government to provide equitable services to
all citizens directed the country towards a more universal coverage of safe drinking water and
basic sanitation. The increased access to basic sanitation in rural areas is significant because
during the apartheid that is where a majority of black communities lived and they did not have
access to these services (Golbalt, 1996, UNICEF & WHO, 2015).
The Nigerian reforms were not as successful as the South African ones. The main outcome of
the reform was one piece of legislation, the National Water Policy, and a proposed law for
water resources. Institutions responsible for water and sanitation services despite being
reformed remained weak and continue to face several constraints with corruption being the
main obstacle. Public and civil society participation in searching for solutions or in the delivery
of these services was minimum. Sanitation occupied a very low priority for the government.
Corruption combined with the lack of accountability and transparency on the use of funds
prevented people from knowing if the allocated financial resources for drinking water and
sanitation were used as intended (Omugba, 2009; Olaseni & Alade, 2012).

56
Overall even though Nigeria underwent a major reform like South Africa, the country barely
met the drinking water target5 and completely failed on the sanitation target. The main
difference between the two reform scenarios is that the South African reforms ensured public
and civil society participation and implemented strong legislative acts prescribing roles and
responsibilities of each stakeholder as well as the management of water resources (Quinn,
2012). The Nigerian reforms were unable to provide sufficient legislative cover, address
corruption and include the civil society and the public as legitimate partners (Olaseni & Alade,
2012).
5 Conclusion The conclusions of the research and analysis in this MRP can make useful contributions to the
formulation of the post-2015 Sustainable Development Goals (Annex 1), in the areas of access
to clean water and appropriate provision of sanitary facilities particularly in SSA.
First, from a physical, availability of water perspective, it is feasible that the SSA region can
provide access to fresh, clean water for its population. However, this will require major
cooperation between SSA countries. Regional water resources management will be a key
component of successful provision of water and sanitation services in SSA. To overcome future
water scarcity, SSA countries will need to work together to manage the water resources and
where necessary transfer water between water rich countries and water poor ones
(Frankhauser & Schmidt-Traub, 2011, Pullan, Freeman, Gething & Brooker, 2014).
Second, the more successful countries in meeting the MDG 7.C targets can support other
countries in the region to design, implement and maintain appropriate water and sanitation
services as most SSA countries face somewhat similar realities. This South-South cooperation
will ensure that water and sanitation projects respond better to their needs. South Africa is a
good candidate to lead this cooperation effort. The role of the international community should
be to support the national and regional plans with financial and technical assistance. Their role
5Nigeria needed an increase of 30 percentage points to meet the target and by 2015; the country had increase by 29 points. Under the WHO/UNCEF JMP for water supply and sanitation a difference of only 1 percent was reasonable to declare that the country had met the target (UNICEF & WHO, 2015).
57
would be in the background than directly on the field (Abdenur & da Fonseca, 2013; De Renzio
& Seifert, 2014).
Finally, all drinking water and sanitation projects will require complete participation of all
stakeholders especially the national and regional civil society organizations and public from
beginning to end. They are both key players who will be able to ensure to sustainability of the
initiatives. Their participation will also ensure a full ownership the project during and after its
implementation (Nordtveit, 2010; Aboud & Singla 2012; Sachs, 2012; Langford & Winkler,
2014).

58
Annex 1: Millennium Development Goals and Post-2015 Sustainable Development Goals
Millennium Development Goals
Goals Status
Eradicate extreme and hunger The world has reduced extreme poverty by half.
In 1990, almost half of the population in developing regions lived on less than $1.25 a day. This rate dropped to 14% by 2015, reducing the number of people living in extreme poverty from 1.9 billion (1990) to 836 million (2015).
Achieve universal primary education
91 % of children in developing regions are attending primary school.
The school enrolment rate in primary education in developing regions increased from 83% to 91% between 2000 and 2015. In 2015, 57 million children were out of school. SSA has the best level of improvement. In 1990, the primary school enrolment was 52% and in 2015, it is 80%.
Promote gender equality and empower women
Disparities in primary school enrolment between boys and girls are being eliminated in all developing regions
By 2015, developing regions as a whole have achieved gender parity in primary education.
The political participation of women has continued to increase
In January 2014, 46 countries had more than 30% female members of parliament in at least one chamber. More women are now holding some of the so-called “hard” ministerial portfolios—such as Defense, Foreign Affairs and the Environment.
Reduce child mortality Child mortality has declined by more than half, but more progress is needed
The mortality rate for children under age five dropped by more than 50%, from 90 deaths per 1,000 live births in 1990 to 43 in 2015. Preventable diseases are the main causes of under-five deaths and have to eliminate if further reductions are to be achieved.
Improve maternal health Much more needs to be done to reduce maternal mortality
The maternal mortality ratio dropped by 45% between 1990 and 2015, from 380 to 210 deaths per 100,000 live births. In SSA, the

59
maternal mortality ratio decline by 49%. However, almost 300,000 women died in 2013 from causes related to pregnancy and childbirth. Maternal death is mostly preventable. But, lack of provision of care to pregnant women as a major impediment.
Combat HIV/AIDs, malaria and other preventable diseases
Antiretroviral therapy is saving lives and must be expanded further
13.6 million people in developing regions had access to and received treatment using antiretroviral therapy (ART) for HIV-infected people by 2014. ART has saved 7.6 million lives since 1995. Expanding the ART coverage and better dissemination of knowledge about HIV among youth can save many more.
Efforts in the fight against malaria and tuberculosis have shown results
Between 2000 and 2015, an estimated 6.2 million deaths from malaria were averted due to the substantial expansion of malaria interventions. About 90%of the averted deaths were children under the age of five living in sub-Saharan Africa. The intensive efforts to fight tuberculosis have saved an estimated37 million lives worldwide since 1995. If the trends continue, the world will reach the MDG targets on malaria and tuberculosis.
Ensure environmental sustainability
Major trends that threaten environmental sustainability continue, but examples of successful global action exist
Global emissions of carbon dioxide (CO2) continued their upward trend. The levels of global emissions have increased above 50% above their 1990 level. Millions of hectares of forest are lost every year, many species are being driven closer to extinction and renewable water resources are becoming scarcer. At the same time, international actions have eliminated 98% of ozone-depleting substances and the proportion of terrestrial and coastal marine areas under protection has been increasing.
Access to an improved drinking water source became a reality for 2.6 billion people
The target of halving the proportion of people without access to an improved drinking water source was achieved in 2010, five years ahead of schedule. In 2015, 91% of the world’s population had access to an improved source, up from 76% in 1990. Over 2.6 billion people gained access to an improved source of drinking water

60
between 1990 and 2015.
2.1 billion people has gained access to improved sanitation since 1990, yet a billion people still resorted to open defecation
Between 1990 and 2015, almost 2.1 billion people gained access to an improved sanitation facility. However,in 2015, 2.4 billion people did not use an improved sanitation facility and 946 million people still resorted to open defecation, which poses a huge risk to communities that are often poor and vulnerable already. Much greater effort and investment will be needed to redress inadequate sanitation.
Proportion of people living in slums in urban areas dropped from 39.4% in 1990 to 29.7% in 2014.
Develop a global partnership for development
Development assistance rebounded, the trading system stayed favorable for developing countries and their debt burden remained low
Official development assistance stood at $135.2 billion in 2014, the highest level ever recorded, after two years of declining volumes. However, aid is shifting away from the poorest countries. 80 % of imports from developing countries entered developed countries duty-free and tariffs remained at an all-time low. The debt burden of developing countries remained stable at about 3 % of export revenue.
Source: United Nations, 2015, 2014
Sustainable Development Goals These are the proposed goals for actions after 2015 to be achieved by 2030.
Goal 1: End Poverty in all its form everywhere
Goal 2: End hunger, achieve food security and improved nutrition and promote sustainable agriculture
Goal 3: Ensure healthy lives and promote well-being for all at all ages
Goal 4: Ensure inclusive and equitable quality education and promote lifelong learning opportunities for all
Goal 5 Achieve gender equality and empower all women and girls
Goal 6: Ensure availability and sustainable management of water and sanitation for all
Goal 7: Ensure access to affordable, reliable, sustainable and modern energy for all

61
Goal 8: Promote sustained, inclusive and sustainable economic growth, full and productive employment and decent work for all
Goal 9: Build resilient infrastructure, promote inclusive and sustainable industrialization and foster innovation
Goal 10: Reduce inequality within and among countries
Goal 11: Make cities and human settlements inclusive, safe, resilient and sustainable
Goal 12: Ensure sustainable consumption and production patterns
Goal 13: Take urgent action to combat climate change
Goal 14 : Conserve and sustainably use the oceans, seas and marine resources for sustainable development
Goal 15: Protect, restore and promote sustainable use of terrestrial ecosystems, sustainably manage forests, combat desertification, and halt and reverse land degradation and halt biodiversity loss
Goal 16: Promote peaceful and inclusive societies for sustainable development, provide access to justice for all and build effective, accountable and inclusive institutions at all levels
Goal 17: Strengthen the means of implementation and revitalize the global partnership for sustainable development
Source: United Nations, 2015

62
Selected Bibliography 1. Abdenur, A. E. & da Fonseca, J. M. E. M. (2013) The North’s Growing Role in South–South
Cooperation: keeping the foothold, Third World Quarterly, Volume 34, No. 8, 1475–1491.
2. Aboud, F.E. & Singla, D.R. (2012) Challenges to changing health behaviours in developing countries: A critical overview, Social Science & Medicine, Volume 75, 589-594
3. Adedeji, A. A. & Ako, R. T. (2009) Towards achieving the United Nations’ Millennium Development Goals: The imperative of reforming water pollution control and waste management laws in Nigeria, Desalination, Volume 248, 642–649.
4. Akpabio, E. M. & Takara, K. (2014) Understanding and confronting cultural complexities characterizing water, sanitation and hygiene in Sub-Saharan Africa, Water International, Volume 39, No. 7, 921–932, http://dx.doi.org/10.1080/02508060.2015.981782
5. Akujieze, C. N., Coker, S. J. L. & Oteze, G. E. (2003) Groundwater in Nigeria – a millennium experience – distribution, practice, problems and solutions, Hydrogeology Journal, Volume 11, 259–274, DOI 10.1007/s10040-002-0227-3
6. Alavian, V., Qaddumi, H., M., Dickson, E., Diez, S., M., Danilenko, A., V., Hirji, R., F., Puz, G., Pizarro, C., Jacobsen, M., Blankespoor, B. (2009) Water and climate change: understanding the risks and making climate-smart investment decisions. Washington, DC, World Bank, Retrieved from http://documents.worldbank.org/curated/en/2009/11/11717870/water-climate-change-understanding-risks-making-climate-smart-investment-decisions
7. Al-Houmd, R. B. & Edwards, J. (2005) Water Poverty and Private Investment in the Water and Sanitation Sector, Water International, Volume 30, No.3, 350–355.
8. Annan, K. A. (2000) We the Peoples – The Role of the United Nations in the 21st Century, New York, NY, United Nations, Department of Public Information.
9. Areola, O. & Akintola, F. (1997) Manpower and institutional constraints on urban water supply in Nigeria: A case study of the northwest zone, GeoJournal, Volume 43, 125–133.
10. Barry, M. &. Hughes, J., M (2008) Talking Dirty — The Politics of Clean Water and Sanitation, The New England Journal of Medicine, 359:8, 784-787.
11. Bartram, J., Brocklehurst, C., Fisher, M. B., Luyendijk, R., Hossain, R., Wardlaw, T. & Gordon, B. (2014) Global Monitoring of Water Supply and Sanitation: History, Methods and Future

63
Challenges, International Journal of Environmental Research and Public Health, Volume 11, 8137-8165, doi:10.3390/ijerph110808137.
12. Bartram, J., Lewis, K., Lenton, R. & Wright, A. (2005) Focusing on improved water and sanitation for health, Lancet, Volume 365, 810–812.
13. Basson, M. S. & Rooyen, J. A. (1998) Tunnelling into the Future: the Role of Water Resources Development in South Africa, Tunnelling and Underground Space Technology, Volume 13, No. 1, 35-38.
14. Baum, R., Luh, J. & Bartram, J. (2013) Sanitation: A Global Estimate of Sewerage connections without Treatment and the Resulting Impact on MDG Progress, Environmental Science & Technology, Volume 47, 1994-2000, dx.doi.org/10.1021/es304284f
15. Boadi, K., Kuitunen, M., Raheem, K. & Hanninen, K. (2005) Urbanisation without Development: Environmental and Health Implications in African Cities, Environment, Development and Sustainability, Volume 7, 465–500.
16. Brocklehurst, C. & Bartram, J. (2010) Swimming upstream: why sanitation, hygiene and water are so important to mothers and their daughters, Bulletin World Health Organization, Volume 88, 482, doi:10.2471/BLT.10.080077.
17. Brolan, C. E., Lee, S., Kim, D. & Hill, P.S. (2014) Back to the future: what would the post-2015 global development goals look like if we replicated methods used to construct the Millennium Development Goals?, Globalization and Health, Volume 10, No. 19, 1-8.
18. Burki, T. (2015) Prioritising clean water and sanitation, The Lancet, Volume 15, 153-154.
19. Cairncross, S., Bartram, J., Cumming, O. & Brocklehurst, C. (2010) Hygiene, Sanitation, and Water: What Needs to Be Done?, PLOS Medicine, Volume 7, No. 11, doi:10.1371/journal.pmed.1000365
20. Castelló, L. D., Gil-González, D., Alvarez-Dardet, C. D. & Hernández-Aguado, I (2010) The Environmental Millennium Development Goal: progress and barriers to its achievement, Environmental Science & Policy, Volume 13, 154-163.
21. Chenoweth, J. (2004) Changing Ownership Structures in the Water Supply and Sanitation Sector, Water International, Volume 29, No. 2, 138–147.
22. Chiplunkar, A. (2009) Basic issues revisited and experiences in the provision of water for all, Water International, Volume 34, No. 4, 409–419, DOI: 10.1080/02508060903374392

64
23. Christenson, E., Bain, R., Wright, J., Aondoakaa, S., Hossain, R. & Bartram, J. (2014) Examining the influence of urban definition when assessing relative safety of drinking-water in Nigeria, Science of the Total Environment, Volume 490, 301–312.
24. Chokor, B. A. (1993) Government Policy and Environmental the Developing World" The Example of Protection in Nigeria, Environmental Management Volume 17, No. 1, 15-30.
25. Clay, R. (1994) A Continent in Chaos: Africa's Environmental Issues, Environmental Health Perspectives, Volume 102, No. 12, 1018-1023.
26. Cook, S., Fisher, M, Tiemann, T. & Vidal, A. (2011) Water, food and poverty: global- and basin-scale analysis, Water International, Volume 36, No. 1, 1-16.
27. Cumming, O. (2009) The sanitation imperative: A strategic response to a development crisis, Desalination, Volume 248, 8–13.
28. Cumming, O., Elliott, M., Overbo, A. & Bartram, J. (2014) Does Global Progress on Sanitation Really Lag behind Water? An Analysis of Global Progress on Community - and Household-Level Access to Safe Water and Sanitation, PLoS ONE, Volume 9, No. 12, 1-16 doi:10.1371
29. Cunningham W.P., Cunningham M.A. & Saigo B.W., Environmental Science: A Global Concern (7th Edition), 2005, New York, NY, McGraw-Hill.
30. De Gouvello, B. & Scott, C. A. (2012) Has water privatization peaked? The future of public water governance, Water International, Vol. 37, No. 2, 87–90
31. De Villiers, G. D. T., Schmitz, P. M. U. & Booysen, H. J. (1996) South Africa’s Water Resources and the Lesotho Highlands Water Scheme: A Partial Solution to the Country’s Water Problems, Water Resources Development, Volume 12, No. 1, 65- 77.
32. De Renzio, P. & Seifert, J. (2014) South–South cooperation and the future of development assistance: mapping actors and options, Third World Quarterly, Volume 35, No. 10, 1860–1875, http://dx.doi.org/10.1080/01436597.2014.971603
33. Duarte, R., Pinilla, V. & Serrano, A. (2014) Looking backward to look forward: water use and economic growth from a long-term perspective, Applied Economics, Volume 46, No. 2, 212–224.

65
34. Eberhard, R. & Quick, A.J.R. (1995) Water supply and sanitation in urban South Africa: Getting it right during the transition and beyond, Development Southern Africa, Volume 12, No. 6, 883-906.
35. Enabor, B., Sridhar, M. K. C. & Olaseha, I. O. (1998) Integrated Water Management by Urban Poor Women: A Nigerian Slum Experience, Water Resources Development, Volume 14, No. 4, 505-512.
36. Frankhauser, S. & Schmidt-Traub, G. (2011)From adaptation to climate-resilient development: The costs of climate-proofing the Millennium Development Goals in Africa, Climate And Development, Volume 3, 94–113, doi:10.1080/17565529.2011.582267
37. Fehling, M., Nelson, B. D. & Venkatapuran, S. (2013) Limitations of the Millennium Development Goals: a literature review, Global Public Health, Volume 8, No. 10, 1109–1122, http://dx.doi.org/10.1080/17441692.2013.845676
38. Fry, L., M., Mihelcic, J., R. & Watkins, D., W. (2008) Water and Nonwater-related Challenges of Achieving Global Sanitation Coverage, Environmental Science & Technology, Volume 42, No. 12, 4298–4304.
39. Galan, D. I., Kim, S.-S. & Graham, J. P. (2013) Exploring changes in open defecation prevalence in sub-Saharan Africa based on national level indices, BMC Public Health, Volume 13, No. 527, 1-12
40. Gawel, E. & Bernsen, K. (2011) Globalization of Water: The Case for Global Water Governance?, Nature and Culture Volume 6, No. 3, 205–217, doi:10.3167/nc.2011.060301
41. Gleik, P. & Palaniappan, M. (2010) Peak water limits to freshwater withdrawal and use, PNAS, Volume 107, No. 25, 11155–11162.
42. Golblatt, M. (1990) Making the cup run over - the challenge of urban water supply for South Africa's Reconstruction and Development Programme, GeoJournal, Volume 139, 21-26.
43. Goodland, R. (1995) The Concept of Environmental Sustainability, Annual Review Ecol. Syst., Volume 26, 1-24
44. Gurría, A. (2009) Sustainably managing water: challenges and responses, Water International, Volume 34, No. 4, 396-401.
45. Halleröd, B., Rothstein, B. & Daoud, A. (2013) Bad Governance and Poor Children: A Comparative Analysis of Government Efficiency and Severe Child Deprivation in 68 Low- and
66
Middle-income Countries, World Development, Volume 48, 19–31, http://dx.doi.org/10.1016/j.worlddev.2013.03.007.
46. Hanigra M.A. & Qureshi M.E. (2010) Global Water Crisis and Future Food Security in an Era of Climate Change, Food Policy, Volume 35, 365-377.
47. Herrfahrdt-Pähle, E. (2010) South African water governance between administrative and hydrological boundaries, Climate and Development, Volume 2, 111–127
48. Hulme, D. (2007) The Making of the Millennium Development Goals: Human Development Meets Results based Management In an Imperfect World, Working Paper 16, Retrieved from University of Manchester, Brooks World Poverty Institute website: http://www.bwpi.manchester.ac.uk/
49. Jain, S. K. & Singh, V. P. (2010) Water crisis, Journal of Comparative Social Welfare, Vol. 26, Nos. 2–3, 215–237.
50. Juyu, W.A. & Vaux, H. J. Jr. (2007) The Emerging Global Water Crisis: Managing Scarcity and Conflict Between Water Users, Advances in Agronomy, Volume 95, 1-76, DOI: 10.1016/S0065-2113(07)95001-4
51. Kahinda, J. M & Taigbenu, A. E. (2011) Rainwater harvesting in South Africa: Challenges and opportunities, Physics and Chemistry of the Earth, Volume 36, 968-976, doi:10.1016/j.pce.2011.08.011
52. Kanwar, R. (2010) Sustainable Water Systems for Agriculture and 21st Century Challenges, Journal of Crop Improvement, Volume 24, 41–59.
53. Kayser, G.L., Moriarty, P., Fonseca, C. & Bartram, J. (2013) Domestic Water Service Delivery Indicators and Frameworks for Monitoring, Evaluation, Policy and Planning: A Review, International Journal of Environmental Research and Public Health, Volume 10, 4812-4835, doi:10.3390/ijerph10104812.
54. Keen, J. (2003) The Water Crisis – Understanding Global Issues, New York, NY, Weigl Publishers Inc.
55. Koutsoyiannis, D. (2011) Scale of water resources development and sustainability: small is beautiful, large is great, Hydrological Sciences Journal, Volume 56, No. 4, 553-575.
56. Krause, M. (2009) The political economy of water and sanitation, New York, NY, Routledge The Taylor & Francis Group.

67
57. Langford, M. & Winkler, I. (2014) Muddying the Water? Assessing Target-based Approaches in Development Cooperation for Water and Sanitation, Journal of Human Development and Capabilities, Volume 15, Nos. 2–3, 247–260, doi.org/10.1080/19452829.2014.896321
58. Leb, C. (2014) One step at a time: international law and the duty to cooperate in the management of shared water resources, Water International, Volume 40, No. 1, 21–32, http://dx.doi.org/10.1080/02508060.2014.978972
59. Lenton, R., Lewis, K. & Wright, A.M. (2008) Water, Sanitation and The Millennium Development Goals, Journal of International Affairs, Volume 61, No. 2, 247-258.
60. Linton, J. & Brooks, D. B. (2011) Governance of transboundary aquifers: new challenges and new opportunities, Water International, Volume 36, No. 5, 606–618.
61. Lu, F., Ocampo-Raeder, C. & Crow, B. (2014) Equitable water governance: future directions in the understanding and analysis of water inequities in the global South, Water International, Volume 39, No. 2, 129–142, http://dx.doi.org/10.1080/02508060.2014.896540
62. Mara, D., Lane, J., Scott, B. & Trouba, D. (2010) Sanitation and Health, PLOS Medicine, Volume 7, No. 11, 1-7, doi:10.1371/journal.pmed.1000363.
63. Marwah, R. & Marwah, M. (2013) Water: Issues in Planning for Poverty Alleviation, Journal of Land and Rural Studies, Volume 1, No. 2, 113–129.
64. Melloul, A. J. & Collin, M. L. (2001) A Hierarchy Of Groundwater Management, Land-Use, And Social Needs Integrated For Sustainable Resource Development, Environment, Development and Sustainability, Volume 3, 45–59.
65. Mwanza, D. D. (2003) Water for Sustainable Development In Africa, Environment, Development and Sustainability, Volume 5, 95–115.
66. Naidoo, D. & Constantinides, G. (2000) Integrated Approaches to Efficient Water Use in South Africa, Water Resources Development, Vol. 16, No. 1, 155–164
67. Nelson, K. L. & Murray, A. (2008) Sanitation for Unserved Populations: Technologies, Implementation Challenges, and Opportunities, Annual Review of Environment and Resources, Volume 33, 119-151.
68. Niemczynowicz, J. (2000) Present Challenges in Water Management: A Need to See Connections and Interactions, Water International, Volume 25, No. 1, 139-147.
68
69. Nordberg, E. & Winblad, U. (1994) Urban Environmental Health and Hygiene in Sub-Saharan Africa, Current African Issues, Volume 18
70. Nordtveit, B.H. (2010) Development as a complex process of change: Conception and analysis of projects, programs and policies, International Journal of Educational Development, Volume 30, 110–117.
71. Norman, R., Bradshaw, D., Lewin, S., CairnCross, E. & Nannan, N. (2010) Estimating the Burden of Disease Attributable to Four Selected Environmental Risk Factors in South Africa, Reviews on Environmental Health, Volume 25, No. 2, 87-119.
72. Ogilviea, A. … Claneta, J. C. (2010) Water, agriculture and poverty in the Niger River basin, Water International, Volume 35, No. 5, 594–622
73. Okuruta, K., Kulabakob, R. N., Chenowetha. J. & Charlesa, K. (2015) Assessing demand for improved sustainable sanitation in low-income informal settlements of urban areas: a critical review, International Journal of Environmental Health Research, Volume 25, No. 1, 81–95, http://dx.doi.org/10.1080/09603123.2014.893570.
74. Olajuyigbe, A. E. (2010) Sustainable Water Service Delivery: An Assessment of a Water Agency in a Rapidly Urbanizing City in Nigeria, Journal of Sustainable Development, Volume 3, No. 4, 210-219.
75. Olaseni, M. & Alade, W. (2012) Vision 20:2020 and the Challenges of Infrastructural Development in Nigeria, Journal of Sustainable Development, Volume 5, No. 2, 63-76
76. Omugba, A. (2009) Challenges of inter-sectoral monitoring of developments in the provision of water and sanitation services in Nigeria, Knowledge Management for Development Journal, Vol. 5, No. 3, 272–278, DOI: 10.1080/19474190903451140
77. Onda, K., LoBuglio, J. & Bartram, J. (2012) Global Access to Safe Water: Accounting for Water Quality and the Resulting Impact on MDG Progress, International Journal of Environmental Research and Public Health, Volume 9, 880-894, doi:10.3390/ijerph9030880.
78. Organization for Economic Co-operation and Development (OECD) (2010) Price it Right, Use it Well, (Online Video), retrieved from http://www.oecd.org/env/resources/water-therightpricecanencourageefficiencyandinvestment.htm#.

69
79. Organization for Economic Co-operation and Development (OECD), OECD-DAC (1996) Shaping the 21st Century: The Contribution of Development Co-operation, Retrieved from http://www.oecd.org/dac/2508761.pdf
80. Organization for Economic Co-operation and Development (OECD) (2010) Le prix de l’eau et des services d’eau potable et d’assainissement, Paris, Série : Études de l’OCDE sur l’eau.
81. Oyefara, J. L. (2013) Good Governance and Environmental Sustainability in Lagos State, Nigeria: Can the State Achieve Goal Seven of Millennium Development Goals (MDGS)?, European Scientific Journal, Volume 9, No. 5, 41-55.
82. Pullan RL, Freeman MC, Gething PW, Brooker SJ (2014) Geographical Inequalities in Use of Improved Drinking Water Supply and Sanitation across Sub-Saharan Africa: Mapping and Spatial Analysis of Cross-sectional Survey Data. PLOS Medicine, Volume 11, No. 4, 1-17, doi:10.1371/journal.pmed.1001626
83. Prüss-Ustün, A., Bartram, J., Clasen, T., Colford Jr., J., M., Cumming, O., Curtis, V., Bonjour, S., Dangour, A., D., De France, J., Fewtrell, L., Freeman, M., C., Gordon, B., Hunter, P., R., Johnston, R., B., Mathers, C., Mäusezahl, D., Medlicott, K., Neira, M., Stocks, M., Wolf, J., & Cairncross, S. (2014) Burden of disease from inadequate water, sanitation and hygiene in low- and middle-income settings: a retrospective analysis of data from 145 countries, Tropical Medicine and International Health, Volume 19, No. 8, 894–905, DOI:10.1111/tmi.12329.
84. Quinn, N. (2012) Water governance, ecosystems and sustainability: a review of progress in South Africa, Water International, Volume 37, No. 7, 760–772.
85. Razzaque, J. & Kleingeld, E. S. (2013) Integrated Water Resource Management, Public Participation and the ‘Rainbow Nation’, African Journal of Legal Studies, Volume 6, 213–247
86. Rheingans, R., Dreibelbis, R. & Freeman, M.C. (2006) Beyond the Millennium Development Goals: Public health challenges in water and sanitation, Global Public Health, Volume 1, No. 1, 31-48.
87. Rouse, M. (2014) The worldwide urban water and wastewater infrastructure challenge, International Journal of Water Resources Development, Volume 30, No. 1, 20–27, http://dx.doi.org/10.1080/07900627.2014.882203.

70
88. Rural Health Promotion and Poverty Alleviation Initiative (2013) Our Programs, Retrieved from http://www.ruhepai.org/index.php?option=com_content&view=article&id=6&Itemid=6
89. Sachs, J. (2012) From Millennium Development Goals to Sustainable Development Goals, The Lancet, Volume 379, 2206-2211
90. Salami, A. O., Stampini, M., Kamara, A. B., Sullivan, C. A. & Namara, R. (2014) Development aid and access to water and sanitation in Sub-Saharan Africa, Water International, Volume 39, No. 3, 294–314, http://dx.doi.org/10.1080/02508060.2013.876570
91. Salman, S. (2005). United Nations general assembly resolution: International decade for action, water for life, 2005-2015, Water International, Volume 30, 415–418.
92. Sangodoyin, A. Y. (1991) Water Quality, Influence and Maintenance of Rural Boreholes in Nigeria, International Journal Environmental Studies, 1991, Volume 37, 97-107
93. Schiermeier, Q. (2014) Water risk as world warms, Nature, Volume 505, 10-11.
94. Shomar, B. (2011) Water scenarios in the Gaza Strip, Palestine: thirst, hunger and disease, International Journal of Environmental Studies, Volume 68, No. 4, 477–493.
95. Sivakumar, B. (2011) Water crisis: From Conflict to Cooperation—An Overview, Hydrological Sciences Journal, 56(4), 531-552.
96. United Nations (2001, September 6) Road map towards the implementation of the United Nations Millennium Declaration (General Assembly, fifty-sixth session, item 40 of the provisional agenda), Retrieved from http://www.un.org/millenniumgoals/sgreport2001.pdf?OpenElement .
97. United Nations (2008) The Millennium Development Goals Report 2008, Retrieved from http://mdgs.un.org/unsd/mdg/Host.aspx?Content=Products/ProgressReports.htm
98. United Nations (2014, November) Water for Life: Water Scarcity, Retrieved from http://www.un.org/waterforlifedecade/scarcity.shtml.
99. United Nations (2015) We Can End Poverty - Millennium Development Goals and Beyond: Background, Retrieved from http://www.un.org/millenniumgoals/bkgd.shtml.
100. United Nations (2015) We Can End Poverty - Millennium Development Goals and Beyond: Goal 7: Ensure Environmental Sustainability, Retrieved from http://www.un.org/millenniumgoals/environ.shtml.

71
101. United Nations (2015) The Millennium Development Goals Report 2015, New York, NY, Retrieved from http://www.un.org/millenniumgoals/reports.shtml
102. United Nations Children’s Fund (UNICEF), World Health Organization (WHO), Water Supply and Sanitation Collaborative Council (WSSCC) (2008) 10 Things you need to know about sanitation, Retrieved from http://www.un.org/waterforlifedecade/sanitation.shtml.
103. UN-Water Decade Programme on Advocacy and Communication (UNW-DPAC) (2014), The Human Right to Water and Sanitation: Milestones, Retrieved from http://www.un.org/waterforlifedecade/human_right_to_water.shtml.
104. United Nation Development Programme (UNDP) (2006) Human Development Report 2006, Beyond scarcity: Power, poverty and the global water crisis, New York, NY, Published for the United Nations Development Programme (UNDP) by Palgrave Macmillan.
105. UN Millennium Project (2005) Investing in Development: A Practical Plan to Achieve the Millennium Development Goals, New York, Retrieved from http://www.unmillenniumproject.org/reports/fullreport.htm
106. UN-Water (2014) About UN-Water, Retrieved from http://www.unwater.org/about/en/.
107. UN-Water (2014) Members and Partners, Retrieved from http://www.unwater.org/about/members-and-partners/en/.
108. United Nations World Water Assessment Programme (WWAP) (2015) The United Nations World Water Development Report 2015: Water for a Sustainable World, Paris, France, UNESCO.
109. Vandemoortele, J. (2011) The MDG Story: Intention Denied, Development and Change, Volume 42, No. 1, 1–21.
110. Waage, J. … Unterhalter, E. (2010) The Millennium Development Goals: a cross-sectoral analysis and principles for goal setting after 2015, The Lancer, Volume 376, 991-1023.
111. World Bank (2015) Water and Climate Change, Retrieved from http://water.worldbank.org/topics/water-resources-management/water-and-climate-change.
112. World Health Organization (WHO) (2015) Sanitation, Retrieved from http://www.who.int/topics/sanitation/en/.

72
113. World Health Organization (WHO) (2014, July) Sanitation, Fact Sheet No 392, Retrieved from http://www.who.int/mediacentre/factsheets/fs392/en/.
114. World Health Organization (WHO) & United Nations Children’s Fund (UNICEF) (2006) Meeting the MDG drinking water and sanitation target: the urban and rural challenge of the decade, Geneva, Switzerland, WHO Press.
115. World Health Organization (WHO) & United Nations Children’s Fund (UNICEF) (2014) Progress on sanitation and drinking-water - 2014 update, Geneva, Switzerland, WHO Press.
116. World Health Organization (WHO)/ United Nations Children’s Education Fund Joint Monitoring Programme for Water Supply & Sanitation (JMP) (n.d.) Improved and unimproved water and sanitation facilities, Retrieved from http://www.wssinfo.org/definitions-methods/watsan-categories/.
117. World Health Organization (WHO)/ United Nations Children’s Education Fund Joint Monitoring Programme for Water Supply & Sanitation (JMP) (n.d.), Tables, Retrieved from: http://www.wssinfo.org/data-estimates/tables/
118. World Health Organization (WHO)/ United Nations Children’s Fund, WHO & UNICEF 25 Joint Monitoring Programme for Water Supply & Sanitation (JMP) (2015) Years Progress on Sanitation and Drinking Water – 2015 update and MDG assessment, Geneva, Switzerland, WHO Press.
119. World Health Organization (WHO) & UN-Water (2012) UN-Water Global Analysis and Assessment of Sanitation and Drinking-Water: The challenge of extending and sustaining services, Geneva, Switzerland, WHO Press.
120. Zeitoun, M. & Mirumachi, N. (2008) Transboundary water interaction I: reconsidering conflict and cooperation, International Environmental Agreements: Politics, Law and Economics, Volume 8, Issue 4, 297-316, DOI 10.1007/s10784-008-9083-5.