an analysis of seasonal sea ice off the coast of cape ... · an analysis of seasonal sea ice off...
TRANSCRIPT

An Analysis of Seasonal Sea Ice off the
Coast of Cape Dorset, Nunavut, Canada
by
Richard Siewierski
A thesis submitted in conformity with the requirements for the degree of Master of Science
Geography
University of Toronto
© Copyright by Richard Siewierski 2009

ii
An Analysis of Seasonal Sea Ice off the Coast of Cape
Dorset, Nunavut, Canada
Richard Siewierski
Master of Science
Geography
University of Toronto
2009
Abstract
Sea ice is essential to the survival of many human settlements in Arctic Canada in that it
provides a means for basic sustenance, travel and largely defines the seasons. Northern
communities base their livelihoods on these traditionally well established cryogenic
cycles. In this work, seasonal sea ice is analyzed off the coast of Cape Dorset, Nunavut.
Significant trends are established for earlier sea ice break-up and later freeze up dates for
the period 1982 to 2007. The timing of sea ice formation and retreat is significantly
changing in the Cape Dorset region, with the ice free season increasing ~40 days since
1982. Relationships are established statistically between the shifting ice free season and
temperature, weather types (air masses), precipitation, and wind. The results of this study
illustrate the changing nature of sea ice formation and retreat in Cape Dorset and the
importance of completing localized studies in the Arctic.

iii
Acknowledgments
I am grateful for the guidance, support, and collaboration of my research supervisor,
Professor William A. Gough. Without his input this work would not have been made
possible. I would also like to acknowledge the useful input of my thesis examination
committee, including Professor Deb McGregor and Professor Vince Robinson. I
acknowledge the pioneering work of Professor Gita Laidler.

iv
Table of Contents
Chapter 1: Indigenous Knowledge
1.1 Introduction & Declaration…………….…………………………...……….1
1.2 Terminology…………………………………………………………………2
1.3 Creation Stories……………………………………………………………...3
1.4 Traditional Ecological Knowledge (TEK)…………………………………..8
1.5 Inuit Knowledge and Sea Ice………………………………………………..11
1.6 Rationale…………………………………………………………………….19
1.7 Study Area…………………………………………………………………..25
1.8 Research Questions…………………………………………………………26
Chapter 2: Method (Data & Analysis)
2.1 Sea Ice………………………………………………………………………27
2.2 Temperature…………………………………………………………………30
2.3 Weather Type……………………………………………………………….31
2.4 Snow………………………………………………………………………..33
2.5 Wind………………………………………………………………………...34
2.6 General Analyses……………………………………………………………36
Chapter 3: Results
3.1 Sea Ice……………………………………………………………………….37
3.2 Temperature………………………………………………………………….39
3.3 Weather Type……………………………………………………………...…41
3.4 Snow…………………………………………………………………………43
3.5 Wind…………………………………………………………………………44

v
Chapter 4: Discussion
4.1 Sea Ice………………………………………………………………………50
4.2 Temperature…………………………………………………………………51
4.3 Weather Type……………………………………………………………….52
4.4 Snow………………………………………………………………………..53
4.5 Wind………………………………………………………………………...54
4.6 Further Impacts……………………………………………………………..58
Chapter 5: Conclusion…………………………………………………………………..60
References………………………………………………………………………………63

vi
List of Tables
Chapter 1
1.1: Inuktitut terminology for freezing……………………………………….…12
1.2: Inuktitut terminology for wind………………………………………….….17
1.3: Inuktitut terminology for current/tidal influences………………………….18
Chapter 2
2.1: Wind directions…………………………………………………………….35
2.2: Wind speed classifications…………………………………………………35
Chapter 3
3.1: Predominant wind directions at Cape Dorset……………….………….….47

vii
List of Figures
Chapter 1
1.1: Photos of early near shore freezing………………………….………….….13
1.2: Conceptual diagram of freeze-thaw processes………………………….….14
1.3: Photos of tidal cracks………………………………………………………15
1.4: Drawn tidal cracks (naggutiit)……………………………………………...16
1.5: Conceptual model of wind………………………………………………....17
1.6: Conceptual model of currents and tides……………………………………18
1.7: Location of Cape Dorset…………………………………………………...25
Chapter 2
2.1a: Sea ice chart……………………………………………………………….29
2.1b: Sea ice chart……………………………………………………………….30
2.2: List of weather types………………………………………………………..31
2.3: North America‟s major air masses………………………………………….34
Chapter 3
3.1a: Cape Dorset break-up dates……………………………………………….38
3.1b: Cape Dorset freeze up dates………………………………………………38
3.2a: Cape Dorset minimum temperatures………………………………………39
3.2b: Cape Dorset maximum temperatures……………………………...………39
3.3: Temperature vs. Ice free period…………………………………………….40
3.4a: Spring weather types………………………………………………………41
3.4b: Summer weather types…………………………………………………….42
3.4c: Autumn weather types…………………………………………………….42
3.4d: Winter weather types…………………………………………………...…43
3.5a: May snowfall records……………………………………………………...44
3.5b: October snowfall records………………………………………………….44
3.6: Wind rose…………………………………………………….……………..45
3.7a: Annual prevailing wind for Cape Dorset…………………….……………46
3.7b: July-August prevailing wind for Cape Dorset………………….…………46
3.7c: October-November prevailing wind for Cape Dorset………….………….47
3.8: Cape Dorset average annual wind speed…………………………….……..48
3.9: Percentage of winds from south……………………………………………49

1
Chapter 1
Indigenous Knowledge
1.1 Introduction & Declaration
Today, Aboriginal peoples in Canada number approximately one million persons
speaking over fifty different languages. Despite decades of government oppression aimed
at eradicating Aboriginal peoples‟ communities and traditional practices, they have
resisted and survived by forcefully articulating their rights and responsibilities in national
and international arenas. Resistance has allowed Aboriginal peoples to maintain their
traditional livelihoods, depending on traditional resource-based pursuits and knowledge
passed down through generations, aiding in their continued existence (Doyle-Bedwell &
Cohen, 2001).
As the first chapter of this account centres on an understanding of Canadian
Aboriginal thought and practice, it will help us to understand who is actually referred to
when using the terms Aboriginal, Indigenous, Native or First peoples and to know the
difference between general terms such as Indian, Inuit, Eskimo and Métis. Terminology
relating to Aboriginal peoples is an evolving issue, one which needs to be seriously
considered in order to prevent any misrepresentations of on Canadian Aboriginal thought
and practice.
I would like to take a moment here to stress my own knowledge of the ways of
Aboriginal peoples in Canada, as this account makes several assumptions concerning
Indigenous thought and practice. By no means am I an expert on Indigenous Knowledge
and any form thereof. Any misinterpretation of Indigenous insights or strategies
presented here and throughout the entirety of this research is unintentional, for I am only

2
a student of Indigenous ways and no study by any non-aboriginal person can account for
an accurate understanding of aboriginal lifelong adapted experience and attained
knowledge.
1.2 Terminology
The term “Aboriginal peoples” is a collective name for the original peoples of
North America and their descendants. The Canadian constitution recognizes three
representatives of Aboriginal peoples (i.e. Indians, Métis and Inuit). These are three
entirely separate and dynamic groups of people, each representing their own unique
heritage, language, cultural practices and spiritual beliefs. The term “Indian” is used to
account for all the Indigenous people in Canada who are not Inuit or Métis with
Indigenous literally meaning “native to the area” and “Indigenous peoples” having
similar meaning to “Aboriginal peoples”, “Native peoples” or “First peoples”, each term
which will be used interchangeably within this account. Also of interest to note is the
origin of the term “Indian” in correspondence to North American Aboriginal peoples.
The term was initially used by Christopher Columbus when he first arrived in North
America, giving the name to the people he encountered. This misnomer was based on the
mistaken notion that he had landed in India (CBINAC, 2002).
“Inuit” are the Aboriginal people of Arctic Canada who play a prominent role in
this work. Inuit live primarily in Nunavut, the northern parts of Labrador and Quebec and
in the Northwest Territories. Traditionally they have lived above the treeline bordered by
the Mackenzie Delta in the west, the Labrador coast in the east, the southern point of
Hudson Bay in the south, and the High Arctic islands in the north. Although Inuit are not
covered in the Indian Act, in 1939 the Supreme Court interpreted the federal

3
government‟s power to make laws affecting “Indians, and Lands reserved for the
Indians” as extending to Inuit. The word “Inuit” means “the people” in Inuktitut, the Inuit
language, and is the term which Inuit use to refer to themselves. The term “Eskimo”,
originally applied to Inuit by European settlers, is no longer used to refer to Inuit in
Canada, being derived from an Algonquin term meaning “raw meat eaters” and found
offensive by many people. However, the term is still commonly used in the United States
to refer to Inuit in Alaska.
Lastly, Métis literally means “mixed blood” and refers to Canadians of mixed
Aboriginal and non-Aboriginal ancestry, however not all identify themselves as Métis
and Métis organizations in Canada have different criteria for who is considered Métis
(CBINAC,2002).
1.3 Creation Stories
Native peoples continued traditional existence has allowed them to preserve
knowledge passed down for generations. This knowledge, often referred to as traditional
knowledge, has many applications, including law, governance, social work, health and
medicine, philosophy, education, and the environment (McGregor, 2004). Before
exploring this indistinct and almost mysterious stream of thought, understanding the
evolution of Indigenous Knowledge requires an understanding of their theological
framework.
An effective way of teaching non-Aboriginal people to better understand
Aboriginal belief systems is with the use of Haudenosaunee and Anishnabee Creation
stories. Stories not only inform us of cultural beginnings but instill values and offer
insight into many problems (as will be seen throughout this chapter). Although Creation

4
stories vary slightly with storytellers and cultural traditions, the general message remains
similar amongst many Aboriginal Creation stories within Canada. The Haudenosaunee
Thanksgiving Address is said at the opening and closing of gatherings. It expresses and
defines Haudenosaunee worldly views and reminds us that humans are part of the
interconnection with creation (McGregor, 2004). The Creation story of the
Haudenosaunee also teaches us original instructions on how to relate to Creation and all
its beings. “The Creation story tells us of the great relationships within this world and our
relationship, as human beings, with the rest of Creation… along with the Thanksgiving
Address, we learn that we, the People, are part of the complex Web of Life, an integral
part of Creation” (McGregor, 2004). The Thanksgiving Address and Creation story of the
Haudenosaunee describe the ways in which these people are predestined to live their
lives. They are expected to use the knowledge that is given to them to relate to Creation,
thereby fulfilling their responsibilities as Haudenosaunee.
In the Anishnabee tradition, there is a Creation story and a Re-Creation story
(McGregor, 2004). The Creation story informs Anishnabee of the Creators vision and
how the vision was fulfilled. The Re-Creation story reinforces principles of harmony and
respect. There are slightly different versions of the Re-Creation story but in the version
told by Anishnabee writer Basil Johnson, the story begins with a great flood:
“…there has been a great flood and most of life on Earth has perished, except for bird and
water creatures. Sky-woman survives and comes to rest on a great turtle‟s back. She asks the
water creatures to bring her soil from the bottom of the waters. The water animals (the
beaver, the marten, the loon) all try to help her and fail. Finally, the muskrat volunteers,
much to the scorn of the other water creatures who failed. Muskrat, the most humble of the
water creatures, is ridiculed, but he is determined to help; he dives down into the water and
the animals and Sky-woman wait. They waited for the muskrat to emerge as empty handed as they had done. Time passed. Smiles turned to worried frowns. The small hope that each had
nurtured for the success of the muskrat turned into despair. When the waiting creatures had
given up, the muskrat floated to the surface more dead than alive, but he clutched in his paws
a small morsel of soil. Where the great had failed, the small succeeded” (McGregor, 2004).

5
In this version of the Re-Creation story the muskrat lives while in others he dies.
Still, there are many values and lessons that can be taken home from this story. One in
particular tends to stand out. All of creation is important and must be respected, including
the smallest and seemingly most insignificant as the muskrat is perceived amongst his
peers. If we lost or disrespected the small, we would not be here today. In the eyes of the
Anishnabee, if the Muskrat had failed, they would not be here today (McGregor, 2004).
While the environmentally minded individual may scoff at this message and
reiterate that they have known this for years, they may be surprised to hear that
Indigenous peoples have been living by such creeds for thousands of years. Many
principles such as the Gaia hypothesis (Nielsen & Ditlevsen, 2009; Karnani & Annila,
2009) and other ecologically/environmentally related principles that are considered
contemporary have been practiced by Anishnabee, Haudenosaunee, and countless other
Aboriginal nations since time immemorial. It is vital to understand when taking on
Aboriginal studies that in their worldview, “knowledge comes from the Creator and
Creation itself. Many stories and teachings are gained from animals, plants, the moon, the
stars, water, wind, and the spirit of the world. Knowledge is also gained from vision,
ceremony, prayer, intuitions, dreams and personal experience” (McGregor, 2004).
Marlene Brant Castellano, Mohawk and professor emeritus at Trent University,
recognizes three specific sources of knowledge acquisition: traditional knowledge (from
generation to generation); empirical knowledge (gained from observation); and revealed
knowledge (acquired through spiritual means and recognized as a gift). Knowledge is
commonly shared and changes over time. Often times, the acquisition of knowledge can
be very unambiguous and in this modern day, it has become almost necessary to protect

6
the unique worldviews developed by Aboriginal knowledge. With knowledge and
Creation being closely related in Aboriginal tradition, the responsible nature connected
with Aboriginal knowledge ensures the continuation of creation (otherwise known as
“sustainability” in non-Aboriginal terms). “The relationship with Creation and its beings
was meant to be maintained and enhanced, and the knowledge that would ensure this was
passed on for generations over thousands of years” (McGregor, 2004). This, in hindsight,
is Indigenous knowledge. Although there is no short answer for what Indigenous
knowledge actually is, it is intricately related to Creation and knowledge based on
Creation, passed down for generations. This is not a type of knowledge that was
identified by Eurocentric thinking. It has only been recently recognized in the eyes of
westerners and termed Indigenous Knowledge (McGregor, 2004).
Eurocentric thinkers, and fortunately or unfortunately this includes the insights
made by this report, often necessitate definitions. We need to understand exactly what
something means, whether or not a true definition exists, and this does not work when
endeavoring to define Indigenous Knowledge. The problem with such tactics is our
tendency to generalize themes or concepts. Although a general definition has been
provided, it would be misleading to say that this is a uniform concept across all
Indigenous peoples. The people create Indigenous Knowledge and are a part of each
individual group‟s very specific ways of life. Marie Battiste and James Henderson, both
indigenous scholars, offer an insightful conceptualization of what Indigenous Knowledge
might be rather than applying a concrete definition:
“Perhaps the closest one can get to describing unity in Indigenous Knowledge is that
knowledge is the expression of the vibrant relationships between people, their ecosystems,
and other living beings and spirits that share their lands… All aspects of knowledge are
interrelated and cannot be separated from the traditional territories of the people concerned…
To the indigenous ways of knowing, the self exists within a world that is subject to flux. The

7
purpose of these ways of knowing is to reunify the world or at least to reconcile the world to
itself. Indigenous Knowledge is the way of living within contexts of flux, paradox, and
tension, respecting the pull of dualism and reconciling opposing forces… Developing these
ways of knowing leads to freedom of consciousness and to solidarity with the natural world”
(McGregor, 2004).
Indigenous Knowledge is a lived experience by the people. It is something that
cannot be theoretically broken down or entirely understood by non-Aboriginals.
Eurocentric thinking describes the thought system as a noun, a simple thing that can be
constructed and broken down as if dissecting an organism and describing all of its parts.
Indigenous Knowledge being a lived experience requires a process in order to fully
understand what it is. This means that acquiring this knowledge begins at an early age for
Aboriginal peoples and continues for the extent of their lives. This however by no way
means that those who are western educated are lost in understanding and utilizing
concepts developed by Aboriginal thought. It simply means we do not carry their ways of
thinking in our day to day lives. Indigenous Knowledge is never separated from
Aboriginal peoples. This is what is meant by Indigenous Knowledge being a lived
experience.
We need to understand the dynamic of Aboriginal thought to appreciate the power
of Indigenous Knowledge. The word “power” is used because at times, that is what this
knowledge seems like. It is a type of knowledge that very few have and even fewer can
actually apply. The applications are almost endless and highly relevant with an ever
expanding population and ever changing environmental conditions. They have used this
knowledge to survive harsh environmental conditions for generations, with the absolute
bare minimum in technology. Their ability to read their surroundings as a decision
making strategy has assured their continued existence in the past. The following section

8
of this chapter will highlight examples of applied Indigenous Knowledge and their
dependence on this knowledge system for social, economic, and cultural preservation.
1.4 Traditional Ecological Knowledge (TEK)
The body of literature that lends itself to examining, explaining, and illustrating
potential applications of Indigenous Knowledge has become common place in academia
( Houde, 2007; Shackeroff & Campbell, 2007; Corsiglia & Snively, 1997). Traditional
Ecological Knowledge (TEK) in particular has found its way through numerous pieces of
scholarly work. At the very basic level, TEK is a subset of Indigenous knowledge. Once
again there is no consensus in the literature what TEK actually means, amongst
Aboriginal and non-Aboriginal alike. A conventional Eurocentric definition would be
“Aboriginal peoples and their relationship with the environment”. Martha Johnson,
former executive director of the Dene Cultural Institute in the Northwest Territories,
describes TEK in the following manner:
“A body of knowledge built up by a group of people through generations of living in close
contact with nature. It includes a system of classification, a set of empirical observations about the local environment, and a system of self-management that governs resource use. The
quantity and quality of traditional environmental knowledge varies among community
members, depending upon gender, age, social status, intellectual capability, and profession
(hunter, spiritual leader, healer, etc.). With its roots firmly in the past, traditional
environmental knowledge is both cumulative and dynamic, building upon the experience of
earlier generations and adapting to the new technological and socioeconomic changes of the
present” (McGregor, 2004)
. The body of knowledge held by Aboriginal traditional wisdom represents a
treasure trove of important but historically neglected knowledge capable of resolving
many contemporary environmental issues. As populations continue to increase, resources
continue to be depleted and natural disasters worsen, increasing numbers of scientists,
academics and environmental managers are turning towards Traditional Ecological

9
Knowledge as a reliable, time-proven information bank on ecological preservation and
sustainability (Corsiglia & Snively, 1997; Spak, 2005; Kimmerer, 2002).
Various researchers have shown that diverse indigenous groups, from the Arctic
to the Amazon, have developed systems of Traditional Ecological Knowledge that are
sophisticated even by Western standards (Corsiglia & Snively, 1997). Examples include
pioneering work by H.C. Conklin, an ecologist who has documented, along with others,
horticultural practices of people from the Philippines. They have documented the
possession of exceptionally detailed knowledge of local plants and animals and their
natural history amongst these people, recognizing in one case 1600 plant species. Others
like ecologist W.O. Pruitt have been using the elaborate Inuit terminology for describing
types of snow for decades. When dealing with ice phenomena and types of snow, there
are not enough precise English words to describe variation (Corsiglia & Snively, 1997;
Laidler & Elee, 2008). The following is a list of time-tested in-depth information that
Corsiglia and Snively (1997) suggest can be taken from traditional knowledge that may
improve the effectiveness of resource management strategies in specified areas.
Traditional knowledge can:
Provide new biological and ecological insights
Help locate and identify rare and endangered species
Provide shortcuts for researchers investigating the local resource base
Help define protected areas
The NisGa‟a people of British Columbia have several examples of time-tested in-
depth information about a local area that can help improve the effectiveness of resource
management strategies. The NisGa‟a people live in their Nass River Valley homeland
near Alaska. Despite oppression for some 120 years, “they continue to use the NisGa‟a
language and to preserve the culture that connects them with their river and its valley”

10
(Corsiglia & Snively, 1997). Before the incursion of white settlers, the NisGa‟a were at
the hub of an extensive trading empire based on their monopoly over oolichan fish, which
provided the oil required to make a winter diet of dried salmon digestible. They were
successful because of their knowledge of their river and very specific practices. One such
practice involved returning all unused waste from the consumption of fish back to the
river. The NisGa‟a people believed that the salmon relied on scent to find their way home
from the open ocean. They felt that if they did not return salmon remains after the salmon
had been processed, the fish would be insulted and would not come back: “This practice
– along with the NisGa‟a persistent petitioning of governments to address problems
associated with White economic activities in the valley – is quite likely to have
contributed to the survival, to date, of all the Nass River fishes that return from the sea to
spawn” (Corsiglia & Snively, 1997).
The kinds of observations made by Indigenous intuition can go a long way in
validating scientific hypothesis and suggesting new research directions (Kimmerer,
2002). For example, Nakashima (1993) did a comparison of the knowledge between
wildlife biologists and Inuit hunters on Hudson Bay eider. The Inuit knowledge had been
dismissed earlier as unreliable “Eskimo reports”. After an interview with Inuit hunters, it
was revealed that the knowledge of the hunters far exceeded that of the wildlife
biologists. The Traditional Knowledge of the Inuit provided new information on range,
winter behavior, mortality, and demography of the eider (Kimmerer, 2002). Traditional
Ecological Knowledge has proven to afford accurate and reliable species information,
and therefore effective management, in a growing number of cases, including fisheries
(Berkes, 1977), caribou structure (Mander, 1991), census of bowhead whales (Huntington

11
et al., 1999), forest fungi (Richards, 1997), wolves (Stephensen, 1982), and food plants
(Anderson, 1996; Turner et al., 2000).
1.5 Inuit Knowledge and Sea Ice
“In the winter the sea ice is very useful. We rely on it, that‟s why we have to know the
conditions so much because we use it from beginning to the end. It was so much so in the
past, but not as much now. We don‟t rely as much on country food, like it‟s only a percentage
now of our daily diet. But still we use that information. It is good for us as long as we live
here because we‟re still going to use the ice. I don‟t see any highways out on the land, so it‟s
still going to be our highway. The kids still have to learn the points, the fall and the spring
and the winter, the conditions, they will have to learn that. A big part of our life is spent on
the ice, especially here where our name is, where our regional name is so much recognizable
as people who live „where there‟s water‟, not just ice, but where there‟s water. It‟s very important to know about the sea ice”
Joanasie, Inuit community of Cape Dorset (Laidler & Elee, 2008).
It is clear that Traditional Knowledge is an unconscious act in Indigenous
lifestyle, an act by which they define their lives and rely on not only to keep them alive
mentally, physically, and spiritually but also socially, culturally, and even economically
in many cases (as with the NisGa‟a oolichan).
Sea ice is an integral component of life in Inuit communities. Their knowledge of
sea ice, which is based upon lifelong observations passed down through generations, is a
vital platform upon which Inuit have been able to hunt, gather, traverse and live on the
sea ice for at least 5000 years (Riewe, 1991). Although many Inuit are now settled in
coastal communities, sea ice continues to be a vital component of their lives, and their
knowledge of the ice, its nature, and its processes is embedded within their culture and
identity (Aporta, 2002). Inuit are perceptive observers of the sea ice edge as all aspects of
their lives, including basic survival, depends on their astute knowledge and perception of
changing ice, sea, and weather conditions. As such, “Inuit elders and active hunters may
be considered the experts on local ice conditions and dynamic processes because of their
extensive use and experience of traveling on, and observing ice conditions in order to

12
assure safe travel and successful hunting” (Nelson, 1969; Freeman, 1984; Krupnik,
2002).
The results presented in the following section represent a knowledge base of sea
ice observations made by Inuit elders and hunters shared during interviews, sea ice trips,
and focus groups in a study conducted by Laidler and Elee (2008) at Cape Dorset.
Inuit terminology for describing their environmental surroundings is extensive
and precise. They have approximately 36 words for different stages associated with sea
ice freezing and another 23 words for conditions related to melting stages. See Table 1.1
for a detailed list and descriptions of freezing conditions.
Table 1.1: Inuktitut terminology, descriptions, and brief definitions for sea ice conditions associated with
freezing stages. See photos from Figure 1.1 for some visual examples of these terms and their description
(Laidler & Elee, 2008).

13
Also see Figure 1.1 for photographs of some of the described terminology.
Figure 1.1: Photos of early near-shore freezing, including: a) qinnu, early slush-like ice formations; b)
kuiviniq, ice freezing to the rocks; c) early formation of sijja, shoreline ice; and, d) sikuliaq, new ice
forming in open water (Laidler & Elee, 2008).
For example, when see ice begins freezing around Cape Dorset it is referred to as
sikuvaliajuq. The earliest of ice formation is referred to as qinnu, which has a slush-like
consistency and begins to form with colder temperatures. However, as freezing
progresses, there are different terms for ice that forms near-shore and ice that forms in the
open water (Laidler & Elee, 2008). Near shore freezing begins with Ilu, formed by the
contributions of ilaupalia. At this point the ice has frozen to the ground when the tide
was low. When chunks of ice begin forming on the open water this is referred to as
qaikuin. Aukajuq is the term used to describe early spring ice conditions and is more of a
general term for early indications of melting. Laidler and Elee (2008) provide a detailed
conceptual model of the melting and freezing process outlined in Inuktitut terminology.
See Figure 1.2 for a complete outline of the conceptual model.

14
Figure 1.2: Conceptual diagram of freeze-thaw processes, interactions, and terminology based on
interviews conducted in Cape Dorset, Nunavut. Where: a solid line = general process direction, a dashed
line = cyclical/intermittent process direction. Inuktitut terms in boxes are ice conditions or features, while
those outside boxes are sea ice processes. English terms in bold font highlight the general freezing/melting
stages (Laidler & Elee, 2008).
Another sea ice formation that Inuit are required to be knowledgeable of are tidal
cracks. Cracks tend to form in that same location and are important to document as they
can be dangerous if encountered when travelling along the sea ice. They are usually
formed by the movement of sea ice, from the contraction and expansion of freeze-thaw
processes, or from the exertion of wind and ocean currents (Laidler & Elee, 2008). As
with sea ice terminology, tidal crack terminology also exists among Inuit. Figure 1.3
documents different types of tidal cracks and their descriptions are given. Also, and quite
exemplary of their knowledge, Inuit from the Laidler & Elee (2008) study were able to
draw on maps approximately where all the tidal cracks form as they apply to their

15
Figure 1.3: Photos of different types of tidal cracks, including: a) nagguti, a tidal crack that forms in tuvaq
in the winter and re-freezes; b) ajuraq, occurs in the spring and does not re-freeze after opening; and, c)
qullupiarniq, a crack that opens, re-freezes, and opens in the same spot (it can become peaked over where
the crack has formed (Laidler & Elee, 2008).
travelling routes. Examples of naggutiit, tidal crack formations that are affected by the
diurnal tidal cycle, where the difference in daily high and low tides causes ice movement
and cracking, are drawn out in the Cape Dorset, Nunavut area in Figure 1.4. Naggutiit
literally means tidal crack in Inuktitut but implies that it refreezes after it opens. More
specifically, naggutiit are both important hunting destinations and potentially dangerous
areas where ice may break off (Laidler & Elee, 2008).
Winds and currents also have important influences on how and when sea ice
forms, moves, or deteriorates, influences which have been recognized by Inuit. “Both
wind and currents, when they stop at a certain time, like in the fall time, that‟s when it‟s
time to freeze. When the wind stops, the water will freeze, and when the current stops, it
will freeze” (Laidler & Elee, 2008). Inuit have descriptions for both winds and currents in
the Cape Dorset area. Despite an incomplete consensus on wind direction, there are
generally two wind directions recognized and described: winds from the mainland (from
the north) and winds from the open water (from the south).

16
Figure 1.4: Key naggutiit (plural for nagguti) in the Cape Dorset area drawn by Inuit sea ice professionals
(Laidler & Elee, 2008).
Winds from the north bring pleasant, albeit colder weather, and promotes freezing. Again
there is Inuktitut terminology used by Inuit to describe sea ice conditions associated with
wind influences. Tunuvia, for example, is weather coming from the mainland and is
associated with ice forming outward from the edge of the land or weather that drives
moving or multi-year ice away from the community, allowing for conditions that permit
boat travel. Winds from the open water (south) are said to have greater influences on ice
conditions than that of from the mainland. Winds coming from the open water are likely
to break up the sea ice caused by increasing wave action, preventing freezing in the
autumn and promoting freezing in the spring. Light winds, or calm conditions, promotes
freezing and strong winds from any direction can affect ice stability. For a list of

17
terminology related to wind conditions affecting sea ice and for an illustrative conceptual
model, see Table 1.2 and Figure 1.5 respectively.
Table 1.2: Inuktitut terminology, descriptions, and brief definitions for sea ice conditions associated with
wind influences (Laidler & Elee, 2008).
Figure 1.5: Conceptual model of the influences of winds on sea ice formation, movement, or decay based
on interviews conducted in Cape Dorset (Laidler & Elee, 2008).

18
Terminology describing currents and tides is also well established among Inuit. For
details on their influence on sea ice see Table 1.3 and Figure 1.6.
Table 1.3: Inuktitut terminology, descriptions, and brief definitions for sea ice conditions associated with
current/tidal influences (Laidler & Elee, 2008).
Figure 1.6: Conceptual model depicting the influences of currents and tides on sea ice formation,
movement, or decay based on interviews conducted in Cape Dorset. Where: a solid line = general process
direction, a dashed line = daily cycle, a dashed and dotted line = monthly cycles (Laidler & Elee, 2008).
By using sea ice as a means of travel and for hunting purposes, Inuit elders and
hunters of Cape Dorset have developed an in depth understanding of the inner workings

19
of sea ice formation and retreat. They have terminology to describe all conditions through
the calendar year and can predict developments based on specific environmental
variables. Such abilities provide a unique glimpse into localized conditions and marine
geography of the Cape Dorset region, and extending along the Northern Hudson Strait
coastline. This local scale understanding is critical to Inuit travelling and hunting through
sea ice terrain efficiently and more importantly, safely. It is evident that Inuit expertise
has the potential to inform scientific researchers of locally important sea ice processes.
1.6 Rationale
Sea ice is essential to the survival of many Arctic animals, and people in northern
communities depend on it for hunting and fishing. It protects sensitive shorelines from
wave erosion, and it influences local air and water temperatures and the changing of the
seasons. Permanent, or multi-year, sea ice is ice that does not completely melt in the
summer but remains throughout the year. In the western Arctic, the area covered by
permanent sea ice has decreased by about 25 % since 1969 (Environment Canada, 1997).
Sea ice coverage has decreased in the eastern Arctic as well and at about the same rate as
in the west. In Hudson Bay, the ice-free season is now more than a week longer than it
was 30 years ago. Changes in Arctic sea ice are now making it harder for some polar bear
and seal populations to survive. For many Northerners, travel over the ice has also
become more dangerous and less reliable, and hunting on the ice has become more
difficult (Environment Canada, 1997).
Less sea ice can also mean amplified climate change. Ice, like snow, reflects
much of the sun‟s energy back to space. When less ice covers the oceans, more of the
sun‟s energy is able to warm the Earth‟s surface and temperatures rise higher and faster,

20
particularly in Polar Regions in the spring. The climate of the arctic has been intensely
studied but is commonly misunderstood. Texts frequently group climactic impacts in one
analogous apocalyptic manner. In fact, sensitivity to climate change in any particular
region depends significantly on a number of factors including latitude, local air
temperatures, moisture, circulation patterns and sea ice.
The unprecedented rate of change of the Earth‟s climate in the experience of
modern human society has been widely documented (Corell, 2006; Cordalis & Suagee,
2008; Zlatev & Moseholm, 2009; Mathez, 2009). A simple database search under the
topic of “climate change” resulted in 222,518 published articles on the subject, 91,776 of
which were peer-reviewed, signifying the magnitude of scientific research revolving
around climate change. More recently a common theme in the scientific community is to
draw attention to specific habitat or regional impacts and ramifications of an altered
climate regime (Houser & Gough, 2003; Laidler & Gough, 2003; Thomas et al., 2003;
Gough et al., 2004; Doka et al., 2004; Smythe-Wright et al., 2006; O‟Neill et al., 2008;
Zlatev & Moseholm, 2009).
For example, Houser and Gough (2003) have established variations in the timing
and characteristics of sea ice formation and retreat in Hudson Strait. Laidler and Gough
(2003) have reviewed the past and the current land use and resource harvesting practices
of coastal communities, identifying the importance of certain renewable resources to
specific sub-regions of Hudson Bay. They present broad scientific observations of a
changing Arctic environment. Lastly, Gagnon and Gough (2004) have developed trends
in the dates of ice freeze-up and breakup over Hudson Bay. These studies are all pertinent
findings of the broad changing nature of Canada‟s north. However, within the scientific

21
community, there is limited understanding of sea ice at local scales. Local scale analysis
is intended to give a more place specific understanding of anticipated change. No two
places are the same, so it is misleading to assume the Arctic will change in a spatially or
temporally uniform manner.
Climate change is being experienced particularly intensely in Arctic regions. The
Intergovernmental Panel on Climate Change notes that “Changes in climate that have
already taken place are manifested in the decrease in extent and thickness of Arctic sea
ice, permafrost thawing, coastal erosion, changes in ice sheets and ice shelves, and
altered distribution and abundance of species” (IPCC, 2001). The rate at which Arctic
temperatures are rising in comparison to the lower latitude‟s has been well studied
(Corell, 2006; Lubin & Vogelmann, 2006; McGuire et al., 2006; Semiletov et al., 2006;
Brigham, 2007; Overland et al., 2008). Widespread melting of glaciers, the loss of
permanent and semi-permanent permafrost and the retreat of perennial and seasonal sea
ice present additional evidence for strong Arctic warming (Corell, 2006). This analysis
focuses on a regional analysis of seasonal sea ice in a specified Arctic location,
The rationale for such a study in the Arctic is as follows. Reduced sea ice is likely
to increase marine access to the region‟s resources, opening up opportunities for new
shipping routes and access to offshore oil extraction, although initial access could be
significantly hampered with the increased movement of broken ice shelves with the
danger of impact (Corell, 2006; Brigham, 2007; Chalecki, 2007). In the 1980s, American
and Canadian political strategists advised that the Arctic should be given greater
prominence in security affairs due to its wealthy supply of fossil fuel energy resources.
This was a request directed from known Soviet interests in the territory and hence their

22
interest in the untapped resources. With continued tensions between North America and
Russia, even with the end of the Cold War, oil and gas removal, increased ocean access,
and resurgent legal concerns make this area worthy of consideration for policy formation
(Chalecki, 2007). Reductions in sea ice in all forms and phases will drastically shrink
marine habitat for several species, pushing them towards extinction (Laidre & Heide-
Jorgensen, 2004; Corell, 2006; Stirling et al., 2008). Polar bears, ice-inhabiting seals,
caribou, reindeer, seabirds and other land animals are likely to be increasingly stressed as
climate change and sea ice ranges alters access to food resources, breeding grounds, and
historic migrations routes (Corell, 2006). With species ranges expected to shift northward
on land and sea, new species will be introduced into Arctic regions. As new species move
in, animal diseases that can be transmitted to humans, such as West Nile virus, are likely
to pose increasing health risks (Corell, 2006).
Inuit and other northern groups as already discussed are frontline observers of the
changing Arctic, being confronted regularly by its new and shifting demands. They have
recognized the Arctic‟s inherent variability, which they have observed keenly and
adapted to over the centuries. However, over recent years, they say that something is
indeed very different, rendering them vulnerable to the new and unpredictable changes
(Gearheard, 2008). In total, approximately 155,000 Inuit live in the Arctic, mainly in
northern Alaska, Canada, Greenland, and northeastern Russia. There are also several
other indigenous groups that inhabit the Arctic including the Dene and Athabaskans in
North America, the Sami in northern Scandinavia, and a dozen or so other ethnic groups
in northern Russia (Gearheard, 2008). For many northern communities, sea ice use is
central to their social, cultural and economic well-being (Corell, 2006; Laidler et al.,

23
2007). Traditional foods contribute too many northern communities main source of
nutritional intake with the harvesting of marine and terrestrial animals. Furthermore, the
distribution of country foods (i.e. wildlife traditionally used for sustenance and survival),
the hunt, and the act of consuming the foods is important in establishing social relations
within communities, and is central to how many Inuit define themselves (Laidler et al.,
2007). It is also important to note that Inuit hunting is largely subsistence based in the
Canadian Arctic, with many northerners disinclined to sell traditional foods for monetary
gain (Gombay, 2007).
Shari Gearheard, a research scientist with the National Snow and Ice Data Center
at the University of Colorado at Boulder, works with Inuit to document their knowledge
of the environment and develops collaborative projects to link Inuit and scientific
knowledge. She lives in Clyde River, Nunavut, where she bases her studies. Working
closely with resident researchers and interpreters, she meets with elders and other local
experts to discuss environmental changes. They often use maps to chronicle travel routes
and the locations of various changes, such as thinning ice, dried-up ponds, and receding
glaciers. She also spends a great deal of time accompanying Inuit as they travel, hunt, and
fish, to learn about what they observe and how they make decisions within their
environment (Gearheard, 2008). Her established relations with Clyde River Inuit make
her insights relevant to this analysis.
Gearheard‟s work in Nunavut tells a story repeated by many communities around
the North: the Arctic is changing, and changing fast, on a number of fronts. Among the
most striking changes, observed by locals from Alaska to Finland, is that weather is
increasingly unpredictable. Since weather determines the day‟s activities for most

24
hunters, it is a critical part of everyday life, and closely watched. Skilled Inuit forecasters
observe cloud patterns and wind conditions to predict weather through the next day
(Gearheard, 2008). However, since around the mid 1990s, those techniques have not been
working as accurately. Winds have become increasingly erratic, coming from unusual
directions, and shifting several times throughout the day. At times, environmental
conditions may indicate a clear day ahead, but often times an unexpected storm arrives.
As Norman Attungala, an elder from Baker Lake, explained to Gearheard in 2001, “Inuit
have a traditional juggling game. The weather is sort of like that now. The weather is
being juggled; it is changing so quickly and drastically” (Gearheard, 2008). The
unpredictable weather has forced Inuit hunters and travelers to alter their travel habits.
Most are packing extra supplies and other traditional forecasters have stopped giving
advice altogether as many have lost confidence in their prediction skills.
Inuit insight has also reported on changes that range from subtle to striking in a
variety of species, including birds, caribou, fish, insects, polar bears, walrus, and whales,
as well as plants and lichen: “In many cases species are turning up in unexpected places
or at unexpected times of the year, often following the shifts in seasonal timing. But
many of the observed changes are even more complex” (Gearheard, 2008). At Clyde
River, for instance, the most important animal for Inuit is the ringed seal, which provides
food and skins for clothing. Seals normally molt in spring, and they scrape off old fur as
they lounge and move around on sea ice, basking in the spring sunshine. But hunters and
women who work with skins note that seals caught in summer sometimes appear still to
be molting. With earlier sea-ice break-up, seals are forced into the water before their molt

25
is complete. Inuit still use the seals' meat for food, but the skins are too uneven to be
useful (Gearheard, 2008).
1.7 Study Area
The selected research area is Cape Dorset, Nunavut, Canada. Cape Dorset is
located on a small island off the southwestern tip of Baffin Island (Foxe Peninsula), in
Hudson Strait (64°14‟N, 76°40‟W; Figure 1.7).
Figure 1.7: Illustrated location of Cape Dorset, Nunavut, Canada (Laidler & Elee, 2008).
The area was named by Luke Foxe who explored parts of the basin in 1631, with the cape
being named after the Earl of Dorset (Kemp, 1976). In the past, Cape Dorset has been
known as Sikusilaaq (in Inuktitut meaning „where there is no ice‟) as a result of a strong
Hudson Strait current that maintains open water in a close by vicinity throughout the

26
winter. The surrounding region has a rich archaeological history with evidence of Inuit
land use and occupancy dating back at least 3000 years. In 1913, a Hudson Bay Company
(HBC) trading post was established, which became the basis of community settlement in
the 1950s. The population currently stands around 1230 (93% Inuit), with Cape Dorset
being renowned for its art, cultural history, and proliferation of marine life (Laidler &
Elee, 2008).
1.8 Research Questions
For the Cape Dorset area, the nature of sea ice conditions needs to be determined.
We need to establish whether seasonal sea ice conditions are changing similarly to other
regions in the Canadian Arctic (Houser & Gough, 2003; Ford et al., 2006; Ford et al.,
2009). Ascertaining break-up and freeze up dates will assist in verifying sea ice trends by
illustrating the extent of the ice free season from the onset of the data set selected. If the
ice free season is determined to be increasing, than it can be confirmed that sea ice is
indeed changing and in such a manner that will negatively influence the lives of Inuit.
If it is concluded that seasonal sea ice conditions in Cape Dorset are indeed
shifting as local knowledge suggests (Laidler and Elee, 2008), we explore the influence
of local and regional weather parameters that may be determining the condition of
seasonal sea ice. As suggested by local knowledge we select four meteorological
variables that will be utilized in this research: temperature, weather types (based on air
masses), precipitation (data in the form of snow), and wind. The primary objective is to
determine whether these variables are influencing seasonal sea ice conditions and where
possible, to what extent.

27
Chapter 2
Methods (Data and Analysis)
2.1 Sea Ice
Sea ice freeze up and break-up dates were established for Cape Dorset. Ice charts
were obtained from the Canadian Ice Service (CIS) of Environment Canada for the years
1982-2007, and the state of sea ice cover was described for the coast of Cape Dorset, with
the hope of identifying long-term trends in the cryogenic cycle. The sea ice records,
obtained from the Canadian Ice Service of Environment Canada, were easily identifiable
from 1982-2006. Prior to 1982, the formatting of the ice charts did not follow the adopted
egg code system. The upgraded egg coding system provides an efficient means of
delivering vital information on ice conditions and is therefore recognized as the earliest
form of reliable sea ice observation. See Environment Canada‟s CIS website for specific
details on reading egg codes (URL:
http://iceglaces.ec.gc.ca/WsvPageDsp.cfm?Lang=eng&lnid=3&ScndLvl=no&ID=155)
The method for defining ice conditions (breakup and freeze-up dates) was
developed by Etkin (1991): “… the break-up and freeze-up dates were arbitrarily defined
by the time at which the majority of the ice cover dropped (or increased) to 5/10. If more
than half of the sampling area was covered by 5/10 ice or less, the ice in this area was
considered to be retreating and vice versa” (Houser & Gough, 2003). 5/10 is the threshold
used for navigable waters (Gagnon and Gough, 2005). This threshold was used for this
analysis. The CIS has established ice concentration data for the Hudson Bay Region
(which includes Cape Dorset) since 1971. The data is mapped out on charts weekly
except in winter months when the ice cover is continuous, issuing charts on either a bi-
28
weekly or monthly basis. The CIS charts are created by combining all information
available on ice conditions, including satellite images, ship and aircraft observations,
observations from shore, and climatic information (Gagnon & Gough, 2005). The break-
up and freeze up dates established for Cape Dorset are accurate within ±1 week. The
same methodology has been adopted by Stirling et al. (1999), Gough et al. (2004) and
Gagnon & Gough (2005).
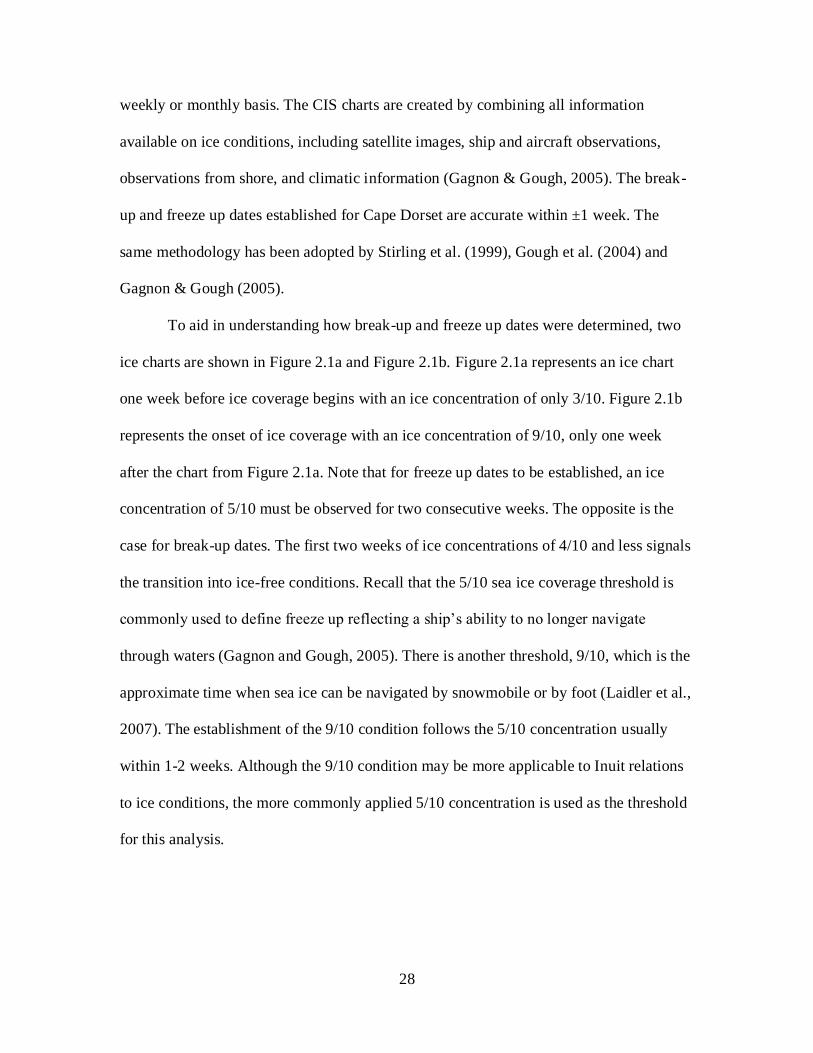
To aid in understanding how break-up and freeze up dates were determined, two
ice charts are shown in Figure 2.1a and Figure 2.1b. Figure 2.1a represents an ice chart
one week before ice coverage begins with an ice concentration of only 3/10. Figure 2.1b
represents the onset of ice coverage with an ice concentration of 9/10, only one week
after the chart from Figure 2.1a. Note that for freeze up dates to be established, an ice
concentration of 5/10 must be observed for two consecutive weeks. The opposite is the
case for break-up dates. The first two weeks of ice concentrations of 4/10 and less signals
the transition into ice-free conditions. Recall that the 5/10 sea ice coverage threshold is
commonly used to define freeze up reflecting a ship‟s ability to no longer navigate
through waters (Gagnon and Gough, 2005). There is another threshold, 9/10, which is the
approximate time when sea ice can be navigated by snowmobile or by foot (Laidler et al.,
2007). The establishment of the 9/10 condition follows the 5/10 concentration usually
within 1-2 weeks. Although the 9/10 condition may be more applicable to Inuit relations
to ice conditions, the more commonly applied 5/10 concentration is used as the threshold
for this analysis.

29
Figure 2.1 (a and b): Sea Ice charts from the Canadian Ice Service dating a) November 7th
, 1985 and
represents ice free conditions (egg code indicating 3/10 ice coverage) and b) November 14th, 1985 and
represents the onset of ice coverage (egg code represents 9/10 ice coverage) Cape Dorset is in the top
middle portion of both charts.
a)

30
b)
2.2 Temperature
There is temperature data from 1963-2007 for Cape Dorset Airport available via
Environment Canada. Minimum and Maximum temperatures are measured daily. For the
purpose of this assessment and to coincide with relevant sea ice data, available data from
1982-2007 will be used.
Minimum, maximum and mean annual temperatures were established from 1982-
2005. The data for 2006 and 2007 is incomplete and will therefore be left out from the
analysis. 1994, 1999, and 2002 had months of missing data so were also not utilized in
this assessment.

31
In order for a correlation to be determined between sea ice and temperature, the
length of the ice free season in Cape Dorset, that is the period between the onset of break-
up to the arrival of freeze up conditions, is correlated with mean annual temperatures
from the Cape Dorset Airport weather station, using a linear regression. The length of
annual ice free seasons were determined by counting the number of days from the onset
of break-up to the established freeze up dates for any given year.
2.3 Weather Type
Weather Types were evaluated from 1982-2008 and are intricately related to
temperature, however adding a dynamic in the form of moisture/humidity. Weather
typing, known as spatial synoptic classification of ambient weather conditions into
categories, is used in this portion of the analysis. There is a weather type calendar
available online, whereby each day in a station‟s period of record is classified into one of
the weather types (i.e. DP or dry polar air, DM or dry moderate air, DT or dry tropical air
and so on; link: http://sheridan.geog.kent.edu/ssc.html; see Figure 2.2 for a complete list
and their descriptions). With this data, the frequency of each weather type has been
Figure 2.2: A list of weather types as described by Scott Sheridan at Kent State Geography (Taken from:
http://sheridan.geog.kent.edu/ssc.html)
Weather types
DP (dry polar) is synonymous with the traditional cP air mass classification. This air
mass is generally advected from polar regions around a cold-core anticyclone, and is
usually associated with the lowest temperatures observed in a region for a particular time
of year, as well as clear, dry conditions.
DM (dry moderate) air is mild and dry. It has no traditional analog, but is often found
with zonal flow in the middle latitudes, especially in the lee of mountain ranges. It also
arises when a traditional air mass such as cP or mT has been advected far from its source
region and has thus modified considerably.
The DT (dry tropical) weather type is similar to the cT air mass; it represents the
hottest and driest conditions found at any location. There are two primary sources of DT:
either it is advected from the desert regions, such as the Sonoran or Sahara Desert, or it is

32
produced by rapidly descending air, whether via orography (such as the chinook) or
strong subsidence.
MP (moist polar) air is a large subset of the mP air mass; weather conditions are
typically cloudy, humid, and cool. MP air appears either by inland transport from a cool
ocean, or as a result of frontal overrunning well to the south of the region. In can also
arise in situ as a modified cP air mass, especially downwind of the Great Lakes.
MM (moist moderate) is considerably warmer and more humid than MP. The MM air
mass typically appears in a zone south of MP air, still in an area of overrunning but with
the responsible front much nearer. It can also arise within an mT air mass on days when
high cloud cover suppresses the temperature.
MT (moist tropical), analogous to the traditional mT air mass, is warm and very
humid. It is typically found in warm sectors of mid-latitude cyclones or in a return flow
on the western side of an anticyclone; as one approaches the tropics this weather type
dominates. MT+ (moist tropical plus) is a subset of MT that was derived after the initial
classification, to account for the lack of utility of a weather-type scheme in the warm
subtropics when one weather type dominates most of the year. It is defined as an MT day
where both morning and afternoon temperatures are above seed day means, and thus
captures the most “oppressive” subset of MT days.
TR (transitional) days are defined as days in which one weather type yields to
another, based on large shifts in pressure, dew point, and wind over the course of the day.
outlined from 1982-2008 and will help determine any alteration in experienced weather
type. One problem did arise in that there was no station for Cape Dorset. A station was
however available for Iqaluit, Nunavut and based on its proximity to Cape Dorset, this
station was selected as a proxy.
These weather types are representative of differing air masses. An air mass is an
extremely large body of air whose properties of temperature and humidity are fairly
similar in any horizontal direction at any given altitude (Ahrens, 2003). Air masses may
cover many thousands of square kilometres. For example, at any one point during the
winter, a large winter air mass may be covering half of the United States. Say for instance
this air mass is associated with a high-pressure area. Although the surface air temperature
and dew point temperature vary somewhat, everywhere the air is cold and dry, likely with

33
exception to areas with large bodies of water such as the Great Lakes. This cold, shallow
anticyclone will drift eastward, carrying with it the temperature and moisture
characteristics of the region where the air mass formed. Therefore, in a day or two, cold
air will be located over the Central Atlantic Ocean. Part of forecasting weather is then a
matter of determining air mass characteristics (Ahrens, 2003).
Air masses are usually classified according to their temperature and humidity,
both of which usually remain fairly uniform in any horizontal direction (Ahrens, 2003).
Air masses can either be cold or warm and humid or dry. They are grouped into four
general categories based on their source region. Air masses that are generated in polar
latitudes are designated with a capital letter “P” (for polar); those that form in tropical
latitudes are designated with a capital letter “T” (for tropical). If the source region is land,
the air mass will be dry and the lowercase letter “c” (for continental) precedes the P or T.
If the air mass originates over water, it will be moist and the lowercase letter “m” (for
maritime) precedes the P or T. Thus, polar air originating over land will be classified cP
on a surface weather chart, whereas tropical air originating over water will be marked as
mT. In winter, an extremely cold air mass is designated as cA, continental arctic. Often,
however, it is difficult to distinguish between arctic and polar air masses, especially when
the arctic air mass has traveled over warmer terrain (Ahrens, 2003). The principle air
masses in North America, and their source regions, are illustrated in Figure 2.3.
2.4 Snow
Snowfall records will be briefly discussed in this analysis, not because of a lack of
importance but more because of a deficit of available data. The preferred data would have
been day to day measurements of snow fall depth (and subsequently rainfall depth).

34
However snowfall records in the form of frequency (number days in which precipitation
fell in the form of snow) is available for Cape Dorset via Environment Canada from
1980-2007 and will be utilized in this analysis. The number of days with snow is counted
on a monthly basis and annual data sets are provided from Environment Canada. The
years of 1982-2007 are used to coincide with the relevant sea ice analysis.
Figure 2.3: Source sites and movement patterns for North America‟s major air masses (Pidwirny, 2006).
2.5 Wind
Finally, wind analysis results will be presented and the methodology follows
closely to that done by Laidler et al. (2007). Wind data (direction and speed) for Cape
Dorset is available from 1970 – 2007 via Environment Canada. The time period between
1 and 2 pm was used for this analysis as this was the time period with the most
comprehensive data collection. The years 1970-1981 were omitted from the analysis as
major data gaps were present in months of duration. The data were analyzed using an

35
annual average, as well as averages of the monthly pairs for July and August (JA) and
October and November (ON). These pairings correspond to the timing of break-up and
freeze up of sea ice in Cape Dorset respectively. Wind direction was analyzed using
sixteen directions (see Table 2.1) and wind speed was analyzed using the Beaufort Scale
for wind speed subdivision (see Table 2.2). Wind speed for each of the annual and
Table 2.1: These are the standard sixteen wind rose wind directions and their corresponding degree ranges
used in the study (Laidler et al., 2007).
Wind Direction
Degree Range
Wind Direction
Label
348.75 – 11.25 N
11.25 – 33.75 NNE
33.75 – 56.25 NE
56.25 – 78.75 ENE
78.75 – 101.25 E
101.25 – 123.75 ESE
123.75 – 146.25 SE
146.25 – 168.75 SSE
168.75 – 191.25 S
191.25 – 213.75 SSW
213.75 – 236.25 SW
236.25 – 258.75 WSW
258.75 – 281.25 W
281.25 – 303.75 WNW
303.75 – 326.25 NW
326.25 – 348.75 NNW
Table 2.2: These are the standard Beaufort wind speed classifications with corresponding wind speed
ranges in metric units used in this study (Laidler et al., 2007).
Wind Speed
(m/s)
Beaufort Scale
0.5 - 2.1 1 Light Air
2.1 - 3.6 2 Light Breeze
3.6 - 5.7 3 Gentle Breeze
5.7 - 8.8 4 Moderate Breeze
8.8 – 11.1 5 Fresh Breeze
>= 11.1 6 Strong Breeze

36
seasonal (break-up/freeze up) groupings were examined for temporal trends. The
domination of winds from the west/northwest was also examined for temporal trends by
percentage of total wind and ranking of dominant wind.
2.6 General Analyses
Linear regression analyses were used for temporal trends on all of the above data
sets. R² values are displayed to indicate goodness-of-fit. P-values are also generated to
determine the statistical significance of the trends. The p-value is the probability of
seeing a result as extreme as the one displayed in a collection of random data in which
the variable had no effect. A p-value of 0.05 or less is the generally accepted point at
which to reject the null hypothesis, although 0.1 is commonly used and is accepted in the
analysis. With a p-value of 0.05 there is only a 5% chance that results displayed would
have come up in a random distribution, so one can say with a 95% probability of being
correct that the variable is having some effect.

37
Chapter 3
Results
3.1 Sea Ice
The results of the sea ice analysis for Cape Dorset are illustrated in Figures 3.1a
and b. The breakup dates were found to occur earlier with time from 1990 onward (p-
value 0.06). Freeze up occurs later with time for the full range of the data (from 1982
onward) in a statistically significant fashion (p-value <0.01). Over the full period of
analysis for break-up dates (refer to Figure 3.1a), there is a clear shift in the timing of the
onset of break-up conditions. While in the early 1980s ice break-up was occurring around
July 25th
, the latter parts of the study (around 2007) averaged break up dates around July
15th with one date as early as July 2
nd. Note that from 1995 onward there was no date of
break-up later than July 19th
, while from 1982-1994 only three of the thirteen years
witnessed dates earlier than July 19th
, with break-up dates occurring as late as August 15th
in 1993. On average, break-up conditions are occurring 10 days earlier than in the past.
Although this is a significant increase, it pales in comparison to the shift in freeze up
dates.
In the early 1980s, freeze up dates were occurring around late October to early
November. In the latter part of the analysis (2007), freeze up dates shift to early
December. That is to say freeze up dates are occurring one full month later than in the
past. Since 1996, there has been no freeze up date earlier than November 15th, in contrast
to 1990 when the freeze up date was around October 20th
and in the early 1980s when
freeze up dates were consistently around late October. Note that this trend in break-up

38
and freeze up dates is consistent with Igloolik in Foxe Basin (Laidler et al., 2007) but no
consistent with Hudson Bay (Gagnon & Gough, 2005) where break up trends were more
Figure 3.1 (a and b): Graphs indicating a) sea ice breakup dates for Cape Dorset 1982-2007 (P-value of
0.06 from 1990 onward) and b) sea ice freeze-up for Cape Dorset 1982-2007 (P-value <0.01 from 1982
onwards).
a)
b)

39
pronounced. The remainder of this chapter evaluates environmental factors that may be
contributing to the shift in break-up and freeze up dates.
3.2 Temperature
Cape Dorset minimum and maximum temperature results are displayed in Figure
3.2a and b. Both results displayed highly significant trends with p-values <0.01.
Figure 3.2 (a and b): Graphs indicating a) average minimum temperatures for Cape Dorset (1982-2005) and
b) average maximum temperatures for Cape Dorset (1982-2005). P-values for both trends is <0.01.
a)
b)

40
The results exemplify similar trends that have been noted in other regions within the
Arctic (Gough et al., 2004; Gagnon & Gough, 2005). Both minimum and maximum
temperatures are increasing, with minimum temperatures increasing slightly quicker than
maximum temperatures. Over the twenty-four year study period, minimum temperatures
experienced a net increase of ~4°C (about 0.17°C per year) and maximum temperatures
increased ~3°C over the study period.
Figure 3.3 displays the results of the correlation between the length of Cape
Dorset‟s annual ice free seasons and mean annual temperatures for Cape Dorset from
1982-2005 (with 1994, 1999, and 2002 being omitted). A significant correlation was
established with a p-value of <0.01 (the R² was 0.7). These highly significant results
indicate that the dependent variable (sea ice) is likely influenced by variations in
temperature and that variations in temperature account for ~70% of the variability of the
sea ice.
Figure 3.3: This graph compares Cape Dorset‟s annual mean temperatures from 1982-2005 with the extent
of Cape Dorset‟s ice free period during the same annual range (p-value <0.01).

41
3.3 Weather Type
The weather types have been divided into four representative time frames for any
given year which have been labeled spring (March-May), summer (June-August), autumn
(September-November), and winter (December-February). There are two dominant
weather types within the study area: DP or dry polar air and MP or moist polar air (See
Figure 2.2 for their descriptions). Other weather types such as MM or moist moderate
appears in the data less frequently and were deemed not applicable as the frequency
counts were consistently low and thus not a significant player for this part of the Arctic.
Figure 3.4 (a-d) displays the results for the weather typing of the study area from 1982-
2008. All four time periods account for a shift in weather types from the beginning to the
end of the study, with MP air masses becoming more frequent in comparison to DP (p-
values <0.01 for all four time periods).
Figure 3.4 (a-d): Weather Types taken from the Iqaluit, Nunavut weather type station. Displayed are the
results from 1982-2008 for DP (dry polar) and MP (moist polar) weather types for the months from a)
March-May, b) June-August, c) September-November and d) December-February (p-values are <0.01 in all
four cases).
a)

42
b)
c)

43
d)
3.4 Snow
Significant trends were established for the number of days with snow in any given
month and the months of May (p-value 0.03) and October (p-value <0.01) are available
for viewing in Figure 3.5a and b respectively. These two examples are representative of
the same trend found through the months of May to November and less so for the months
of December to April. Despite increasing moist air masses entering the region, the
number of days in which snow falls is decreasing significantly. For example, in 1987
there were 28 days in May which snow was accounted for in the region. However, in
2007, there was not a single day of recorded snowfall in the month. Laidler et al. (2007)
suggest that during the freeze up season, snow acts as an insulator and promotes melting
on the ice and have been informed by Inuit in the community of Igloolik, Nunavut
(approximately 618 km northwest of Cape Dorset) that there has been more snow on the
sea ice over recent years. In the following chapter, some light is shed on these conflicting
results (i.e. fewer days with snow but more snow on the ice) and suggest how a positive

44
Figure 3.5 (a and b): Snowfall records for Cape Dorset, Nunavut (1982-2007) illustrating the number of
days with snow in a) May (p-value = 0.03) and b) October (p-value <0.01).
a)
b)
feedback effect may be contributing to these findings.
3.5 Wind
Trends were difficult to establish with the annual wind data. For every year from
1982-2007, the annual prevailing wind was directly from the west (see Figure 3.6 for a

45
Figure 3.6: A typical annual wind rose for the Cape Dorset region (using the 16 directions outlined in Table
2.1) illustrating wind direction and speed (m/s, where Calms = the percentage of days where there is no
wind, or it is below the lowest category). The year 1995 is depicted here with westerlies as the prevailing
winds and northwesterly winds as secondary, both common trends throughout the data set with the west
prevailing wind as the dominant trend.
typical annual wind rose). Figure 3.7 a) illustrates the stable prevailing wind dominance
(exclusively from the west) for the complete dataset with no identifiable trend (p-value
0.48). There is little consensus among Cape Dorset Inuit on a predominant wind direction
or their related influences on sea ice (see Table 3.1). This analysis may shed some light
on this issue. Trends for the seasonal monthly pairs varied considerably from the annual
means. Both JA and ON showed significant trends (p-values of 0.1 and 0.05 respectively)
of a decreasing dominance of any particular prevailing wind (see Figure 3.7 b) and c)).
These findings indicate that winds are becoming more variable in direction during the
break-up and freeze up periods.

46
Figure 3.7 (a-c): Percentage of prevailing or peak wind from 1982-2007 for a) annually with the dominant
wind direction from the west which is relatively stable with a slight increase since the onset of the study
however no discernable trend was established with a p-value of 0.48, b) JA with a decreasing dominance of
any particular wind direction (p-value 0.1), and c) NO with a decreasing dominance of any particular wind
direction (p-value 0.05).
a)
b)

47
c)
Table 3.1: Summary of predominant directional and seasonal winds around Cape Dorset, and their related
influences on sea ice (Laidler & Elee, 2008).
Wind speed averages were analyzed for annual and seasonal temporal trends.
Seasonal trends failed to reveal any significant trends over the study period. Annual
average wind speed however displayed a significant increasing trend with a p-value of
0.05 (see Figure 3.8). The wind speeds have increased approximately 0.5 m/s since 1982,
accounting for a 10% net increase. Note that ON experienced an increase in average wind

48
Figure 3.8: Average annual wind speed for the Cape Dorset area (m/s). The linear trend is statistically
significant with a p-value of 0.05 representing an increase in average annual wind speed with a net increase
of approximately 10%.
speed since 1982 but a p-value of only 0.18 was established and therefore cannot be
considered significant (however worthy to note as a trend may be developing).
Finally, Laidler & Elee (2008) recognized that Inuit interviewees often made
reference to winds coming from the mainland in comparison with winds coming from the
open water. Generally, winds coming from northerly directions constitute winds coming
from the mainland (Baffin Island) and winds coming from southerly directions
originating from the open waters. Inuit have recognized general trends that these
particular winds have on ice conditions. To analyze these two directions, the percentage
of winds coming from the seven wind rose directions below due west and due east (these
two directions were not accounted for however their importance are recognized in the
general prevailing wind dominance portion of the wind study) were summed from 1982-
2007 for ON. JA was not considered in this portion of the analysis as throughout the
study period winds from the south dominated that of the north and this pattern likely

49
plays a significant role in altering ice conditions during this time of the year. ON however
is developing a trend of an increasing dominance of winds from the open water. The
statistically significant trend is displayed in Figure 3.9 (p-value 0.08).
Figure 3.9: Percentage of winds from the 7 most southerly wind rose directions for ON. A significant
increasing trend has been established (p-value 0.08).
The next chapter will evaluate and discuss the results presented here and will look to
uncover some of the local dynamics of sea ice change in the community of Cape Dorset.

50
Chapter 4
Discussion
4.1 Sea Ice
Indigenous Knowledge in many respects defines Aboriginal peoples throughout
Canada and is central to the social, cultural and economic well-being of communities
(Laidler et al., 2007). This is no different for Inuit communities who depend heavily on
their local environment to provide cues when it is the right time to hunt, fish, travel, seek
shelter or prepare for unruly conditions. Sea ice is one of these key environmental cues
that are unfortunately becoming difficult to forecast by Inuit experts.
The results in this work have indicated that the once short three month
(approximately) ice free period for Cape Dorset has extended on average by 40 days in
since 1982. That is nearly two days per year and if the trend is to continue at this pace, by
the year 2040 the ice free period will be around six months, conditions more indicative of
a mid-latitude climate zone. For a community like Cape Dorset, the sea ice is the
platform that provides sustenance. It is their connection not only to this sustenance, but
also their connection to the rest of the world. The sea ice is their highway to the mainland
(Baffin Island). As ice conditions are becoming more difficult to predict, travelling over
sea ice has become a dangerous and formidable task. For Inuit hunters in Canada‟s
Nunavut Territory in general, changing climatic conditions has meant that their
traditional knowledge, which underpins safe and successful hunting, is less dependable
(Ford & Smit, 2004).

51
So, what is influencing these changing ice conditions? In the next sections we
examine a number of meteorological factors including temperature variation, weather
type, snow and wind.
4.2 Temperature
The analysis defined a clear relationship between the climate variable
(temperature) and the exposure unit (sea ice). This suggests that the variation in sea ice
conditions is not occurring by chance alone, and indeed there are likely meteorological
conditions that influence its formation and subsequent dissolution. Other statistical and
modelling studies have demonstrated that air temperature is the main factor altering
cryogenic cycles in the eastern Arctic (Gough et al., 2004; Gagnon & Gough, 2005;
Laidler et al., 2007) and the data presented here confirms in consistent with other results.
Rates at which temperatures are rising in different Arctic regions are not uniform which
suggests the requirement of local analyses to quantify the severity of increasing
temperatures. This is illustrated by the differing rates of break up and freeze up rates
within Hudson Bay where the break up trends dominate the freeze up trends (Gagnon and
Gough, 2005) and those reported in this work and at Igloolik (Laidler et al. 2007) where
the opposite prevails.
Cape Dorset appears to be on the brink of dramatic alterations to their four
seasons. In fact, other studies have demonstrated that temperatures are continuing to rise
at unprecedented rates (Kaufman et al., 2009; Graversen & Wang, 2009). This
unprecedented change in temperature will likely continue to diminish the accuracy of
Inuit foresight. Animal behaviour and vegetation growth will also be altered, threatening
harvests and anticipated animal migration routes (Laidler & Gough, 2003).

52
4.3 Weather Type
The Cape Dorset region is predominantly affected by two air mass types: cP and
mP air masses. cP air is associated with Scott Sheridan‟s DP weather type, demonstrating
cold, dry and stable weather conditions and mP air is associated with his MP weather
type, demonstrating cool, moist and unstable conditions. The results suggest that the DP
weather type is no longer the consistent weather type in the region. MP air is now
consistently frequenting the region and is significantly increasing from year to year, in all
seasons of the year (Figure 3.4 a-d). This weather type, being associated with warmer
conditions than DP weather, although originating from the North Atlantic and still cool,
should be playing a significant role in warming average temperatures within the region as
shown in the previous section. This also appears to be related to the shifts we are seeing
in the dominance of prevailing winds from the west. Systems from the east are becoming
more common, carrying related climate conditions with it (MP air which warmer and
moister). As the Cape Dorset temperature analysis reveals, temperature and sea ice
conditions are intricately linked (Figure 3.3). If MP type weather is in fact contributing to
warmer temperatures which this analysis is indicating, then it would be reasonable to
assume that shifting distribution of air masses is one weather indicator linked to the
increasing ice free season.
Subsequently, conditions associated with the mixing of MP and DP weather types
may be producing environmental conditions not normally associated with Inuit foresight.
Whereas DP weather would be dominant and likely present in the region with MP air
acting as a secondary system (cold air being established and cool air coming into
contact), the spring, summer, and autumn months have seen a shift with MP weather

53
acting as the dominant weather type and DP weather as the secondary system (cool air
being established and cold air coming into contact). When the air mass is warmer than the
surface below, the lower layers are chilled by contact with the cold earth. Warm air above
cooler air produces a stable lapse rate with little vertical mixing (conditions indicative of
the early 1980s in the Cape Dorset region). On the other hand, when the air mass coming
in is colder than the underlying surface, it is warmer from below, which results in a
steeper lapse rate and instability at lower levels. In this case, increased convection and
turbulent mixing near the surface usually produces poor visibility, cumuliform clouds,
and heavy rain or snow (Ahrens, 2003). These newly developed trends may be hampering
the predictive capabilities of Inuit experts, making it increasingly difficult to determine
when to hunt and travel.
4.4 Snow
As suggested above, the MP weather type should be accounting for more
precipitation within the Cape Dorset region. More precipitation in the form of snow
would be contributing to the break-up of sea ice during the freeze up season as snow acts
as an insulator on ice, thereby warming it and causing it to melt (Laidler et al., 2007).
However, snow at other times of the year, such as spring, can delay break-up conditions.
(Laidler et al., 2007). The data which outlines the number of days with snow suggests, at
least at a first glance, that snow is not playing a significant role in the early break-up of
sea ice and in fact is significantly decreasing in effect with time (Figure 3.5a & b).
Despite this, the data suggests precipitation may be playing a critical role in the extension
of the ice free season. Although the months of May to November suggest a decreasing
number of days with snow, this more likely than not relates to the fact that air

54
temperatures on average are increasing. This means that in the spring time, instead of
getting snow which delays break-up, rain is precipitating and enhancing break-up
conditions.
In the autumn, when snow acts as an insulator and delays freeze up, snow is still
precipitating regularly in the Cape Dorset region. The decrease in the number of days
with snow can likely be accounted for with rain, subsequently inhibiting freeze up
conditions and extending the ice free season. From December to April, the number of
days with snow has not fluctuated significantly from 1982-2007.
Snow that falls through moist air that is slightly above freezing (air temperatures
similar to break-up and freeze up periods) slowly melts as it descends. A thin film of
water forms on the edge of the flakes, which acts like glue when other snowflakes come
in contact with it. In this way, several flakes join to produce giant snowflakes often
measuring several centimetres or more in diameter (Ahrens, 2003). These large, soggy
snowflakes are associated with moist air and temperatures near freezing and effectively
accumulate on the ground acting as an insulator for the sea ice during the freeze up
season. When it becomes too warm for this type of snow to be formed, rain is produced
instead and further promotes the melting of sea ice as water has a greater affinity for
melting ice than air does (Serway & Jewett, 2002). Once again with the added moisture
brought in by MP weather, rain is likely to be falling more frequently or more heavily on
the days that it does rain. Precipitation records need to be found and verified before such
assumptions can be confirmed. Still, it is an interesting trend, one which will require
future analysis.
4.5 Wind

55
Winds have a dynamic influence on sea ice, with the potential to influence how
ice forms, moves, or deteriorates (Laidler & Elee, 2008). At many locations, wind blows
more frequently from one direction than from any other. The prevailing wind is the name
given to the wind direction most often observed during a given time period (Ahrens,
2003). Prevailing winds can especially affect the climate of a region. For example, where
the prevailing winds are upslope, the rising, cooling air makes clouds, fog, and
precipitation more likely than where the winds are downslope. Prevailing onshore winds
in the summer carry moisture, cool air, and fog into coastal regions, whereas prevailing
offshore breezes carry warmer and drier air into the same locations (Ahrens, 2003).
Inuit use well developed prevailing winds to determine the right time to hunt and
travel. Yupik communities in Alaska for example observe the direction of winds to
determine where leads will develop so they can access good numbers of walrus and
bowhead whales (Laidler, 2006). For Igloolik Inuit winds factor highly into walrus
hunting decision making. The ideal circumstances are when the winds are from the east,
southeast, or south, and the tide is moving in, meaning that the ice will stay close to the
land and the floe edge (the prevailing wind for Igloolik being from the northwest). This
prevents hunters from getting stranded and carried out to sea. Overall, the lack of wind
patterns has restricted walrus hunting opportunities in Igloolik (Laidler et al., 2007).
Knowing the time of year when prevailing winds shift is a vital component of their
decision making process.
It was difficult to discern from the literature how Cape Dorset Inuit specifically
utilized the presence of a prevailing wind and how it applies to their unique geographical
location. Nonetheless, it is evident that the shifting of wind conditions has an effect on

56
the regular establishment of ice conditions, thereby altering the continuity of sea ice
formation and deterioration regularly observed and utilized by Cape Dorset Inuit. The
prevailing wind for Cape Dorset has been identified as being directly from the west on an
annual basis (Figure 3.6). However, when evaluated from a seasonal standpoint that
relates to the timing of sea ice break-up (July-August) and freeze up (October-
November), the dominance of a prevailing wind has been decreasing significantly since
1982 (Figure 3.7b & c). That is to say that the dominance of a prevailing wind has
decreased by 21% in the months of JA and 30% in the months of ON since 1982. With
the winds becoming increasingly erratic during break-up and freeze up, these patterns
will undoubtedly inhibit the predictive capabilities of Cape Dorset Inuit, making hunting
grounds formidably dangerous to traverse with all of the guess work in irregular
environmental conditions.
Despite Cap Dorset Inuit not having a uniform consensus on the influence of
winds from an absolute direction, there are discussions on the influence of winds on sea
ice in relation to the general direction from which they originate (Laidler & Elee, 2008).
Winds from the mainland (north) were said to bring in pleasant conditions, pleasant in
that the conditions are cold and promote freezing of sea ice in the autumn. Winds from
the mainland can also drive away multi-year ice that allows for more conducive boat
travelling conditions (Laidler & Elee, 2008). In contrast, winds from the open water
(south) are said to have a great influence on ice conditions, often in a destructive manner.
In any season, these winds from the south are said to promote the break-up of ice in the
spring and prevent the freeze-up of sea ice in the autumn. Figure 3.9 indicates that for the
freeze up months of ON, the percentage of winds that are coming from the south has

57
significantly increased since 1982. In fact, the winds from the south have increased by
33% since 1982 for ON. Note that for the spring months of JA, winds from the south
dominate consistently from 1982-2007 and figure prominently in the break-up of sea ice
in the spring (Laidler & Elee, 2008).
Wind speed plays a significant role in sea ice dynamics. Cape Dorset Inuit have
identified trends with varying wind speeds. Light winds, or calm conditions are said to
promote freeze up. In contrast, strong winds in any direction are said to greatly affect ice
stability. When the ice is forced to pile on top of other ice, deformation is promoted as
the ice refreezes into rough ice (in Inuktitut this ice is referred to as ivuniit and is
compared to pressure ridges). One Inuit expert describes ivuniit in the following manner:
“Another ice is called ivuniit… it‟s like a bulldozed coming from the water side pushing
thick ice to the islands from the mainland. When it‟s windy from the south side that
happens, or around current areas…” (Laidler & Elee, 2008). Heavier winds also play a
role in creating wave action, which prevents ice from forming, and may cause the floe
edge to open up and break off. From a seasonal standpoint, a windy autumn means that
broken pieces of ice will freeze together, rendering travel conditions dangerous because
the ice might break off little by little (Laidler & Elee, 2008). Cape Dorset Inuit have
recognized that windy conditions are more prevalent in the spring, causing faster ice
deterioration than most other ice melting factors (direct sunlight or rain). Furthermore,
sustained strong winds are said to be responsible for the formation of many tidal cracks in
the sea ice (Laidler & Elee, 2008). Figure 3.8 illustrates that annual average wind speeds
for the Cape Dorset area have been increasing significantly since 1982. If this trend
continues to persist, and as Inuit observation suggests it is, the livelihoods of Inuit people

58
will continue to be challenged. The importance of studies such as this is to recognize
these potential changes and to make sure that the appropriate people realize these
tendencies are being established and are likely to be enhanced in the future. This will
allow Inuit to better prepare for new and challenging conditions that are unprecedented
by even their own recent knowledge.
4.6 Further Impacts
The social impact on Inuit communities may be best documented by Ford et al.
(2009), Ford et al. (2006) and Ford (2005). He suggests social, cultural, and economic
challenges threaten to undermine Inuit adaptability to change and, if not addressed, could
ultimately compromise their ability to cope with future environmental challenges (Ford,
2005). He gives several accounts of the challenges Inuit are facing, for example:
“In the late spring of 2000, a group of 52 hunters from Arctic Bay, a small Inuit community
on the northern coast of Canada‟s Baffin Island, were hunting narwhal from the edge of the
sea ice. But things didn‟t go according to plan, recalls Levi Barnabas, a 41-year old hunter
and local politician. A strong wind from the south caught the group by surprise, detaching the
ice they were on from the mainland and blowing them out towards sea. Unable to reach land
and approaching open water, Barnabas and several others radioed for help. Luckily, an
icebreaker sailing nearby was able to dispatch a helicopter to rescue the stranded hunters. All
were saved, but many lost their valuable equipment, including snowmobiles, sleds, guns,
rowboats, and VHF radios” (Ford, 2005).
These types of stories have become commonplace in Inuit communities. There
have been many personal accounts documented of Inuit experts no longer being able to
use their knowledge of their homeland environments to predict weather. Still, while
research has increased our understanding of how changing Arctic conditions will affect
biophysical processes, our current level of knowledge about its implications for human
activity and societies remains limited (Ford et al., 2006). Much of the information
regarding changing Arctic conditions has been documented in the form of broad studies
conducted by government agencies. However, in order to understand the consequences

59
from the human standpoint, we need to go beyond the physical dimensions of the shift
and pay attention to human dimensions through which they are experienced. This by no
way diminishes the importance of the results presented in this study but it should be
recognized that studying physical changes is only a starting point for such a complex
issue and should not be considered a complete investigation.
Although Inuit communities have revealed their adaptive nature by utilizing food
sharing networks to alleviate the shortened hunting seasons, these mechanisms are
beginning to fall short in moderating risk (Ford et al., 2006). For those who are dependent
on products of the hunt, store-bought foods are not an acceptable alternative. They
suggest store-bought foods do not provide equivalent nutrients as country foods and
complain of the unaffordable cost of store bought food, especially with the additional
premium tag prices on foods sent to remote Arctic locations. Thus, climatic changes have
forced Inuit people to expand their decision making proficiency. Food security will
continue to be compromised in Arctic communities if hunting access is further
constrained with future climate change (Ford et al., 2006), and as the significant trends on
Cape Dorset have indicated, not only here but by several others (Gagnon & Gough, 2005;
Laidler & Gough, 2003; Houser & Gough, 2003), the trend will not only continue but
will likely be amplified in the future.

60
Chapter 5
Conclusion
Aboriginal peoples in Canada have highly developed knowledge systems in
relation to their environment. Often referred to as indigenous knowledge, their
knowledge systems have been highly touted by western researchers. Recently they have
been recognized for their unique and complex understanding of how the world works.
Inuit people are very much included in this discussion and are recognized for their
heightened awareness of dynamic environmental processes. Unfortunately shifting
climatic conditions are hampering their ability to interpret environmental conditions and
thereby threatening not only who they are as people but also their very livelihoods.
Arctic coastal communities are highly adapted to seasonal variations in sea ice
formation. For example, harvesting practices of both Inuit and Cree populations have
been adapted to the formation and therefore timing of the sea ice season for centuries. If
their abilities to predict weather patterns are undermined by permanent and continuous
climatic shifts, “Inuit and Cree communities could be gravely affected in a variety of
ways, including nutrition, financial stability, social dynamics, and cultural practices”
(Laidler & Gough, 2003). For years, First Nation communities have been successful at
adapting to minor fluctuations in year to year climate. However, the types of anticipated
change, as anticipated by this assessment and several others, are likely to severely
challenge these communities ability to adapt and change to widespread regional climate
transformations. In particular, many game species will not adapt to the new conditions
and will therefore migrate elsewhere or die off. This will have serious consequences for

61
subsistence economy as they are unlikely to be replaced by other wild food resources
(Laidler & Gough, 2003).
Throughout this account, indigenous observations and results brought about by
the innovations of western technology are convergent with respect to variables that
influence the presence of sea ice. Both insights provide acute observations and similar
results, yet are developed from fundamentally dissimilar perspectives. As Inuit elders and
hunters are astute observers of the sea ice edge, they inherently should be considered the
experts on local ice conditions and dynamic processes because of their extensive use and
experience of traveling on, and observing, ice conditions in order to assure safe travel and
successful hunting (Laidler & Elee, 2008). With innovative technologies being able to
reproduce these astute, albeit baseline observations, then perhaps taking advantage of
other modern innovations may indeed be useful in evaluating prospective alterations to
Arctic environments and their effects on Inuit communities.
With the Arctic periphery experiencing the initial brunt of changing climatic
conditions, focusing studies on these localities seems to be the most logical choice.
Unfortunately the dynamic of Arctic environments means no two regions will be affected
by change in the same way. There are several meteorological variables that influence the
dynamic of sea ice in Arctic regions. That is why local analyses are imperative. We
cannot group Arctic change in one apocalyptic manner and say that temperatures are
getting warmer, ice caps are melting, permafrost is shifting and sea ice is disappearing
without specifying where and at what rate. Regions have very specific characteristics, and
are affected by perturbations in different ways. This begs the question of where
specifically to focus research. From a human standpoint, established Inuit communities

62
would be a good starting point as this analysis demonstrates. From an ecological
standpoint, regions with known species at risk would benefit from local research. From
an economic and/or a political standpoint, the opening of shipping routes and access to
oil reserves will vary on a region by region basis, meaning local analyses could potential
determine where government efforts need to be focused.
The results presented here on Cape Dorset are by no means complete. There are
still other variables that affect sea ice that need to be considered such as currents, tides,
and the affects of topographical features on wind distribution and general weather trends.
Other datasets that may help in determining the impact of shifting weather variables on
sea ice would be measurements of sea ice thickness and accurate precipitation records.
Despite not having these helpful datasets, I recommend that the next step in my analysis
should be the establishment of impact projections. Because the observations made by
Inuit and those developed by the results presented here coincide, utilizing these results to
establish future scenarios is applicable to the future environmental conditions Inuit can
expect to experience.
The study and consideration of climate change is of increasing significance to
society. A Climate Change Impact Assessment (CCIA) is a formalized, step-by-step
approach to studying and projecting future climate change. This type of analysis
commonly utilizes large scale climate models such as GCMs (General Circulation
Models) to project future climate forcing. We propose the utilization of a Statistical
Downscaling Model (Wilby & Dawson, 2007), which is a windows-based decision
support tool for the rapid development of single site, ensemble scenarios of daily weather
variables under present and future climate forcing. This model is used in conjunction with

63
large scale climate modeling used to project climatic conditions. The utilization of the
SDSM software will significantly aid in advancing localized analyses of dynamic Arctic
regions.

64
References
Ahrens, D.C. (2003). Meteorology Today: An introduction to weather, climate, and the
environment. Pacific Grove, CA: Brooks/Cole – Thompson Learning.
Anderson, M.K. (1996). Tending the wilderness. Restoration and Management Notes, 14,
pp. 154-166.
Aporta, C. (2002). Life on the ice: understanding the codes of a changing environment.
Polar Record, 38, pp. 341-354.
Berkes, F. (1977). Fishery resource use in a subarctic Indian community. Human
Ecology, 5, pp. 289-307.
Brigham, L.W. (2007). Thinking about the Arctic‟s Future: Scenarios for 2040. The
Futurist, September – October.
Britannica Online Encyclopedia (2008). Admiralty Inlet. Retrieved: March 25, 2008.
From: http://www.britannica.com/eb/article-9003762/Admiralty-Inlet
Chalecki, E.L. (2007). He who would rule: Climate change in the Arctic and its
implications for U.S. National Security. Geopolitics, 10.
Communications Branch Indian and Northern Affairs Canada (2002). Words first: An
evolving terminology relating to Aboriginal peoples in Canada. Indian and Northern
Affairs Canada. From:
http://www.collectionscanada.gc.ca/webarchives/20071114213423/http://www.ainc-
inac.gc.ca/pr/pub/wf/index_e.html
Cordalis, D. & Suagee, D.B. (2008). The Effects of Climate Change on American Indian
and Alaska Native Tribes. Natural Resources & Environment, 22, 45-49.
Corell, R.W. (2006). Challenges of Climate Change: An Arctic Perspective. Ambio, 35,
148-152.
Corsiglia, J. & Snively, G. (1997). Knowing home: NisGa‟a Traditional Knowledge and
wisdom improve environmental decision making. Alternatives 23(3), pp. 22-27.
Doka, S., Bouvier, L., Mandrak, N., & Minns, C.K. (2004). Impact and adaptation
strategies of climate change in freshwater coastal wetlands. 4th
World Fisheries
Congress: Reconciling Fisheries with Conservation: The Challenge of Managing Aquatic
Ecosystems, Vancouver, BC, May 2-6.
Doyle-Bedwell, P. & Cohen, F. (2001). Aboriginal people in Canada: Their role in
shaping environmental trends in the twenty first century. In: Parson, E. (ed.). Governing

65
the Environment: Persistent challenges, uncertain innovations. University of Toronto
Press, Toronto, ON. pp. 169-206.
Environment Canada. (1997). Climate Impact and Adaptations: Canadian Arctic
Summary. Ottawa, Ontario.
Etkin, D.A. (1991). Break-up in Hudson Bay: Its sensitivity to air temperatures and
implications for climate warming. Climatological Bulletin, 25, pp. 21-34.
Ford, J.D. (2005). Living with climate change in the Arctic. World Watch,
September/October.
Ford, J.D., Gough, W.A., Laidler, G.J., Macdonald, J., Irngaut, C. & Qrunnut, K. (2009).
Sea ice, climate change, and community vulnerability in northern Foxe Basin, Canada.
Climate Research, 38, pp. 137-154.
Ford, J.D. & Smit, B. (2004). A framework for assessing the vulnerability of
communities in the Canadian Arctic to risks associated with climate change. Arctic, 57,
389-400.
Ford, J.D., Smit, B. & Wandel, J. (2006). Vulnerability to climate change in the Arctic: A
case study from Arctic Bay, Canada. Global Environmental Change, 16, pp. 145-160.
Freeman, M.M.R. (1984). Contemporary Inuit exploitation of the sea-ice environment.
In: Cooke, A., & E. van Alstine (eds.). Proceedings of a conference on Sikumiut: „the
people who use the sea ice‟. Ottawa: Canadian Arctic Resources Committee: pp. 73-96.
Gearheard, S. (2008). A change in the weather: for generations Inuit have survived by
closely observing the natural world. As the Arctic environment changes, their insights are
informing science. Natural History, 117, 32-37.
Gagnon, A., & Gough, W. (2005). Trends in the dates of ice freeze-up and breakup over
Hudson Bay, Canada. Arctic, 58, 370-382.
Gombay, N. (2007). From subsistence to commercial fishing in Northern Canada – The
experience of an Inuk entrepreneur. British Food Journal, 108, 502-521.
Gough, W.A., Cornwell, A.R. and Tsuji, L.S.J. (2004). Trends in seasonal sea ice
duration in southwestern Hudson Bay. Arctic, 57(3), pp. 299-305.
Gough, W.A., Gagnon, A., & Lau, H. (2004). Interannual variability of Hudson Bay ice
thickness. Polar Geography, 28, 222-238.
Graversen, R.G. & Wang, M.H. (2009). Polar amplification in a coupled climate model
with locked albedo. Climate Dynamics, 33(5), pp. 629-643.

66
Houde, N. (2007). The six faces of Traditional Ecological Knowledge: Challenges and
opportunities for Canadian co-management arrangements. Ecology and Society 12(2).
Houser, C., & Gough, W. (2003). Variations in sea ice in the Hudson Strait: 1971-1999.
Polar Geography, 27, 1-14.
Huntington H.P. & the communities of Buckland, Elim, Koyuk, Point Lay and Shatoolik
(1999). Traditional knowledge of the ecology of beluga whales (Delphinapterus leucas)
in the eastern Chukchi and northern Bering Seas, Alaska. Arctic, 52, pp. 49-61.
Intergovernmental Panel on Climate Change (IPCC) (2001).Climate Change 2001:
Synthesis Report: A contribution of Working Groups I, II, and III to the Third
Assessment Report of the Intergovernmental Panel on Climate Change.
Karnani, M. & Annila, A. (2009). Gaia again. Bio Systems, 95(1), pp. 82-87.
Kaufman, D.S., Schneider, D.P., Mckay, N.P., Ammann, C.M., Bradley, R.S., Briffa,
K.R., Miller, G.H., Otto-Bliesner, B.L., Overpeck, J.T. & Vinther, B.M. (2009). Recent
warming reverses long- term Arctic cooling. Science, 325(5945), pp. 1236-1239.
Kemp, W.B. (1976). Inuit land use in south and east Baffin Island. In: Freeman, M.M.R.
(editor). Inuit land use and occupancy project, (Vol 1). Ottawa: Department of Indian and
Northern Affairs: pp. 125-151.
Kimmerer, R. (2002). Weaving Traditional Ecological Knowledge into biological
education: A call to action. BioScience 52(5), pp. 432-438.
Krupnik, I. (2002). Watching ice and weather our way: some lessons from Yupik
observations of sea ice and weather on St. Lawrence Island, Alaska. In: Krupnik, I. & D.
Jolly (eds.). The Earth is faster now: indigenous observations of Arctic environmental
change. Fairbanks: Arctic Research Consortium of the Unite States in cooperation with
the Arctic Studies Center, Smithsonian Institution: 156-197.
Laidler, G.J. (2006). Inuit and scientific perspectives on the relationship between sea ice
and climate change: the ideal compliment? Climate Change, 78, pp. 407-444.
Laidler, G.J. & Elee, P. (2008). Human geographies of sea ice: freeze/thaw processes
around Cape Dorset, Nunavut, Canada. Polar Record, 44(228), pp. 51-76.
Laidler, G.J., Ford, J., Gough, W.A., Ikummaq, T., Gagnon, A.S., Kowal, S., Qrunnut,
K., and Irngaut C. (2007). Travelling and hunting in a changing Arctic: Assessing Inuit
vulnerability to sea ice change in Igloolik, Nunavut. Climate Change, 94(3-4), pp. 363-
397.
Laidler, G.J., & Gough, W. (2003). Climate variability and climate change: Potential
implications for Hudson Bay coastal communities. Polar Geography, 27, 38-58.

67
Laidre, K.L. & Heide-Jorgenson, M.P. (2005). Arctic sea ice trends and narwhal
vulnerability. Biological Conservation, 121, 509-517.
Lubin, D. & Vogelmann, A.M. (2006). A climatologically significant aerosol longwave
indirect effect in the Arctic. Nature, 439, 453-456.
Mander, J. (1991). In the absence of the sacred. San Francisco: Sierra Club.
Mathez, E.A. (2009). Climate change the science of global warming and our energy
future. Columbia University Press, 2009.
McGregor, D. (2004). Coming full circle: Indigenous knowledge, environment and our
future. American Indian Quarterly, 28, pp. 385-410.
McGuire, A.D., Chapin III, F.S., Walsh, J.E., & Wirth, C. (2006). Integrated regional
changes in Arctic climate feedbacks: Implications for the global climate system. Annu.
Rev. Environ. Resour., 31, 61-91.
Nakashima, D.J. (1993). Astute observers on the sea ice edge: Inuit knowledge as a basis
for arctic comanagement. Pp. 99-110 in Inglis J.T., ed. Traditional Ecological
Knowledge: Concepts and cases. Ottawa: Canadian Museum of Nature and International
Development Research Centre.
Nelson, R.K. (1969). Hunters of the northern ice. Chicago: The University of Chicago
Press.
Nielson, P.N. & Ditlevsen, P. (2009). On the homeostasis and bistability on a Gaian
planet. Planetary and Space Science, 57, pp. 491-497.
O‟Neill, S.J., Osborn, T.J., Hulme, M., Lorenzoni, I., & Watkinson, A.R. (2008). Using
expert knowledge to assess uncertainties in future polar bear populations under climate
change. Journal of Applied Ecology, 45, 1649-1659.
Pidwirny, M. (2006). Air masses and frontal transitional zones. Fundamentals of
Physical Geography, 2nd
Edition. Retrieved: August 28, 2009.
From: http://www.physicalgeography.net/fundamentals/7r.html
Richards, R.T. (1997). What the natives know: Wild mushrooms and forest health.
Journal of Forestry (September), pp. 5-10.
Riewe, R. (1991). Inuit use of the sea ice. Arctic and Alpine Research, 23, pp. 3-10.
Semiletov, I.P., Pipko, I.I., Repina, I., & Shakhova, N.E. (2007). Carbonate chemistry
dynamics and carbon dioxide fluxes across the atmosphere-ice-water interfaces in the
Arctic Ocean: Pacific sector of the Arctic. Journal of Marine Systems, 66, 204-226.

68
Serway, R.A. & Jewett, J. (2002). Principles of physics: 3rd edition. United States:
Thompson Learning.
Shackeroff, J. & Campbell, L. (2007). Traditional Ecological Knowledge in conservation
research: Problems and prospects for constructive engagement. Conservation and
Society, 5(3), pp. 343-360.
Smythe-Wright, D., Boswell, S.M., Breithaupt, P., Davidson, R.D., Diaz, L.B.E., &
Dimmer, C.H. (2006). Methyl iodide production in the ocean: Implications for climate
change. Global Biogeochemical Cycles, 20:3.
Spak, s. (2005). The position of Indigenous Knowledge in Canadian co-management
organizations. Anthropologica, 42, pp. 233-246.
Stevenson, R.O. (1982). Nunamiut Eskimos, wildlife biologists, and wolves. Pp. 434-439
in Harrington F.H., Pacquet P.C., eds. Wolves of the world. Park Ridge (NJ): Noyes.
Stirling, I., Derocher, A.E., Gough, W.A. & Rode, K. (2008). Response to Dyck et al.
(2007) on polar bears and climate change in western Hudson Bay. Ecological
Complexity, 5(3), pp. 193-201.
Stirling, I., Lunn, N.J. & Iacozza, J. (1999). Long-term trends in the population ecology
of polar bears in western Hudson Bay in relation to climate change. Arctic, 52(3), 294-
306.
Suluk, T.K. & Blakney, S.L. (2008). Land claims and resistance to the management of
harvester activities in Nunavut. Arctic, 61, pp. 62-70.
The Canadian Encyclopedia (2008). Frobisher Bay. Retrieved: March 25, 2008.
From: http://www.thecanadianencyclopedia.com/index.cfm?PgNm=TCE&Params=
A1ARTA0003080
Thomas, V., Hodes, G., & Williams, A. (2003). A Strategy to Phase-Out Lead in African
Gasoline. Renewable Energy for Development, 16, 1-4.
Turner, N., Ignace, M.B. & Ignace, R. (2000). Traditional ecological knowledge and
wisdom of aboriginal peoples in British Columbia. Ecological Applications, 10, pp.
1275-1287.
Wilby, R.L. & Dawson, C.W. (2007). SDSM 4.2 – A decision support tool for the
assessment or regional climate change impacts. Department of Geography, Lancaster
University, UK. From: http://www.sdsm.org.uk/
Zlatev, Z. & Moseholm, L. (2009). Impact of climate changes on pollution levels in
Denmark. Ecological Modeling, 217, 305-319.