an analysis of industrial infill development
TRANSCRIPT
An Analysis of Industrial Infill
Development
Marty Busekrus, HFF
Ed Harrington, CenterPoint Properties
Cathy Thuringer, Trammell Crow
Marty Busekrus
• Director with HFF focusing on the industrial
capital markets throughout the Southeastern
U.S.
• Responsible for sourcing industrial opportunities
by partnering owners with potential capital
sources for joint ventures, debt solutions and/or
buyers.
• Prior to joining HFF, Busekrus was a senior
associate in CBRE’s Private Capital Group and
focused on the dispositions of office and
industrial projects throughout Southeast Florida.
HFF

Give Us Your Feedback for this Session!
• Session evaluations are available on your chair. Please take a moment at the end of this session to provide your feedback on the content and speakers.
• Evaluations can be handed in to a NAIOP staff member at the back of the room.
Thank you!

An Analysis of Industrial Infill
Development
Marty Busekrus, HFF
Ed Harrington, CenterPoint Properties
Cathy Thuringer, Trammell Crow
Ed Harrington
• Joined CenterPoint Properties Trust in 1999 and currently oversees the development of logistically located facilities and industrial parks for CenterPoint Properties.
• Has overseen the development of new industrial business parks and manufacturing and distribution facilities. He has spent more than 18 years developing industrial commercial real estate.
• In addition, he worked for several years as a civil engineer with local Chicago engineering firms.
CenterPoint Properties

Cathy Thuringer
Trammell Crow
• Principal with Trammell Crow Company
• Has comprehensive management responsibility for development projects, commencing with initial site acquisition through ultimate project disposition.
• Oversees all aspects of industrial developments primarily in central and southern Arizona.
• Project profiles range from multi-phased business park infrastructure to single and multi-story speculative and build-to-suit office and industrial facilities.
DEFINING INFILL INDUSTRIAL
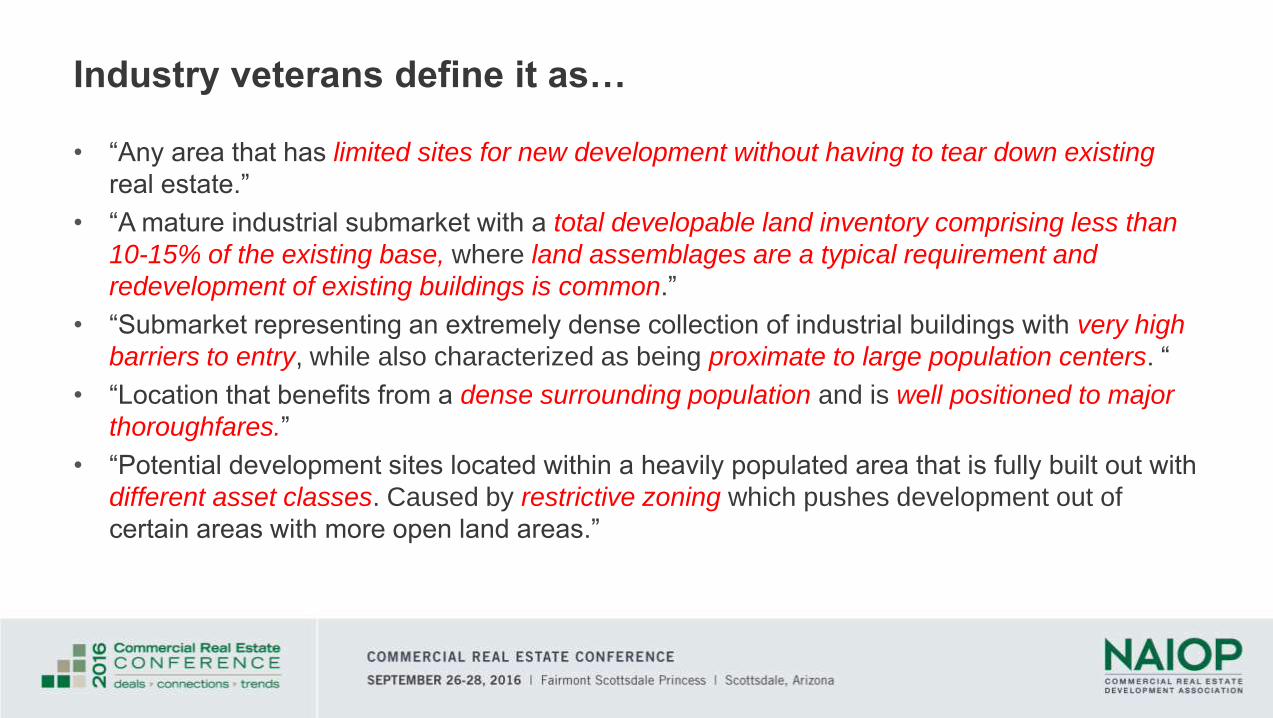
Industry veterans define it as…
• “Any area that has limited sites for new development without having to tear down existing
real estate.”
• “A mature industrial submarket with a total developable land inventory comprising less than
10-15% of the existing base, where land assemblages are a typical requirement and
redevelopment of existing buildings is common.”
• “Submarket representing an extremely dense collection of industrial buildings with very high
barriers to entry, while also characterized as being proximate to large population centers. “
• “Location that benefits from a dense surrounding population and is well positioned to major
thoroughfares.”
• “Potential development sites located within a heavily populated area that is fully built out with
different asset classes. Caused by restrictive zoning which pushes development out of
certain areas with more open land areas.”
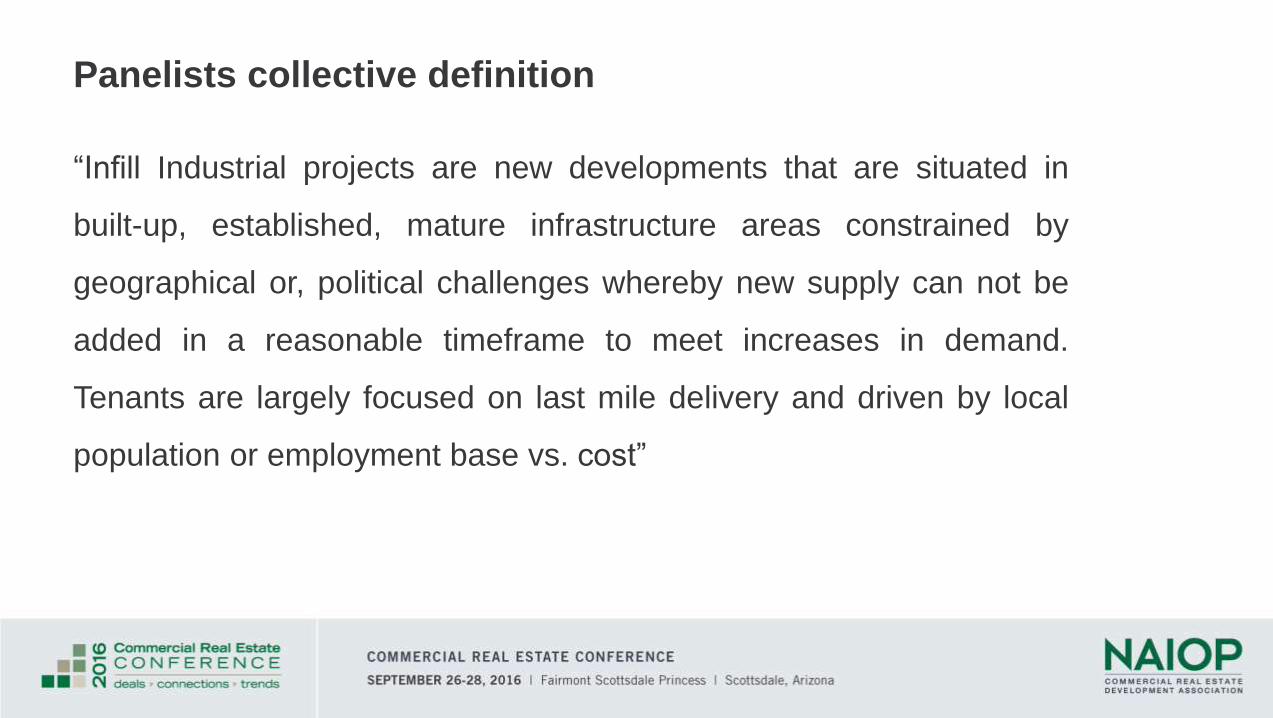
Panelists collective definition
“Infill Industrial projects are new developments that are situated in
built-up, established, mature infrastructure areas constrained by
geographical or, political challenges whereby new supply can not be
added in a reasonable timeframe to meet increases in demand.
Tenants are largely focused on last mile delivery and driven by local
population or employment base vs. cost”
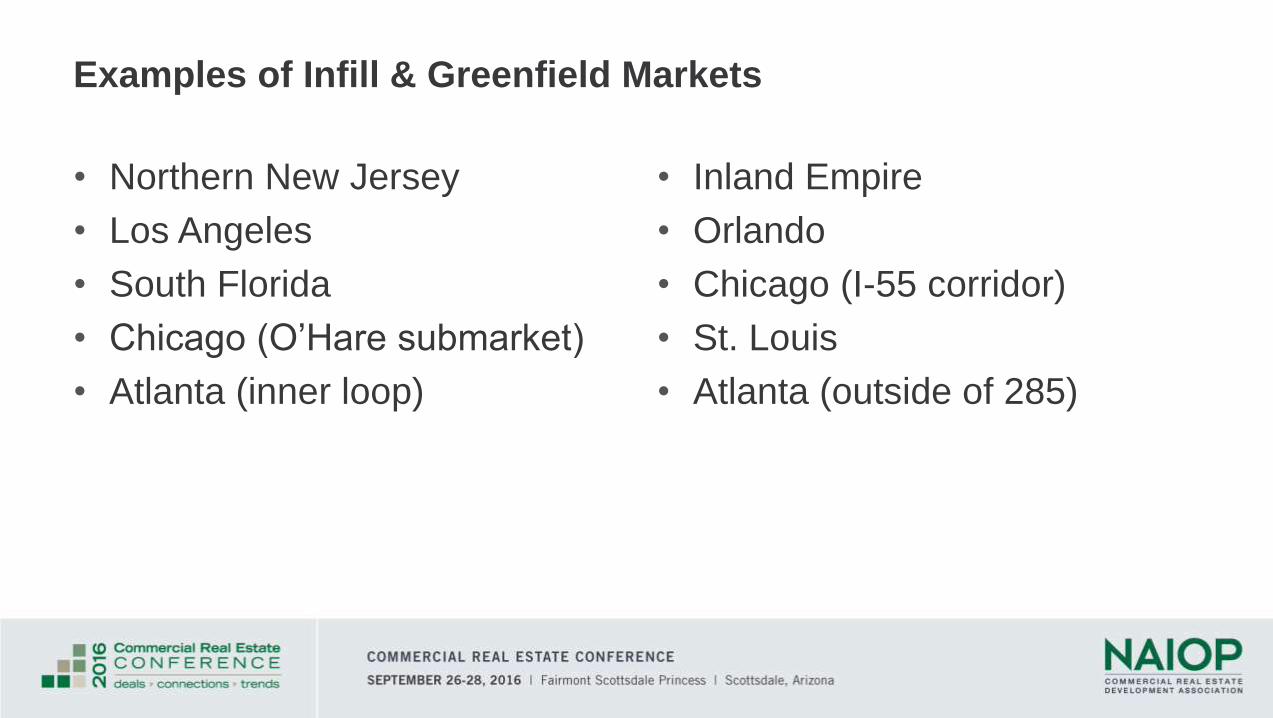
Examples of Infill & Greenfield Markets
• Northern New Jersey
• Los Angeles
• South Florida
• Chicago (O’Hare submarket)
• Atlanta (inner loop)
• Inland Empire
• Orlando
• Chicago (I-55 corridor)
• St. Louis
• Atlanta (outside of 285)
WHO ARE THE TENANTS?
• Types of users for infill space
• Locational drivers for infill tenants
• Buildout requirements for infill versus greenfield
MAXIMIZING COVERAGE
• Difference in FAR between infill and greenfield
• Considerations and challenges for maximizing coverage
• Potential for two-story industrial

CAPITAL MARKETS VIEW
• Differences in underwriting approach for infill versus greenfield• Rental rates / rental rate growth
• Downtime assumptions
• Cap rates / overall returns
• Portfolio diversification as it relates to:• Occupancy
• Rental rates
• Liquidity
• Competition
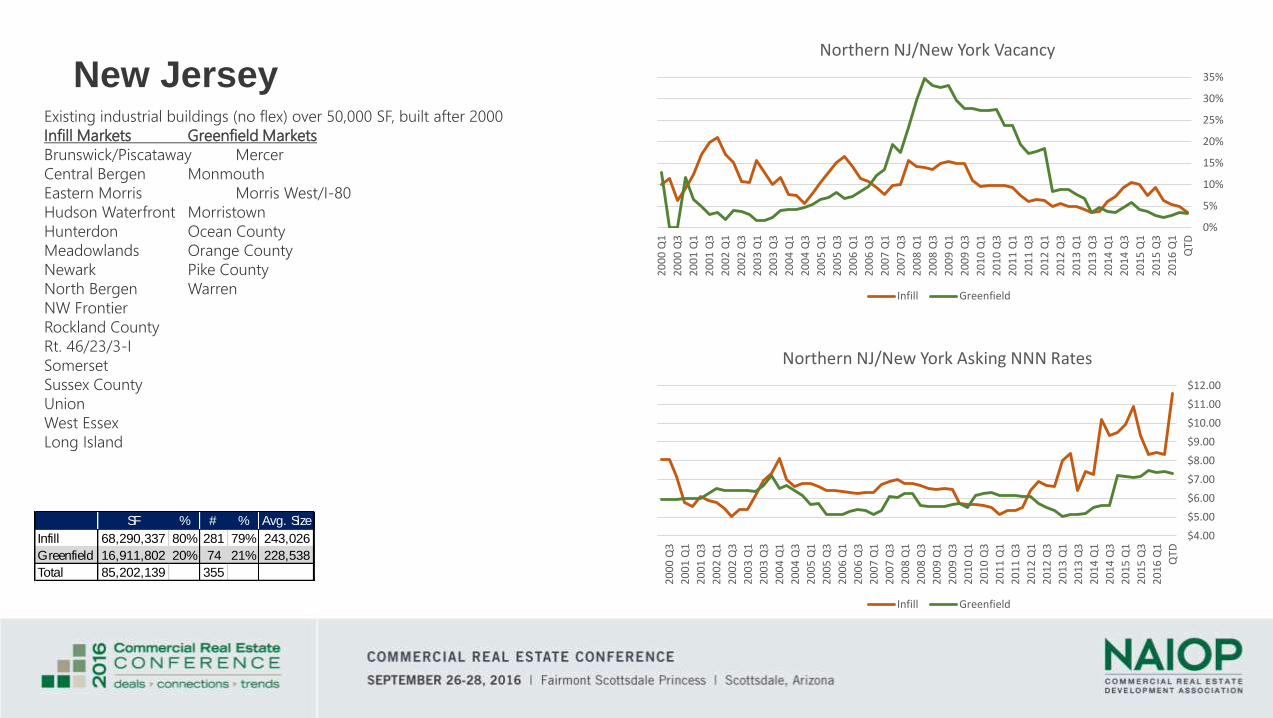
New Jersey
SF % # % Avg. Size
Infill 68,290,337 80% 281 79% 243,026
Greenfield 16,911,802 20% 74 21% 228,538
Total 85,202,139 355
Existing industrial buildings (no flex) over 50,000 SF, built after 2000
Infill Markets Greenfield Markets
Brunswick/Piscataway Mercer
Central Bergen Monmouth
Eastern Morris Morris West/I-80
Hudson Waterfront Morristown
Hunterdon Ocean County
Meadowlands Orange County
Newark Pike County
North Bergen Warren
NW Frontier
Rockland County
Rt. 46/23/3-I
Somerset
Sussex County
Union
West Essex
Long Island
0%
5%
10%
15%
20%
25%
30%
35%
QTD
20
16
Q1
20
15
Q3
20
15
Q1
20
14
Q3
20
14
Q1
20
13
Q3
20
13
Q1
20
12
Q3
20
12
Q1
20
11
Q3
20
11
Q1
20
10
Q3
20
10
Q1
20
09
Q3
20
09
Q1
20
08
Q3
20
08
Q1
20
07
Q3
20
07
Q1
20
06
Q3
20
06
Q1
20
05
Q3
20
05
Q1
20
04
Q3
20
04
Q1
20
03
Q3
20
03
Q1
20
02
Q3
20
02
Q1
20
01
Q3
20
01
Q1
20
00
Q3
20
00
Q1
Northern NJ/New York Vacancy
Infill Greenfield
$4.00
$5.00
$6.00
$7.00
$8.00
$9.00
$10.00
$11.00
$12.00
QTD
20
16
Q1
20
15
Q3
20
15
Q1
20
14
Q3
20
14
Q1
20
13
Q3
20
13
Q1
20
12
Q3
20
12
Q1
20
11
Q3
20
11
Q1
20
10
Q3
20
10
Q1
20
09
Q3
20
09
Q1
20
08
Q3
20
08
Q1
20
07
Q3
20
07
Q1
20
06
Q3
20
06
Q1
20
05
Q3
20
05
Q1
20
04
Q3
20
04
Q1
20
03
Q3
20
03
Q1
20
02
Q3
20
02
Q1
20
01
Q3
20
01
Q1
20
00
Q3
Northern NJ/New York Asking NNN Rates
Infill Greenfield

Chicago
Existing industrial buildings (no flex) over 50,000 SF, built after 2000
Infill Markets Greenfield Markets
North Chicago Indiana
North Cook Lake County
NW Cook Kenosha
O’Hare McHenry
South Chicago North Kane/I-90
Near SW Suburbs South Suburban
North I-55 Joliet
West Cook South I-55
North DuPage Central Kane/DuPage
West Suburbs I-88 West
SF % # % Avg. Size
Infill 40,441,386 21% 236 30% 171,362
Greenfield 150,354,411 79% 556 70% 270,422
Total 190,795,797 792 240,904
0%
5%
10%
15%
20%
25%
30%
QTD
20
16
Q1
20
15
Q3
20
15
Q1
20
14
Q3
20
14
Q1
20
13
Q3
20
13
Q1
20
12
Q3
20
12
Q1
20
11
Q3
20
11
Q1
20
10
Q3
20
10
Q1
20
09
Q3
20
09
Q1
20
08
Q3
20
08
Q1
20
07
Q3
20
07
Q1
20
06
Q3
20
06
Q1
20
05
Q3
20
05
Q1
20
04
Q3
20
04
Q1
20
03
Q3
20
03
Q1
20
02
Q3
20
02
Q1
20
01
Q3
20
01
Q1
20
00
Q3
20
00
Q1
Chicago Vacancy
Infill Greenfield
$3.00
$3.50
$4.00
$4.50
$5.00
$5.50
$6.00
$6.50
$7.00
QTD
20
16
Q1
20
15
Q3
20
15
Q1
20
14
Q3
20
14
Q1
20
13
Q3
20
13
Q1
20
12
Q3
20
12
Q1
20
11
Q3
20
11
Q1
20
10
Q3
20
10
Q1
20
09
Q3
20
09
Q1
20
08
Q3
20
08
Q1
20
07
Q3
20
07
Q1
20
06
Q3
20
06
Q1
20
05
Q3
20
05
Q1
20
04
Q3
20
04
Q1
20
03
Q3
20
03
Q1
20
02
Q3
20
02
Q1
20
01
Q3
20
01
Q1
20
00
Q3
20
00
Q1
Chicago Asking NNN Rates
Infill Greenfield
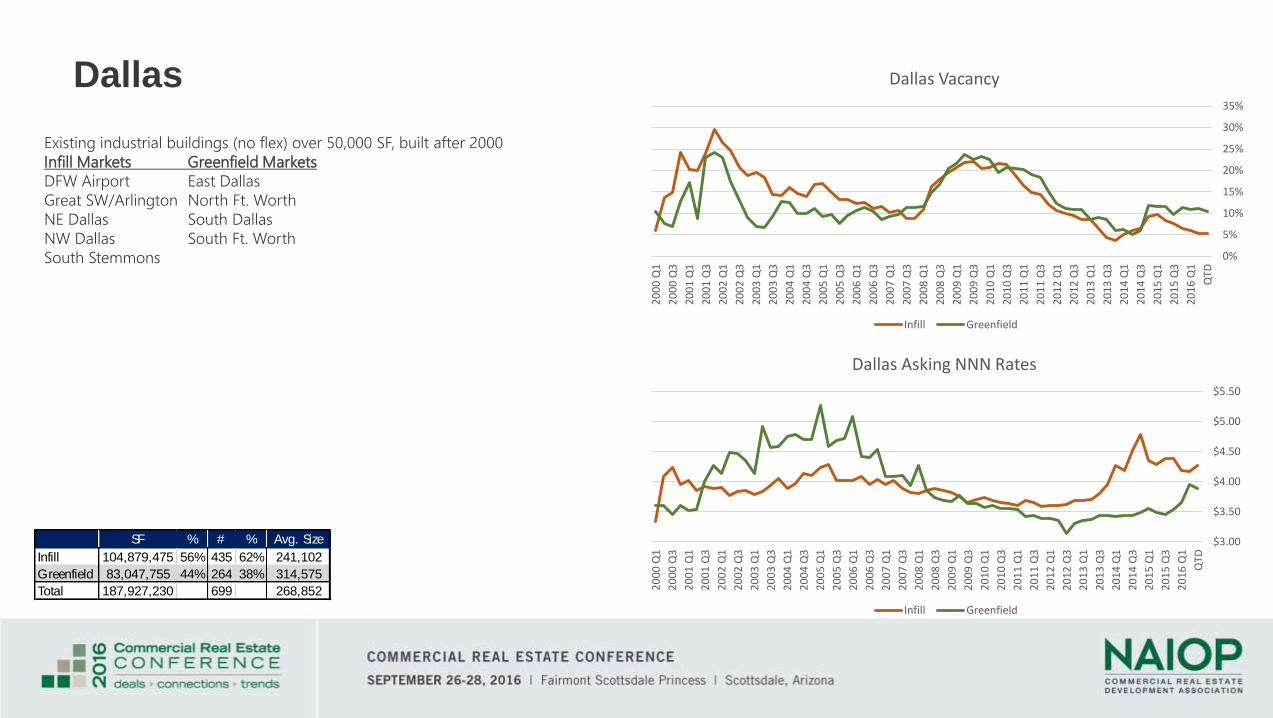
Dallas
SF % # % Avg. Size
Infill 104,879,475 56% 435 62% 241,102
Greenfield 83,047,755 44% 264 38% 314,575
Total 187,927,230 699 268,852
Existing industrial buildings (no flex) over 50,000 SF, built after 2000
Infill Markets Greenfield Markets
DFW Airport East Dallas
Great SW/Arlington North Ft. Worth
NE Dallas South Dallas
NW Dallas South Ft. Worth
South Stemmons 0%
5%
10%
15%
20%
25%
30%
35%
QTD
20
16
Q1
20
15
Q3
20
15
Q1
20
14
Q3
20
14
Q1
20
13
Q3
20
13
Q1
20
12
Q3
20
12
Q1
20
11
Q3
20
11
Q1
20
10
Q3
20
10
Q1
20
09
Q3
20
09
Q1
20
08
Q3
20
08
Q1
20
07
Q3
20
07
Q1
20
06
Q3
20
06
Q1
20
05
Q3
20
05
Q1
20
04
Q3
20
04
Q1
20
03
Q3
20
03
Q1
20
02
Q3
20
02
Q1
20
01
Q3
20
01
Q1
20
00
Q3
20
00
Q1
Dallas Vacancy
Infill Greenfield
$3.00
$3.50
$4.00
$4.50
$5.00
$5.50
QTD
20
16
Q1
20
15
Q3
20
15
Q1
20
14
Q3
20
14
Q1
20
13
Q3
20
13
Q1
20
12
Q3
20
12
Q1
20
11
Q3
20
11
Q1
20
10
Q3
20
10
Q1
20
09
Q3
20
09
Q1
20
08
Q3
20
08
Q1
20
07
Q3
20
07
Q1
20
06
Q3
20
06
Q1
20
05
Q3
20
05
Q1
20
04
Q3
20
04
Q1
20
03
Q3
20
03
Q1
20
02
Q3
20
02
Q1
20
01
Q3
20
01
Q1
20
00
Q3
20
00
Q1
Dallas Asking NNN Rates
Infill Greenfield
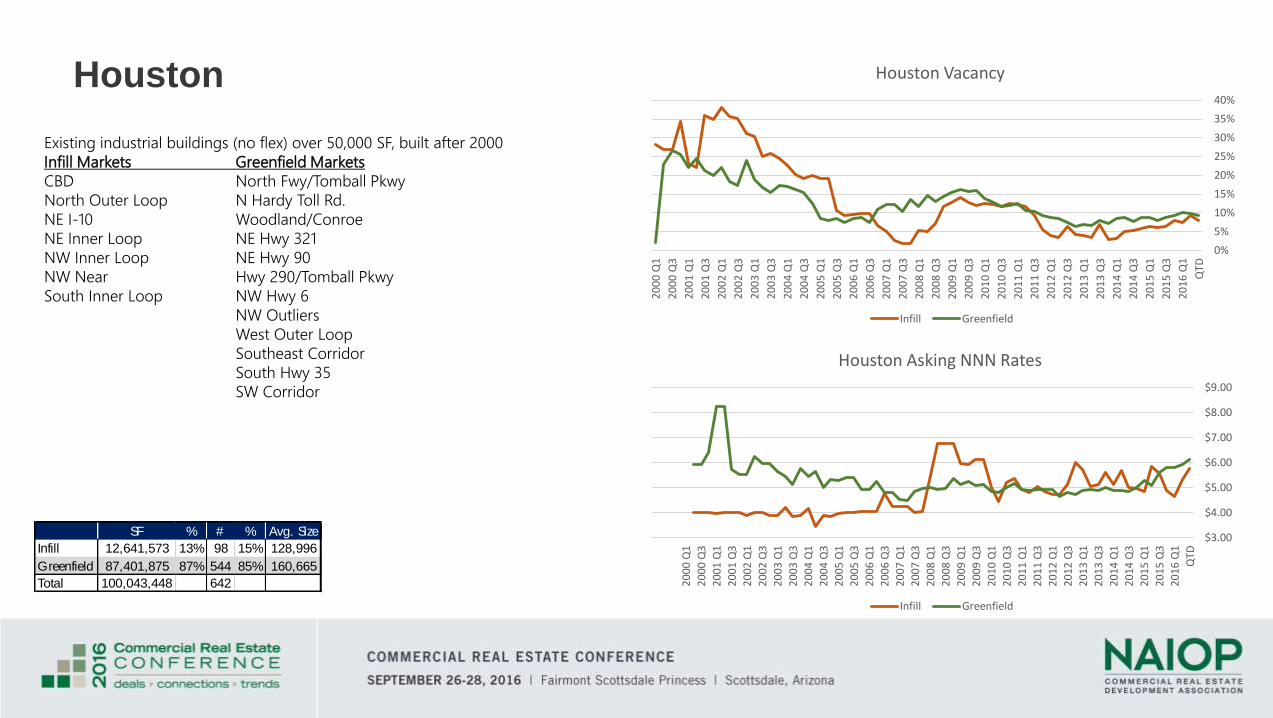
Houston
Existing industrial buildings (no flex) over 50,000 SF, built after 2000
Infill Markets Greenfield Markets
CBD North Fwy/Tomball Pkwy
North Outer Loop N Hardy Toll Rd.
NE I-10 Woodland/Conroe
NE Inner Loop NE Hwy 321
NW Inner Loop NE Hwy 90
NW Near Hwy 290/Tomball Pkwy
South Inner Loop NW Hwy 6
NW Outliers
West Outer Loop
Southeast Corridor
South Hwy 35
SW Corridor
SF % # % Avg. Size
Infill 12,641,573 13% 98 15% 128,996
Greenfield 87,401,875 87% 544 85% 160,665
Total 100,043,448 642
0%
5%
10%
15%
20%
25%
30%
35%
40%
QTD
20
16
Q1
20
15
Q3
20
15
Q1
20
14
Q3
20
14
Q1
20
13
Q3
20
13
Q1
20
12
Q3
20
12
Q1
20
11
Q3
20
11
Q1
20
10
Q3
20
10
Q1
20
09
Q3
20
09
Q1
20
08
Q3
20
08
Q1
20
07
Q3
20
07
Q1
20
06
Q3
20
06
Q1
20
05
Q3
20
05
Q1
20
04
Q3
20
04
Q1
20
03
Q3
20
03
Q1
20
02
Q3
20
02
Q1
20
01
Q3
20
01
Q1
20
00
Q3
20
00
Q1
Houston Vacancy
Infill Greenfield
$3.00
$4.00
$5.00
$6.00
$7.00
$8.00
$9.00
QTD
20
16
Q1
20
15
Q3
20
15
Q1
20
14
Q3
20
14
Q1
20
13
Q3
20
13
Q1
20
12
Q3
20
12
Q1
20
11
Q3
20
11
Q1
20
10
Q3
20
10
Q1
20
09
Q3
20
09
Q1
20
08
Q3
20
08
Q1
20
07
Q3
20
07
Q1
20
06
Q3
20
06
Q1
20
05
Q3
20
05
Q1
20
04
Q3
20
04
Q1
20
03
Q3
20
03
Q1
20
02
Q3
20
02
Q1
20
01
Q3
20
01
Q1
20
00
Q3
20
00
Q1
Houston Asking NNN Rates
Infill Greenfield

Southern CA
Existing industrial buildings (no flex) over 50,000 SF, built after 2000
Infill Markets Greenfield Markets
Carson/Rancho Domingz Antelope Valley
Central LA Conejo Valley
Commerce Area SCV/Lancaster/Palmdale
Eastern SGV Inland Empire East
El Segundo
Gardena/110 Corridor
Long Beach
Lower SGV
Lynwoo/Paramount
Mid-Counties LA
Northwest SGV
SFV East
SFV West
Southwest SGV
Torrance
Upper SGV
Ventura County
Vernon
Inland Empire West
Orange County (all) $3.00$3.50
$4.00
$4.50
$5.00
$5.50
$6.00
$6.50
$7.00
$7.50
$8.00
QTD
20
16
Q1
20
15
Q3
20
15
Q1
20
14
Q3
20
14
Q1
20
13
Q3
20
13
Q1
20
12
Q3
20
12
Q1
20
11
Q3
20
11
Q1
20
10
Q3
20
10
Q1
20
09
Q3
20
09
Q1
20
08
Q3
20
08
Q1
20
07
Q3
20
07
Q1
20
06
Q3
20
06
Q1
20
05
Q3
20
05
Q1
20
04
Q3
20
04
Q1
20
03
Q3
20
03
Q1
20
02
Q3
20
02
Q1
20
01
Q3
20
01
Q1
20
00
Q3
20
00
Q1
Southern CA Asking NNN Rates
Infill Greenfield
0%
5%
10%
15%
20%
25%
30%
35%
QTD
20
16
Q1
20
15
Q3
20
15
Q1
20
14
Q3
20
14
Q1
20
13
Q3
20
13
Q1
20
12
Q3
20
12
Q1
20
11
Q3
20
11
Q1
20
10
Q3
20
10
Q1
20
09
Q3
20
09
Q1
20
08
Q3
20
08
Q1
20
07
Q3
20
07
Q1
20
06
Q3
20
06
Q1
20
05
Q3
20
05
Q1
20
04
Q3
20
04
Q1
20
03
Q3
20
03
Q1
20
02
Q3
20
02
Q1
20
01
Q3
20
01
Q1
20
00
Q3
20
00
Q1
Southern CA Vacancy
Infill Greenfield
SF % # % Avg. Size
Infill 184,914,784 56% 959 67% 192,820
Greenfield 143,118,898 44% 466 33% 307,122
Total 328,033,682 1,425 230,199
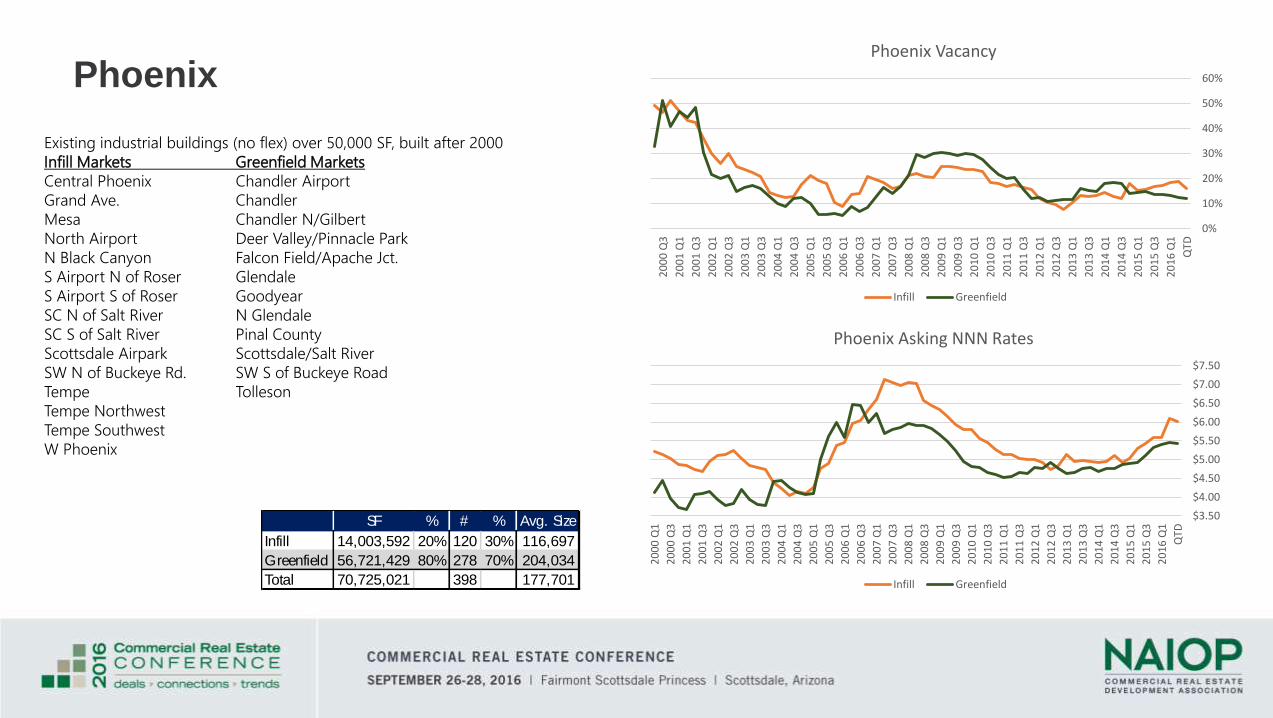
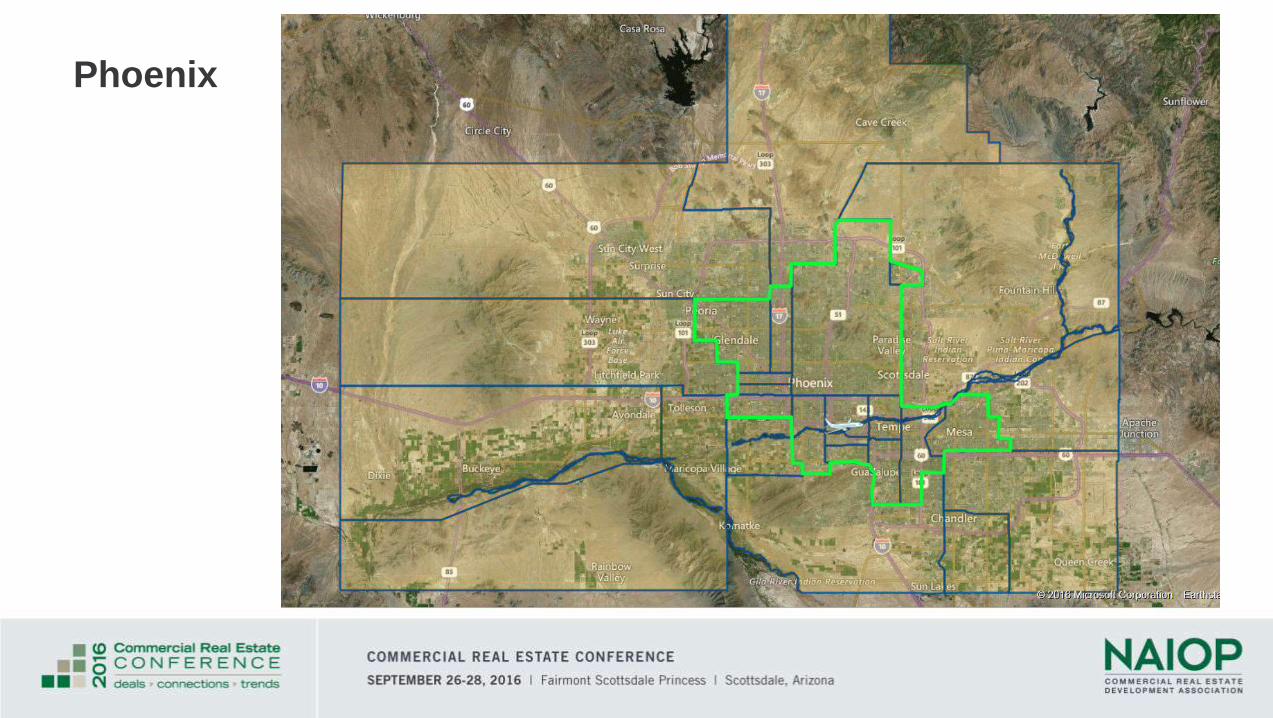
Phoenix
Existing industrial buildings (no flex) over 50,000 SF, built after 2000
Infill Markets Greenfield Markets
Central Phoenix Chandler Airport
Grand Ave. Chandler
Mesa Chandler N/Gilbert
North Airport Deer Valley/Pinnacle Park
N Black Canyon Falcon Field/Apache Jct.
S Airport N of Roser Glendale
S Airport S of Roser Goodyear
SC N of Salt River N Glendale
SC S of Salt River Pinal County
Scottsdale Airpark Scottsdale/Salt River
SW N of Buckeye Rd. SW S of Buckeye Road
Tempe Tolleson
Tempe Northwest
Tempe Southwest
W Phoenix
SF % # % Avg. Size
Infill 14,003,592 20% 120 30% 116,697
Greenfield 56,721,429 80% 278 70% 204,034
Total 70,725,021 398 177,701
0%
10%
20%
30%
40%
50%
60%
QTD
20
16
Q1
20
15
Q3
20
15
Q1
20
14
Q3
20
14
Q1
20
13
Q3
20
13
Q1
20
12
Q3
20
12
Q1
20
11
Q3
20
11
Q1
20
10
Q3
20
10
Q1
20
09
Q3
20
09
Q1
20
08
Q3
20
08
Q1
20
07
Q3
20
07
Q1
20
06
Q3
20
06
Q1
20
05
Q3
20
05
Q1
20
04
Q3
20
04
Q1
20
03
Q3
20
03
Q1
20
02
Q3
20
02
Q1
20
01
Q3
20
01
Q1
20
00
Q3
Phoenix Vacancy
Infill Greenfield
$3.50
$4.00
$4.50
$5.00
$5.50
$6.00
$6.50
$7.00
$7.50
QTD
20
16
Q1
20
15
Q3
20
15
Q1
20
14
Q3
20
14
Q1
20
13
Q3
20
13
Q1
20
12
Q3
20
12
Q1
20
11
Q3
20
11
Q1
20
10
Q3
20
10
Q1
20
09
Q3
20
09
Q1
20
08
Q3
20
08
Q1
20
07
Q3
20
07
Q1
20
06
Q3
20
06
Q1
20
05
Q3
20
05
Q1
20
04
Q3
20
04
Q1
20
03
Q3
20
03
Q1
20
02
Q3
20
02
Q1
20
01
Q3
20
01
Q1
20
00
Q3
20
00
Q1
Phoenix Asking NNN Rates
Infill Greenfield
Phoenix
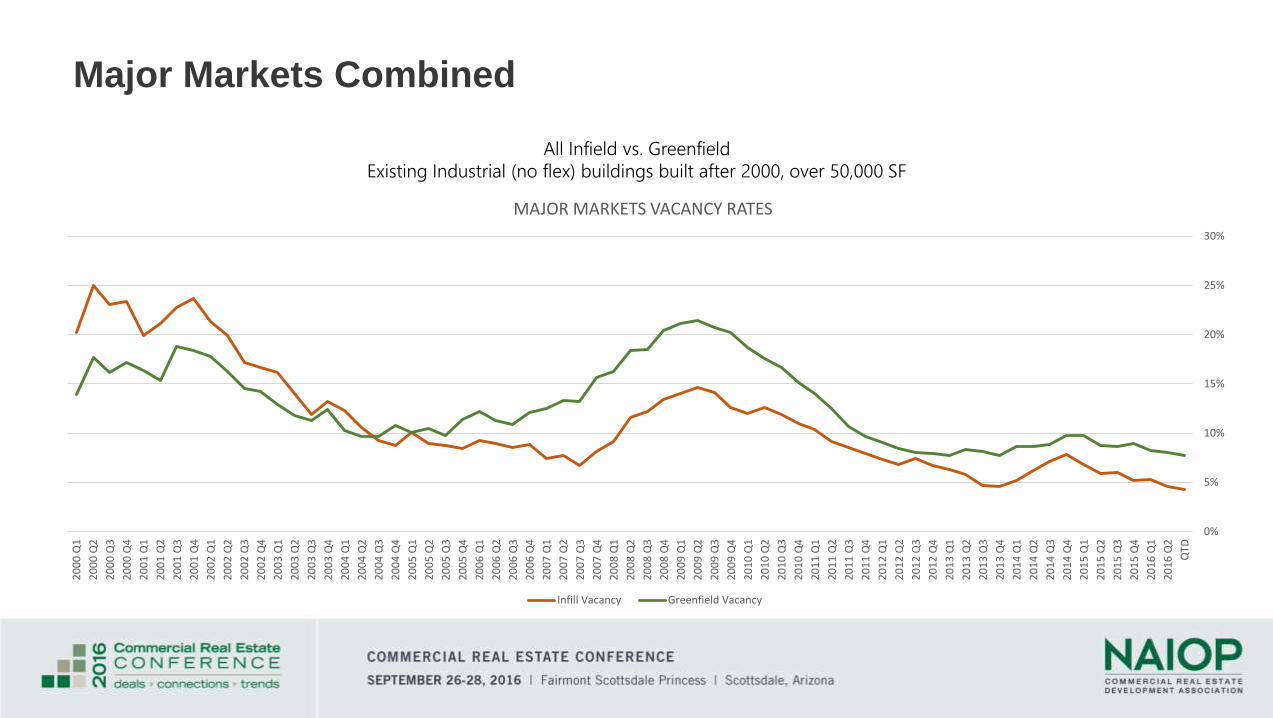
Major Markets Combined
All Infield vs. Greenfield
Existing Industrial (no flex) buildings built after 2000, over 50,000 SF
0%
5%
10%
15%
20%
25%
30%
QTD
20
16
Q2
20
16
Q1
20
15
Q4
20
15
Q3
20
15
Q2
20
15
Q1
20
14
Q4
20
14
Q3
20
14
Q2
20
14
Q1
20
13
Q4
20
13
Q3
20
13
Q2
20
13
Q1
20
12
Q4
20
12
Q3
20
12
Q2
20
12
Q1
20
11
Q4
20
11
Q3
20
11
Q2
20
11
Q1
20
10
Q4
20
10
Q3
20
10
Q2
20
10
Q1
20
09
Q4
20
09
Q3
20
09
Q2
20
09
Q1
20
08
Q4
20
08
Q3
20
08
Q2
20
08
Q1
20
07
Q4
20
07
Q3
20
07
Q2
20
07
Q1
20
06
Q4
20
06
Q3
20
06
Q2
20
06
Q1
20
05
Q4
20
05
Q3
20
05
Q2
20
05
Q1
20
04
Q4
20
04
Q3
20
04
Q2
20
04
Q1
20
03
Q4
20
03
Q3
20
03
Q2
20
03
Q1
20
02
Q4
20
02
Q3
20
02
Q2
20
02
Q1
20
01
Q4
20
01
Q3
20
01
Q2
20
01
Q1
20
00
Q4
20
00
Q3
20
00
Q2
20
00
Q1
MAJOR MARKETS VACANCY RATES
Infill Vacancy Greenfield Vacancy
QUESTIONS?
Give Us Your Feedback for this Session!
• Session evaluations are available on your chair. Please take a moment at the end of this session to provide your feedback on the content and speakers.
• Evaluations can be handed in to a NAIOP staff member at the back of the room.
Thank you!