an analysis of fixed water sprinkler systems on ro-ro decks...an example incident with catastrophic...
TRANSCRIPT
An analysis of fixed water
sprinkler systems on ro-ro
decks
Rasmus Frid and David Palm
Department of Fire Safety Engineering and Systems Safety Lund University, Sweden Brandteknik och Riskhantering Lunds tekniska högskola Lunds universitet Report 5326, Lund 2010
The report has been financed by SP Technical Research Institute of Sweden

An analysis of fixed water
sprinkler systems on ro-ro
decks
Rasmus Frid and David Palm
Lund 2010
Title An analysis of fixed water sprinkler systems on ro-ro decks
Authors Rasmus Frid and David Palm
Report: 5326
ISSN: 1402-3504
ISRN: LUTVDG/TVBB--5326 --SE
Number of pages: 62
Keywords Sprinkler, wet pipe, dry pipe, deluge, Resolution A.123(V), ro-ro, car fire, HGV fire, cost benefit
analysis, FSA, Formal safety assessment.
Sökord Sprinkler, torrör, våtrör, deluge, Resolution A 123(V), ro-ro, bilbrand, lastbilsbrand, kostnad-nytta
analys, FSA Abstract This report is a cost benefit analysis of a proposal for new sprinkler installation guidelines for ro-ro
deck. It is a relative comparison between the present guidelines and a new proposal developed by SP
Technical Research Institute of Sweden. The results and conclusions in this report are based on; data
gathered from multiple water sprinkler tests, other relevant literature, experts’ judgment and computer
simulations. The conclusions based on the results are that it would most likely be profitable for the
shipping companies if the proposal is adopted. Capital would be saved due to a lowered frequency of
sever fire incidents and also a decrease of the expected loss of life.
© Copyright: Brandteknik och Riskhantering, Lunds tekniska högskola, Lunds universitet,
Lund 2010.
The authors are responsible for the contents of this report
Department of Fire Safety Engineering
and Systems Safety
Lund University
P.O. Box 118
SE-221 00 Lund
Sweden
Brandteknik och Riskhantering
Lunds tekniska högskola
Lunds universitet
Box 118
221 00 Lund
http://www.brand.lth.se

Summary This report is a cost benefit analysis of sprinkler systems on ro-ro deck. A proposal for new guidelines
has been developed by SP Technical Research Institute of Sweden. They are in this report compared
to the present guidelines in Resolution A.123(V). The goal is to determine if the proposed guidelines
would improve the safety on ro-ro deck if adopted in to the code, Safety Of Life at Sea (SOLAS).
Would the proposed guidelines decrease the numbers of serious fire incidents and reduce the
economical costs and the loss of life on a worldwide basis?
The method that was used is a quantitative method where the reliability and the effectiveness of the
different sprinkler systems are determined based on experiments and statistics. Fire hazards were
defined and the capability of the sprinkler system to control the fire was investigated. The
consequences of a fire on a ro-ro deck were defined as either severe or less severe depending on if
the system was capable of controlling the fire or not. Each of the two outcomes was related to a cost
and a number of lives that were lost. The cost was based on an example ship that was defined based
on the average value of gross tonnage of the world fleet.
The results of the analysis show that, adopting the new proposal would most likely reduce the costs
and the loss of lives caused by fires on ro-ro deck. Of all fires that start on ro-ro deck, the results
indicate that the sprinkler system in the present guidelines is capable of controlling approximately 72
percent. With the new proposed guidelines this percentage will be increased to as much as 93
percent. This percentage is the results for the wet pipe system which seems to be the most effective
and also the least expensive system in the proposal. The net cost for the wet pipe system indicates
that the shipping companies would save approximately 129 000 SEK per ship and year due to lower
installation costs and reduction of costs for damages. This would mean a total saving of 696 MSEK
per year for the whole world fleet. Also the loss of lives would be reduced with 33 lives per year with
the wet pipe system. In the table below, a summary of the calculated savings that adopting the
proposed guidelines would lead to is presented.
Rank Proposed system type
Expected reduction of expenses for the world fleet [Million SEK per year]
Expected reduction of fatalities for the world fleet [Lives per year]
1 Automatic wet pipe 696 33
2 Automatic dry pipe 207 23
3 Manual deluge 148 12
Sammanfattning Denna rapport är en kostnad-nytta analys som behandlar ett nytt förslag för
installationsrekommendationer för vattensprinklersystem på ro-ro däck. Det nya regelverket är
utvecklat av SP Sveriges tekniska forskningsinstitut i Borås. Regelverket jämförs med det gällande
regelverket kallat Resolution A.123(V). Målet är att bestämma om och hur mycket effektivare de nya
rekommendationerna är än de nu gällande. Skulle de nya föreslagna sprinklersystemen minska
antalet allvarliga olyckor och på så sätt minska skadekostnaderna och antal omkomna till följd av
bränder på ro-ro däck?
Metoden som används är en kvantitativ metod där tillförlitlighet och effektivitet tas fram för de olika
sprinklersystemen. Dimensionerande bränder tas fram och en utredning görs för att se hur stor
effekt de olika sprinklersystemen klarar av att kontrollera. Om branden kontrolleras antas
konsekvensen, i form av skador på fartyget och personerna ombord, att vara liten. Om systemet inte
klarar av att kontrollera branden antas konsekvensen istället att vara omfattande vilket innebär stora
skador på fartyget och flertalet omkomna. Skadekostnaderna baserades på ett exempelskepp som är
framtaget för att vara ett medelskepp baserat på statistik från världsflottan av ro-ro-fartyg.
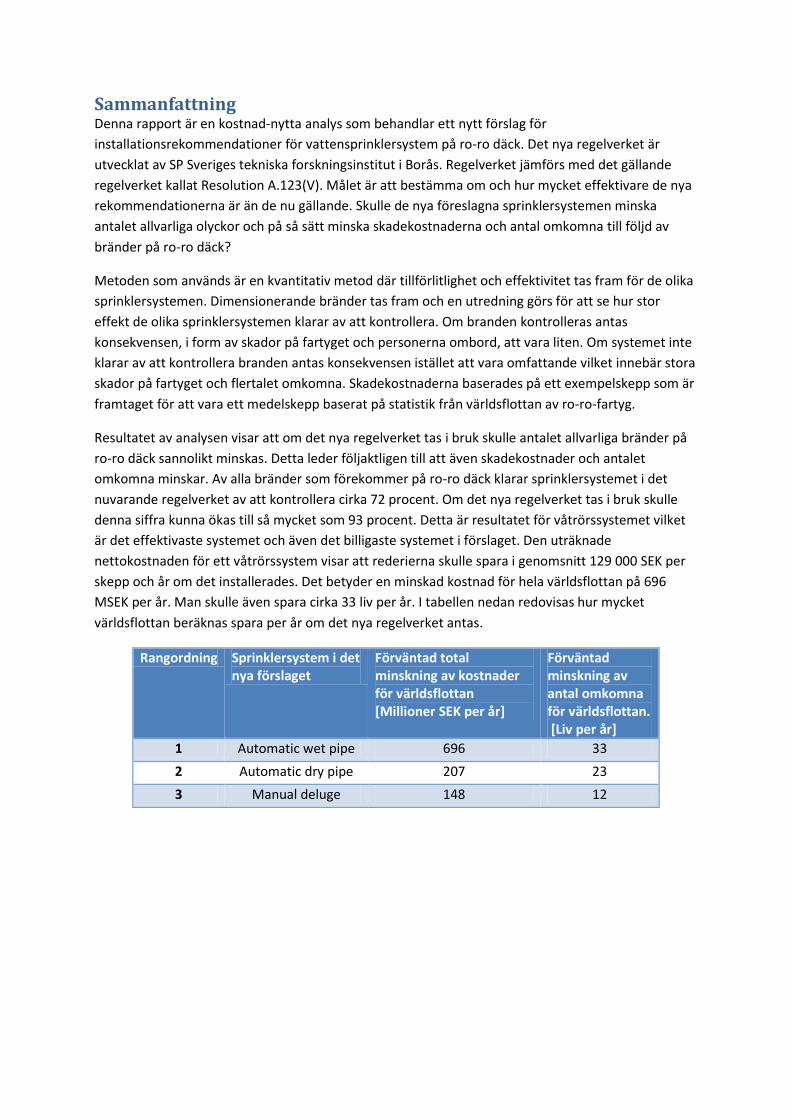
Resultatet av analysen visar att om det nya regelverket tas i bruk skulle antalet allvarliga bränder på
ro-ro däck sannolikt minskas. Detta leder följaktligen till att även skadekostnader och antalet
omkomna minskar. Av alla bränder som förekommer på ro-ro däck klarar sprinklersystemet i det
nuvarande regelverket av att kontrollera cirka 72 procent. Om det nya regelverket tas i bruk skulle
denna siffra kunna ökas till så mycket som 93 procent. Detta är resultatet för våtrörssystemet vilket
är det effektivaste systemet och även det billigaste systemet i förslaget. Den uträknade
nettokostnaden för ett våtrörssystem visar att rederierna skulle spara i genomsnitt 129 000 SEK per
skepp och år om det installerades. Det betyder en minskad kostnad för hela världsflottan på 696
MSEK per år. Man skulle även spara cirka 33 liv per år. I tabellen nedan redovisas hur mycket
världsflottan beräknas spara per år om det nya regelverket antas.
Rangordning Sprinklersystem i det nya förslaget
Förväntad total minskning av kostnader för världsflottan [Millioner SEK per år]
Förväntad minskning av antal omkomna för världsflottan. [Liv per år]
1 Automatic wet pipe 696 33
2 Automatic dry pipe 207 23
3 Manual deluge 148 12

Preface After about 5 months of hard work, this report has finally come to an end. Even though this chapter
is called preface, it is actually the last chapter to be written. We have spent many hours doing
research about various subjects, looking for data, struggling with computers and trying to convince
companies to provide two poor students with information even though it usually costs money.
The work with developing this report has been the first step out to the reality for us as a fire
protection engineer. It has been a very valuable experience and we are certain that it will help us in
our future professional life.
There are many people that have been involved in our work and we would like to thank every one of
you for making this report possible.
We would like to dedicate a special “thank you” to the following people and organizations:
Daniel Nilsson For being our mentor and helping us
through difficult times.
Magnus Arvidsson For being our external mentor and
providing us with valuable information.
Ålands sjösäkerhetscentrum For helping us with information related to
ship safety.
Brandskyddslaget For helping us with information about
sprinkler systems.
LK Marconova AB For helping us with costs related to the
consequences .
Our families and friends For being supportive and helpful during
hard times and setbacks.
/Rasmus Frid and David Palm

Table of contents 1 Introduction ..................................................................................................................................... 1
1.1 Purpose and goal ..................................................................................................................... 2
1.2 Method .................................................................................................................................... 2
1.3 Delimitation and assumptions................................................................................................. 3
2 Definitions ....................................................................................................................................... 5
3 Literature study ............................................................................................................................... 7
4 Problem definition ........................................................................................................................... 9
4.1 Example ship .......................................................................................................................... 10
4.2 Standard ratio between cars, trucks and busses .................................................................. 12
5 Identification of hazards ................................................................................................................ 13
5.1 Hazards identified from creative meetings and real fire events ........................................... 13
5.2 Risk matrix ............................................................................................................................. 14
6 Risk analysis ................................................................................................................................... 21
6.1 Initial event ............................................................................................................................ 22
6.2 Vehicle ratio .......................................................................................................................... 24
6.3 System activation .................................................................................................................. 24
6.4 System performance effectiveness ....................................................................................... 25
6.5 Consequence ......................................................................................................................... 30
7 Risk control options ....................................................................................................................... 36
7.1 Automatic system .................................................................................................................. 37
7.2 Manual system ...................................................................................................................... 44
8 Cost benefit assessment ................................................................................................................ 50
9 Sensitivity and uncertainty analysis .............................................................................................. 52
10 Recommendations for decision-making .................................................................................... 54
11 Discussion .................................................................................................................................. 55
11.1 Method .................................................................................................................................. 55
11.2 Delimitations ......................................................................................................................... 55
11.3 Problem definition ................................................................................................................. 56
11.4 Identification of hazards ........................................................................................................ 57
11.5 Risk analysis and risk control options .................................................................................... 57
11.6 Cost benefit assessment ........................................................................................................ 59
11.7 Sensitivity and uncertainty analysis ...................................................................................... 59
11.8 Recommendation for decision-making ................................................................................. 60
12 Bibilography ............................................................................................................................... 61
Appendix A – General method ................................................................................................................ 1
Appendix B - New proposed installation guidelines ............................................................................... 3
Appendix C – @Risk distributions ......................................................................................................... 10
Appendix D – Incident reports .............................................................................................................. 12
Appendix E – Survey for manual sprinkler activation ........................................................................... 13
Appendix F – Cost estimation for fire incidents .................................................................................... 14
Appendix G – Input for sensitivity and uncertainty analysis ................................................................. 16
Appendix H – Estimation of system costs ............................................................................................. 23
1
1 Introduction A roll-on roll-off or ro-ro ferry is a type of vessel where different types of vehicles can drive onboard.
The way the ship is designed allows for cars, trucks and even trains to board the ship in one end and
leave at the other end. This makes this type of ship ideal for transporting different kinds of cargo in a
very effective way. The time consuming process of loading and unloading the cargo with cranes is not
necessary.
The way the ship is designed can potentially cause problems in terms of safety. The problem is that
the design creates very large areas without separations. This allows for water to enter a whole deck
and jeopardize the stability of the ship. It also allows fire to spread over large areas and can be more
difficult to control. The ceiling level is in general low which creates conditions for a rapid fire growth.
A traditional ship is divided into smaller sections with bulkheads that prevent fire from spreading.
The ro-ro ship may not have any kind of separation to prevent a whole level from filling up with
water or for a fire to spread throughout a large area.
An example incident with catastrophic consequences is when the ro-pax ship (the term ro-pax is
described in Chapter 2 Definitions, along with other terms used in this report), Al Salam Boccaccio 98
sank in 2006 and 1031 lives were lost. A fire broke out on a ro-ro deck, when staff had fought the fire
for four hours, the water from the fire extinguishing system caused a list. Since the scuppers were
blocked by cargo the water accumulated on the ro-ro deck and the disaster was a fact. (IMO, 2009)
Another example of an accident is the fire at Silver Ray in 2002 that lead to a total loss of the ship
and the 2900 cars carried on board (International Cargo Vessels, 2007). No lives were lost in the fire.
In the 1960’s the fire safety matter onboard ro-ro ships was first considered by the International
Maritime Organization (IMO). An amendment was adopted in 1967 to the 1960 Safety of Life At Sea
which included guidelines, referred to as Resolution A.123(V) (IMO, 1967), on fixed fire extinguishing
systems on ro-ro decks. This resolution describes the installation guidelines and the functionality,
such as dimensions and minimum flow rates etc, of a fire extinguishing system installed on ro-ro
decks.
Over the years, the cargo and the vehicles that are transported on ro-ro ships have changed. The
research in the field of fire science have come a far way over the last 50 years and therefore the
recommendations in the resolution from 1967 might be out of date . These changes require that the
installation guidelines for fixed fire extinguishing systems are evaluated in order to ensure an
acceptable level of safety. Currently, large-scale experiments are being performed by SP Technical
Research Institute of Sweden in order to improve the guidelines for installation of fixed fire
extinguishing systems on ro-ro decks. The goals of these experiments are to increase the level of
safety and to introduce a more cost effective fire extinguishing system for the shipping industry. New
installation guidelines have been developed and are to be submitted to IMO in the first quarter of
2010 for evaluation. IMO will then decide if they will be adopted or not.

2
1.1 Purpose and goal The purpose of this report is to develop a cost benefit analysis for sprinkler installations guidelines on
ro-ro decks. Due to the increased fire load on ro-ro deck, a proposal for new sprinkler installation
guidelines has been developed by the SP Technical Research Institute of Sweden. The goal is to
investigate and determine if it is cost effective to adopt the proposed installation guidelines
compared to the present guidelines.
1.2 Method This section describes the method that will be used when developing this report. For a general
academic method description for writing a scientific report, refer to Appendix A. First a literature
study will be done to gather knowledge and data on the subject in hand. After the literature study
the method follows the specific method required by IMO for creating a Formal Safety Assessment
(FSA) (IMO, 2002). This means that an approach including six steps will be used to reach the goal for
this report.
1. Problem definition 2. Identification of hazards 3. Risk analysis 4. Risk control options 5. Cost benefit assessment 6. Recommendations for decision-making
In addition to these six steps a sensitivity and uncertainty analysis will be performed were relevant
input is changed to find out how reliable the results from the cost benefit analysis are. Furthermore
big parts of the contents in this report are discussed in a separate chapter. A more specific
description of how the six steps required by IMO are going to be fulfilled is given in the following six
paragraphs.
1.2.1 Problem definition
The problem definition consists of multiple steps. In order to fit this project within the given time
frame some simplifications will be done to this part. The first step is to define the ship category that
will be evaluated. The type of ship that is affected by the present guidelines are ro-ro and ro-pax ship
which both carries vehicles however, ro-pax also carries large numbers of passengers. The ships will
be represented by a single example ship that will be described in detail and the layout of the ship will
be based on an existing ship. The example ship will represent a generic model and the different
sprinkler systems will be evaluated based on this ship. To identify the conditions onboard, a standard
ratio between cars, heavy goods vehicles and busses will be defined based on statistics. The effects
of using only one type of ship, as there are many different types and sizes of ro-ro and ro-pax ships,
will be discussed in a separate chapter.
1.2.2 Identification of hazards
The identification of hazards will be performed by using accident statistics from various sources and a creative meeting with experts. The experts will be a group that is associated with SP and members of the “Improved water-based fire suppression and drainage systems for ro-ro vehicle decks” (IMPRO) project group. The IMPRO group consists of people with a range of different
professions related to the shipping industry and is involved in the process of developing the
proposed guidelines. The meeting will be held as a group discussion where risk related issues are to
3
be discussed. The goal of the meeting is to identify potential risk sources that have not yet caused
any fires and to get general input to the coming process of creating the report. After the meeting a
rough estimation of the risk sources will be performed and presented in a risk matrix.
1.2.3 Risk analysis
The risk analysis will be an identification and quantification of the effectiveness of the present
guidelines. This will be done by looking at experiments and statistical data and then quantify the
system in an event tree where probabilities for multiple outcomes are calculated. Consequences for
the outcomes are defined and quantified in terms of loss of life and economical costs. In order to
take uncertainties in to account, some parts will be calculated with @Risk. For a description of the
software refer to Chapter 6.4 System performance effectiveness.
1.2.4 Risk control options
The work of developing the risk control options is partially already done by SP in the proposed new
installation guidelines. The work to be done by the authors of this report in this chapter will be to
divide the proposed changes into two groups, automatic system and deluge system. The two groups
will be evaluated and compared separately to the system described in the present guidelines. A
similar event tree as in the risk analysis will be developed for the proposed guidelines.
1.2.5 Cost benefit assessment
A cost benefit assessment will be performed in order to determine if the proposed guidelines are
cost effective. The cost of the sprinkler system and the cost of lost property and life will be compared
for the present and proposed guidelines. The costs will not be specified for a specific organization or
government.
1.2.6 Recommendations for decision-making
In this chapter recommendations to the group of people that make the decision are to be presented.
The recommendations should be based on the conclusions drawn in the cost benefit analysis. The
recommendations for decision-making will be written in such a manner that a reader with limited
experience in risk management will be able to understand it.
1.3 Delimitation and assumptions The field of automatic sprinkler systems and deluge systems is very extensive. To determine
reliability and efficiency of a specific system would probably take years of research and
experimenting. One could probably never give a precise number on the efficiency of a system.
Delimitations need to be done in order to limit the project and be able to finish within the given time
frame. The question formulation needs to be narrowed down to a level where there is enough time
for the authors to come up with reliable results for the matters that are to be researched.
The main objective of this part of the IMPRO project is to evaluate the difference between the
present installation guidelines with the new proposal from a cost effective perspective. The
comparison will be relative, which means that factors that affect both guidelines equally will be
ignored and not accounted for.
The delimitations and assumptions that are done are:
Environmental impact will not be evaluated as an effect of a fire on ro-ro deck.
4
Only the fire sprinkler systems in the guidelines will be evaluated. Manual fire fighting
attempts by the onboard staff using portable firefighting equipment will not be taken into
account. However the activation of the deluge system is done by the staff and will be
included.
All the sprinkler systems in the proposed guidelines are assumed to be able to control the
same maximum heat release rate.
The results will be based on statistics and experimental results done by others. No additional
experiments are to be performed by the authors.
Non-reported fire incidents will not be taken in to account in this report.
No other types of ships than ships with ro-ro decks will be evaluated.
Fires where large amounts of liquid fuels, such as a leaking fuel truck, are involved will not be
evaluated. However, fuel carried in the internal fuel tank of each vehicle will be considered in
the analysis.
Only sprinkler systems included in the proposed guidelines are considered. These systems
are regular water sprinkler systems. No water mist systems, gas systems or other systems are
evaluated.

5
2 Definitions There are words, terms and acronyms that are important for the reader to understand the meaning
of. The following definitions are used in this report.
Deluge
In a deluge sprinkler system there is no heat sensing element like bulbs attached to the nozzels. The
sprinkler orifices are open and the pipes are at atmospheric pressure filled with air. The system is
activated by opening the deluge valve. When the valve is opened the pipes are filled with water and
water is discharged over a whole sprinkler section simultaneously.
Dry pipe
This system is an automatic system activated by high temperature. It is used in spaces in which the
ambient temperature may be cold enough to freeze the water in a wet pipe system, rendering the
system inoperable.
GT
GT is the acronym for gross tonnage and is an index related to a ship's overall internal volume.
HGV
This is the acronym and the formal term in the UK for Heavy Good Vehicle. HGV or LGV, which also is
commonly used, is a vehicle heavier than 3.5 ton.
IMO
IMO is the acronym for International Maritime Organization. The IMO's primary purpose is to
develop and maintain a comprehensive regulatory framework for shipping.
IMPRO
Acronym for improved water-based fire suppression and drainage systems for ro-ro vehicle decks.
This is the project name for the project where the goal is to evaluate modern water based fire
suppression technology in order to replace the design criteria given in IMO Resolution A.123(V),
dated 1967.
Resolution A.123(V)
This is the code that controls the installation of fixed fire-extinguishing systems on ro-ro spaces and
special category spaces.
Ro-pax
Ro-pax is the acronym for Roll-on/Roll-off passenger ship. This is just like a ro-ro ship but it is also
designed to carry passengers.
Ro-ro
Ro-ro is the acronym for Roll-on/Roll-off ship. Ro-Ro ships are vessels designed to carry wheeled
cargo such as automobiles, trucks, semi-trailer trucks, trailers or railroad cars that are driven on and
off the ship on their own wheels. The ro-ro ship is not designed to carry large amounts of passengers.
SOLAS
This is the acronym for International Convention for the Safety of Life at Sea. It is the code that
regulates the safety requirements of merchant ships.

6
Special category spaces
This is a ro-ro space that passengers have access to.
Wet pipe
A wet pipe sprinkler system is an automatic system that constantly is filled with water. The system is
activated when a sprinkler head is automatically opened due to a temperature increase. Water is
then immediately discharged.

7
3 Literature study For the purpose of this report a literature study has been performed to gather relevant information
on the subject of fire extinguishing systems and also fire incidents on ro-ro ships and ships in general.
A brief summary of the information gathered is presented below.
BRE: Assessment of the fire behavior of cargo loaded ro-ro vehicle decks in relation to the design
standards for fire suppression systems (BRE Fire and Security, 2006)
The UK Maritime and Coastguard Agency commissioned the consultancy company BRE Fire and
Security to review existing research and fire incidents reports. The purpose was to identify whether
or not fire extinguishing systems that are installed according to Resolution A.123(V) is providing a
satisfying level of safety onboard ro-ro vessels. The report summarizes fire incident reports, test
protocols and other relevant information related to the subject.
The conclusion of the BRE report is that the evidence is not strong enough to firmly say that the fire
load onboard ro-ro ferries is enough to exceed the extinguishing capabilities of the fire extinguishing
system. However the evidence indicate that this is the case and that the requirements in Resolution
A.123(V) is not enough to provide an acceptable level of safety. This conclusion points out the need
for this report to be written. More evidence is needed to confirm that the present guidelines provide
an unsatisfying level of safety.
DNV: Fires on ro-ro decks (DNV, 2005)
In Fires on ro-ro decks Det Norske Veritas (DNV) has collected and summarized data from incident
reports describing fires on ro-ro decks. The conclusions drawn are:
Fires on ro-ro decks are rare (1 per 1200 ship years to 1 per 1700 ship years)
Low pressure CO2 systems seem to be unreliable/inefficient
The origin of fires are trucks, cars and other cargo
Alternative fire extinguishing systems such as water mist, inside air foam and high expansion foam is suggested to replace today’s systems.
The frequencies mentioned above are useful in the risk analysis chapter of this report.
VTT: Survivability for ships in case of fire (Hakkarainen, et al., 2009)
This report presents the results and fire test data from experiments performed on building materials
used in ship structures. It is divided in to four different topics, Materials, Hazards, Structures and
Evacuation. The report also present fire incident statistics that is relevant for this report. It present
numbers on frequencies of fires on ro-ro and ro-pax ships for different years.
SP: Large-scale ro-ro deck fire suppression tests (Arvidson, 2009)
14 large scale tests have been conducted by SP to evaluate the efficiency for a number of different
fire extinguishing systems including one fulfilling the present guidelines. Both a deluge water spray
system and a deluge high pressure system were used with varying water discharge density and nozzle
k-factor. No tests were made with automatic systems. Tests were made with and without a shield
between the extinguishing system and the fire. The commodity used were one very similar to FM
Global Std Group A Plastic commodity, some adjustments were made to fit the commodity on a
wood pallet with dimensions used in Europe.
8
The report states that the tests without a shield showed a clear relationship between the water
discharge density and the extinguishing capability. Tests with a discharge density of 15 mm/min are
reported to suppress the fire immediately, 10 mm/min to suppress the fire and 5 mm/min to control
the fire. The high pressure system controlled the fire at a discharge density of 5.8 mm/min but the
lower discharge density at 3.75 mm/min and 4.6 mm/min provided no fire control.
For the shielded fires all the systems had a limited impact, the total heat release rate were
unaffected and almost all combustible materials were consumed.
The results of the report from SP contribute to the understanding of fire behavior on ro-ro decks and
the effects of sprinkler systems. In the development of this report SP´s work also provides helpful
information of the sprinkler efficiency for different water discharge densities.
Lloyd´s register: World Casualty Statistics and World Fleet Statistics (Lloyd's Register of Shipping 1,
2008; Lloyd's Register of Shipping 2, 2008)
Lloyd’s register is an organization that provides the whole maritime industry with information. World
Casualty Statistics summarizes casualties at sea from a worldwide perspective. Losses are analyzed
and disposals are categorized. Details include the Ship name, flag, GT, year of build, location and a
complete summary of the casualty incident suffered, including the fate of the vessel and crew.
Lloyd´s register is a source used to determine the frequencies of fires on ro-ro decks. The numbers
are used in the risk analysis chapter in this report.
9
4 Problem definition The vehicles that are transported on ro-ro ships have changed radically since the last time the
installation guidelines were updated in 1967. The construction materials, sizes and basic design have
changed which might have a negative impact on the fire safety. The present requirements for fire
extinguishing systems might no longer be enough to provide an acceptable level of safety on a ro-ro
ship. The vehicles today are in much larger range built out of combustible materials. Back in the days
when the present guidelines were developed, a lot more non-combustible materials were used and
the fire load of an average car from the 1960th was less then today (ECCS-Technical Committee, 1993;
Katsuhiro, 2009). This is the main reason why the guidelines are now being updated and evaluated.
The main objective with this report is to evaluate the efficiency of the present fixed fire-extinguishing
system on ro-ro deck and compare them to the systems described in the new proposal. The
differences between the present and the proposed systems are first of all the water discharge
density. Also other ways of activating the systems are allowed. The present and the proposed
guidelines are presented below.
Resolution A.123(V)
This paragraph is not a complete description of the resolution. It covers the most relevant parts for
the purpose of this report. Refer to Resolution A.123(V) (IMO, 1967) for a complete version.
According to Resolution A.123(V), a fixed fire extinguishing system in a special category space should
be at least as effective in controlling a flowing petrol fire as a system that fulfills the following:
The fire extinguishing system installed in special category spaces should be a deluge system
delivering an even distribution of water.
The system may be divided into sections. The breadth of a section should be the full breadth
of the vehicle deck. The length of a section should be at least 20 meter.
The pump should be designed to provide sufficient water application to at least two sections
simultaneously. The pump may not have any other purpose than supplying the fixed fire
extinguishing system with water.
As a redundancy the fire pump, normally providing water for the on board fire hoses, should
be connected to the sprinkler system.
The distribution valves for the system should be situated in an easily accessible space
adjacent to the protected area. From this space it should be possible to operate the pump.
No specifications are included for the measurements of required maximum or minimum
distances between sprinkler heads.
The recommended water discharge densities are found in Table 1.
Proposed guidelines
As in the previous chapter this only summarize the proposed guidelines, for a full version refer to
Appendix B - New proposed installation guidelines. This summary includes the recommendations
that are of value for this report.
According to the proposed guidelines, a fixed fire extinguishing system in open and closed ro-ro
spaces and special category spaces should be at least as efficient as a system fulfilling the following:
The system may be automatically activated, manually activated or automatically activated
with provisions for manual activation.

10
The system may be a wet pipe, dry pipe or deluge system in closed ro-ro spaces and special
category spaces. In open ro-ro spaces (having openings to the surrounding of more than 10
percent of the total area of the space sides) only deluge systems are to be used.
A dry pipe system should have no more than a 60 second delay between activation and fully
opened inspection test connection.
Deluge systems should be divided into deluge sections. The sections should normally cover
the full breadth of the deck. For decks having a free height equal to or less than 2.5 m, each
deluge section (as measured along the lanes of the deck) should be a minimum of 10 m in
length. For decks having a free height in excess of 2.5 m, each deluge section should be a
minimum of 15 m in length.
The horizontal spacing between nozzles or sprinklers should not exceed 3.2 m.
Automatic nozzles or sprinklers should have a nominal operating temperature of between
121 °C to 149 °C and standard response characteristics.
The system should be supplied by both main and emergency power, and should be provided
with an automatic change-over switch. Alternatively, an independent internal combustion
engine or similar could be used for this purpose. The emergency power should be provided
from outside the protected space.
The demands on redundancy for pumps have not been determined at the time of writing and
are therefore not taken into account in this report.
The recommended water discharge densities are found in Table 1.
Table 1 The minimum required water discharge density given in the present and the proposed guidelines
Type of system Water discharge density [mm/min] (height<2.5 m)
Water discharge density [mm/min] (height>2.5 m)
Proposed automatic wet pipe system
10 15
Proposed automatic dry pipe system
10 15
Proposed manual deluge system
5 10
Present manual deluge system
3.5 5
The guidelines described above needs to be applied to a ship to enable a calculation of the costs for
the installations. Also a ship is needed to calculate the costs for fire damages.
4.1 Example ship The world fleet of ships which have one or many ro-ro decks consists of a wide range of different
kinds and sizes. One ro-pax ship has been selected as a representation of all the ships in the world
fleet of ro-ro and ro-pax. The ship is selected based on the size and general layout of the ship
including number of decks and passenger accommodations. In order to have a general
representation of the world fleet the selected ship is as far as size based on the average Gross
Tonnage (GT) of the world fleet. The purpose of having an example ship is to provide a picture of the
ship for the readers with limited knowledge of the shipping industry. An example ship is also
necessary to make estimations of the costs for different damages due to fire.

11
According to Lloyds Register and the world fleet statistics (Lloyd's Register of Shipping 2, 2008) there
are 2489 ro-ro ships and 2868 ro-pax ships registered in the world as of 2008.
The total GT of the ro-ro ships are 41.6 millions GT and 16.8 millions GT for ro-pax. This means the
average GT for a ro-ro ship is 17 000 GT and for a ro-pax it is 6 000 GT.
Table 2 Gross Tonnages for the world fleet
Ro-ro Ro-pax Total
Total number of registered ships
2 489 2 868 5 357
Total number of Gross Tonnage (GT)
41 634 505 16 794 304 58 428 809
Average Gross Tonnage (GT)
16 727 5 856 10 907
The ro-pax example ship that is selected is larger than the world fleet average. It is a 12 000 gross ton
ship designed to carry 1200 passengers. For the purpose of this report the ship will be assumed to
have 299 passengers onboard. This is based on the average number of passengers per trip for all ro-
ro and ro-pax ships (ShipPax Information, 2008). It can hold approximately 480 cars. Deck 3, 4 and 5
are ro-ro decks. Above that the remaining decks are passenger and crew decks. Deck 1 and 2 consists
mainly of machine rooms and cabins. The engine provides 10 300 kW and can get the ship up to a
speed of 18 knot. The measurements are 135 meters in length and 24 meters wide. Deck 3 is the first
ro-ro deck. It is approximately 120 meters long, 20 meters wide and 5 meters high. Deck 4 has the
same measurements except for that the height is 2.7 meters. Deck 5 is 100 meters long, 20 meters
wide and 2.4 meters high. Refer to Figure 1 for a side view of the example ship.
Figure 1 Side view ro-pax example ship.
12
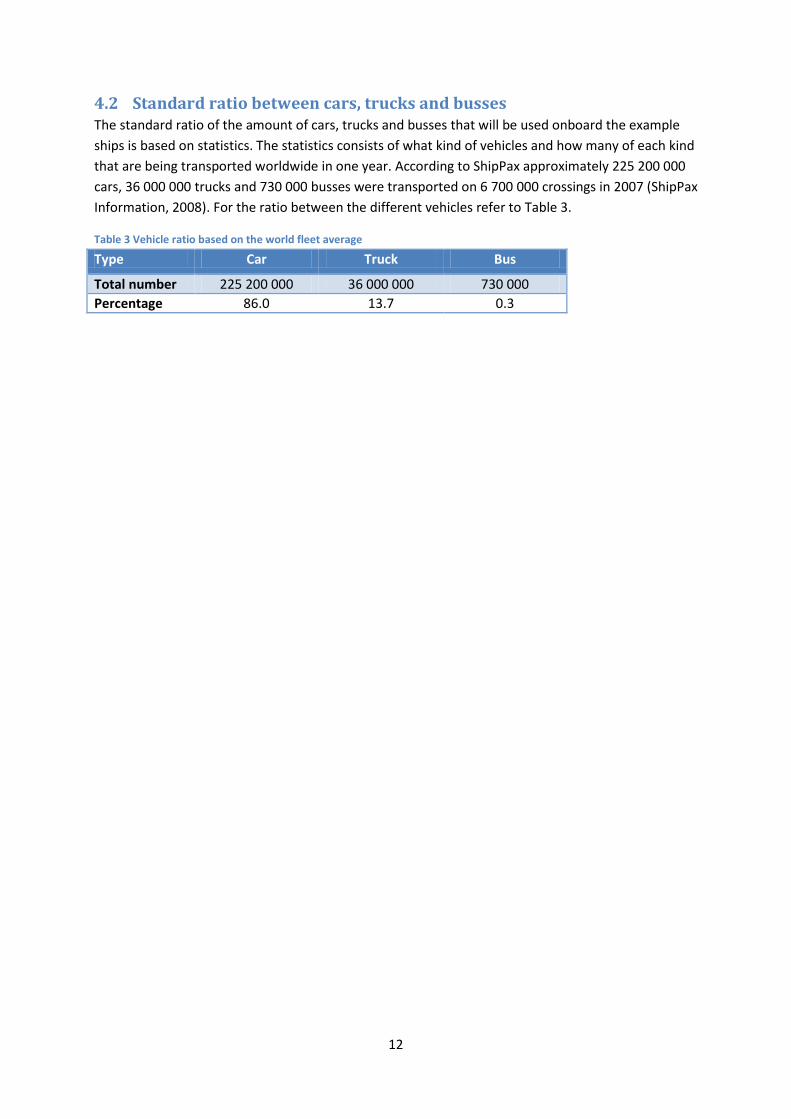
4.2 Standard ratio between cars, trucks and busses The standard ratio of the amount of cars, trucks and busses that will be used onboard the example
ships is based on statistics. The statistics consists of what kind of vehicles and how many of each kind
that are being transported worldwide in one year. According to ShipPax approximately 225 200 000
cars, 36 000 000 trucks and 730 000 busses were transported on 6 700 000 crossings in 2007 (ShipPax
Information, 2008). For the ratio between the different vehicles refer to Table 3.
Table 3 Vehicle ratio based on the world fleet average
Type Car Truck Bus
Total number 225 200 000 36 000 000 730 000
Percentage 86.0 13.7 0.3
13
5 Identification of hazards In this chapter the possible hazards onboard a ro-ro deck are identified partly from a group meeting
and also from literature and incident reports. The hazards that are identified are ranked by level of
severity and frequency in a risk matrix by the authors of this report and are based on their judgment
and knowledge from reading incident reports and other literature. Each scenario is given a risk index
which corresponds to a certain level of severity and frequency. The risk matrix serves as a coarse
analysis and help to pick out the scenarios that are important to take in to account in the risk
analysis.
5.1 Hazards identified from creative meetings and real fire events A meeting was held on august 10th 2009 at SP in Borås, Sweden. It was attended by members of the
IMPRO project group and fire safety professionals with experience in both the sprinkler and the
shipping industry. The purpose of the meeting was to identify possible causes of a fire onboard a ro-
ro ship. The intentions were not primarily to identify causes from previous fire events but to identify
possible causes that could occur in the future. The authors of this report had time during the meeting
to bring up questions and discuss possible scenarios with the experts. The experts gave their opinion
on what could be a potential fire hazard on a ro-ro deck.
5.1.1 Summary of meeting and group discussion
For the most part, causes that came up from the meeting could be found in reports from previous
fire events. Vehicle fires were discussed and the opinion was that those are the fire events that are
most likely to occur on a ro-ro deck. However other causes came up such as vehicle ramps and other
movable parts on the deck. Some ships have decks that can be lowered down from the ceiling if an
additional deck is needed. Those decks could possibly start a fire due to moving parts and electrical
components.
5.1.2 Real fire events and statistics from literature
In addition to the meeting with experts, more risk objects were identified from incident reports and
other literature. Most fire events that occur on ships do not start on ro-ro decks but in other spaces
such as engine rooms or passenger areas. Due to the limitations of this project, only fires on the ro-ro
deck will be evaluated.
In the fire events that are found in the literature and where the origin of the fire is identified the
most common reason is the vehicles onboard ro-ro deck (DNV, 2005). In the fire incidents that are
identified in the DNV report, none of them originated in any of the ships’ systems. They either
started when cargo shifted around due to heavy weather, electric short circuit or auto ignition. There
are also two incidents where a fire started due to leakage of gasoline from a vehicle.
Also fires ignited by passengers or staff members are a possible cause. There is always a possibility of
an attack where a fire is ignited on purpose in order to create chaos or damage. However, no record
of this type of event on ro-ro deck has been found in the literature.

14
5.1.3 Fire hazards identified
The fire hazards that were gathered from the meeting and from literature and evaluated in the risk
matrix are:
Car fire
-A fire starts in some part of a passenger-carrying road vehicle, the fire spread and eventually
the whole vehicle is involved in the fire.
Heavy Goods Vehicle (HGV) fire
-The goods or the truck itself is for some reason set on fire. The fire spreads and will
eventually involve the whole vehicle.
Buss fire
A fire starts somewhere on the vehicle and develop to involve the whole vehicle.
Fire in onboard-electric system
-A fire in cables and/or electronic devices located on a ro-ro deck. It could for instance be an
armature, electrical switch or a vehicle ramp.
Fuel leakage from internal tank
-The fuel from an internal tank in a vehicle leaks and a pool of fuel is formed on the deck. For
some reason the pool of fuel is ignited.
Since this report only evaluates sprinkler systems no effort is done to identify which possible causes
that could lead to the fire scenarios listed above. If this report were to come up with new risk control
options the causes would be of interest but for a sprinkler system that do not aim to reduce the
frequency for fires to occur it is irrelevant what actually started a fire.
5.2 Risk matrix The ranking of the scenarios in the risk matrix is done by the authors of this report based on their
knowledge earned from reading incident reports and other literature on the subject of fires on ships.
The risk matrix consists of two factors as outlined by IMO. The first one is the expected frequency of
an event, called the frequency index (FI) and the other is the severity of the same event, called the
severity index (SI). These two factors combined yields the risk index (RI) (IMO, 2002). The risk index
gives a rough estimation about the severity of the hazard and helps identify the scenarios that need
to be taken in to account in the risk analysis. The FI and SI are estimated by the authors of this report
based on the own knowledge and judgment.
5.2.1 Frequency index
The frequency index is based on the estimation on how often an event occurs. The higher number
the more often it occurs. For description of the frequency index, refer to Table 4.

15
Table 4 Frequency index
FI Frequency Description F (Per ship year)
7 Frequent Likely to occur ten times every 1 ship year 10
5 Reasonably probable
Likely to occur once every 10 ship year 0.1
3 Remote Likely to occur once every 1000 ship year 10-3
1 Extremely remote Likely to occur once every 100 000 ship year 10-5
5.2.2 Severity index
The severity index is based on the estimation on how serious a single incident is. The higher number
the more severe the incident is. For description of the severity index refer to Table 5.
Table 5 Severity index
SI Severity Description S (Equivalent fatalities)
1 Minor Local equipment damage 0.01
2 Significant Non-severe ship damage 0.1
3 Severe Severe damage 1
4 Catastrophic Total loss and loss of life 10
5.2.3 Risk index
The risk index is simply the sum of the frequency and severity index. Based on the risk index the most
hazardous scenarios can be picked out. For description of the risk index refer to Table 6 and the
ranking of the events, to Table 7.
Risk index = Frequency index + Severity index
Table 6 Risk index
Risk index (RI)
FI
Frequency
Severity (SI)
1 2 3 4
Minor Significant Severe Catastrophic
7 Frequent 8 9 10 11
6 7 8 9 10
5 Reasonably probable 6 7 8 9
4 5 6 7 8
3 Remote 4 5 6 7
2 3 4 5 6
1 Extremely remote 2 3 4 5

16
Table 7 Risk index for fire events
Incident FI SI Risk index
HGV fire 3 4 7
Car fire 3 3 6
Buss fire 1 4 5
Fuel leakage internal tank
1 3 4
Fire in onboard-electric system
2 1 3
Fire ignited on purpose by human
1 2 3
The index numbers for the scenarios in Table 7 has been estimated based on the authors’ knowledge
and judgment. First of all the frequency index was estimated. Based on incident statistics a car fire
and HGV fire is likely to occur roughly once every 1000 ship year which gives them a FI=3. None of
the other scenarios has been found as a cause of fire in the statistics and are therefore set to a lower
FI. It seemed reasonable that a fire in onboard electric system is more likely than the scenarios given
FI=1 and are therefore given FI=2. The SI is set to 4 for the HGV fire and the buss fire. This is based on
the measured heat release rate from experiments whish can get as high as 120 MW. This would be
catastrophic and they are therefore given SI=4. The Car fire and a fuel leakage can potentially also
reach a high heat release rate and the risk of fire spread is possible and therefore these scenarios are
given SI=3. The fire in an onboard electric system will most likely be limited to a smaller object with a
relatively low heat release rate and are given SI=1. A fire ignited by human is really hard to predict
the severity level of. This scenario means that something else is ignited than the other scenarios
mentioned above and there are normally no other objects capable of reaching a high heat release
rate on a ro-ro deck and this scenario is therefore set to 2.
The conclusion, after giving each scenario a risk index, is that the two most critical events to evaluate
are HGV fire and car fire. This corresponds to other reports written on the subject. A HGV fire and a
car fire can cause a rapid fire growth and fire spread and the probability for these fires to occur are
more likely than the others. Therefore car fire and HGV fire is used in this report as the base for
evaluating the efficiency of the fixed fire extinguishing system. Other fire events are discussed briefly
at the end of this report.
5.2.4 The car fire
The car fire is, as previously concluded, one of the most likely and hazardous fire scenarios on a ro-ro
deck. A single car that is reasonable new has the potential to burn at a heat release rate of 4 MW for
an extended period of time and at short moments, peak at between 5-9 MW (BRE Fire and Security,
2007; Ingason, 2006). The heat release rate curve varies depending on where the origin of the fire is.
If the fire starts in the engine compartment the fire tends to reach steady state quicker than if the
fire starts inside the passenger cabin. This is possibly because it takes some time before the
windshield breaks and the hot gases can migrate out from the car. The time it takes to reach the
peak heat release rate is between 10 and 55 minutes. After that the heat release rate will stay at a
constant level for about 20 minutes before it starts to descend. (BRE Fire and Security, 2007; ECCS-
Technical Committee, 1993; Ingason, 2006; Lemaire & Kenyon, 2006). For an example of a heat
release rate curve for a car refer to Figure 2.

17
Figure 2 Two examples of heat release rate curves for a single free burning car (Lemaire & Kenyon, 2006, p. 339). The difference between the two tests is the wind speed.
The first phase of the design fire for a car fire is represented by an average heat release rate curve
for different cars. The time to reach steady state is approximately 10 minutes which is a short but
conservative time. The heat release rate curve is described as a so called alpha t-square curve, refer
to Equation 1. This curve is a common way of describing fires and specially when sprinkler systems
are designed or evaluated. The alpha value is the variable that decides the rate of which the fire
increases with.
Q =α∙t2 Equation 1
Where
Q = heat release rate (kW)
α = alpha (kW/s2)
t = time (s)
The α for the car fire varies between 0.0055 and 0.022 kW/s2 depending on the size of the car and if
it is a new or an old car (BRE Fire and Security, 2007). This is taken in to account in the risk analysis
and risk control options. A probability distribution of the α-value is used instead of one fixed value,
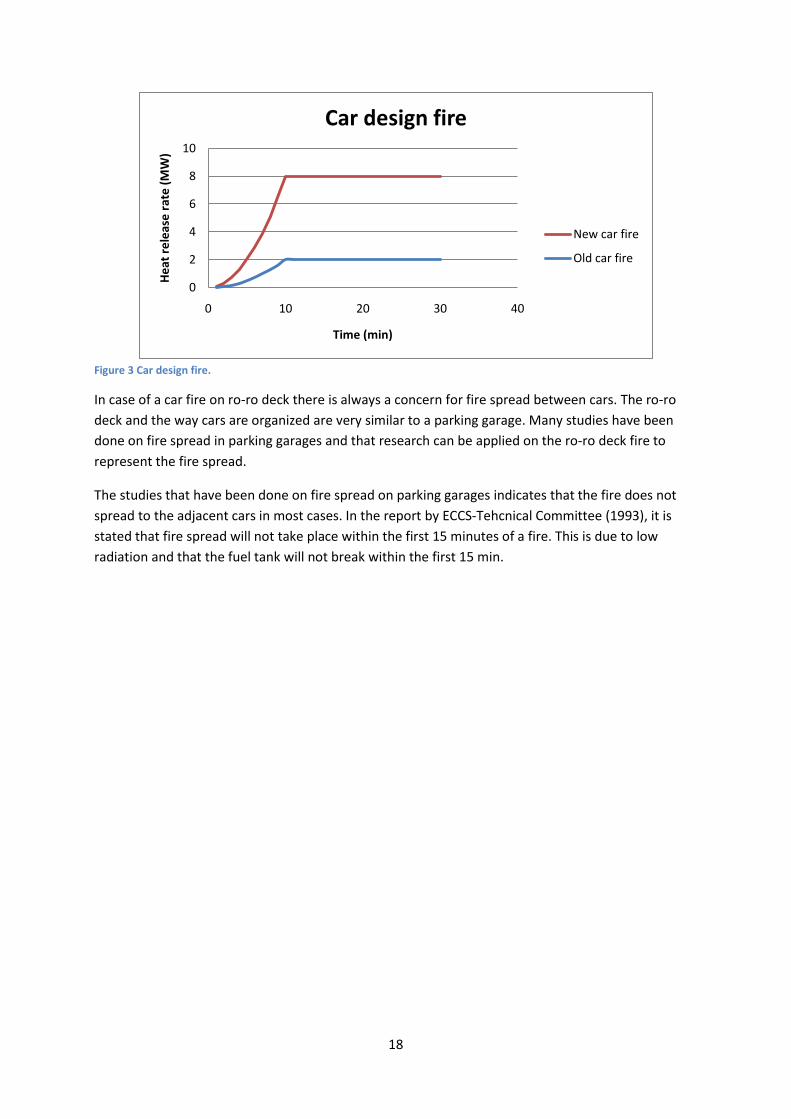
more information about this method is given in Chapter 6.4. For the heat release rate curves for car
fire refer to Figure 3.
0
1
2
3
4
5
6
0 10 20 30
He
at r
ele
ase
rat
e [
MW
]
Time [minutes]
No ventilation
6 m/s
18
Figure 3 Car design fire.
In case of a car fire on ro-ro deck there is always a concern for fire spread between cars. The ro-ro
deck and the way cars are organized are very similar to a parking garage. Many studies have been
done on fire spread in parking garages and that research can be applied on the ro-ro deck fire to
represent the fire spread.
The studies that have been done on fire spread on parking garages indicates that the fire does not
spread to the adjacent cars in most cases. In the report by ECCS-Tehcnical Committee (1993), it is
stated that fire spread will not take place within the first 15 minutes of a fire. This is due to low
radiation and that the fuel tank will not break within the first 15 min.
0
2
4
6
8
10
0 10 20 30 40
He
at r
ele
ase
rat
e (
MW
)
Time (min)
Car design fire
New car fire
Old car fire
19
Based on fire incidents in New Zealand, fires rarely spread in a parking garage. Approximately 3% of
all car fires in parking garages spread to another vehicle (Li, 2005). The reason for this might be that
there were no adjacent vehicles or that the distance between the cars was enough to prevent fire
spread in most cases.
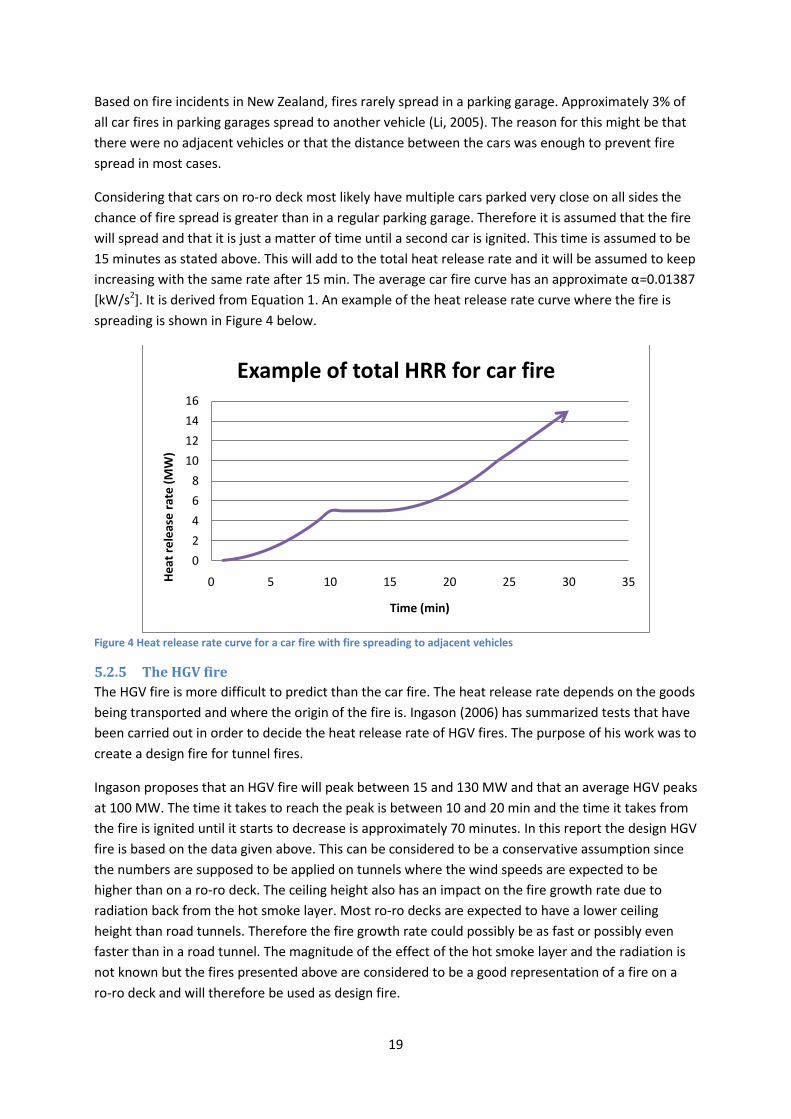
Considering that cars on ro-ro deck most likely have multiple cars parked very close on all sides the
chance of fire spread is greater than in a regular parking garage. Therefore it is assumed that the fire
will spread and that it is just a matter of time until a second car is ignited. This time is assumed to be
15 minutes as stated above. This will add to the total heat release rate and it will be assumed to keep
increasing with the same rate after 15 min. The average car fire curve has an approximate α=0.01387
[kW/s2]. It is derived from Equation 1. An example of the heat release rate curve where the fire is
spreading is shown in Figure 4 below.
Figure 4 Heat release rate curve for a car fire with fire spreading to adjacent vehicles
5.2.5 The HGV fire
The HGV fire is more difficult to predict than the car fire. The heat release rate depends on the goods
being transported and where the origin of the fire is. Ingason (2006) has summarized tests that have
been carried out in order to decide the heat release rate of HGV fires. The purpose of his work was to
create a design fire for tunnel fires.
Ingason proposes that an HGV fire will peak between 15 and 130 MW and that an average HGV peaks
at 100 MW. The time it takes to reach the peak is between 10 and 20 min and the time it takes from
the fire is ignited until it starts to decrease is approximately 70 minutes. In this report the design HGV
fire is based on the data given above. This can be considered to be a conservative assumption since
the numbers are supposed to be applied on tunnels where the wind speeds are expected to be
higher than on a ro-ro deck. The ceiling height also has an impact on the fire growth rate due to
radiation back from the hot smoke layer. Most ro-ro decks are expected to have a lower ceiling
height than road tunnels. Therefore the fire growth rate could possibly be as fast or possibly even
faster than in a road tunnel. The magnitude of the effect of the hot smoke layer and the radiation is
not known but the fires presented above are considered to be a good representation of a fire on a
ro-ro deck and will therefore be used as design fire.
0
2
4
6
8
10
12
14
16
0 5 10 15 20 25 30 35He
at r
ele
ase
rat
e (
MW
)
Time (min)
Example of total HRR for car fire
20
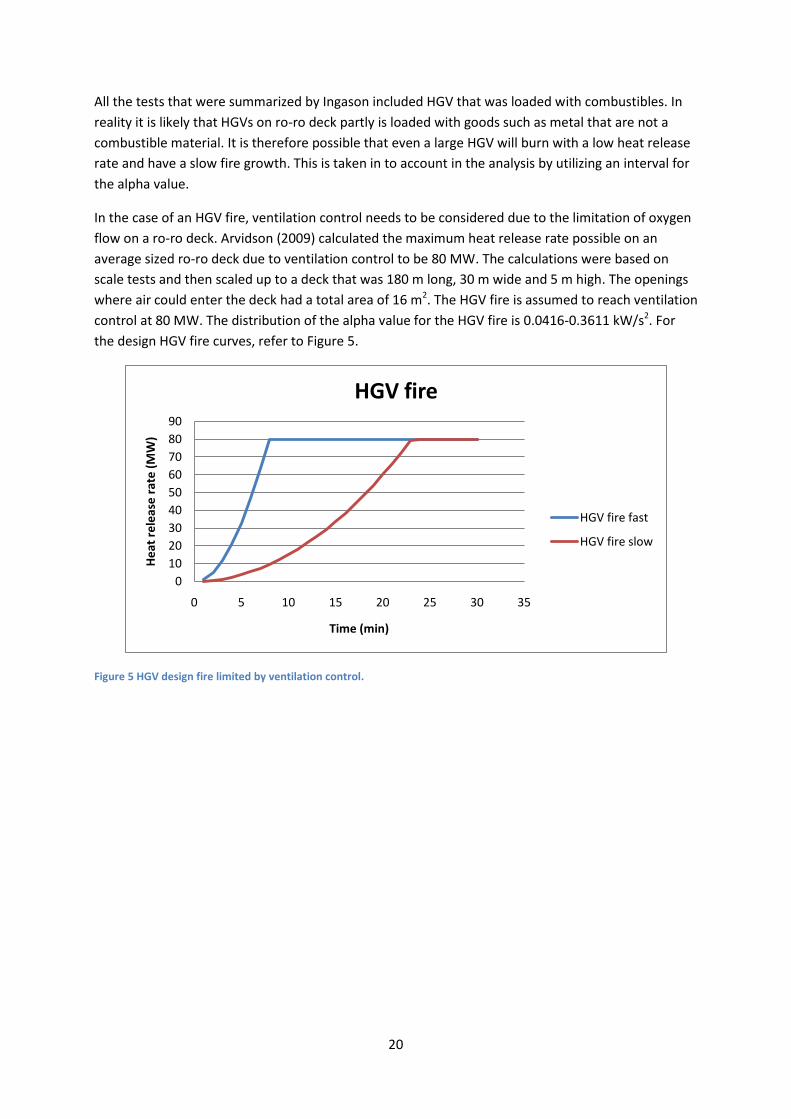
All the tests that were summarized by Ingason included HGV that was loaded with combustibles. In
reality it is likely that HGVs on ro-ro deck partly is loaded with goods such as metal that are not a
combustible material. It is therefore possible that even a large HGV will burn with a low heat release
rate and have a slow fire growth. This is taken in to account in the analysis by utilizing an interval for
the alpha value.
In the case of an HGV fire, ventilation control needs to be considered due to the limitation of oxygen
flow on a ro-ro deck. Arvidson (2009) calculated the maximum heat release rate possible on an
average sized ro-ro deck due to ventilation control to be 80 MW. The calculations were based on
scale tests and then scaled up to a deck that was 180 m long, 30 m wide and 5 m high. The openings
where air could enter the deck had a total area of 16 m2. The HGV fire is assumed to reach ventilation
control at 80 MW. The distribution of the alpha value for the HGV fire is 0.0416-0.3611 kW/s2. For
the design HGV fire curves, refer to Figure 5.
Figure 5 HGV design fire limited by ventilation control.
0
10
20
30
40
50
60
70
80
90
0 5 10 15 20 25 30 35
He
at r
ele
ase
rat
e (
MW
)
Time (min)
HGV fire
HGV fire fast
HGV fire slow
21
6 Risk analysis In this chapter the present installation guidelines for fire extinguishing system fulfilling Resolution
A.123(V) are evaluated. The new installation guidelines are evaluated in the next chapter called Risk
control options.
The risk analysis consists of an investigation of the probability for two different scenarios to occur.
The severity level of each scenario is based on IMO’s definition as agreed by the Marine Environment
Protection Committee at its thirty-seventh session (IMO, 2005). In IMO’s definition there are three
levels of severity, less serious, serious and very serious. These severity levels are applicable to all
kinds of accidents and not only fire incidents. In this report where only fire incidents are evaluated
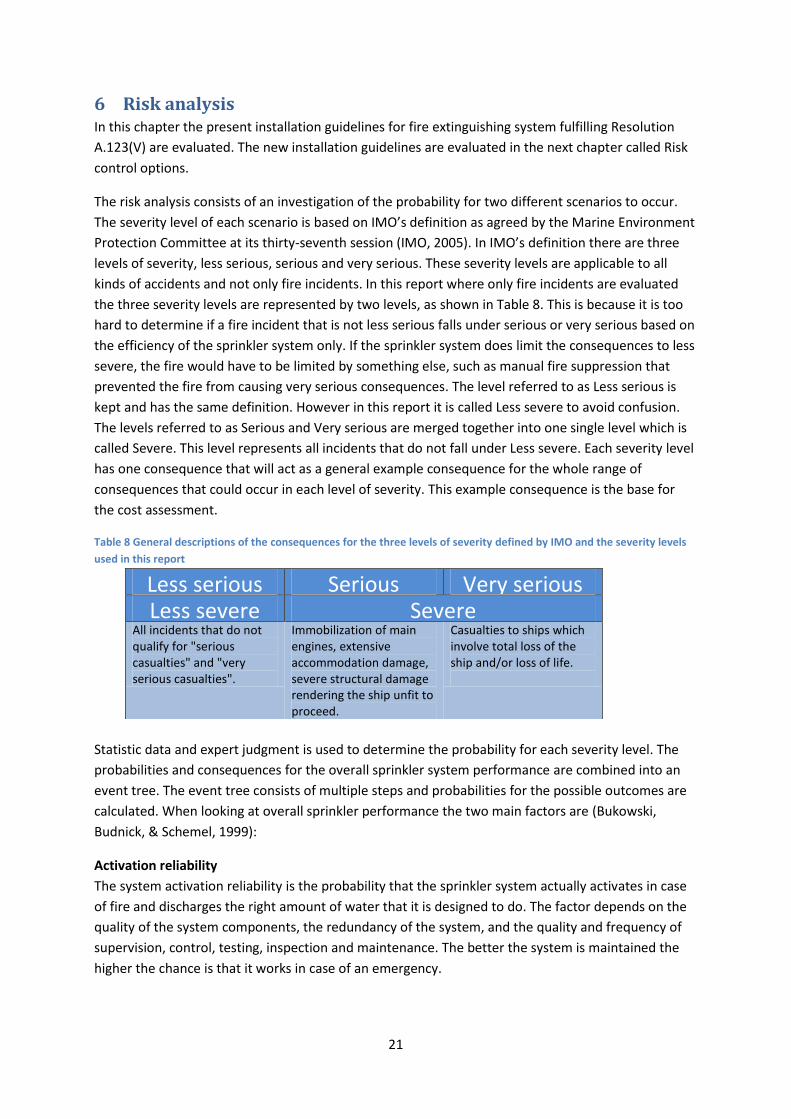
the three severity levels are represented by two levels, as shown in Table 8. This is because it is too
hard to determine if a fire incident that is not less serious falls under serious or very serious based on
the efficiency of the sprinkler system only. If the sprinkler system does limit the consequences to less
severe, the fire would have to be limited by something else, such as manual fire suppression that
prevented the fire from causing very serious consequences. The level referred to as Less serious is
kept and has the same definition. However in this report it is called Less severe to avoid confusion.
The levels referred to as Serious and Very serious are merged together into one single level which is
called Severe. This level represents all incidents that do not fall under Less severe. Each severity level
has one consequence that will act as a general example consequence for the whole range of
consequences that could occur in each level of severity. This example consequence is the base for
the cost assessment.
Table 8 General descriptions of the consequences for the three levels of severity defined by IMO and the severity levels
used in this report
Statistic data and expert judgment is used to determine the probability for each severity level. The
probabilities and consequences for the overall sprinkler system performance are combined into an
event tree. The event tree consists of multiple steps and probabilities for the possible outcomes are
calculated. When looking at overall sprinkler performance the two main factors are (Bukowski,
Budnick, & Schemel, 1999):
Activation reliability
The system activation reliability is the probability that the sprinkler system actually activates in case
of fire and discharges the right amount of water that it is designed to do. The factor depends on the
quality of the system components, the redundancy of the system, and the quality and frequency of
supervision, control, testing, inspection and maintenance. The better the system is maintained the
higher the chance is that it works in case of an emergency.
Less serious Serious Very serious Less severe Severe
All incidents that do not qualify for "serious casualties" and "very serious casualties".
Immobilization of main engines, extensive accommodation damage, severe structural damage rendering the ship unfit to proceed.
Casualties to ships which involve total loss of the ship and/or loss of life.

22
System performance effectiveness
The system performance effectiveness relies on that the system is properly designed and that the
water flow rate is sufficient for the fire hazard. It is important that the time to activation is as short as
possible so that the heat release rate does not exceed the value the system can control. If the system
is activated to late the fire will continue to increase and not be controlled by the sprinkler system. If
the fire is calculated to increase to a level where the sprinkler system no longer is capable of
controlling the fire it will be assumed that the consequence of such a fire is severe. For a schematic
illustration of the event tree that will be used in the analysis, refer to Figure 6.
Figure 6 General representation of the event tree that will be used to evaluate each fire extinguishing system.
There are always uncertainties in every assumption done in the field of fire protection. In this case
assumptions are done on the sprinkler efficiency and activation. To take uncertainties in to account
the software @Risk is used. Some of the in data is defined as probability distributions and not a fixed
value. This is to quantify the uncertainties and present the impact of the assumptions.
6.1 Initial event The first data needed in the event tree is the frequency for the initial event. In this chapter the
frequency for a fire to start on a ro-ro deck is investigated. The following text is summarized in Table
9.
The frequency for the initial event, meaning frequency for fire on a ro-ro deck, disregarding outcome,
is available in a report from DNV (2005, p. 3). For ro-ro cargo ships it is stated to be 0.83∙10-3 fires per
ship year and for ro-pax it states 0.59∙10-3. This is the only fire frequency specifically for ro-ro decks
found in the literature. There are however lots of statistics available that states frequencies for
serious fires or fires starting anywhere on the ship.
To compare the values from DNV, other sources are presented here. Some of these other sources
gives frequencies without specifying at what part of the ship the fire started in.
Probability for system
preformance effectiveness
Sprinkler ConsequenceProbability for system activation
Initial eventFrequency
Fire
Sprinkler activation
Severe
Less severe
No sprinkler activation
Severe
Less severe

23
The ratio of fires starting in cargo spaces is stated to be 4-8 percent in (IAEA, 2001, p. 17) and 12
percent in “FSA – RoPax ships MSC 85/17/2” (IMO, 2008, p. 11) posted by Denmark. In this report the
ratio is assumed to be 8 percent. This ratio is used to modify the frequencies that cover fires on
whole ships.
A study presented in a report by IAEA (2001, p. 17) states a fire frequency per ship year of 16∙10-3 for
all fires on UK merchant ships of 100 GT or more. This frequency does not present the location on the
ship where the fire originates. A multiplication of 16∙10-3 fires per ship year and 8 percent cargo fires
gives an approximate value of 1.28∙10-3 fires in cargo spaces per ship year.
Another rough estimation in a report from VTT (Hakkarainen, et al., 2009, p. 44) gives the frequency
of 10-2 for all fires on all ship types. 8 percent gives a value of 0.8∙10-3
fires in cargo spaces per ship
year.
Another study presented in VTT (Hakkarainen, et al., 2009, p. A4) gives 0.16∙10-3 for fire frequency on
ro-pax vessels and only fires originated on ro-ro decks is included. In the same report a value of
0.8∙10-3 is presented for passenger/ro-ro in the northwest Europe (Hakkarainen, et al., 2009, p. A5).
The Danish FSA (IMO, 2008, p. 11) uses 8.28∙10-3 as a frequency for fire onboard ro-pax vessels per
year. With the modifier of 8 percent for cargo fires the estimate becomes 0.66∙10-3 fires per ship
year.
The presented frequencies above give an approximate value of the fire frequencies on ro-ro decks. It
ranges from 0.16∙10-3 to 1.28∙10-3 fires per ship years with an average of 0.7∙10-3. The average value is
in between the two values given by DNV which is considered to be the best available study. It is the
only study that aims towards giving the fire frequency for ro-ro decks, no matter the outcome, in
other words, exactly the value that is applicable in this report. The DNV report has very few
references but since the other frequencies are close to the one from DNV it is considered to be
reliable. The initial event is assumed to have a frequency of 0.7∙10-3 per ship year.
Table 9 Summary of data found on fire frequencies with the lowest frequency first
Source Frequency [fires/ ship year]
Notes
VTT (Hakkarainen, et al., 2009, p. A4)
0.16∙10-3 Fires originated on ro-ro decks. Ro-pax ships only.
DNV (2005, p. 3) 0.59∙10-3 Fires originated on ro-ro decks. Only ro-pax ships are included.
IMO (2008, p. 11) 0.66∙10-3 Fires on ro-pax vessels >1000 GT. Modified with 0.08 to give an estimate of fires in cargo spaces.
VTT (Hakkarainen, et al., 2009, p. A5)
0.8∙10-3 Ro-pax ships in northwest Europe, fires originated on ro-ro decks.
VTT (Hakkarainen, et al., 2009, p. 44)
0.8∙10-3 A rough order of magnitude of all fires on all ships. Modified with 0.08.
DNV (2005, p. 3) 0.83∙10-3 Fires originated on ro-ro decks. No engine room fires. Only ro-ro ships.
IAEA (2001, p. 17) 1.28∙10-3 Fires on UK merchant ships >100 GT. Modified with 0.08 to give an estimate of fires in cargo spaces.
24
6.2 Vehicle ratio This paragraph answers the question, how many of the fires that occur start in cars and HGVs
respectively? Chapter 4.2 shows that of all vehicles transported on ro-ro decks approximately 86
percents are cars and 14 percents are HGV. In the accident reports the start object of the fire is rarely
specified. Statistics from car parks ashore cannot be used due to the fact that HGVs rarely are parked
in car parks.
In this report it is assumed that it is the same probability for a fire to start in an HGV as in a car. This
enables the use of the ratio between cars and HGV as the probability for car and HGV fire to be the
fire source in case of fire.
6.3 System activation The first link in the chain of events that must function correctly for a fire to be suppressed by the
manual deluge system is the detection system. The causes for a detection system failure can be
many, such as damaged detector due to physical impact, electrical component failure or that the
system is not turned on. It is found likely that the maintenance level is higher on ships than ashore
and therefore the ship systems should have a high reliability compared to average systems in
buildings. The operational reliability for smoke detection systems ashore is stated to be between 80
and 94 percent by Bukowski, Budnick & Schemel (1999, p. 92). In this report the reliability is defined
as the probability for the detection system to function given that there is a growing fire. The statistics
referred to above is based on incident reports and expert judgments. This means that there might be
incidents that were manually detected or were caused by a very small fire that was too small to
activate the system. Therefore the probability for the detection system to functions in case of fire is
set to 90 percent.
The second link in the chain is the humans that are suppose to open the valve to the system. No
account will be taken for human errors in this chapter. Once a fire is detected the staff on the ship is
assumed to open the valve at some point. The time from detection to sprinkler activation is covered
in Chapter 6.4.1.
The third link in the chain is the pump and the power supply to the pump. To find a probability for
the system to function literature is used. The most common sprinkler systems used in buildings are
wet pipe systems. Therefore the probability of system activation for these systems is well
documented. An automatic wet pipe system has an average reliability of 93 percent (Hall, 2006). For
a discussion on the differences between sprinkler systems ashore and onboard ships refer to Chapter
11.5. Manually activated deluge systems, as the systems on ro-ro decks fulfilling resolution A.123(V),
are rare. This is likely to be the reason for the lack of available statistics. According to Hall (2006) the
category “other systems”, which includes deluge systems, is 2-3 percent of all sprinkler systems in
US. Due to lack of statistical data the reliability for deluge systems are assumed to be the same as for
wet pipe systems, 93 percent.
In case of fire the probability of system activation is estimated to be 90 % 93 % = 84 %.

25
6.4 System performance effectiveness The aim of this chapter is to decide how many percent of occurred fires that will result in a severe
consequence. The system performance effectiveness is one of the most important parts to be
assessed in this report. The result of this report will be highly dependent upon the difference in
performance between systems fulfilling Resolution A.123(V) and systems fulfilling the proposed
guidelines. The accident statistics are not detailed enough to determine in how many cases the
sprinkler systems have controlled fires. To obtain an estimation of the system performance, other
methods must be used. In this report logical arguments are combined with documentation from
experiments, expert judgment and the software @Risk.
@Risk is a program from Palisade Corporation that uses Monte Carlo simulations to perform
calculations with regard to natural variation and uncertainties. @Risk works together with Microsoft
Excel and the mathematical functions the user defines. The parameters in an equation can be
described as a probability distributions rather than fixed values and the answer is also on the form of
a probability distribution. The calculation is made thousands of times with new values drawn from
the probability distributions each time generating thousands of answers presented as a new
probability distribution, for a graphical description refer to Figure 7.
Figure 7 A general description of @Risk. The parameters in a chosen mathematical expression are defined as probability distributions, @Risk repeats calculations and the result is a new probability distribution.
The mathematical function used together with @Risk is:
+ Time to critical heat release rate
– Time to detection
– Time from detection to sprinkler activation
---------------------------------------------------------------
= Time margin
For a detailed description of the parameters refer to Chapter 6.4.1 to 6.4.4 and for the defined
estimated probability distributions used in @Risk see Appendix C.
The three in-data parameters are given as probability distributions and if the Time margin is positive
the sprinkler system is activated in time to suppress the fire and the consequence is assumed to be
Less severe.
Math
Parameter 3
Parameter 2
Parameter 1
@Risk Result
26
If the Time margin is negative the system is activated too late and the fire is assumed to result in a
Severe consequence. Since @Risk returns multiple answers the ratio of negative and positive answer
can be determined, in other words the ratio of fires resulting in Less severe and Severe
consequences.
6.4.1 Time to detection
Time to sprinkler activation for a manual system fulfilling the present guidelines, is relying on a fire
detection by smoke detection system. The time to detection can be calculated with methods of
different levels of accuracy. The more accurate methods require more detailed information of the
type of fuels that are involved in the fire. The smoke potential and also the type and sensitivity of the
detectors are needed. None of these data is available to the authors of this report and therefore a
simplified method is used. The result is not to be read as a precise time but as an approximation.
The time to detection can be estimated by calculating the time to a certain temperature rise of the
detector (Nilsson & Holmstedt, 2008). Note that the detectors not are heat detectors but their
characteristics are approximated as if they were. Which temperature rise that best describes the
time to smoke detection in this case cannot be determined since it varies with fire fuel and the
detector type. A commonly used general value is however 13 C above ambient, other values
suggested vary between 4 and 20 C (Nilsson & Holmstedt, 2008).
In this report the detectors are assumed to activate at a temperature rise of 13 C, which is in the
middle of the interval of suggested values and the most commonly used.
To calculate the time to activation the software DETACT T2 from the US organization National
Institute of Standards and Technology (NIST, 2006) is used. Since no fixe alpha is used in this report
two different values are used in the calculations, the assumed highest and lowest value. The ceiling
height needs to be specified. A fire may start at different vertical distances from the detector but in
the calculations two different probable values are used.
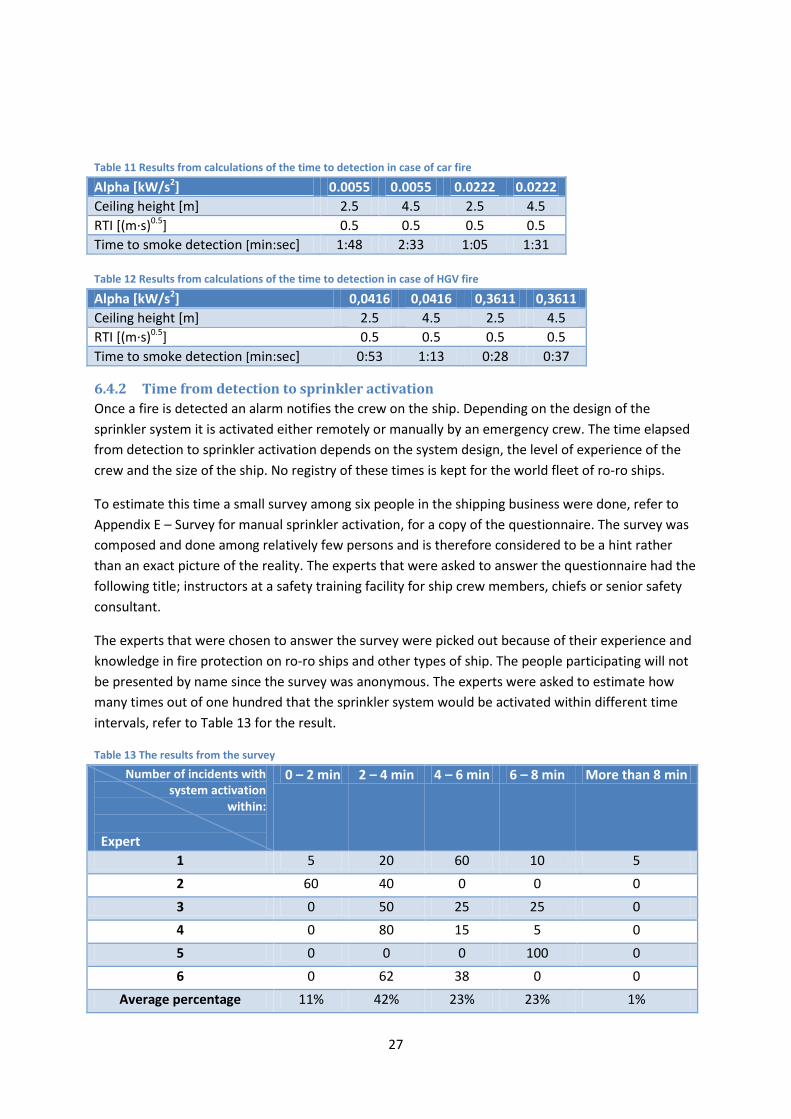
The result for the car fire scenario ranges between 1:05 and 2:33 and for the HGV fire scenario
between 0:28 and 1:13. A uniform probability distribution is assumed which means that all values in
the interval have the same probability to occur. The parameters and the results are presented in
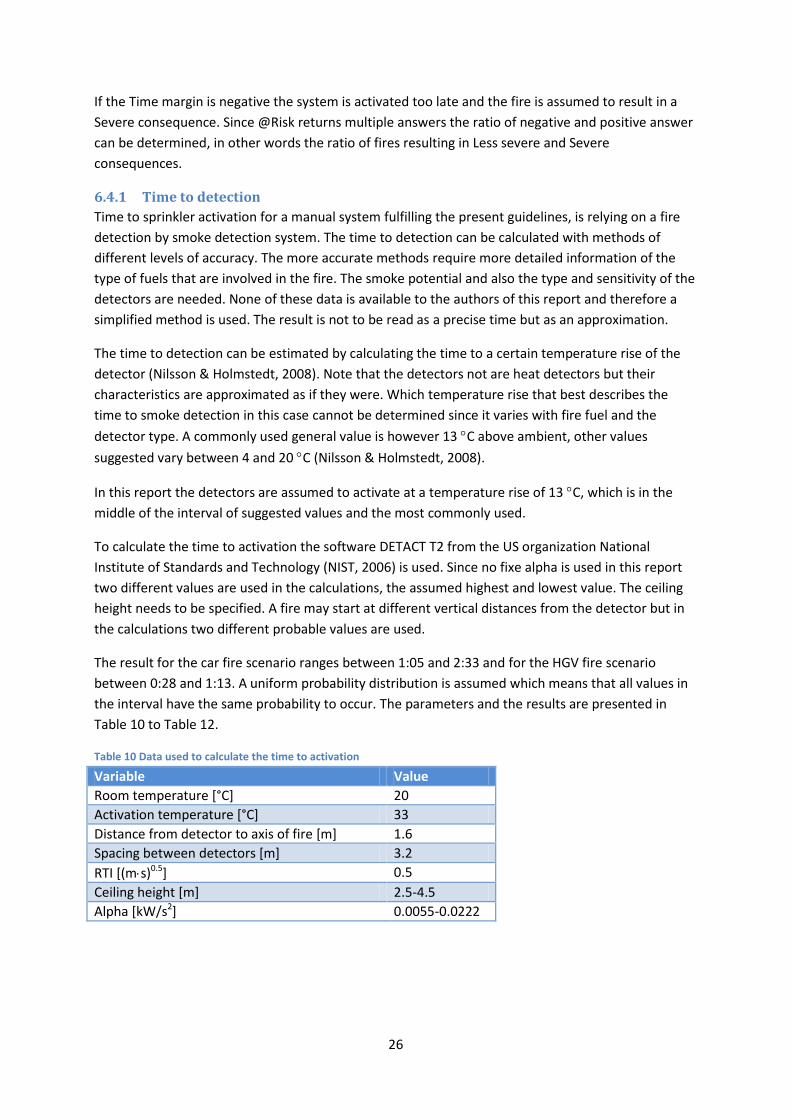
Table 10 to Table 12.
Table 10 Data used to calculate the time to activation
Variable Value
Room temperature [°C] 20
Activation temperature [°C] 33
Distance from detector to axis of fire [m] 1.6
Spacing between detectors [m] 3.2
RTI [(ms)0.5] 0.5
Ceiling height [m] 2.5-4.5
Alpha [kW/s2] 0.0055-0.0222
27
Table 11 Results from calculations of the time to detection in case of car fire
Alpha [kW/s2] 0.0055 0.0055 0.0222 0.0222
Ceiling height [m] 2.5 4.5 2.5 4.5
RTI *(m∙s)0.5] 0.5 0.5 0.5 0.5
Time to smoke detection [min:sec] 1:48 2:33 1:05 1:31
Table 12 Results from calculations of the time to detection in case of HGV fire
Alpha [kW/s2] 0,0416 0,0416 0,3611 0,3611
Ceiling height [m] 2.5 4.5 2.5 4.5
RTI *(m∙s)0.5] 0.5 0.5 0.5 0.5
Time to smoke detection [min:sec] 0:53 1:13 0:28 0:37
6.4.2 Time from detection to sprinkler activation
Once a fire is detected an alarm notifies the crew on the ship. Depending on the design of the
sprinkler system it is activated either remotely or manually by an emergency crew. The time elapsed
from detection to sprinkler activation depends on the system design, the level of experience of the
crew and the size of the ship. No registry of these times is kept for the world fleet of ro-ro ships.
To estimate this time a small survey among six people in the shipping business were done, refer to
Appendix E – Survey for manual sprinkler activation, for a copy of the questionnaire. The survey was
composed and done among relatively few persons and is therefore considered to be a hint rather
than an exact picture of the reality. The experts that were asked to answer the questionnaire had the
following title; instructors at a safety training facility for ship crew members, chiefs or senior safety
consultant.
The experts that were chosen to answer the survey were picked out because of their experience and
knowledge in fire protection on ro-ro ships and other types of ship. The people participating will not
be presented by name since the survey was anonymous. The experts were asked to estimate how
many times out of one hundred that the sprinkler system would be activated within different time
intervals, refer to Table 13 for the result.
Table 13 The results from the survey
Number of incidents with system activation
within:
Expert
0 – 2 min 2 – 4 min 4 – 6 min 6 – 8 min More than 8 min
1 5 20 60 10 5
2 60 40 0 0 0
3 0 50 25 25 0
4 0 80 15 5 0
5 0 0 0 100 0
6 0 62 38 0 0
Average percentage 11% 42% 23% 23% 1%
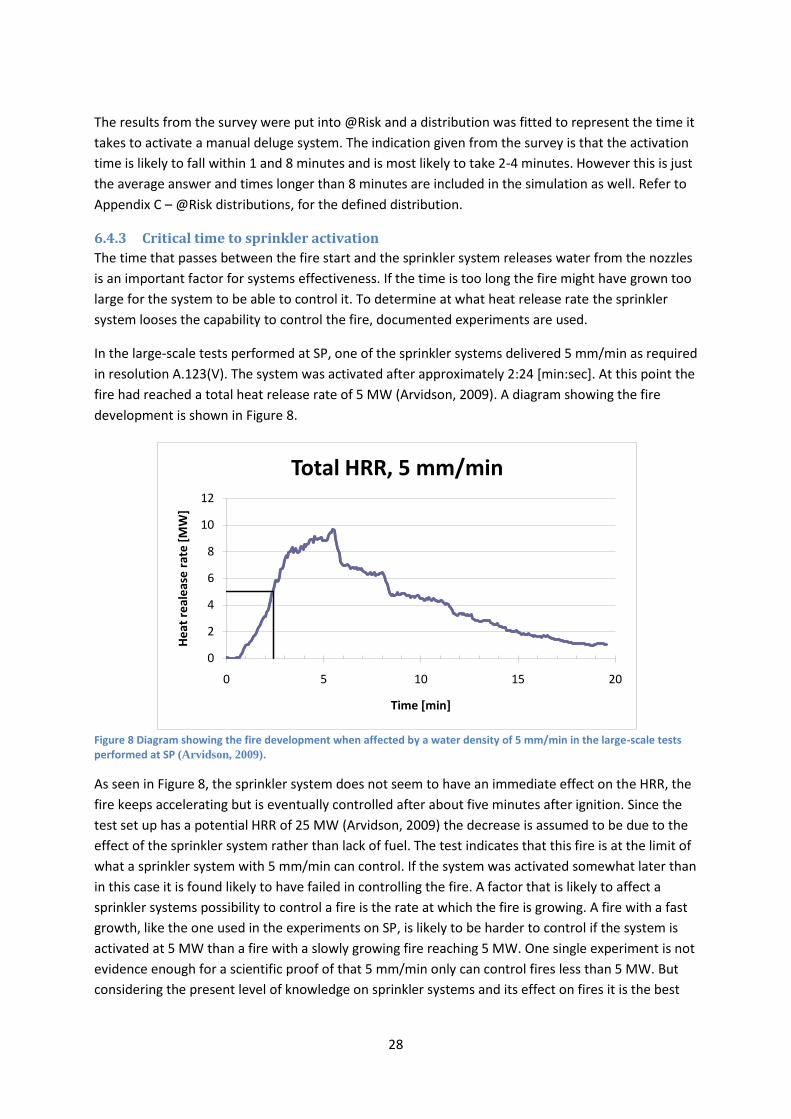
28
The results from the survey were put into @Risk and a distribution was fitted to represent the time it
takes to activate a manual deluge system. The indication given from the survey is that the activation
time is likely to fall within 1 and 8 minutes and is most likely to take 2-4 minutes. However this is just
the average answer and times longer than 8 minutes are included in the simulation as well. Refer to
Appendix C – @Risk distributions, for the defined distribution.
6.4.3 Critical time to sprinkler activation
The time that passes between the fire start and the sprinkler system releases water from the nozzles
is an important factor for systems effectiveness. If the time is too long the fire might have grown too
large for the system to be able to control it. To determine at what heat release rate the sprinkler
system looses the capability to control the fire, documented experiments are used.
In the large-scale tests performed at SP, one of the sprinkler systems delivered 5 mm/min as required
in resolution A.123(V). The system was activated after approximately 2:24 [min:sec]. At this point the
fire had reached a total heat release rate of 5 MW (Arvidson, 2009). A diagram showing the fire
development is shown in Figure 8.
Figure 8 Diagram showing the fire development when affected by a water density of 5 mm/min in the large-scale tests performed at SP (Arvidson, 2009).
As seen in Figure 8, the sprinkler system does not seem to have an immediate effect on the HRR, the
fire keeps accelerating but is eventually controlled after about five minutes after ignition. Since the
test set up has a potential HRR of 25 MW (Arvidson, 2009) the decrease is assumed to be due to the
effect of the sprinkler system rather than lack of fuel. The test indicates that this fire is at the limit of
what a sprinkler system with 5 mm/min can control. If the system was activated somewhat later than
in this case it is found likely to have failed in controlling the fire. A factor that is likely to affect a
sprinkler systems possibility to control a fire is the rate at which the fire is growing. A fire with a fast
growth, like the one used in the experiments on SP, is likely to be harder to control if the system is
activated at 5 MW than a fire with a slowly growing fire reaching 5 MW. One single experiment is not
evidence enough for a scientific proof of that 5 mm/min only can control fires less than 5 MW. But
considering the present level of knowledge on sprinkler systems and its effect on fires it is the best
0
2
4
6
8
10
12
0 5 10 15 20
He
at r
eal
eas
e r
ate
[M
W]
Time [min]
Total HRR, 5 mm/min

29
information available. The authors of this report have done extensive work on searching for data
from relevant large-scale experiments with sprinkler systems without result.
Based on the previous text a sprinkler system with 5 mm/min is assumed to be insufficient if a fire
reaches 5-10 MW before the system is activated. The probability is assumed to be a uniform
distributed. The aim for this chapter is to develop a critical time for sprinkler activation. Therefore
the HRR 5-10 MW is translated to a critical time via Equation 1 below.
Q =α∙t2 ⇔ 𝑡 = Q
α=
Distribution of maximum heat release rate
Distribution of α Equation 1
6.4.4 Results from simulations
All the distributions and other information about the simulations are summarized in Appendix C. The
results from @Risk indicate that a manual deluge system installed in accordance with Resolution
A.123(V) is capable of controlling most car fires but only a small percentage of the HGV fires. The
output from the Monte Carlo simulation indicates that the sprinkler system will be activated before
the critical heat release rate is reached in about 98 percent of the car fire incidents. However for the
fast growing HGV fire, the results from @Risk indicates it will activate in time for only 26 percent of
all the fire events.
Figure 9 and Figure 10, respectively, shows the results from @Risk. The figures are showing
distributions for time to sprinkler activation. On the horizontal axis, the time to sprinkler activation,
relative to the critical time to sprinkler activation is shown in seconds. A positive time means that the
sprinkler activated before the critical time. This means that in the figures the time 0 represents the
critical time and if reading 500 seconds in the figure this means that the sprinkler system was
activated 500 seconds before critical conditions. If reading -100 seconds this means that the sprinkler
system was activated 100 seconds after the critical time and the fire will not be controlled. The
height of each column represents the percentage of the simulated incidents for each time. The
percentages are given as fractions on the vertical axis. For percent, multiply the value with 100.

30
Figure 9 Distribution of “time margin” for car fire scenario
Figure 10 Distribution of “time margin” for HGV fire scenario
The system performance effectiveness is, based on the results presented above, set to 98 percent in
the event tree for the car fire and 26 percent for the HGV fire. This means that, given the sprinkler
system delivers the right discharge density and water distribution in case of fire, it will be able to
control 98 percent of all the car fires and 26 percent of all the HGV fires.
6.5 Consequence In this chapter each of the two severity levels are given a credible scenario that is acting as an
average damage to the ship and the passengers and crew. The consequences are expressed in terms
of economical loss and loss of lives.
Previously occurred accidents are the base for the creation of the average accident scenarios. Fire
accidents causing severe damages to ro-ro and ro-pax ships are rare and the details in reports from
31
these accidents are in many cases sparse. All the information of occurred incidents found is
summarized in Appendix D. Information was found in reports by DNV (2005) and BRE Fire and
Security (2006), a FSA posted by Denmark (IMO, 2008) and the web site www.faktaomfartyg.se
(Asklander, 2009). Only accidents due to fire on ro-ro ships are included, accidents reported in more
than one source only appear once in this summary. The period from 1991 to 2006 is covered and 27
incidents are included. Some accidents may not have been reported and does therefore not appear
in the statistics. Especially the category less serious would probably be more extensive if all accidents
were documented properly. All incidents are categorized in severe or less severe as defined in Table
15.
6.5.1 Less severe
In this severity level no lives are lost, if someone dies the accident is considered to be a severe
casualty (IMO, 2005). Therefore this chapter focuses on an economical loss caused by damages to
the ship and the goods. Due to the low level of detail of the incident reports presented in Appendix
D, it cannot be the only source when creating a credible consequence scenario for the level less
severe. Additional methods must be used to reach the aim of the chapter. A discussion with logical
arguments complements the incident reports.
The category less severe covers multiple consequences that can be graded and placed on a scale
measuring level of severity. First the limits for the category less severe accidents are defined. The
lower limit for the scale describing the less severe category is a near miss, a smoldering fire not
developing to a flaming fire for instance. The upper limit is an extensive damage to the structure of
the ship that does not make the ship unable to proceed. An example of such a scenario is a fire in a
HGV that rapidly reaches a high heat release rate, the sprinkler system is activated at the last minute
and the fire is controlled but not suppressed. All vehicles on the deck are destroyed and the steel
structure surrounding the vehicle decks is damaged due to the heat.
With the limits defined the remaining work is to find a casualty that is the most probable, an average
casualty representing the spectra of casualties in the category less serious. An accident causing the
chain of events that, in this report, is leading to a less severe consequence is as follows: Fire starts,
fire is detected, the sprinkler system is activated and the fire is suppressed or controlled. The time to
complete the chain is not of great length, meaning that the fire does not have a long time to grow.
The start object is most likely destroyed, the adjacent vehicles are probably severely damaged due to
heat radiation and the rest of the vehicles on the deck are smoke damaged needing to be sanitized.
Cables and a steel beam above the fire needs to be replaced, therefore the ship needs to be repaired
and is taken out of traffic.
To translate this credible scenario into a cost the Swedish company “LK Marconova AB” was
contacted. They made a rough estimation of the cost based on the scenario description. The Less
severe casualty was estimated to be 5.7 million SEK. There are lots of uncertainties in this value but it
gives a hint of the cost for a less severe casualty. For a more detailed description of which costs that
were included refer to Appendix F – Cost estimation for fire incidents.
6.5.2 Severe
The outcomes from this chapter are an economical loss and numerous of lives lost as a consequence
of the credible damage that is elaborated.
32
The number of incidents found in literature classified as severe are larger than the incidents classified
as less severe. The level of detail is also higher, many of the accidents includes numbers of lives lost.
Therefore the reported incidents are the base for the credible consequence although some
argumentation and logical reasoning is done as a supplement.
The spectrum of accidents covered by the category severe is wider than what the less severe
category covers. The upper limit is a total loss of the ship and all its passengers and crew. The lower
limit is basically the same as the upper limit for the category less severe, in other words a severe
damage to the structure of the ship that do not interfere with the ships ability to continue its route.
The lower limit also is any accident leading to a loss of life.
The first outcome that is assessed is the loss of lives. Since the category ranges from one lost life to a
loss of all lives onboard, care need to be taken when defining the scenario representing the category.
An extract from the incidents in Appendix D is reproduced in Table 14.
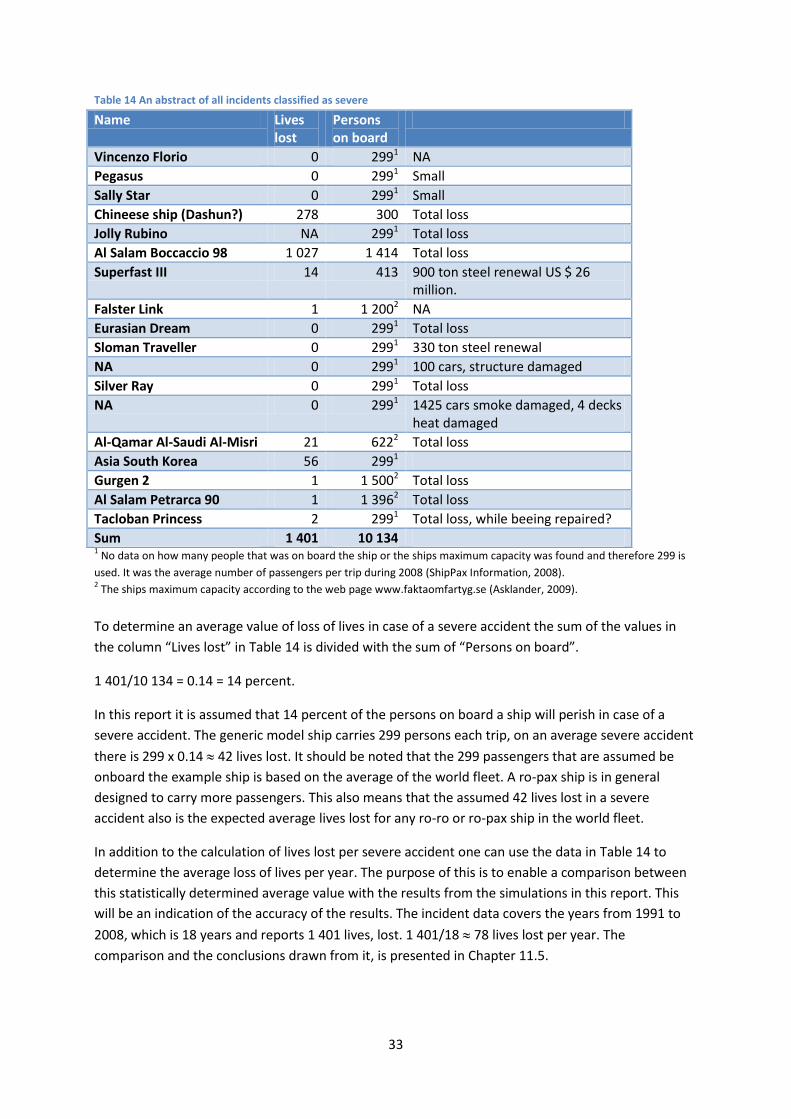
33
Table 14 An abstract of all incidents classified as severe
Name Lives lost
Persons on board
Vincenzo Florio 0 2991 NA
Pegasus 0 2991 Small
Sally Star 0 2991 Small
Chineese ship (Dashun?) 278 300 Total loss
Jolly Rubino NA 2991 Total loss
Al Salam Boccaccio 98 1 027 1 414 Total loss
Superfast III 14 413 900 ton steel renewal US $ 26 million.
Falster Link 1 1 2002 NA
Eurasian Dream 0 2991 Total loss
Sloman Traveller 0 2991 330 ton steel renewal
NA 0 2991 100 cars, structure damaged
Silver Ray 0 2991 Total loss
NA 0 2991 1425 cars smoke damaged, 4 decks heat damaged
Al-Qamar Al-Saudi Al-Misri 21 6222 Total loss
Asia South Korea 56 2991
Gurgen 2 1 1 5002 Total loss
Al Salam Petrarca 90 1 1 3962 Total loss
Tacloban Princess 2 2991 Total loss, while beeing repaired?
Sum 1 401 10 134 1 No data on how many people that was on board the ship or the ships maximum capacity was found and therefore 299 is
used. It was the average number of passengers per trip during 2008 (ShipPax Information, 2008). 2 The ships maximum capacity according to the web page www.faktaomfartyg.se (Asklander, 2009).
To determine an average value of loss of lives in case of a severe accident the sum of the values in
the column “Lives lost” in Table 14 is divided with the sum of “Persons on board”.
1 401/10 134 = 0.14 = 14 percent.
In this report it is assumed that 14 percent of the persons on board a ship will perish in case of a
severe accident. The generic model ship carries 299 persons each trip, on an average severe accident
there is 299 x 0.14 42 lives lost. It should be noted that the 299 passengers that are assumed be
onboard the example ship is based on the average of the world fleet. A ro-pax ship is in general
designed to carry more passengers. This also means that the assumed 42 lives lost in a severe
accident also is the expected average lives lost for any ro-ro or ro-pax ship in the world fleet.
In addition to the calculation of lives lost per severe accident one can use the data in Table 14 to
determine the average loss of lives per year. The purpose of this is to enable a comparison between
this statistically determined average value with the results from the simulations in this report. This
will be an indication of the accuracy of the results. The incident data covers the years from 1991 to
2008, which is 18 years and reports 1 401 lives, lost. 1 401/18 78 lives lost per year. The
comparison and the conclusions drawn from it, is presented in Chapter 11.5.

34
The second outcome of this chapter is the rate of damage to the ship. In 9 of the 18 incidents the
ships were declared total losses. This indicates that once a fire is out of control it is likely to cause
severe structural damage. An average ship damage is estimated to be 50 percent of the ship. All the
goods are lost in the fire.
As for the less severe casualty, the company “LK Marconova AB” was asked to provide a rough
estimation of the cost based on the scenario description. The cost for the severe casualty was
estimated to be 637.5 million SEK. There are lots of uncertainties in this value but it gives a hint of
the cost for a less severe incident. For a more detailed description of which costs that were included
refer to Appendix F – Cost estimation for fire incidents.
Table 15 A table giving an overview of the severities. Both the definitions from IMO and the credible consequences
elaborated by the authors of this report is shown
Less serious Serious Very serious Less severe Severe
IMO
de
fin
itio
ns All incidents that do not
qualify for "serious casualties" and "very serious casualties".
Immobilization of main engines, extensive accommodation damage, severe structural damage rendering the ship unfit to proceed.
Casualties to ships that involve total loss of the ship and/or loss of life.
Cre
dib
le
con
seq
ue
nce
Loss of start object and adjacent vehicles, smoke damages to vehicles at the same deck, structural damage to the construction surrounding the vehicle deck.
Fire cause severe damage to 50 percent of the ship. All persons evacuate ship except 42 persons that perishes. The fire is extinguished by a rescue team from ashore.
6.5.3 Event tree The event tree in Figure 11 below summarizes the probabilities for each step and presents the
probability for a severe and less severe incident in case of a fire a on ro-ro deck fulfilling the present
installation guidelines in Resolution A123.(V).

35
Figure 11 Event tree for deluge system installed in accordance with Resolution A.123(V)
6.5.4 Results
The results from the analysis of the present installation guidelines show that the expected cost per
ship and year for fires on ro-ro deck is approximately 126 000 SEK. The expected lives lost per ship
and year is 0.0081. Refer to Table 16 for a summary of the results.
Table 16 Summary of results from risk analysis
Fire frequency [fires per ship year]
Consequence
Probability for consequence [%]
Cost for fire incident [MSEK]
Lives lost
Expected total cost per ship year [MSEK per ship year]
Total expected lives lost per ship and year
0.0007 Severe 27.6 637.5 42
0.126 0.0081 Less severe 72.4 5.7 0
If the world fleet consists of 5 400 ship, the cost for the world fleet per year is expected to be 680
million SEK and the expected lives lost is 44 per year.
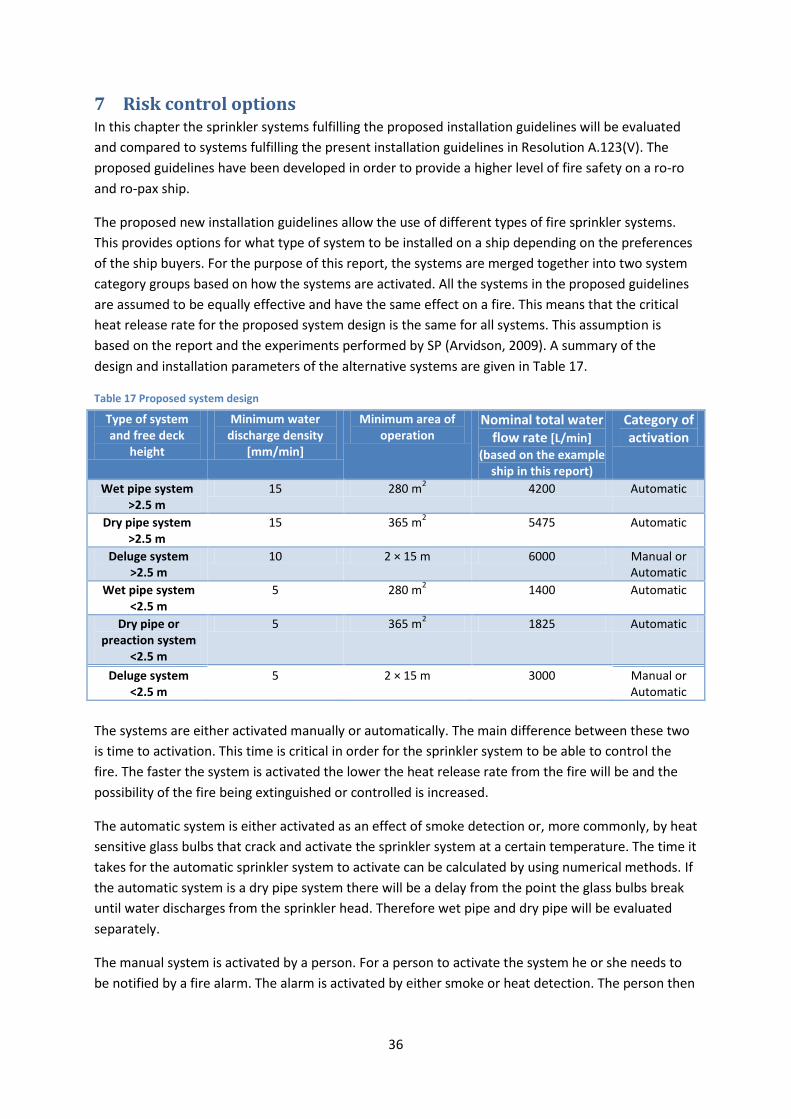
36
7 Risk control options In this chapter the sprinkler systems fulfilling the proposed installation guidelines will be evaluated
and compared to systems fulfilling the present installation guidelines in Resolution A.123(V). The
proposed guidelines have been developed in order to provide a higher level of fire safety on a ro-ro
and ro-pax ship.
The proposed new installation guidelines allow the use of different types of fire sprinkler systems.
This provides options for what type of system to be installed on a ship depending on the preferences
of the ship buyers. For the purpose of this report, the systems are merged together into two system
category groups based on how the systems are activated. All the systems in the proposed guidelines
are assumed to be equally effective and have the same effect on a fire. This means that the critical
heat release rate for the proposed system design is the same for all systems. This assumption is
based on the report and the experiments performed by SP (Arvidson, 2009). A summary of the
design and installation parameters of the alternative systems are given in Table 17.
Table 17 Proposed system design
The systems are either activated manually or automatically. The main difference between these two
is time to activation. This time is critical in order for the sprinkler system to be able to control the
fire. The faster the system is activated the lower the heat release rate from the fire will be and the
possibility of the fire being extinguished or controlled is increased.
The automatic system is either activated as an effect of smoke detection or, more commonly, by heat
sensitive glass bulbs that crack and activate the sprinkler system at a certain temperature. The time it
takes for the automatic sprinkler system to activate can be calculated by using numerical methods. If
the automatic system is a dry pipe system there will be a delay from the point the glass bulbs break
until water discharges from the sprinkler head. Therefore wet pipe and dry pipe will be evaluated
separately.
The manual system is activated by a person. For a person to activate the system he or she needs to
be notified by a fire alarm. The alarm is activated by either smoke or heat detection. The person then
Type of system and free deck
height
Minimum water discharge density
[mm/min]
Minimum area of operation
Nominal total water flow rate [L/min]
(based on the example ship in this report)
Category of activation
Wet pipe system >2.5 m
15 280 m2 4200 Automatic
Dry pipe system >2.5 m
15 365 m2 5475 Automatic
Deluge system >2.5 m
10 2 × 15 m 6000 Manual or Automatic
Wet pipe system <2.5 m
5 280 m2 1400 Automatic
Dry pipe or preaction system
<2.5 m
5 365 m2 1825 Automatic
Deluge system <2.5 m
5 2 × 15 m 3000 Manual or Automatic
37
manually opens up a valve to activate the sprinklers. The time it takes before the manual system is
activated therefore relies on the human factor and is hard to estimate.
There are strict routines on a ship how the staff is supposed to respond to a fire emergency. The time
to activation is evaluated and estimated based on those routines and also on expert judgment from
experts with experience of this type of incidents.
7.1 Automatic system An automatic sprinkler system is not directly dependent on a person in order to activate. Usually it is
activated by heat. Therefore an automatic system can be considered to be more reliable than a
manual because it is not relying on the actions of a human. However there is always indirectly a
human factor involved. The system needs to be designed, installed and maintained properly in order
to function. All these factors could potentially affect the performance and the reliability of the
system if not completed correctely. The automatic system can either be a wet pipe or a dry pipe
system. The main difference between them is that the wet pipe system is always filled with water.
The dry pipe system is pressurized with compressed air and the activation is delayed due to that the
pipes has to fill up prior to discharge.
7.1.1 Vehicle ratio
As discussed in Chapter 4.2, the ratio between cars and HGVs are approximately 86 percent and 14
percent. It is assumed that the probability for a fire to occur in a car and an HGV is the same.
7.1.2 System activation
The probability for system activation for automatic wet pipe and dry pipe sprinkler systems are well
documented. Given that there is a big enough fire to activate the system, a wet pipe system has a
reliability of 93 percent and a dry pipe 87 percent (Hall, 2006). In the remaining percent of the fire
incidents where the sprinkler system do not activate the consequence is assumed to be severe.
7.1.3 System performance effectiveness
The system performance effectiveness is based on time to activation and the sprinkler systems
capability to supress or to control the fire. If it takes to long before it activates the heat release rate is
allowed to increase to a level where the sprinklers no longer is capable of controlling the fire. The
maximum heat release rate that the system can control is described as an interval.
7.1.3.1 Time to sprinkler activation
The automatic sprinkler systems activate most commonly when exposed to heat. As the heat release
rate increases the temperature at ceiling level will increase and eventually activate the sprinklers.
The time it takes from the sprinkler system to activate depends on the fire growth and the sensitivity
of the glass bulbs, or similar heat sensitive mechanism. Also the ceiling height and the spacing of the
sprinklers are important. Therefore the time to activation will be calculated by utilizing computer
programs specifically developed for this purpose. The software is called DETACT T2 and is a free
software developed by NIST (2006). In the T2 version the heat release rate is described with an alpha
t-square function where the alpha value decides how fast the heat release rate increases.
The numbers the calculations are based on and the results are shown in Table 18 and Table 19.
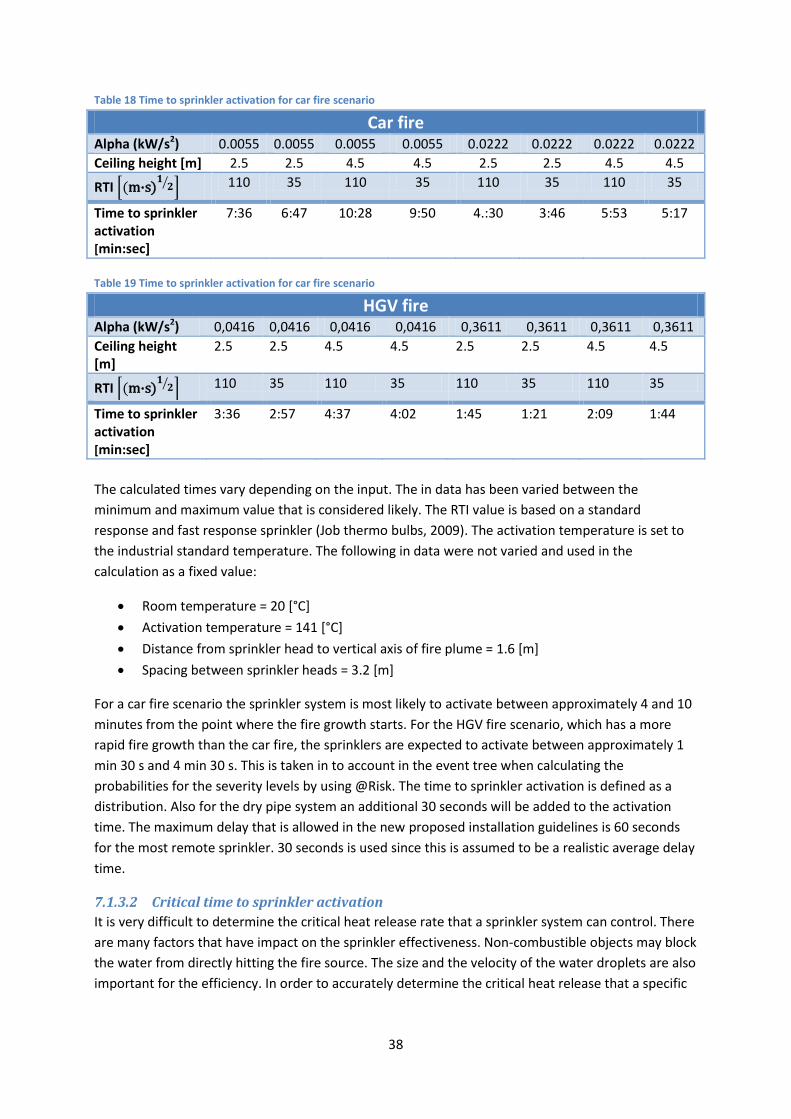
38
Table 18 Time to sprinkler activation for car fire scenario
Car fire Alpha (kW/s2) 0.0055 0.0055 0.0055 0.0055 0.0222 0.0222 0.0222 0.0222
Ceiling height [m] 2.5 2.5 4.5 4.5 2.5 2.5 4.5 4.5
RTI (m∙s)𝟏
𝟐 110 35 110 35 110 35 110 35
Time to sprinkler activation [min:sec]
7:36 6:47 10:28 9:50 4.:30 3:46 5:53 5:17
Table 19 Time to sprinkler activation for car fire scenario
HGV fire Alpha (kW/s2) 0,0416 0,0416 0,0416 0,0416 0,3611 0,3611 0,3611 0,3611
Ceiling height [m]
2.5 2.5 4.5 4.5 2.5 2.5 4.5 4.5
RTI (m∙s)𝟏
𝟐 110 35 110 35 110 35 110 35
Time to sprinkler activation [min:sec]
3:36 2:57 4:37 4:02 1:45 1:21 2:09 1:44
The calculated times vary depending on the input. The in data has been varied between the
minimum and maximum value that is considered likely. The RTI value is based on a standard
response and fast response sprinkler (Job thermo bulbs, 2009). The activation temperature is set to
the industrial standard temperature. The following in data were not varied and used in the
calculation as a fixed value:
Room temperature = 20 [°C]
Activation temperature = 141 [°C]
Distance from sprinkler head to vertical axis of fire plume = 1.6 [m]
Spacing between sprinkler heads = 3.2 [m]
For a car fire scenario the sprinkler system is most likely to activate between approximately 4 and 10
minutes from the point where the fire growth starts. For the HGV fire scenario, which has a more
rapid fire growth than the car fire, the sprinklers are expected to activate between approximately 1
min 30 s and 4 min 30 s. This is taken in to account in the event tree when calculating the
probabilities for the severity levels by using @Risk. The time to sprinkler activation is defined as a
distribution. Also for the dry pipe system an additional 30 seconds will be added to the activation
time. The maximum delay that is allowed in the new proposed installation guidelines is 60 seconds
for the most remote sprinkler. 30 seconds is used since this is assumed to be a realistic average delay
time.
7.1.3.2 Critical time to sprinkler activation
It is very difficult to determine the critical heat release rate that a sprinkler system can control. There
are many factors that have impact on the sprinkler effectiveness. Non-combustible objects may block
the water from directly hitting the fire source. The size and the velocity of the water droplets are also
important for the efficiency. In order to accurately determine the critical heat release that a specific

39
system can control and the time it takes to reach it, more extensive tests would need to be
performed.
The critical time to sprinkler activation for the proposed system is determined in a similar manner as
in the previous chapter and for the present system design. The time is described as a function of the
heat release rate which is described as an interval and not a fixed value. The interval is partly based
on the tests performed at SP. However the SP tests are insufficient by itself as evidence for a
maximum heat release rate that the system can control. Therefore other relevant tests are also used
in addition to the SP tests.
SP: Large-scale ro-ro deck fire suppression tests
In the SP test (Arvidson, 2009) different discharge densities were tested for a fast growing fire
simulating a fire in a HGV. The sprinklers were activated at a total heat release rate of approximately
5 MW and in one case the activation was delayed to the point where the fire reached 10 MW. In
Figure 12 the heat release rate curve for the tests are shown. The horizontal and the vertical lines
show when the system is activated. The tests indicate that the sprinkler system has an immediate
effect on the fire and that a discharge density of 10 mm/min is capable of easily controlling a fast-
growing fire at a point of 10 MW. After activation the heat release rate decays and the fire can be
considered to be under control. Note that the experiments were performed with deluge systems and
not automatic systems. If the tests were conducted with automatic systems as well the expected
result would not differ in any larger extent. An automatic system activates fewer nozzles to begin
with but will on the other hand initially deliver a significantly higher water flow since the minimum
flow is delivered when the minimum required area of operation is activated.
Figure 12 Total heat release rate curve for SP sprinkler tests
Based on these tests, it is assumed that a sprinkler system with a discharge density of 15 mm/min is
capable of controlling a fire larger than 10 MW.
Large Scale Fire Tests in the Second Benelux Tunnel
In the report, Large Scale Fire Tests in the Second Benelux Tunnel (Lemaire & Kenyon, 2006), multiple
tests were performed. The purpose of the report is to evaluate how sprinkler system works in case of
0
2
4
6
8
10
12
0 2 4 6 8 10 12 14 16 18 20
He
at r
ele
ase
rat
e [
MW
]
Time [min]
Total HRR for SP sprinkler test
15 mm/min 10 mm/min 10 mm/min (delayed activation)

40
a tunnel fire. The report includes multiple tests where cars and trucks have been set on fire and after
various times a sprinkler system with a discharge density of 12.5 mm/min was activated.
There are four scenarios in the report that are applicable on the ro-ro fire. In the report they are
referred to as 11, 12, 13 and 14. These tests include different kind of burning vehicles and they reach
a heat release rate between 7 MW and 15 MW. In all of the tests the sprinkler systems was capable
of controlling or fully extinguish the fire. This indicates that 12.5 mm/min is enough to control a 15
MW vehicle fire.
The test results shown above indicate that an automatic sprinkler system fulfilling the new proposed
guidelines is capable of controlling a very large fire, given that it delivers the flow and pressure it is
designed for. When a fire in a compartment with a relatively low ceiling height grows to a heat
release rate in the MW range the risk for fast fire spread to adjacent vehicles is very likely (Lemaire &
Kenyon, 2006). In order to set an approximate maximum heat release rate for the sprinkler system
the fire spread needs to be discussed.
The sprinkler system is likely to be able to handle a very large fire if the water distribution is ideal and
covers the whole area of the fire. It is important that the water covers the whole fire and that the
droplets have enough velocity to overcome the vertical flow of hot gasses and reach down in to the
flames and to the burning surfaces.
Due to the low ceiling height the water droplets are discharged right into the fire plume of a larger
fire. This means that the problem where the gas flow from the fire transports the water droplets
away from the plume and prevents the water from cooling the flames, can be disregarded.
For the automatic wet pipe and dry pipe sprinkler system, one sprinkler at the time will activate. The
fire could potentially spread even when the sprinkler is activated due to insufficient water
distribution. If the heat release rate is allowed to grow large it might not be lowered fast enough in
order to prevent fire spread either vertically to the deck above or horizontally to adjacent objects.
For example, when the ro-ro cargo ship Und Adriyatik caught fire the fire spread to the deck above
within 10-15 min (IMO, 2009). Therefore the maximum heat release rate that the automatic sprinkler
system is assumed to be capable of controlling in order to prevent severe consequences is between
15-30 MW. This is a rough estimation but is considered to be a reasonable interval because a larger
fire could potentially spread vertically even when the system has activated. The distribution of the
maximum heat release rate is taken into account in @Risk when calculating the critical time to
activation. Refer to 11.5 Risk analysis and risk control options for a discussion about the heat release
rate.
7.1.3.3 Results from simulation
All the distributions and other information about the simulations are summarized in Appendix C. The
results from @Risk indicate that the automatic sprinkler systems in the new proposed installation
guidelines are capable of controlling most of the fires that are likely to occur on a ro-ro deck. The
output from the Monte Carlo simulation indicates that the sprinkler system will activate before the
critical heat release rate is reached in almost 100 percent of the fire incidents. This result is not likely
to be a perfect description of the reality, one can not predict the future with a 100 percent certainty,
refer to Chapter 11.5 for a discussion on this matter. For the car fire scenario the sprinkler system is
activated well before critical conditions occur both for wet pipe and dry pipe systems. For the fast
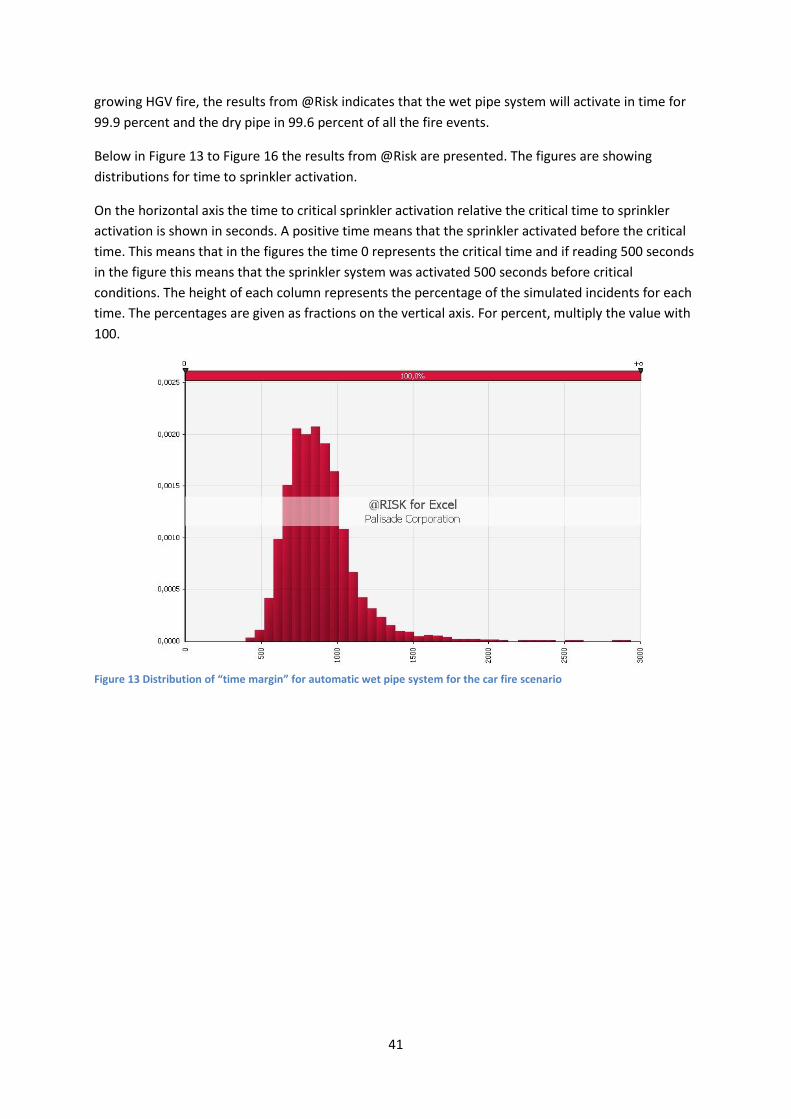
41
growing HGV fire, the results from @Risk indicates that the wet pipe system will activate in time for
99.9 percent and the dry pipe in 99.6 percent of all the fire events.
Below in Figure 13 to Figure 16 the results from @Risk are presented. The figures are showing
distributions for time to sprinkler activation.
On the horizontal axis the time to critical sprinkler activation relative the critical time to sprinkler
activation is shown in seconds. A positive time means that the sprinkler activated before the critical
time. This means that in the figures the time 0 represents the critical time and if reading 500 seconds
in the figure this means that the sprinkler system was activated 500 seconds before critical
conditions. The height of each column represents the percentage of the simulated incidents for each
time. The percentages are given as fractions on the vertical axis. For percent, multiply the value with
100.
Figure 13 Distribution of “time margin” for automatic wet pipe system for the car fire scenario
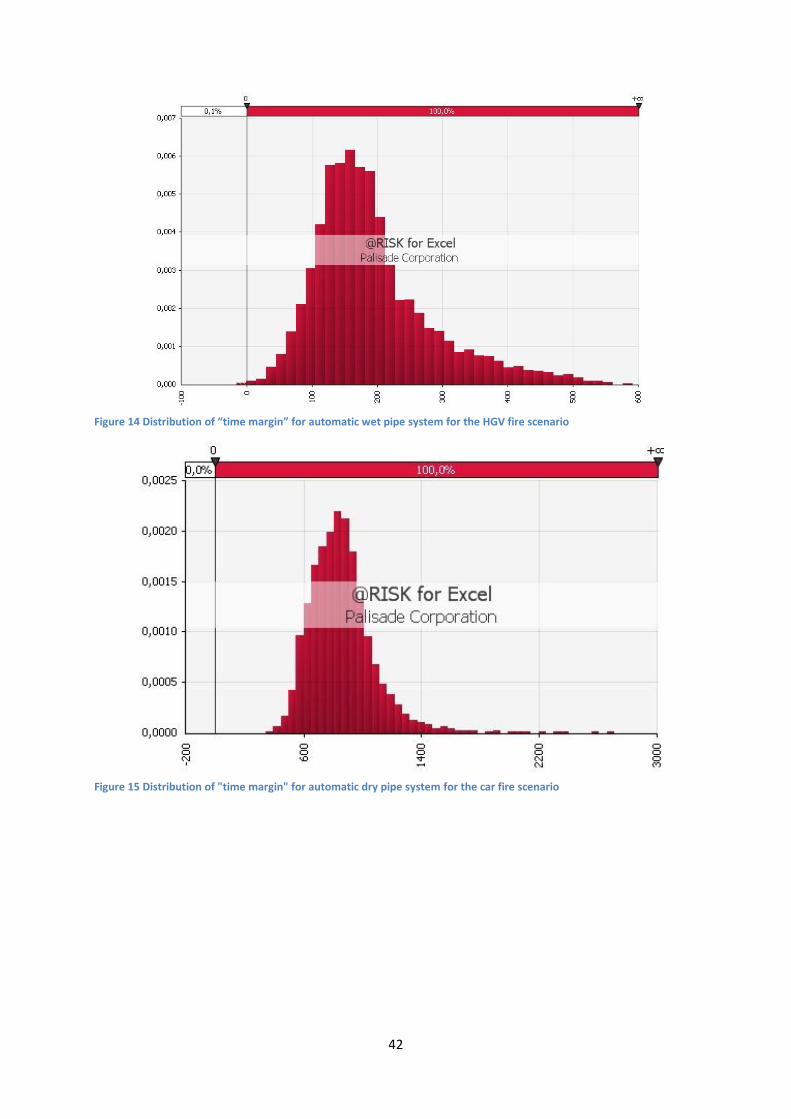
42
Figure 14 Distribution of “time margin” for automatic wet pipe system for the HGV fire scenario
Figure 15 Distribution of "time margin" for automatic dry pipe system for the car fire scenario
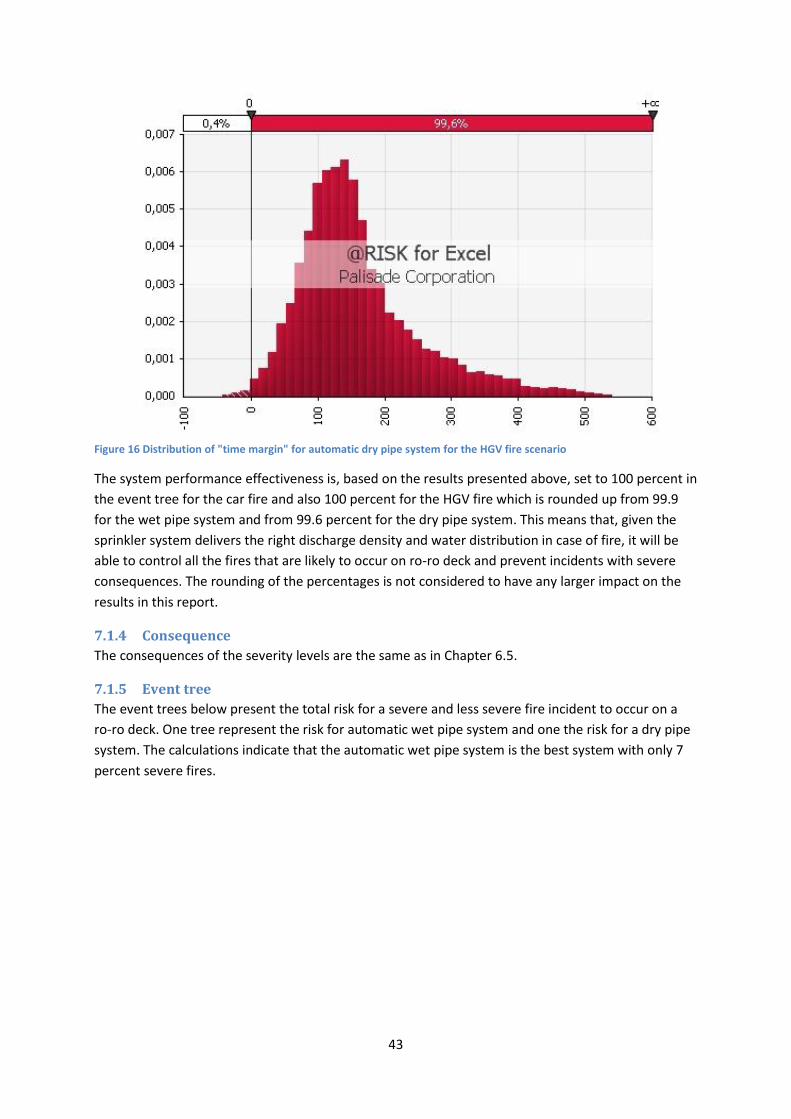
43
Figure 16 Distribution of "time margin" for automatic dry pipe system for the HGV fire scenario
The system performance effectiveness is, based on the results presented above, set to 100 percent in
the event tree for the car fire and also 100 percent for the HGV fire which is rounded up from 99.9
for the wet pipe system and from 99.6 percent for the dry pipe system. This means that, given the
sprinkler system delivers the right discharge density and water distribution in case of fire, it will be
able to control all the fires that are likely to occur on ro-ro deck and prevent incidents with severe
consequences. The rounding of the percentages is not considered to have any larger impact on the
results in this report.
7.1.4 Consequence
The consequences of the severity levels are the same as in Chapter 6.5.
7.1.5 Event tree
The event trees below present the total risk for a severe and less severe fire incident to occur on a
ro-ro deck. One tree represent the risk for automatic wet pipe system and one the risk for a dry pipe
system. The calculations indicate that the automatic wet pipe system is the best system with only 7
percent severe fires.

44
Figure 17 Event tree for proposed automatic wet pipe system
Figure 18 Event tree for proposed automatic dry pipe system
7.2 Manual system The manual sprinkler system that is presented in the new proposed guidelines is similar to the
present guidelines (IMO, 1967). The time to activation is the same as for all manual systems. The
main difference is the discharge density and the minimum area of operation. In the new proposal
there are two manual systems allowed as shown in Table 17. These two systems are assumed to be
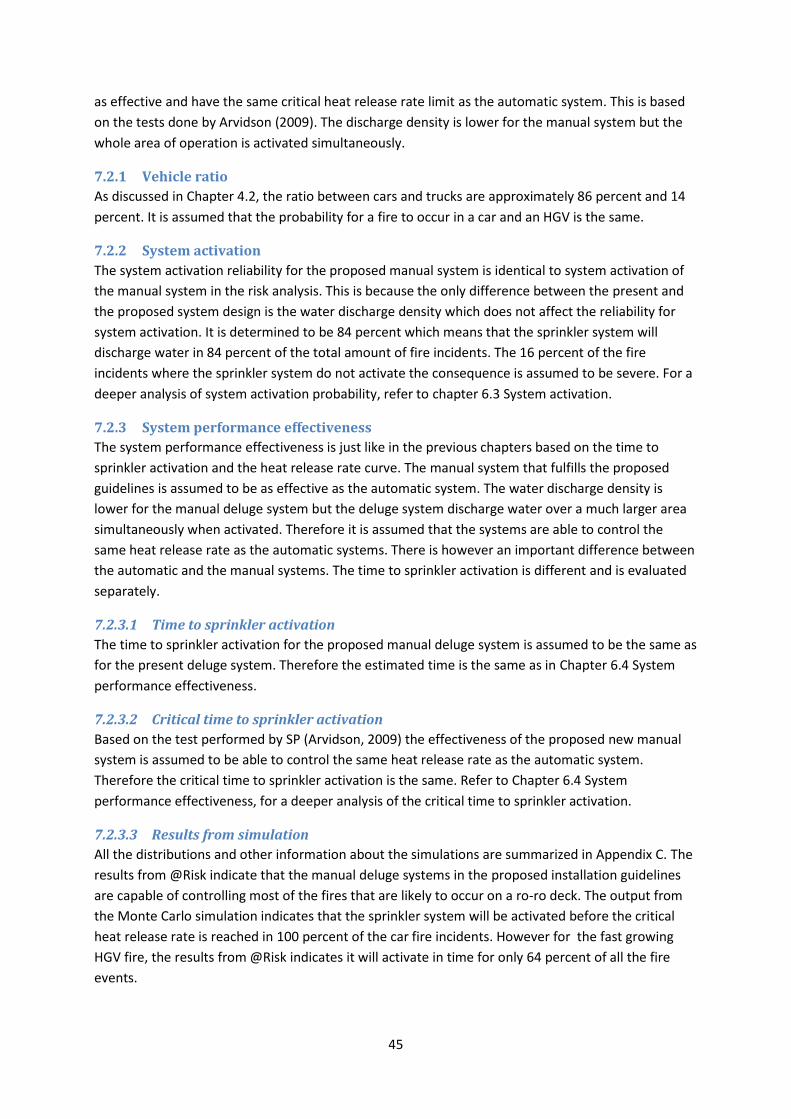
45
as effective and have the same critical heat release rate limit as the automatic system. This is based
on the tests done by Arvidson (2009). The discharge density is lower for the manual system but the
whole area of operation is activated simultaneously.
7.2.1 Vehicle ratio
As discussed in Chapter 4.2, the ratio between cars and trucks are approximately 86 percent and 14
percent. It is assumed that the probability for a fire to occur in a car and an HGV is the same.
7.2.2 System activation
The system activation reliability for the proposed manual system is identical to system activation of
the manual system in the risk analysis. This is because the only difference between the present and
the proposed system design is the water discharge density which does not affect the reliability for
system activation. It is determined to be 84 percent which means that the sprinkler system will
discharge water in 84 percent of the total amount of fire incidents. The 16 percent of the fire
incidents where the sprinkler system do not activate the consequence is assumed to be severe. For a
deeper analysis of system activation probability, refer to chapter 6.3 System activation.
7.2.3 System performance effectiveness
The system performance effectiveness is just like in the previous chapters based on the time to
sprinkler activation and the heat release rate curve. The manual system that fulfills the proposed
guidelines is assumed to be as effective as the automatic system. The water discharge density is
lower for the manual deluge system but the deluge system discharge water over a much larger area
simultaneously when activated. Therefore it is assumed that the systems are able to control the
same heat release rate as the automatic systems. There is however an important difference between
the automatic and the manual systems. The time to sprinkler activation is different and is evaluated
separately.
7.2.3.1 Time to sprinkler activation
The time to sprinkler activation for the proposed manual deluge system is assumed to be the same as
for the present deluge system. Therefore the estimated time is the same as in Chapter 6.4 System
performance effectiveness.
7.2.3.2 Critical time to sprinkler activation
Based on the test performed by SP (Arvidson, 2009) the effectiveness of the proposed new manual
system is assumed to be able to control the same heat release rate as the automatic system.
Therefore the critical time to sprinkler activation is the same. Refer to Chapter 6.4 System
performance effectiveness, for a deeper analysis of the critical time to sprinkler activation.
7.2.3.3 Results from simulation
All the distributions and other information about the simulations are summarized in Appendix C. The
results from @Risk indicate that the manual deluge systems in the proposed installation guidelines
are capable of controlling most of the fires that are likely to occur on a ro-ro deck. The output from
the Monte Carlo simulation indicates that the sprinkler system will be activated before the critical
heat release rate is reached in 100 percent of the car fire incidents. However for the fast growing
HGV fire, the results from @Risk indicates it will activate in time for only 64 percent of all the fire
events.
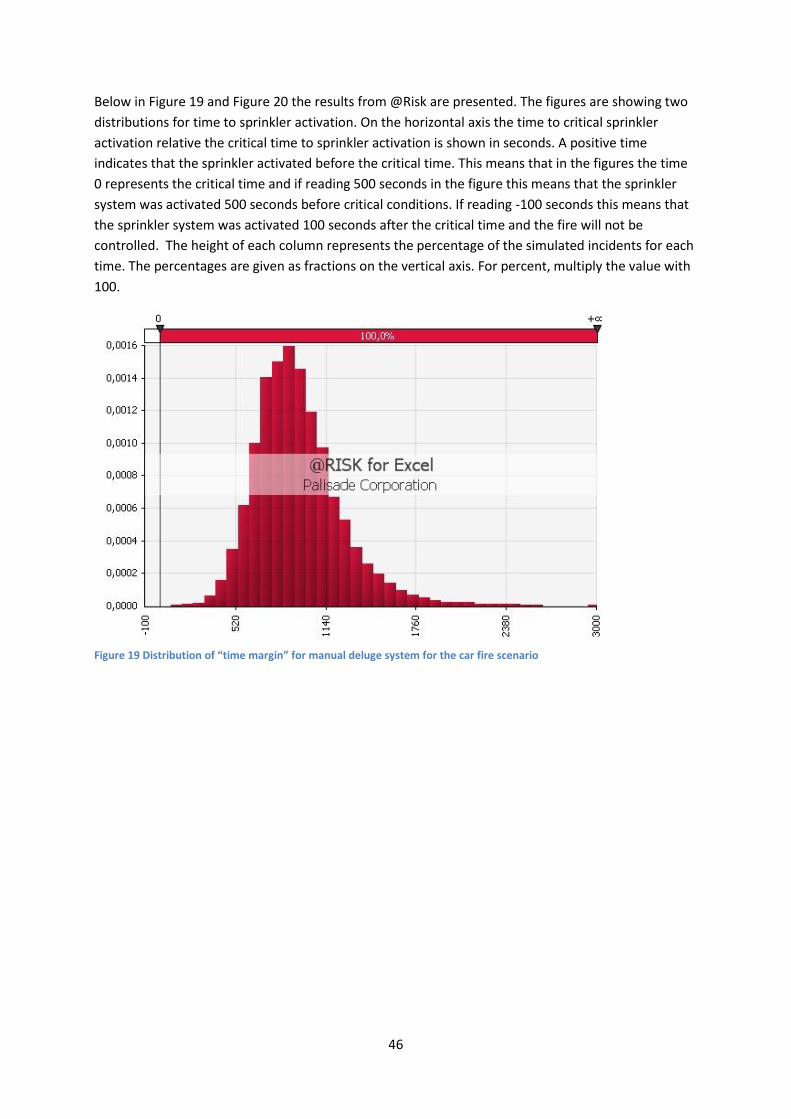
46
Below in Figure 19 and Figure 20 the results from @Risk are presented. The figures are showing two
distributions for time to sprinkler activation. On the horizontal axis the time to critical sprinkler
activation relative the critical time to sprinkler activation is shown in seconds. A positive time
indicates that the sprinkler activated before the critical time. This means that in the figures the time
0 represents the critical time and if reading 500 seconds in the figure this means that the sprinkler
system was activated 500 seconds before critical conditions. If reading -100 seconds this means that
the sprinkler system was activated 100 seconds after the critical time and the fire will not be
controlled. The height of each column represents the percentage of the simulated incidents for each
time. The percentages are given as fractions on the vertical axis. For percent, multiply the value with
100.
Figure 19 Distribution of “time margin” for manual deluge system for the car fire scenario
47
Figure 20 Distribution of “time margin” for manual deluge system for the HGV fire scenario
The system performance effectiveness is, based on the results presented above, set to 100 percent in
the event tree for the car fire and 64 percent for the HGV fire. This means that, given the sprinkler
system delivers the right discharge density and water distribution in case of fire, it will be able to
control 100 percent of all the car fires and 64 percent of all the HGV fires.

48
7.2.4 Consequence
The consequences of the severity levels are the same as in Chapter 6.5.
7.2.5 Event tree
The event tree below summarizes the probabilities for each step and presents the probability for a
severe and less severe incident in case of a fire a on ro-ro deck for the proposed manual system.
Figure 21 Event tree for proposed deluge system
7.2.6 Results
The results from the analysis of the risk control options show that the best option, based on reducing
the cost and lives lost due to fire incidents, is the wet pipe system. Refer to Table 20 for a summary
of the results from the analysis of the risk control options.
Table 20 Summary of results from risk control options
Fire frequency [fires per ship year]
System type
Consequence Probability for consequence [%]
Lives lost
Cost for fire incident [MSEK]
Expected total cost per ship year [MSEK per ship year]
Total expected lives lost per ship and year
0.0007
Automatic wet pipe
Severe 7.0 42 637.5 0.035
0.002058
Less severe 93.0 0 5.7
Automatic dry pipe
Severe 13.0 42 637.5 0.061
0.003822
Less severe 87.0 0 5.7
Manual deluge
Severe 20.2 42 637.5 0.093
0.005949
Less severe 79.8 0 5.7
49
For a world fleet of 5400 ships the expected cost due to fires on ro-ro deck is 189 MSEK per year for a
ship protected with a wet pipe system, 329 MSEK per year for dry pipe system and 504 MSEK per
year for manual deluge system. The expected lives lost based on the world fleet are 11, 21 and 32
per year.

50
8 Cost benefit assessment This chapter summarizes and compares the costs for the analyzed systems. The costs that are
included in the calculations are the costs of fire incidents as discussed in Chapters 6 and 7. Also, the
estimated cost for installing the system is included. The cost for maintaining the systems and other
costs that are likely to be the same for all systems are not included. Also the expected reduction in
loss of life for the different systems is taken in to account in the cost benefit assessment.
To calculate the installation cost for the different sprinkler systems the authors had help from
professionals from the Swedish company Brandskyddslaget AB. A complete presentation of the
communication with Brandskyddslaget AB is found in Appendix H. This company is a consulting firm
specialized in fire protection engineering including sprinkler design (Brandskyddslaget, 2009). They
helped to estimate the costs for installing the systems and also the costs for equipment such as
water pump and pipes. The estimated costs to install the different systems on the example ship
which has a total deck area of 6800 m2 are presented in Table 21.
Table 21 Cost for sprinkler systems
System type System cost [SEK/m2]
Water pump and sprinkler central [SEK/ship ]
Expected life length of sprinkler system [years]
Total annual system cost [SEK/ship and year]
Automatic wet pipe
200 450 000 50 36 000
Automatic dry pipe
300 450 000 25 100 000
Manual deluge (Proposed)
400 450 000 40 79 000
Manual deluge (Resolution A.123(V)
400 250 000 40 74 000
A human life cannot be valued in terms of money but there is however an acceptable cost limit for
how much it can cost to save one life. The cost for saving one life is by IMO called Net Cost of
Averting a Fatality (NCAF). The maximum NCAF is set to be 3 million US dollar (21 million SEK if 1 USD
= 7 SEK) for this particular type of analysis (IMO, 2007). The NCAF values are calculated with the
following equation:
𝑁𝐶𝐴𝐹 =𝑁𝑒𝑡 𝑐𝑜𝑠𝑡
∆𝑙𝑜𝑠𝑠 𝑜𝑓 𝑙𝑖𝑓𝑒=
∆𝑆𝑦𝑠𝑡𝑒𝑚 𝐶𝑜𝑠𝑡 − ∆𝐸𝑐𝑜𝑛𝑜𝑚𝑖𝑐𝑎𝑙 𝑙𝑜𝑠𝑠
∆𝐿𝑜𝑠𝑠 𝑜𝑓 𝑙𝑖𝑓𝑒=
𝑆𝑦𝑠𝑡𝑒𝑚 𝑐𝑜𝑠𝑡 𝑝𝑟𝑜𝑝𝑜𝑠𝑒𝑑 −𝑆𝑦𝑠𝑡𝑒𝑚 𝑐𝑜𝑠𝑡 𝑝𝑟𝑒𝑠𝑒𝑛𝑡 −(𝐸𝑐𝑜𝑛𝑜𝑚𝑖𝑐𝑎𝑙 𝑙𝑜𝑠𝑠 𝑝𝑟𝑒𝑠𝑒𝑛 𝑡−𝐸𝑐𝑜𝑛𝑜𝑚𝑖𝑐𝑎𝑙 𝑙𝑜𝑠𝑠 𝑝𝑟𝑜𝑝𝑜𝑠𝑒𝑑 )
𝐿𝑖𝑣𝑒𝑠 𝑙𝑜𝑠𝑡 𝑝𝑟𝑒𝑠𝑒𝑛𝑡 −𝐿𝑖𝑣𝑒𝑠 𝑙𝑜𝑠𝑡 𝑝𝑟𝑜𝑝𝑜𝑠𝑒𝑑
In Table 22, the expected values for system installation cost, expected economical loss due to fire
and expected loss of life are presented. Also the net cost and the NCAF value based on the manual
deluge system in Resolution A.123(V), is presented. The NCAF value is not necessarily a cost. For
example if the risk control option is less expensive than the original system and money is saved due
to a lower economical loss this results in that the NCAF turns out to be a negative value. This means
that a profit is made at the same time that lives are saved. If the NCAF turns out to be a negative
value it will be presented as a profit instead for a negative cost in the table below.

51
Table 22 Expected costs, loss of life and NCAF
System type System cost [SEK/ship and year]
Expected economical loss [SEK/ship and year]
Net cost [SEK/ship and year]
Expected loss of life [Life/ship and year]
NCAF [SEK/life]
Automatic wet pipe
36 000 34 948 -128 922 (Profit)
0.002058 -21 330 000 (Profit)
Automatic dry pipe
100 000 61 484 -38 386 (Profit)
0.003822 -8 968 000 (Profit)
Manual deluge (Proposed)
79 000 93 475 -27 395 (Profit)
0.005949 -12 721 000 (Profit)
Manual deluge (Resolution A.123(V)
74 000 125 870 NA 0.008102 NA
The table above indicates that the proposed systems would save both money and lives if approved
and adopted. The automatic dry pipe system and the proposed manual deluge system have a higher
annual cost than the present system. The reduction in economical loss due to fire incidents would
however compensate for that and the net cost indicates that a profit would be made. The proposed
systems would also reduce the lives lost with 25 to 75 percent depending on the system type. Based
on the whole world fleet, this turns out to be 12 to 23 lives saved compared to the present system.
The NCAF values are all showing a profit. What this really means is that there is not a cost related to
the reduction of lost lives. Money is actually saved at the same times as lives are saved. What the
NCAF is meant to do is to show how much it cost to save one life, but in this case it can be
interpreted as money saved for saving one life. The meaning of this interpretation needs to be
considered carefully because of the nature of the equation. For example if a new system reduced the
loss if life with only 1 percent, then the denominator in the equation would be very small and result
in a very large NCAF value. Therefore should an NCAF value that shows a profit, not be interpreted as
actually saved money.
The conclusions of the cost benefit assessment are that the calculated NCAF values are well below
the maximum NCAF of 21 MSEK per saved life. The proposed systems would actually result in a
reduction of the total annual cost and also the loss of life compared to the present system. It is
therefore considered to be profitable to adopt the proposed guidelines.
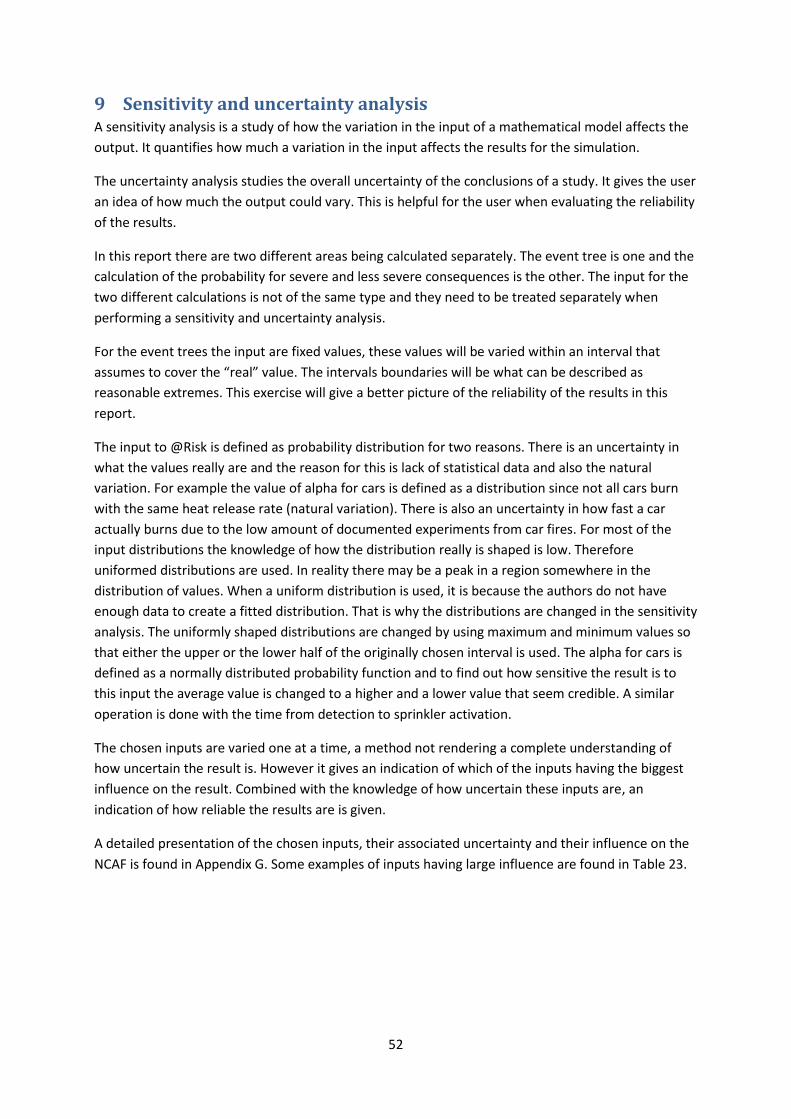
52
9 Sensitivity and uncertainty analysis A sensitivity analysis is a study of how the variation in the input of a mathematical model affects the
output. It quantifies how much a variation in the input affects the results for the simulation.
The uncertainty analysis studies the overall uncertainty of the conclusions of a study. It gives the user
an idea of how much the output could vary. This is helpful for the user when evaluating the reliability
of the results.
In this report there are two different areas being calculated separately. The event tree is one and the
calculation of the probability for severe and less severe consequences is the other. The input for the
two different calculations is not of the same type and they need to be treated separately when
performing a sensitivity and uncertainty analysis.
For the event trees the input are fixed values, these values will be varied within an interval that
assumes to cover the “real” value. The intervals boundaries will be what can be described as
reasonable extremes. This exercise will give a better picture of the reliability of the results in this
report.
The input to @Risk is defined as probability distribution for two reasons. There is an uncertainty in
what the values really are and the reason for this is lack of statistical data and also the natural
variation. For example the value of alpha for cars is defined as a distribution since not all cars burn
with the same heat release rate (natural variation). There is also an uncertainty in how fast a car
actually burns due to the low amount of documented experiments from car fires. For most of the
input distributions the knowledge of how the distribution really is shaped is low. Therefore
uniformed distributions are used. In reality there may be a peak in a region somewhere in the
distribution of values. When a uniform distribution is used, it is because the authors do not have
enough data to create a fitted distribution. That is why the distributions are changed in the sensitivity
analysis. The uniformly shaped distributions are changed by using maximum and minimum values so
that either the upper or the lower half of the originally chosen interval is used. The alpha for cars is
defined as a normally distributed probability function and to find out how sensitive the result is to
this input the average value is changed to a higher and a lower value that seem credible. A similar
operation is done with the time from detection to sprinkler activation.
The chosen inputs are varied one at a time, a method not rendering a complete understanding of
how uncertain the result is. However it gives an indication of which of the inputs having the biggest
influence on the result. Combined with the knowledge of how uncertain these inputs are, an
indication of how reliable the results are is given.
A detailed presentation of the chosen inputs, their associated uncertainty and their influence on the
NCAF is found in Appendix G. Some examples of inputs having large influence are found in Table 23.
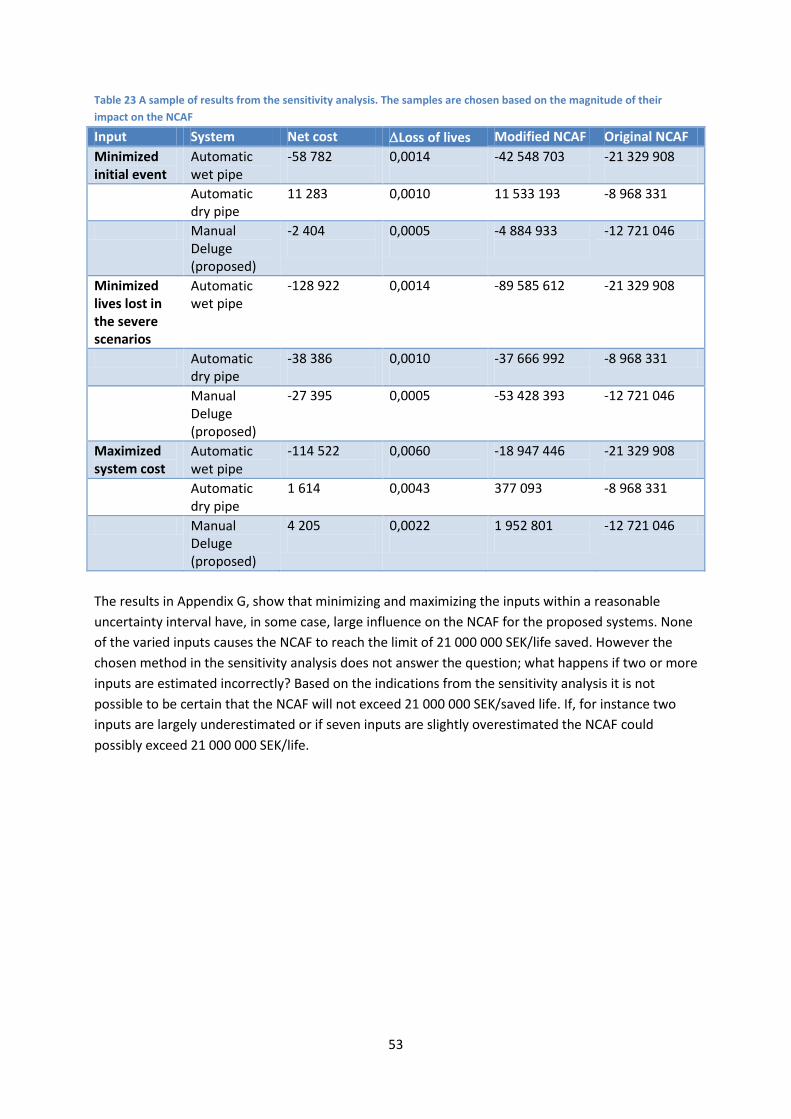
53
Table 23 A sample of results from the sensitivity analysis. The samples are chosen based on the magnitude of their
impact on the NCAF
Input System Net cost Loss of lives Modified NCAF Original NCAF
Minimized initial event
Automatic wet pipe
-58 782
0,0014
-42 548 703
-21 329 908
Automatic dry pipe
11 283
0,0010
11 533 193
-8 968 331
Manual Deluge (proposed)
-2 404
0,0005
-4 884 933
-12 721 046
Minimized lives lost in the severe scenarios
Automatic wet pipe
-128 922
0,0014
-89 585 612
-21 329 908
Automatic dry pipe
-38 386
0,0010
-37 666 992
-8 968 331
Manual Deluge (proposed)
-27 395
0,0005
-53 428 393
-12 721 046
Maximized system cost
Automatic wet pipe
-114 522
0,0060
-18 947 446
-21 329 908
Automatic dry pipe
1 614
0,0043
377 093
-8 968 331
Manual Deluge (proposed)
4 205
0,0022
1 952 801
-12 721 046
The results in Appendix G, show that minimizing and maximizing the inputs within a reasonable
uncertainty interval have, in some case, large influence on the NCAF for the proposed systems. None
of the varied inputs causes the NCAF to reach the limit of 21 000 000 SEK/life saved. However the
chosen method in the sensitivity analysis does not answer the question; what happens if two or more
inputs are estimated incorrectly? Based on the indications from the sensitivity analysis it is not
possible to be certain that the NCAF will not exceed 21 000 000 SEK/saved life. If, for instance two
inputs are largely underestimated or if seven inputs are slightly overestimated the NCAF could
possibly exceed 21 000 000 SEK/life.

54
10 Recommendations for decision-making The result in this report strongly indicates that it is cost-effective to approve the proposed guidelines
found in Appendix B - New proposed installation guidelines. In Table 24 the proposed systems are
ranked with the most cost effective system first.
Table 24 A ranking of the systems evaluated in this report. The numbers presented are reductions compared to the
present guidelines and calculated on the world fleet of ro-ro and ro-pax ships
Rank Proposed System type
Expected reduction of expenses [Million SEK per year]
Expected reduction of fatalities [Lives per year]
1 Automatic wet pipe 696 33
2 Automatic dry pipe 207 23
3 Manual deluge 148 12

55
11 Discussion In this chapter the method and development of this report will be discussed. All the choices and
assumptions done could potentially have an impact on the results. The authors of this report hope
that this discussion will give the reader an explanation to some of the questions that he or she might
have. It explains to the reader why certain assumptions and limitations have been made and how the
authors reason in their choices.
11.1 Method The method that this report follows is a quantitative method requested by IMO. It consists of
multiple steps where fire hazards are identified and then the sprinkler systems are evaluated based
on the identified hazards. This quantitative method requires assumptions to be made about the
properties of the fire hazard and the sprinkler systems evaluated. This means that for every
assumption made an uncertainty is introduced. Most of the uncertainties are taken into account by
using @Risk and to define distributions for the inputs.
The used method is considered by the authors to be the best available method for the time frame
and the budget of the project. An alternative method that was considered at the start-up phase of
the project was to let experts evaluate the proposed guidelines and base the efficiency of the
systems on the expert’s answers. The authors thought this method would be difficult to prove
reliable and that it would be difficult to find experts with enough experience to give a reliable
estimate of the system efficiency.
11.2 Delimitations The delimitations done could have an effect on the conclusions of this report. The first delimitation is
that the environmental impact of a fire incident onboard a ship is not accounted for. The cost for an
environmental impact such as an oil leakage could be very large, both in terms of money and
damages to the nature. If this was included, it could potentially change the recommendation for
decision making. If the impact on the nature could be lowered as an effect of a more effective
sprinkler system, this is of course a strong argument to reduce the risk for severe accidents even if
the economical costs are high.
Another simplification is that a manual fire fighting attempt is ignored in the calculations. This is
because it is only the sprinkler system that is under consideration and not the capability of the staff
to extinguish the fire. Also the manual fire fighting is independent of the design of the sprinkler
system and does not have an impact on the relative comparison that this report is. It is possible that
the number of severe fires might be lower if manual fire fighting was included but again, it is a
relative comparison and it is therefore ignored.
The method used include a step where the maximum heat release rate a sprinkler system is capable
of controlling is assumed. In this report all the proposed designs are assumed to be able to control
the same heat release rate which is set to be between 15 to 30 MW. The reason for assuming that all
the different systems are equally effective is that the systems are developed from similar
experiments and that they are used in the proposed recommendations as an equal level of
protection. This means that they all have to be as effective to maintain the same level of safety
disregarded of which one that are being used. The heat release rate 15-30 MW is questionable and is
hard to prove without actually test the systems and investigate what heat release rates they are
56
capable of suppressing or controlling. It also depends on what the fire scenario looks like and what
kind of object that are burning. The fire could for example be relatively small but shielded and
prevent water from reaching in to the flames. If this would be the case the fire would still be limited
and a fire spread to adjacent vehicles would be avoided when the system is activated due to cooling.
It is possible that an even larger fire could be controlled by the sprinkler system. Because of the time
it would take to reach a higher heat release rate than 30 MW this is still considered the point where
severe consequences will occur. If the maximum heat release rate was set to 100 or even 50 MW it
would take several minutes longer to reach. The fire could then spread to the deck above and cause
severe damages even though the fire would be controlled when the system activate. The maximum
heat release rate is therefore also motivated by the amount of time the fire is burning before the
system activates.
This report is based on work done by others and the conclusions are based on statistics from multiple
sources. There is little research done on sprinkler system performance on ro-ro deck and therefore
most of the data collected and used in this report are from other applications such as car parks and
roadway tunnels. There could be errors introduced when using data from a different field of
research. Ideally more research needs to be done on ro-ro deck specifically, to be confident with the
results of this report. However the data used in this report has been evaluated and used with caution
by the authors so that only information applicable on this report is used. If collected data was
questionable it was either not used or defined as an interval.
Small incidents are sometimes not included in the statistics. For example if a fire starts on a ro-ro
deck and the fire is extinguished by the staff in an early stage or if the fire is self extinguished before
it spreads, it might not be reported. This type of unreported incident is not included in this report.
Only incidents that generated a report which can be found in a database are included. This means
that there is most likely fire incidents that did occur but is not included in the analysis. The start
frequency in this report of a fire to occur on a ro-ro deck is too small. However if a fire incident is not
reported it is probably because it had minor consequences and did not cause any damages to the
ship. Therefore the incidents not included in the statistics are of minor meaning to the results of this
report.
Large liquid fires or large fires in hazardous materials are not included in this report. The reason for
that is first of all that there is no such incident to found in the statistics. Then there are strict rules for
how hazardous materials can be transported on ships. Most commonly they are transported on an
open deck which is not included in this report. The risk for such an incident is therefore considered so
small that it is not necessary to include in the analysis.
11.3 Problem definition In the problem definition the example ship and the ratio of cars and trucks is defined. The reason
why an example ship is defined is to have something to apply the cost calculations on. The ship is
based on today’s average ship and the ratio of today’s average percentages. The average numbers
are based on the world fleet of ro-ro and ro-pax ships and might not be a good representation for
some geographical areas where the ship traffic consists of much larger ships. The cost of a severe
incident could therefore be much larger or smaller depending on the type, age and size of the ship.
The ratio between HGV and cars is most likely different if looking at an individual ship. That is not the
57
purpose of this report and is not recommended. This report is again, based on statistic from the
world fleet and that needs to be considered before using the results of this report.
11.4 Identification of hazards The identification of hazards could have been done in many different ways. The way it was done in
this report was chosen mainly because of time and budget limitations. A more thorough
identification such as site visits could have been done where it would have been easier to identify fire
hazards onboard. However in the ranking process most scenarios would have been excluded from
the analysis since it includes the frequency of the incidents. There are by far more cars and HGVs
than anything else on a ro-ro deck and this means that those are the objects that are most likely to
be the burning object. It should also be noted that it is not necessarily the identified fire hazard that
is the origin of the fire but rather the object that are most likely to be on fire. The fire could be
ignited by something else such as a cigarette.
The ranking of the fire hazards was done by the authors of this report. It was based on their own
judgment and information gathered from statistics and reports. Other people may not agree on the
index numbers that the different hazards were given. Then again, the two scenarios that were
chosen to be included in the analysis are considered to be much more likely to occur and have the
potential to cause severe consequences then the others. Therefore the authors believe that most
people would rank car and HGV fire as the top two hazards and the ranking of the other hazards are
of less importance.
When the design fires were estimated, multiple test reports were used in order to create a heat
release rate curve that represents a car and HGV fire. However the heat release rate may be larger or
smaller for individual vehicles. The design fires used are believed to represent the average vehicles
that are transported on a ro-ro deck. The heat release rate curves were still designed in a
conservative way. There are usually a longer time prior to the point where flames are visible and the
heat release rate start to grow. This means that smoke detection would occur earlier with respect to
the heat release rate. In reality there could be a slower increase in heat release rate and therefore
more time for the staff to activate the sprinkler system before critical conditions take place.
It could potentially be the other way around than discussed above too. A fire could start in a closed
space and not be detectable in the initial fire stage. For example if the fire starts inside a closed car
and then a window breaks, the heat release rate could be high and the critical point might be
reached earlier than expected. This is however considered to be a very unlikely scenario.
11.5 Risk analysis and risk control options The start frequency for a fire on a ro-ro deck is estimated in the risk analysis chapter and is used for
all the systems evaluated. The frequency does not have an effect on the evaluation of how well the
sprinkler systems function but is important for the cost analysis. The higher the fire frequency is the
higher the annual costs from fires will be. The frequency was estimated based on statistics but in
some cases the frequency was given for a fire anywhere on the ship and not specifically on ro-ro
deck. Therefore it had to be modified to represent fires on ro-ro deck only. It was assumed that 8
percent of all fires start in cargo spaces.
It is assumed for all the evaluated scenarios that the probability for a fire to start in a car and an HGV
is the same. This is an assumption made by the authors based on very little evidence to verify that it
58
is true. This could of course have an effect on the analysis if in reality it is more likely that a fire
starts, for example, in an HGV.
As discussed before it is not always the case that the object that is on fire is the cause of igniting the
fire. This justifies the assumption that it is as likely that a car and an HGV is on fire. For example, a
person might drop a cigarette or something else that could be the source of ignition and start a fire in
a vehicle. Then it is the ratio of vehicle types that decides the risk of what type of vehicle that will
burn. Due to the time limit of this project this matter was not researched any further. In order to
justify this assumption with stronger evidence, more research needs to be done.
The system activation reliability for the deluge systems is set in the risk analysis. This number is
based on statistics from other types of uses than on a ship or ferry, such as industrial and storage
occupancies. There is no such statistics available for sprinkler systems on a ship. It is possible that
factors such as redundancy and type of pump is different on a ship compared to an industrial facility
and would change the activation reliability. Systems installed ashore are generally pressurized from
the public water supply system. This is not the case for a system on a ship. It is pressurized by one or
many water pumps. This means that the activation reliability could be lower on a ship than the
statistics from land systems indicate. The authors of this report believe that the information used
both for manual and automatic wet pipe and dry pipe systems is the best available statistic to apply
on this specific matter.
The time from detection to sprinkler activation for the manual systems is a factor that most likely
varies depending on the type and size on a ship. The time was estimated by asking experts what their
personal opinion was. The answers from the experts vary in a span of several minutes. The authors
believe that the reason for this is that the experts have experience from different types of ships.
Therefore the interval used on the report is believed to be a good representation of the average time
it takes to manually activate the sprinkler system in case of fire. The distribution of the time is based
on relatively few answers and could turn out differently if more experts were asked. It is not likely
that it would be a dramatic change and impact on the results.
As discussed in 11.2, the maximum heat release rate that the sprinkler system is capable of
controlling is set based on little information. This could be possible error that could affect the results.
It is however defined as a rather large interval and should cover the variation of the actual maximum
heat release rate. It is believed that the used interval of maximum heat release rate is a good
estimation that gives reliable results.
Some of the monte carlo simulations result in a system performance effectiveness of 100 percent,
see Figure 13 for an example. It is not possible to predict these kinds of outcomes with a 100 percent
certainty. There might be conditions that the authors of this report have failed to cover in the
analysis that lead to severe consequences. For instance metal fires are not extinguished by water,
these fires are not taken account for in this report. Another reason that caused the 100 percent
result is the assumptions on the uniform probability distributions. Many of the distributions assumed
to have a uniform distribution are most likely normal distributions. This leads to that the extreme
values are “cut off” and excluded in the further analysis. This problem is not considered to be of
great importance since this study is a comparative analysis. The extreme outcomes have been
excluded in both the analysis of the present and the proposed guidelines.
59
In this report one of the outcomes is the expected loss of lives per year for the world fleet of ro-ro
and ro-pax, this is calculated to be 44 lives per year.
To get an indication of the reliability of this outcome it can be compared to the statistical loss of lives
that is 78 lives lost per year based on data from incident reports. This is judged to be a reasonable
difference, to achieve an exact match would require more detailed and sophisticated methods than
used in this report. Furthermore the statistically determined value cannot be considered as a true
value, the data covers 18 years and cannot be considered to be complete. The fact that the value
determined in this report is lower than the statistical only strengthens the conclusion drawn in this
report. If more lives is lost per year than our calculations shows it is even more cost-beneficial to
approve the proposed guidelines since the systems prescribed is more effective than the system in
the present guidelines.
11.6 Cost benefit assessment The cost of a severe and a less severe incident is estimated by an insurance company. It is believed to
represent the cost of today’s average ship and need to be used with caution in the future. The
average ship will most likely be larger and more expensive in the future. Also the cost used is a rough
estimation and should not be used for any other purpose than for the purpose of this report. It only
gives a hint on what affect the new installation guidelines have on the costs of a fire incident.
As far as the installation and system cost, this is also a rough estimation done by a consulting firm. It
is based on costs for installing sprinkler systems in other applications than ships. It is assumed that
the estimated cost is applicable on a ship as well. To make this cost estimation more reliable a
detailed cost calculation on the specified example ship would need to be done. This is however not
possible within the time frame of this project.
The cost benefit assessment is the only chapter taking account for redundancy pumps in the
proposed systems. That is why the cost for water pump and sprinkler central is higher for the
proposed systems. This inconsistence is due to the fact that the proposal was not completely worked
out when the work with this report began. The demand on redundancy pumps were established late
in the process of creating this report. However this is not something that changes the
recommendation for decision-making. If the redundancy pump were to be taken into account earlier
in this report it would cause a larger difference between the system activation reliability for the
present and the proposed systems. This would lead to a strengthening of the conclusion that it is
cost-beneficial to adopt the proposal.
11.7 Sensitivity and uncertainty analysis The sensitivity analysis indicates that there is a possibility for the NCAF to exceed the limit of
21 000 000 SEK. However the sensitivity analysis does not give a value of the magnitude of this
possibility. If such a measure were available a conclusion without reservations would be more easily
produced.
Uncertainty in input is one of the reasons behind the difficulties in determining a decision-making
recommendation. Other reasons are found when analyzing the order of magnitude on the
parameters in the equation for NCAF. The numerator consists of System Cost and Economical
Loss, if one of those would largely exceed the other the result would not be as sensitive to changes
as it is in the case with this report. If, for instance, System Cost were 10 times the size of

60
Economical Loss it would not affect the NCAF greatly if one of the parameters were inaccurately
estimated.
The denominator in the equation for NCAF is Lives Lost, if this number were higher than in this
report the NCAF would be more constant. Refer to Figure 22 for an illustration of how sensitive NCAF
is for changes in Lives Lost.
Figure 22 An example of how NCAF could vary with a varying delta Lives Lost if the nominator was fixed. In this example values from the proposed manual deluge system is used on the world fleet. Originally delta Lives Lost is 11 per year but when changing the input Lives lost in the severe scenario the impact on NCAF is large.
11.8 Recommendation for decision-making Based on the cost benefit analysis it is profitable, not only from an economical but also from a life
saving point of view, to adopt the proposed guidelines. But not all of the proposed systems are as
cost effective. If only one system would be suggested it is the wet pipe system. It is clearly the best
system compared to the other two alternatives. It is the most effective system in terms of fire
extinguishing capability and it is less expensive than the other systems. Both the dry pipe and the
manual deluge system are having a lower reliability, a shorter expected life length and higher
installation cost than the wet pipe system.
-16
-14
-12
-10
-8
-6
-4
-2
0
0 20 40 60 80 100
NC
AF
[Mill
ion
SEK
]
delta Lives Lost [lives/year]
Schematic illustration of the sensitivity of NCAF
61
12 Bibilography Arvidson, M. (2009). Large-scale ro-ro deck fire suppression tests. Borås: SP Technical Research
Institute of Sweden.
Asklander, M. (2009). Register, Här finns dom flesta namn på fatyg med som finns på sidan. Retrieved
11 04, 2009, from Välkommen till Fakta om Fartyg: http://www.faktaomfartyg.se/register.htm
Backman, J. (2008). Rapporter och uppsatser. Lund: Studentlitteratur.
Brandskyddslaget. (n.d.). Retrieved 11 26, 2009, from Brandskyddslaget:
http://www.brandskyddslaget.se/
BRE Fire and Security. (2006). Assessment of the fire behavior of cargo loaded Ro-Ro vehicle decks in
relation to the design standards for fire suppression systems. BRE.
BRE Fire and Security. (2007). Fire spread in car parks. BRE.
Bukowski, R. W., Budnick, E. K., & Schemel, C. F. (1999). Estimates of the Operational Reliability of
Fire Protection Systems. International Conference on Fire reaserch and Engineering. Third
proceedings. (pp. 87-98). Boston: Society of Fire Protection Engineers.
DNV. (2005). Fires on Ro-Ro decks, Paper series NO. 2005-P018. Oslo: Det Norske Veritas.
ECCS-Technical Committee. (1993). Fire safety in open car parks. Brussel: ECCS.
Ejvegård, R. (2007). Vetenskaplig metod. Lund: Studentlitteratur.
Hakkarainen, T., Hietaniemi, J., Hostikka, S., Karhula, T., Kling, T., Mangs, J., et al. (2009). Survivability
for ships in case of fire. Vuorimiehentie: VTT Technical Research Centre of Finland.
Hall, J. R. (2006). An Analysis of Automatic Sprinkler System Reliability Using Current Data. Quincy:
National Fire Protection Association.
IAEA. (2001). Severity, probability and risk of accidents during maritime transport of radioactive
material. Vienna: Radiation Safety Section International Atomic Energy Agency.
IMO. (2005). Casualty related matters. Reports on marine casualties and incidents. MSC-
MEPC.3/Circ.1 (p. 2). London: International Maritime Organization.
IMO. (2009). Fire on board the ro-ro cargo ship “Und Adriyatik”. London: International Maritime
Organization.
IMO. (2007). Formal safety assessment, Consolidated text. London: International Maritime
Organization.
IMO. (2008). FSA – RoPax ships MSC 85/17/2. Denmark.
IMO. (2002). Guidelines for formal safety assessment (FSA) for use in the rule-making process.
London: International Maritime Organization.

62
IMO. (2009). Marine Casualties and Incidents. Retrieved 09 25, 2009, from Global Integrated Shipping
Information System: http://gisis.imo.org/Public/MCI/Default.aspx
IMO. (1967). Resolution A.123 (V). Recommendation on fixed fire extinguishing systems for special
spaces .
IMO. (1967). Resolution A.123(V). Recommendation on fixed fire extinguishing systems for. London:
International Maritime Organization.
Ingason, H. (2006). Design fires in tunnels. Borås: SP Technical Research Institute of Sweden.
International Cargo Vessels. (2007, 03 24). International Cargo Vessels - Pure Car & Truck Carrier
(PCTC)/Silver Ray (IMO7807811). Retrieved 09 25, 2009, from International Cargo Vessels:
http://www.cargo-vessels-international.at/SILVER_RAY_IMO7807811.pdf
Job thermo bulbs. (2009). Technical Data - JOB GmbH. Retrieved 10 23, 2009, from JOB GmbH:
www.job-bulbs.com
Katsuhiro, O. (2009). Burning behavior of sedan passenger cars. Fire Safety Journal , 301-310.
Lemaire, T., & Kenyon, Y. (2006). Large Scale Fire Tests in the Second Benelux Tunnel. Delft, The
Netherlands: Centre for Fire Research.
Lemaire, T., & Kenyon, Y. (2006). Large Scale Fire Tests in the Second Benelux Tunnel. Fire Technology
, 329-350.
Li, Y. (2005). Cost-benefit analysis of sprinkler for property protection in New Zealand parking
buildings. Canterbury, New zealand: Baywood Publishing Co. Inc.
Lloyd's Register of Shipping. (2008). World casualty statistics. London: Lloyd's Register of Shipping.
Lloyd's Register of Shipping. (2008). World fleet statistics. London: Lloyd's Register of Shipping.
Nilsson, D., & Holmstedt, G. (2008). Compendium of Fire detection and suppression – Detection.
Report 7030. Lund: Lund University.
NIST. (2006, 08 22). BFRL: Fire Modeling Programs. Retrieved 10 19, 2009, from NIST:
http://www.bfrl.nist.gov/866/fmabbs.html
ShipPax Information. (2008). ShipPax MARKET 09: Market reports & outlook for ferry, cruise, ro-ro
and hi-speed. Halmstad: ShipPax Information.

Appendix A – General method
General method The traditional way of developing and writing a scientific report is to start off by looking at something
with an objective perspective and develop a hypothesis and a problem formulation. The main goal,
after creating the hypothesis, is to try to demonstrate that your hypothesis is either true or false.
There are two main approaches to do this, either to show it numerically or by using words. When
mathematical formulas and statistics are used, the method is called the quantitative method. The
other one is called the qualitative method and here is only words used for presenting the results
(Backman, 2008). It is easier for the author to plan the work if a problem formulation is developed
and a plan for how the questions in the formulation are to be answered. Figure 23 below illustrates
the general method procedure. The traditional research project includes the following steps:
Literature study First of all a literature study needs to be done. This is where the author researches a certain field.
This gives knowledge about the subject and what work and research that has been done previously
by other people. This prevents the author from doing something that has already been done. It can
also give the author help with the question formulation.
Question formulation and hypothesis The next step is to create the hypothesis and think about what questions that needs to be answered.
This is where the problem is formulated and narrowed down to a reasonable amount of work for the
size of the project. The hypothesis can be written as a “preliminary” answer, or answers, to a
question.
Observations The next step is where testing will be done, if necessary, depending on the nature of the matter
being researched. However testing is not always necessary. For some projects collecting data and
statistic material from experiments preformed by others is enough. It is important that the data and
information that is collected and used as references in the report is accurate and trustworthy. The
sources where the information is gathered needs to be trusted as a reliable source and it needs to be
documented in the report so that a reader can easily find the source if necessary. The information
should also be covering the subject from different angles. This is to prevent that information which
could be important for the outcome of the report is left out (Backman, 2008).
Analysis The information that is collected is then to be analyzed and conclusions to be drawn. There are
different methods for this in order to have a scientific approach depending on what the main
objective with the report is. Some examples are: description, case study, classification, quantification,
hypothesis testing, model building, comparison and prediction (Ejvegård, 2007). It is important to
organize data to make it possible to analyze and evaluate what it means for the hypothesis.
Interpretation This part is in close relation to the analysis. This is where the author looks at the organized data and
draw conclusions from it. This should be done thoroughly and carefully in order for the whole project
to be successful.

Report The final step is to document all the work that has been done in a report. The report should be
written in such way that it explains all the previous steps so that someone else can understand the
problem and replicate the project if necessary. The report is critical to allow for others to take part of
the results and conclusions. It is the authors’ responsibility to do this in an understandable way.
Figure 23 An illustration of the traditional method for a scientific project.
Literature study
Hypothesis
Observation
Analysis
Intepretation
Report
Appendix B - New proposed installation guidelines These guidelines have not been published and are only a draft and not the final document.
Draft guidelines for the approval of fixed water-based
fire-fighting systems for ro-ro spaces and special category
spaces
General
1. These installation guidelines are intended for the approval of fixed water-based fire-fighting systems for open and closed ro-ro spaces and special category spaces defined in SOLAS regulations II-2/3.12, II-2/3.46, II-2/3.35 and II-2/3.49, respectively.
2. Equivalent systems may be used, given that that they fulfill the principle requirements of this document and provides equal fire suppression and fire control capabilities.
Definitions
3. Area of operation: The hydraulically most demanding design area for the system expressed in m2 or as a width and length.
4. Automatic nozzle or sprinkler: A single- or multiple orifice water discharge device that activates automatically when its heat-activated element is heated to its thermal rating or above, allowing water under pressure to discharge in a specific, directional discharge pattern.
5. Automatic system: A system utilizing either automatic sprinklers or nozzles or a system that is automatically activated by the signal from a separate fire detection system.
6. Deluge system: A system employing open nozzles or sprinklers attached to a piping system connected to a water supply through a valve that is opened either by the operation of a separate fire detection system installed in the same area as the nozzles or sprinklers or manually. When the valve opens, water flows into the piping system and discharges from all open nozzles or sprinklers attached thereto.
7. Dry pipe system: A system employing automatic sprinklers or nozzles attached to a piping system containing air or nitrogen under pressure, the release of which (as from the activation of a sprinkler or nozzle) permits the water pressure to open a valve known as a dry pipe valve. The water then flows into the piping and discharges from the nozzles or sprinklers activated by heat from a fire.
8. Equivalent system: A system fulfilling the principle requirements of this document, but providing minimum water discharge densities that are other than prescribed.
9. Fire control: Limiting the size of a fire by distribution of water so as to decrease the heat release rate and pre-wet adjacent combustibles, while controlling gas temperatures and reducing heat radiation to prevent structural damage and fire spread.

10. Fire suppression: Sharply reducing the heat release rate of a fire and preventing its regrowth by means of direct and sufficient application of water through the fire plume to the burning fuel surface.
11. Open nozzle or sprinkler: An open single- or multiple orifice water discharge device that, when discharging water under pressure, will distribute the water in a specific, directional discharge pattern.
12. Pump: A single water pump, with its associated driver and control or an individual pump within a pump unit.
13. Pump unit: A single water pump, or two or more pumps connected together to form a unit, with their associated driver(s) and controls.
14. Preaction system: A system employing automatic sprinklers or nozzles attached to a piping system containing air that may or may not be under pressure, with a supplemental fire detection system installed in the same area as the sprinklers or nozzles. Activation of the fire detection system opens a valve that permits water to flow into the system piping and to be discharged from any sprinkler or nozzle that may be open.
15. Water: Fresh water or natural seawater, with or without an antifreeze solution and/or additives to enhance the fire suppression capability.
16. Water discharge density: The unit rate of water application to an area or surface expressed in mm/min (equal to (L/min)/m2).
17. Wet pipe system: A system employing automatic sprinklers or nozzles attached to a piping system containing water and connected to a water supply so that water discharges immediately from sprinklers or nozzles activated by heat from a fire.
Principal requirements of the system
18. The system may be automatically activated, automatically activated with provisions for manual activation or manually activated. Automatic systems should be approved by the Administration, taking into account the implications of such activations.
19. Wet pipe, dry pipe and preaction systems are only permitted for closed ro-ro spaces and special category spaces, i.e. spaces where the effect on activation of the automatic sprinklers or nozzles by wind is limited.
20. Wet pipe, dry pipe and preaction systems should be divided into sections. Any section should not serve more than one deck. The stop valves should be located adjacent to but outside the protected space, be readily accessible and their location should be clearly and permanently indicated. Means should be provided to prevent the operation of the stop valves by an unauthorized person.
21. The system size for dry pipe and preaction systems should be such that water, at full system pressure, is discharged from the system’s test connection in not more than 60 seconds, starting at the normal air or nitrogen pressure in the system.
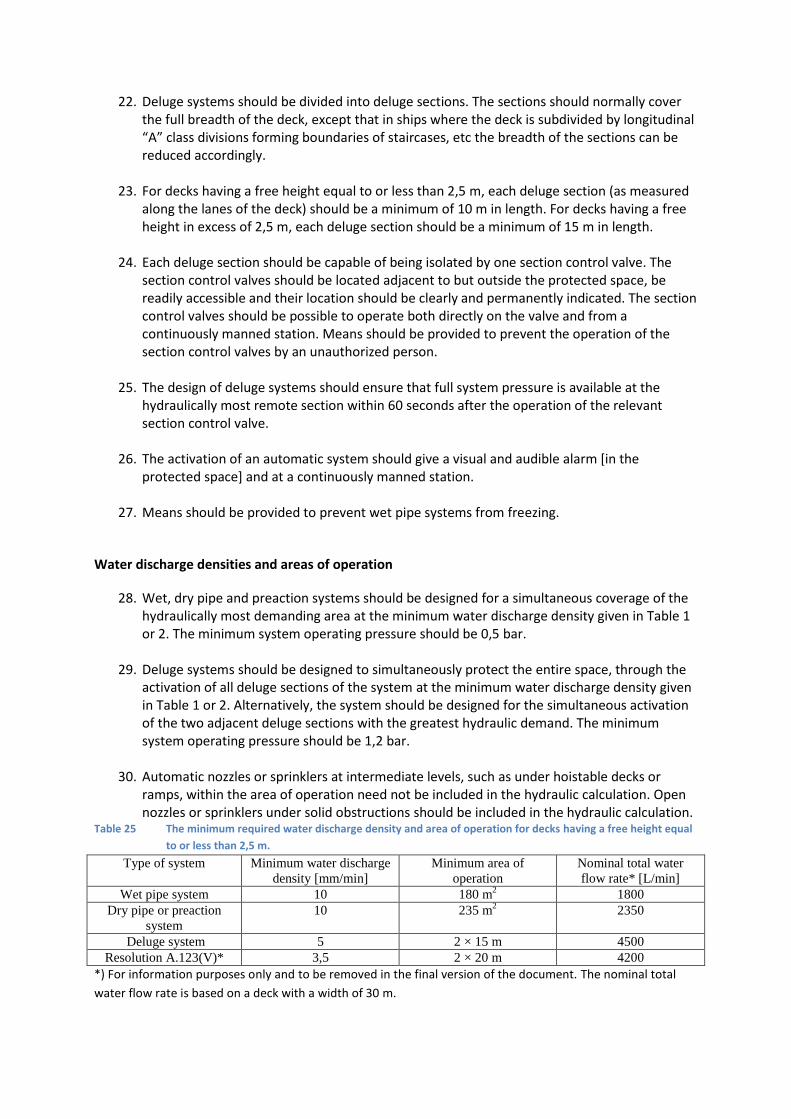
22. Deluge systems should be divided into deluge sections. The sections should normally cover the full breadth of the deck, except that in ships where the deck is subdivided by longitudinal “A” class divisions forming boundaries of staircases, etc the breadth of the sections can be reduced accordingly.
23. For decks having a free height equal to or less than 2,5 m, each deluge section (as measured along the lanes of the deck) should be a minimum of 10 m in length. For decks having a free height in excess of 2,5 m, each deluge section should be a minimum of 15 m in length.
24. Each deluge section should be capable of being isolated by one section control valve. The section control valves should be located adjacent to but outside the protected space, be readily accessible and their location should be clearly and permanently indicated. The section control valves should be possible to operate both directly on the valve and from a continuously manned station. Means should be provided to prevent the operation of the section control valves by an unauthorized person.
25. The design of deluge systems should ensure that full system pressure is available at the hydraulically most remote section within 60 seconds after the operation of the relevant section control valve.
26. The activation of an automatic system should give a visual and audible alarm [in the
protected space] and at a continuously manned station.
27. Means should be provided to prevent wet pipe systems from freezing.
Water discharge densities and areas of operation
28. Wet, dry pipe and preaction systems should be designed for a simultaneous coverage of the hydraulically most demanding area at the minimum water discharge density given in Table 1 or 2. The minimum system operating pressure should be 0,5 bar.
29. Deluge systems should be designed to simultaneously protect the entire space, through the activation of all deluge sections of the system at the minimum water discharge density given in Table 1 or 2. Alternatively, the system should be designed for the simultaneous activation of the two adjacent deluge sections with the greatest hydraulic demand. The minimum system operating pressure should be 1,2 bar.
30. Automatic nozzles or sprinklers at intermediate levels, such as under hoistable decks or ramps, within the area of operation need not be included in the hydraulic calculation. Open nozzles or sprinklers under solid obstructions should be included in the hydraulic calculation.
Table 25 The minimum required water discharge density and area of operation for decks having a free height equal
to or less than 2,5 m.
Type of system Minimum water discharge
density [mm/min]
Minimum area of
operation
Nominal total water
flow rate* [L/min]
Wet pipe system 10 180 m2 1800
Dry pipe or preaction
system
10 235 m2 2350
Deluge system 5 2 × 15 m 4500
Resolution A.123(V)* 3,5 2 × 20 m 4200
*) For information purposes only and to be removed in the final version of the document. The nominal total
water flow rate is based on a deck with a width of 30 m.

Table 26 The minimum required water discharge density and area of operation for decks having a free height in
excess of 2,5 m but less than 6,5 m.
Type of system Minimum water discharge
density [mm/min]
Minimum area of
operation
Nominal total water
flow rate* [L/min]
Wet pipe system 15 280 m2 4200
Dry pipe or preaction
system
15 365 m2 5475
Deluge system 10 2 × 15 m 9000
Resolution A.123(V)* 5 2 × 20 m 6000
*) For information purposes only and to be removed in the final version of the document. The nominal total
water flow rate is based on a deck with a width of 30 m.
31. For decks having a free height in excess of 6,5 m, the minimum water discharge density should be increased to the satisfaction of the Administration.
32. The minimum required water discharge density and system operating pressure of equivalent system should be determined based on fire test procedures developed by the Organization.
Nozzles or sprinklers and their positioning
33. Nozzles or sprinklers should be positioned at the ceiling of the deck, in order to distribute water over and between all vehicles in the area being protected. Automatic nozzles or sprinklers should be positioned and located so as to provide satisfactory performance with respect to both activation time and water distribution.
34. The horizontal spacing between nozzles or sprinklers should not exceed 3,2 m.
35. The presence of obstructions and the potential for shielding of the water spray should be evaluated to ensure that the system performance is not affected. Supplementary nozzles or sprinklers may be installed at intermediate levels.
36. Automatic nozzles or sprinklers should have a nominal operating temperature of between 121°C to 149°C and standard response characteristics. Automatic nozzles or sprinklers for alternative systems may have fast response characteristics.
37. Only upright nozzles or sprinklers are allowed for dry pipe systems.
38. Open water spray nozzles should be of a type that is approved for use in water spray systems with the following discharge characteristics, 1) K-factor, 2) spray patterns at various pressures, distances, and orientation angles, and, 3) uniformity of water distribution over its spray pattern [principle from NFPA 15].
Fixed fire detection system
39. Automatic deluge systems should be activated by a fixed fire detection system, using spot-type heat detectors, fulfilling the relevant parts of Chapter 9 of the FSS code. The fire detection requirements described within this paragraph are in addition to, and not a substitute for, the detection and fire alarm system requirements by SOLAS regulation II-2/37 and 20?.
40. The sections of the fire detection system should correspond to the sections of the deluge system.
41. The relevant deluge section should be automatically activated when two fire detectors within the section is activated.
42. Means should be taken to prevent the automatic activation of more than two deluge sections.
43. Where beams project more than 100 mm below the ceiling, the spacing of spot-type heat detectors at right angles to the direction of the beam travel should not be more than two-thirds of the spacing permitted under Chapter 9 of the FSS code. [Principle from NFPA 72].
44. Where beams project more than 460 mm below the ceiling and are more than 2,4 m on center, each bay formed by the beams should be treated as a separate area. [Principle from NFPA 72].
45. Fixed fire detection systems associated with a manual deluge system or a preaction system shall fulfill the relevant parts of Chapter 9 of the FSS code.
Water supply and supply of fire suppression enhancing additives
46. The system should be connected to a permanent seawater connection, to provide a continuous operation using seawater. The seawater suction pipe should be connected to a sea-chest located outside of the protected space.
47. The system may be connected to a fresh water supply tank, having a volume large enough to provide water for a continuous discharge of at least 10 minutes. If the fresh water tank is shared with non-vital services, the required volume of water for the fire-fighting system should be guaranteed through the fitting of permanent suction pipes for the non-vital services at a higher elevation than the suction pipe for the fire-fighting system. The switching of water supply, from the fresh water supply tank to the permanent seawater connection should be done automatically; however, manual means of changing the water supply should be possible.
48. The supply of any fire suppression enhancing additive should be large enough for a continuous discharge of at least 10 minutes. The supply of additive should be independent of the selected supply of water.
Power supply
The power supply should be provided from outside the protected space.
Pump unit or alternative supply devices
49. A dedicated pump unit, or alternative supply device, should be capable of continuously supplying the required total water flow rate and pressure.
50. The pump unit should either start automatically upon the automatic activation of the system or be possible to start by remote control from the position of the section control valves and

from a continuously manned station
51. Systems protecting special category spaces should be provided with a redundant means of pumping. The capacity of the redundant means should be sufficient to compensate for the loss of any single pump of the dedicated pump unit.
52. Systems for other types of ro-ro spaces should be connected to the ship’s required fire pumps by a lockable non-return valve.
53. Failure in any one component in the power and control system should not result in a reduction of the automatic release capability or reduction of the required pump capacity by more than 50% for automatic sprinklers and 100% in the case of open head systems. However, systems requiring an external power source need only be supplied by the main power source. Hydraulic calculations should be conducted to assure that sufficient flow and pressure are delivered to the hydraulically most demanding section both in normal operation and in the event of the failure of one component. [Wording directly from MSC/Circ. 1272 but difficult to understand].
54. The pump unit, or alternative supply device, should be located outside the protected space.
55. Means for testing the capacity of the pump unit, or alternative supply device, should be provided.
Monitoring
56. It should be possible to continuously monitor a) the level of water in the fresh water tank, b) the water pressure at the pressure side of all pump units or alternative supply devices from all control positions and c) the position of valves.
Electrical equipment
57. The electrical components of the pump unit, or alternative supply device should have a minimum rating of IP 54.
System components
58. The system and its components should be suitably designed to withstand ambient temperature changes, vibration, humidity, shock, impact, clogging and corrosion normally encountered in ships. Components within the protected space should be designed to withstand the elevated temperatures which could occur during a fire.
59. The system and its components should be designed and installed in accordance with international standards acceptable to the Organization and manufactured and tested to the satisfaction of the Administration in accordance with appropriate elements of Appendices X and Y to these guidelines. [Taken from MSC/Circ. 1165].
60. Spare parts and operating and maintenance instructions for the system should be provided, as recommended by the manufacturer.
61. The stock of spare nozzles or sprinklers should contain all types and temperature ratings installed and should comprise at least 24 nozzles or sprinklers of each type.
Additives
62. Additives should not be used for the protection of normally occupied spaces unless they have been approved for fire protection service by an independent authority. The approval should consider the possible health effects to exposed personnel, including the inhalation toxicity. [Taken from MSC/Circ. 1165].
63. Foam agents should fulfill the requirements of MSC.1/Circ. 1312.
Plans, instructions and notices
64. Installation plans and operating manuals should be supplied to the ship and be readily available on board. A list or plan should be displayed showing spaces covered and the location of the zone in respect of each section. Instructions for testing and maintenance should be available on board.
65. Operating instructions for the system should be displayed at each operating position.
66. All installation, operating and maintenance instructions/plans should be in the working language of the ship. If the working language is not English, French nor Spanish, a translation into one of these languages should be included.
67. A warning notice should be displayed outside each entry point of spaces with an automatic system, stating the type of medium used and the possibility for automatic activation.
Means for testing
68. A means for testing the automatic operation of the system and, in addition, assuring the required pressure and flow should be provided.
69. Means for flushing of deluge systems with fresh water should be provided.
70. If the system is pre-primed with water containing a fire suppression enhancing additive and/or an antifreeze, periodic inspection and testing, as specified by the manufacturer should be undertaken to assure that their effectiveness is being maintained.
71. Periodic inspection, testing and maintenance in accordance with MSC/Circ. 850 should be undertaken.
*******

Appendix C – @Risk distributions This appendix gives a thorough presentation of all inputs to the calculations in @Risk.
Alpha RiskNormal(0,01388;0,004171;RiskTruncate(0;))
Q-critic RiskUniform(5000;10000)
T-critic Sqrt(Q-critic/Alpha)
Time to detection RiskUniform(65;153)
Time from detection to sprinkler activation RiskLognorm(776,41;119,49;RiskShift(-521,81))
Time margin T-critic - Time to detection - Time from detection to sprinkler activation
Alpha RiskUniform(0,0416;0,3611)
Q-critic RiskUniform(5000;10000)
T-critic Sqrt(Q-critic/Alpha)
Time to detection RiskUniform(28;73)
Time from detection to sprinkler activation RiskLognorm(776,41;119,49;RiskShift(-521,81))
Time margin T-critic - Time to detection - Time from detection to sprinkler activation
Alpha RiskNormal(0,01388;0,004171;RiskTruncate(0;))
Q-critic RiskUniform(15000;30000)
T-critic Sqrt(Q-critic/Alpha)
Time to sprinkler activation RiskUniform(226;628) Correlates with Alpha (-0.8)
Time margin T-critic - Time to sprinkler activation
Alpha RiskUniform(0,0416;0,3611)
Q-critic RiskUniform(15000;30000)
T-critic Sqrt(Q-critic/Alpha)
Time to sprinkler activation RiskUniform(81;277) Correlates with Alpha (-0.8)
Time margin T-critic - Time to sprinkler activation
Alpha RiskNormal(0,01388;0,004171;RiskTruncate(0;))
Q-critic RiskUniform(15000;30000)
T-critic Sqrt(Q-critic/Alpha)
Time to sprinkler activation RiskUniform(226;628) Correlates with Alpha (-0.8)
Dry pipe delay 30
Time margin T-critic - Time to sprinkler activation - Drypipe delay
Alpha RiskUniform(0,0416;0,3611)
Q-critic RiskUniform(15000;30000)
T-critic Sqrt(Q-critic/Alpha)
Time to sprinkler activation RiskUniform(81;277) Correlates with Alpha (-0.8)
Dry pipe delay 30
Time margin T-critic - Time to sprinkler activation - Drypipe delay
HGV
Car fire
Automatic wetpipe system
Automatic drypipe system
Car fire
Present manual deluge system Res. A.123(V)
Car fire
HGV
HGV
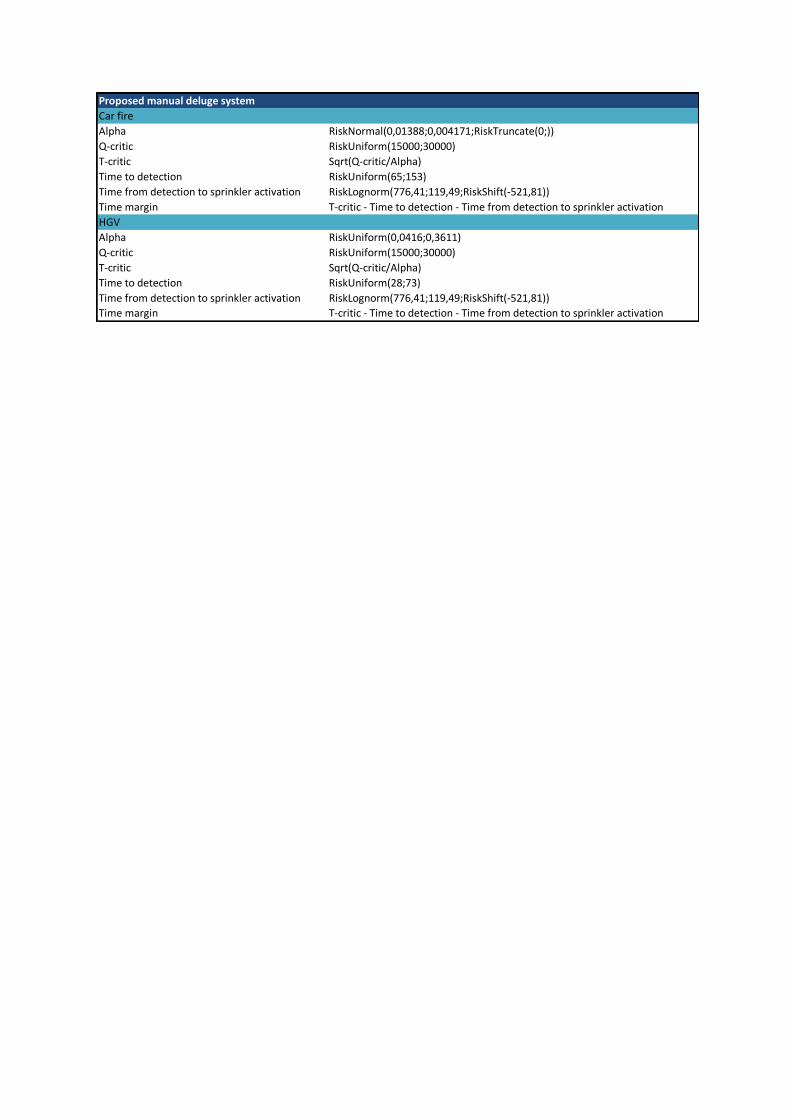
Alpha RiskNormal(0,01388;0,004171;RiskTruncate(0;))
Q-critic RiskUniform(15000;30000)
T-critic Sqrt(Q-critic/Alpha)
Time to detection RiskUniform(65;153)
Time from detection to sprinkler activation RiskLognorm(776,41;119,49;RiskShift(-521,81))
Time margin T-critic - Time to detection - Time from detection to sprinkler activation
Alpha RiskUniform(0,0416;0,3611)
Q-critic RiskUniform(15000;30000)
T-critic Sqrt(Q-critic/Alpha)
Time to detection RiskUniform(28;73)
Time from detection to sprinkler activation RiskLognorm(776,41;119,49;RiskShift(-521,81))
Time margin T-critic - Time to detection - Time from detection to sprinkler activation
Proposed manual deluge system
Car fire
HGV

Appendix D – Incident reports
Appendix E – Survey for manual sprinkler activation The literature search did not result in data on how fast a manual sprinkler system is activated on a ro-
ro deck in case of fire. After asking multiple experts where such data could be found it was
understood that there is no record of this available. In order to estimate the time it takes, experts
were asked to answer a short survey. The following email was sent out to the experts, is was
originally written in Swedish:
This survey is part of a thesis by two fire protection engineers at Lund University. The purpose is to estimate how long time it takes to activate a manual sprinkler system on a ro-ro deck after the fire alarm is activated. We ask you to use your own experience and judgment to answer the question below. The survey is anonymous and will only be used for the purpose of this report. IT will help the authors to estimate the time to sprinkler activation. Below is a scenario given that we ask you to consider and base your estimation on: On a 20 000 gross tonnage ro-ro ship is a fire alarm received. A fire has started on one of the ro-ro decks. The ship is equipped with a manual fixed fire sprinkler system that is actuated by the staff. This is done by opening a valve and starting a pump in a space separate from the ro-ro deck. How long time does it take from the point the fire alarm is received till the system is activated? Assume 100 similar incidents occur. How many of those do you think will fall into the time intervals below? 0-2 minutes: 2-4 minutes: 4-6 minutes: 6-8 minutes: More than 8 minutes: To answer, please type the numbers of incidents you think will fall in to each interval and just reply to this email.
Appendix F – Cost estimation for fire incidents The cost for the two consequences, Severe and Less severe, defined in this report was estimated by
an insurance company. The two scenarios were described and the cost calculations are based on the
example ship in the Problem definition. This is the letter that was sent to the insurance company:
Hello! At first, I want to emphasize my gratitude, you seem to be the right person to help me with the cost estimate. It is indeed a rough estimate rather than a precise determination we are talking about. In the text below I try to be as detailed as I can when describing the conditions for the estimate. Is something missing, just write back and let me know. Otherwise it is, as I said on the phone the other day, the global average for all ro-ro vessels that is the watchword. The vessel that we have chosen to represent the world fleet of ro-ro vessels is a ro-pax vessels of 12 000 GT, which has three ro-ro deck. It is 135 meters long and 24 meters wide. Maximum number of passengers is 1200. Scenario 1 is to represent all minor accidents where the fire is extinguished in an early stage. A fire starts in a car on the lower deck. Starting object (a car) and surrounding vehicles (three cars and a truck) is assumed to be destroyed. The remaining vehicles on the same deck will get smoke damages and need to be decontaminated. Some cabling and a steel beam above the seat of the fire is damaged and needs replacement. This means that the ship is taken out of service (for how long you might be able to estimate?). Scenario 2 will be representative of the serious injuries where the fire is not extinguished in the early stages. A fire starts in a truck with combustible goods, the fire is not controlled by a sprinkler system but continue to grow and spread to surrounding vehicles. Ship is evacuated and the fire is extinguished in the end with the help of external resources from ashore. 42 people fail to get off the ship in time and are killed as a result of the fire (you do not need to take that into account in your calculation). Property damage is estimated to be equal to half of the ship. The ship is taken out of service for repairs (not clear for how long). These are the two scenarios that I would like some assistance in assessing the cost for. My goal is to try to identify all expenses associated by such damage, the costs I have come up with myself is: Repair cost Cost for rescue mission Rent for temporary replacement ship Lost income for the shipping company Loss of goods Decontamination of gods If you think there is too much work to split the cost into several costs merge them all into a lump-sum. Hopefully you can make an estimate with the information you received in this mail, otherwise please get back to me as soon as possible. Thanks in advance /David Palm
The estimation returned is given in Table 27 and Table 28.

Table 27 Individual cost for less severe
Type of cost Cost in million Swedish kroner (MSEK)
Repair cost 0.5
Cost for rescue mission 0 (towing is not necessary)
Rent for temporary replacement ship 0 (ship is still functional)
Lost income for the shipping company 0.6
Loss of gods 4
Decontamination of gods 0.6
Total cost 5.7
Table 28 Individual cost for severe
Type of cost Cost in million Swedish kroner (MSEK)
Repair cost 500
Cost for rescue mission 10
Rent for temporary replacement ship 22.5
Lost income for the shipping company 5
Loss of gods 100
Decontamination of gods 0 (total loss of gods)
Total cost 637.5
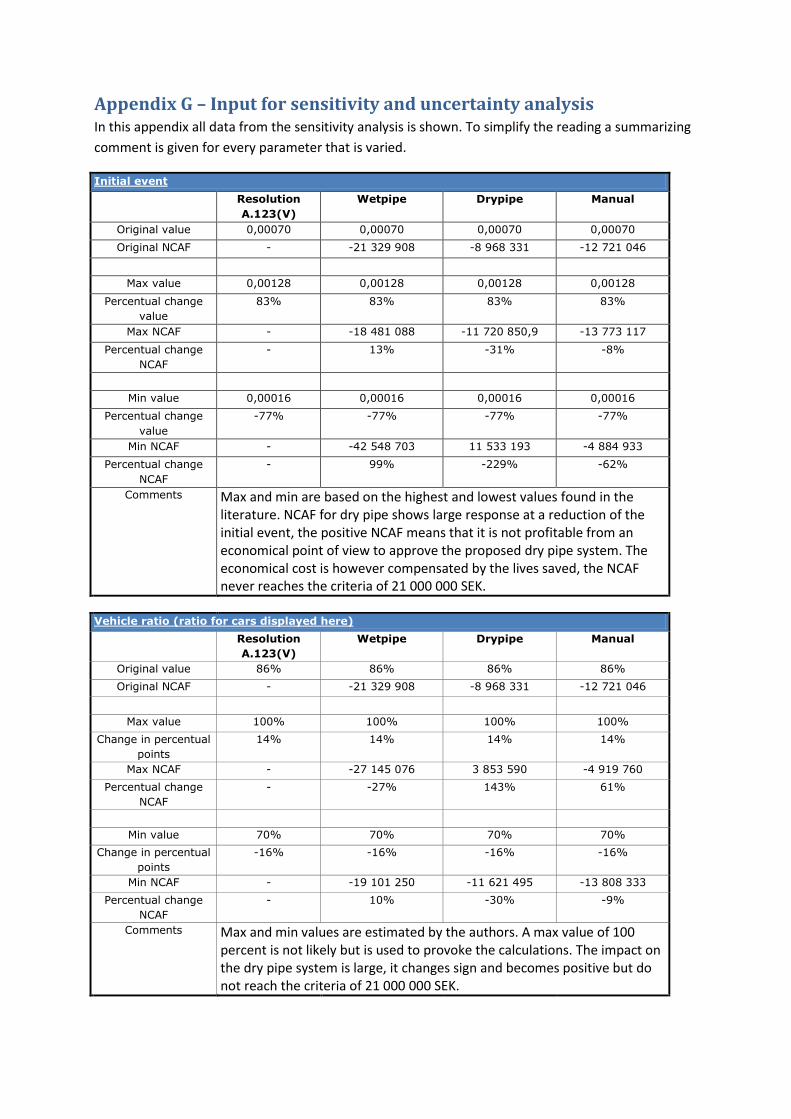
Appendix G – Input for sensitivity and uncertainty analysis In this appendix all data from the sensitivity analysis is shown. To simplify the reading a summarizing
comment is given for every parameter that is varied.
Initial event
Resolution
A.123(V)
Wetpipe Drypipe Manual
Original value 0,00070 0,00070 0,00070 0,00070
Original NCAF - -21 329 908 -8 968 331 -12 721 046
Max value 0,00128 0,00128 0,00128 0,00128
Percentual change
value
83% 83% 83% 83%
Max NCAF - -18 481 088 -11 720 850,9 -13 773 117
Percentual change
NCAF
- 13% -31% -8%
Min value 0,00016 0,00016 0,00016 0,00016
Percentual change
value
-77% -77% -77% -77%
Min NCAF - -42 548 703 11 533 193 -4 884 933
Percentual change
NCAF
- 99% -229% -62%
Comments Max and min are based on the highest and lowest values found in the literature. NCAF for dry pipe shows large response at a reduction of the initial event, the positive NCAF means that it is not profitable from an economical point of view to approve the proposed dry pipe system. The economical cost is however compensated by the lives saved, the NCAF never reaches the criteria of 21 000 000 SEK.
Vehicle ratio (ratio for cars displayed here)
Resolution
A.123(V)
Wetpipe Drypipe Manual
Original value 86% 86% 86% 86%
Original NCAF - -21 329 908 -8 968 331 -12 721 046
Max value 100% 100% 100% 100%
Change in percentual
points
14% 14% 14% 14%
Max NCAF - -27 145 076 3 853 590 -4 919 760
Percentual change
NCAF
- -27% 143% 61%
Min value 70% 70% 70% 70%
Change in percentual
points
-16% -16% -16% -16%
Min NCAF - -19 101 250 -11 621 495 -13 808 333
Percentual change
NCAF
- 10% -30% -9%
Comments Max and min values are estimated by the authors. A max value of 100 percent is not likely but is used to provoke the calculations. The impact on the dry pipe system is large, it changes sign and becomes positive but do not reach the criteria of 21 000 000 SEK.

System activation, all systems are maximized and minimized simultaniously
(Successful activation displayed here)
Resolution
A.123(V)
Wetpipe Drypipe Manual
Original value 84% 93% 87% 84%
Original NCAF - -21 329 908 -8 968 331 -12 721 046
Max value 95% 99% 96% 95%
Change in percentual
points
11% 6% 9% 11%
Max NCAF - -22 613 833 -8 758 365 -12 989 887
Percentual change
NCAF
- -12% 10% 4%
Min value 70% 75% 73% 70%
Change in percentual
points
-14% -18% -14% -14%
Min NCAF - -23 876 352 -8 041 957 -12 256 684
Percentual change
NCAF
- -12% 10% 4%
Comments Max and min values are estimated by the authors. All the systems are varied simultaneously based on the idea that if the system activation reliability is under or over estimated it applies to all the systems since all of the values are based on the same references. The changes in system activation reliability do not result in large changes in the NCAF.
Concequence: Damage cost less severe
Resolution
A.123(V)
Wetpipe Drypipe Manual
Original value 5 700 000 5 700 000 5 700 000 5 700 000
Original NCAF - -21 329 908 -8 968 331 -12 721 046
Max value 18 000 000 18 000 000 18 000 000 18 000 000
Percentual change
value
216% 216% 216% 216%
Max NCAF - -21 037 051 -8 675 474 -12 428 189
Percentual change
NCAF
- 1% 3% 2%
Min value 3 000 000 3 000 000 3 000 000 3 000 000
Percentual change
value
-47% -47% -47% -47%
Min NCAF - -21 394 193 -9 032 617 -12 785 332
Percentual change
NCAF
- -0% -1% -1%
Comments Max and min values are estimated by the authors. The damage cost for less severe is not an input that has large impact on the NCAF.
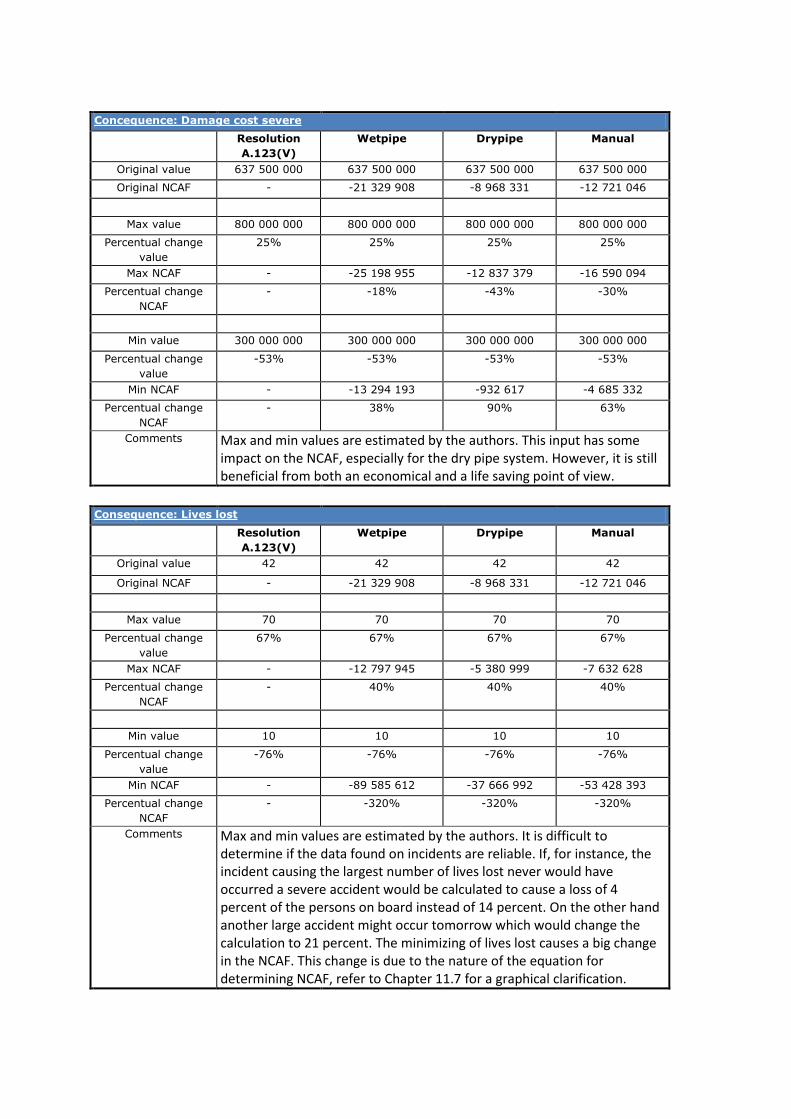
Concequence: Damage cost severe
Resolution
A.123(V)
Wetpipe Drypipe Manual
Original value 637 500 000 637 500 000 637 500 000 637 500 000
Original NCAF - -21 329 908 -8 968 331 -12 721 046
Max value 800 000 000 800 000 000 800 000 000 800 000 000
Percentual change
value
25% 25% 25% 25%
Max NCAF - -25 198 955 -12 837 379 -16 590 094
Percentual change
NCAF
- -18% -43% -30%
Min value 300 000 000 300 000 000 300 000 000 300 000 000
Percentual change
value
-53% -53% -53% -53%
Min NCAF - -13 294 193 -932 617 -4 685 332
Percentual change
NCAF
- 38% 90% 63%
Comments Max and min values are estimated by the authors. This input has some impact on the NCAF, especially for the dry pipe system. However, it is still beneficial from both an economical and a life saving point of view.
Consequence: Lives lost
Resolution
A.123(V)
Wetpipe Drypipe Manual
Original value 42 42 42 42
Original NCAF - -21 329 908 -8 968 331 -12 721 046
Max value 70 70 70 70
Percentual change
value
67% 67% 67% 67%
Max NCAF - -12 797 945 -5 380 999 -7 632 628
Percentual change
NCAF
- 40% 40% 40%
Min value 10 10 10 10
Percentual change
value
-76% -76% -76% -76%
Min NCAF - -89 585 612 -37 666 992 -53 428 393
Percentual change
NCAF
- -320% -320% -320%
Comments Max and min values are estimated by the authors. It is difficult to determine if the data found on incidents are reliable. If, for instance, the incident causing the largest number of lives lost never would have occurred a severe accident would be calculated to cause a loss of 4 percent of the persons on board instead of 14 percent. On the other hand another large accident might occur tomorrow which would change the calculation to 21 percent. The minimizing of lives lost causes a big change in the NCAF. This change is due to the nature of the equation for determining NCAF, refer to Chapter 11.7 for a graphical clarification.
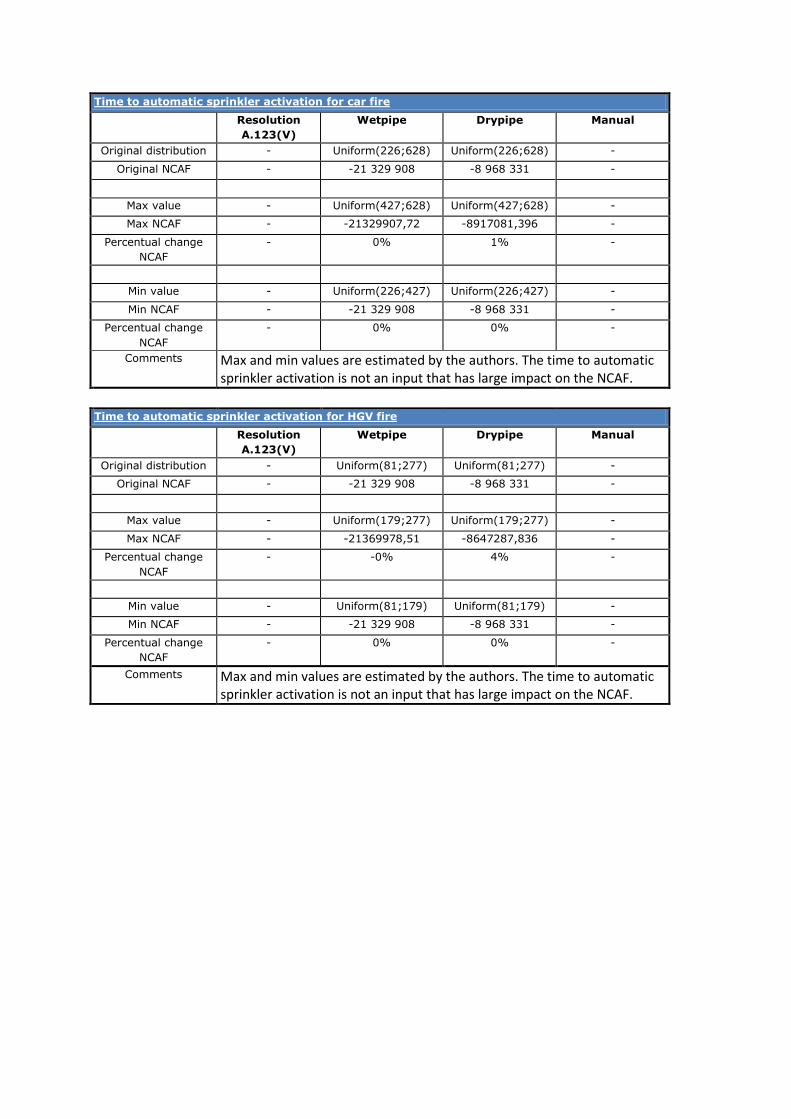
Time to automatic sprinkler activation for car fire
Resolution
A.123(V)
Wetpipe Drypipe Manual
Original distribution - Uniform(226;628) Uniform(226;628) -
Original NCAF - -21 329 908 -8 968 331 -
Max value - Uniform(427;628) Uniform(427;628) -
Max NCAF - -21329907,72 -8917081,396 -
Percentual change
NCAF
- 0% 1% -
Min value - Uniform(226;427) Uniform(226;427) -
Min NCAF - -21 329 908 -8 968 331 -
Percentual change
NCAF
- 0% 0% -
Comments Max and min values are estimated by the authors. The time to automatic sprinkler activation is not an input that has large impact on the NCAF.
Time to automatic sprinkler activation for HGV fire
Resolution
A.123(V)
Wetpipe Drypipe Manual
Original distribution - Uniform(81;277) Uniform(81;277) -
Original NCAF - -21 329 908 -8 968 331 -
Max value - Uniform(179;277) Uniform(179;277) -
Max NCAF - -21369978,51 -8647287,836 -
Percentual change
NCAF
- -0% 4% -
Min value - Uniform(81;179) Uniform(81;179) -
Min NCAF - -21 329 908 -8 968 331 -
Percentual change
NCAF
- 0% 0% -
Comments Max and min values are estimated by the authors. The time to automatic sprinkler activation is not an input that has large impact on the NCAF.
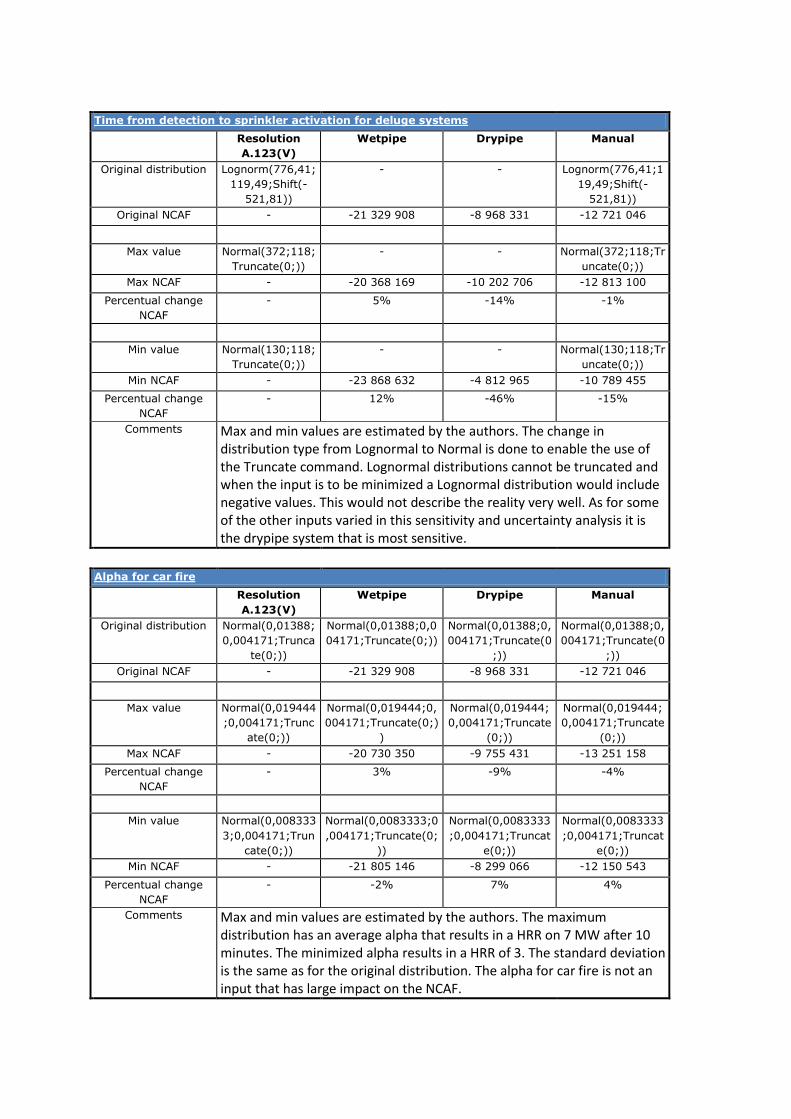
Time from detection to sprinkler activation for deluge systems
Resolution
A.123(V)
Wetpipe Drypipe Manual
Original distribution Lognorm(776,41;
119,49;Shift(-
521,81))
- - Lognorm(776,41;1
19,49;Shift(-
521,81))
Original NCAF - -21 329 908 -8 968 331 -12 721 046
Max value Normal(372;118;
Truncate(0;))
- - Normal(372;118;Tr
uncate(0;))
Max NCAF - -20 368 169 -10 202 706 -12 813 100
Percentual change
NCAF
- 5% -14% -1%
Min value Normal(130;118;
Truncate(0;))
- - Normal(130;118;Tr
uncate(0;))
Min NCAF - -23 868 632 -4 812 965 -10 789 455
Percentual change
NCAF
- 12% -46% -15%
Comments Max and min values are estimated by the authors. The change in distribution type from Lognormal to Normal is done to enable the use of the Truncate command. Lognormal distributions cannot be truncated and when the input is to be minimized a Lognormal distribution would include negative values. This would not describe the reality very well. As for some of the other inputs varied in this sensitivity and uncertainty analysis it is the drypipe system that is most sensitive.
Alpha for car fire
Resolution
A.123(V)
Wetpipe Drypipe Manual
Original distribution Normal(0,01388;
0,004171;Trunca
te(0;))
Normal(0,01388;0,0
04171;Truncate(0;))
Normal(0,01388;0,
004171;Truncate(0
;))
Normal(0,01388;0,
004171;Truncate(0
;))
Original NCAF - -21 329 908 -8 968 331 -12 721 046
Max value Normal(0,019444
;0,004171;Trunc
ate(0;))
Normal(0,019444;0,
004171;Truncate(0;)
)
Normal(0,019444;
0,004171;Truncate
(0;))
Normal(0,019444;
0,004171;Truncate
(0;))
Max NCAF - -20 730 350 -9 755 431 -13 251 158
Percentual change
NCAF
- 3% -9% -4%
Min value Normal(0,008333
3;0,004171;Trun
cate(0;))
Normal(0,0083333;0
,004171;Truncate(0;
))
Normal(0,0083333
;0,004171;Truncat
e(0;))
Normal(0,0083333
;0,004171;Truncat
e(0;))
Min NCAF - -21 805 146 -8 299 066 -12 150 543
Percentual change
NCAF
- -2% 7% 4%
Comments Max and min values are estimated by the authors. The maximum distribution has an average alpha that results in a HRR on 7 MW after 10 minutes. The minimized alpha results in a HRR of 3. The standard deviation is the same as for the original distribution. The alpha for car fire is not an input that has large impact on the NCAF.
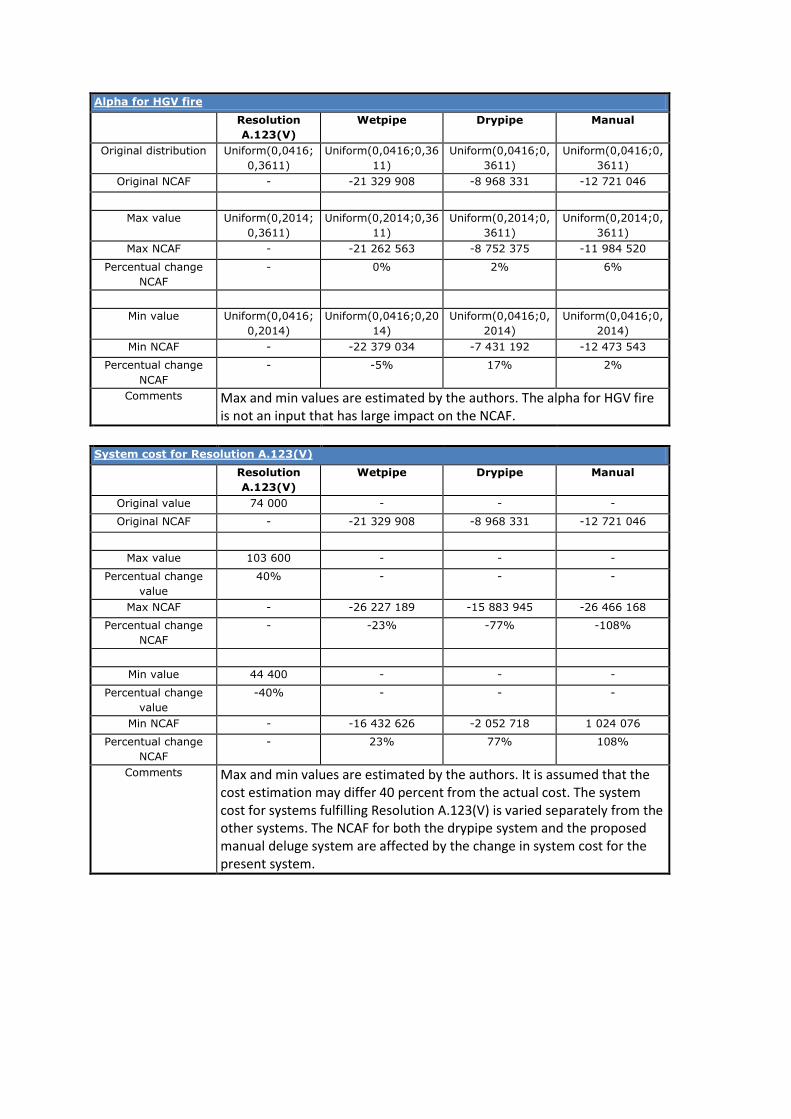
Alpha for HGV fire
Resolution
A.123(V)
Wetpipe Drypipe Manual
Original distribution Uniform(0,0416;
0,3611)
Uniform(0,0416;0,36
11)
Uniform(0,0416;0,
3611)
Uniform(0,0416;0,
3611)
Original NCAF - -21 329 908 -8 968 331 -12 721 046
Max value Uniform(0,2014;
0,3611)
Uniform(0,2014;0,36
11)
Uniform(0,2014;0,
3611)
Uniform(0,2014;0,
3611)
Max NCAF - -21 262 563 -8 752 375 -11 984 520
Percentual change
NCAF
- 0% 2% 6%
Min value Uniform(0,0416;
0,2014)
Uniform(0,0416;0,20
14)
Uniform(0,0416;0,
2014)
Uniform(0,0416;0,
2014)
Min NCAF - -22 379 034 -7 431 192 -12 473 543
Percentual change
NCAF
- -5% 17% 2%
Comments Max and min values are estimated by the authors. The alpha for HGV fire is not an input that has large impact on the NCAF.
System cost for Resolution A.123(V)
Resolution
A.123(V)
Wetpipe Drypipe Manual
Original value 74 000 - - -
Original NCAF - -21 329 908 -8 968 331 -12 721 046
Max value 103 600 - - -
Percentual change
value
40% - - -
Max NCAF - -26 227 189 -15 883 945 -26 466 168
Percentual change
NCAF
- -23% -77% -108%
Min value 44 400 - - -
Percentual change
value
-40% - - -
Min NCAF - -16 432 626 -2 052 718 1 024 076
Percentual change
NCAF
- 23% 77% 108%
Comments Max and min values are estimated by the authors. It is assumed that the cost estimation may differ 40 percent from the actual cost. The system cost for systems fulfilling Resolution A.123(V) is varied separately from the other systems. The NCAF for both the drypipe system and the proposed manual deluge system are affected by the change in system cost for the present system.
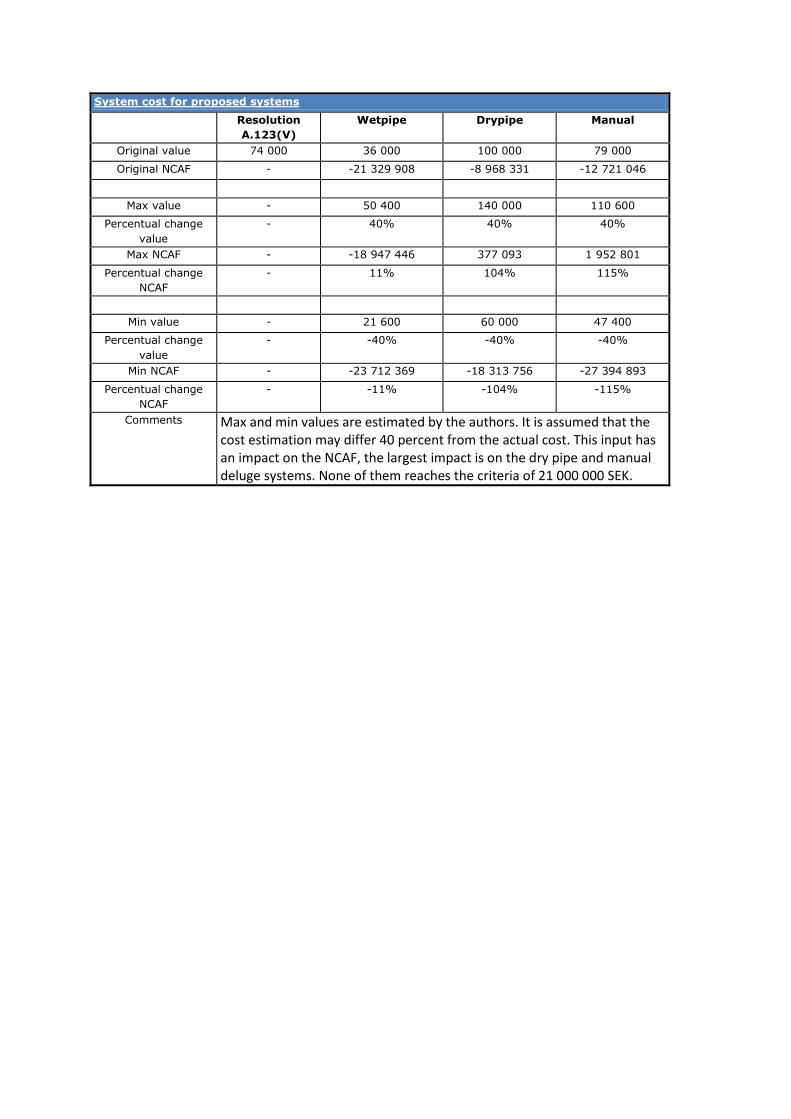
System cost for proposed systems
Resolution
A.123(V)
Wetpipe Drypipe Manual
Original value 74 000 36 000 100 000 79 000
Original NCAF - -21 329 908 -8 968 331 -12 721 046
Max value - 50 400 140 000 110 600
Percentual change
value
- 40% 40% 40%
Max NCAF - -18 947 446 377 093 1 952 801
Percentual change
NCAF
- 11% 104% 115%
Min value - 21 600 60 000 47 400
Percentual change
value
- -40% -40% -40%
Min NCAF - -23 712 369 -18 313 756 -27 394 893
Percentual change
NCAF
- -11% -104% -115%
Comments Max and min values are estimated by the authors. It is assumed that the cost estimation may differ 40 percent from the actual cost. This input has an impact on the NCAF, the largest impact is on the dry pipe and manual deluge systems. None of them reaches the criteria of 21 000 000 SEK.
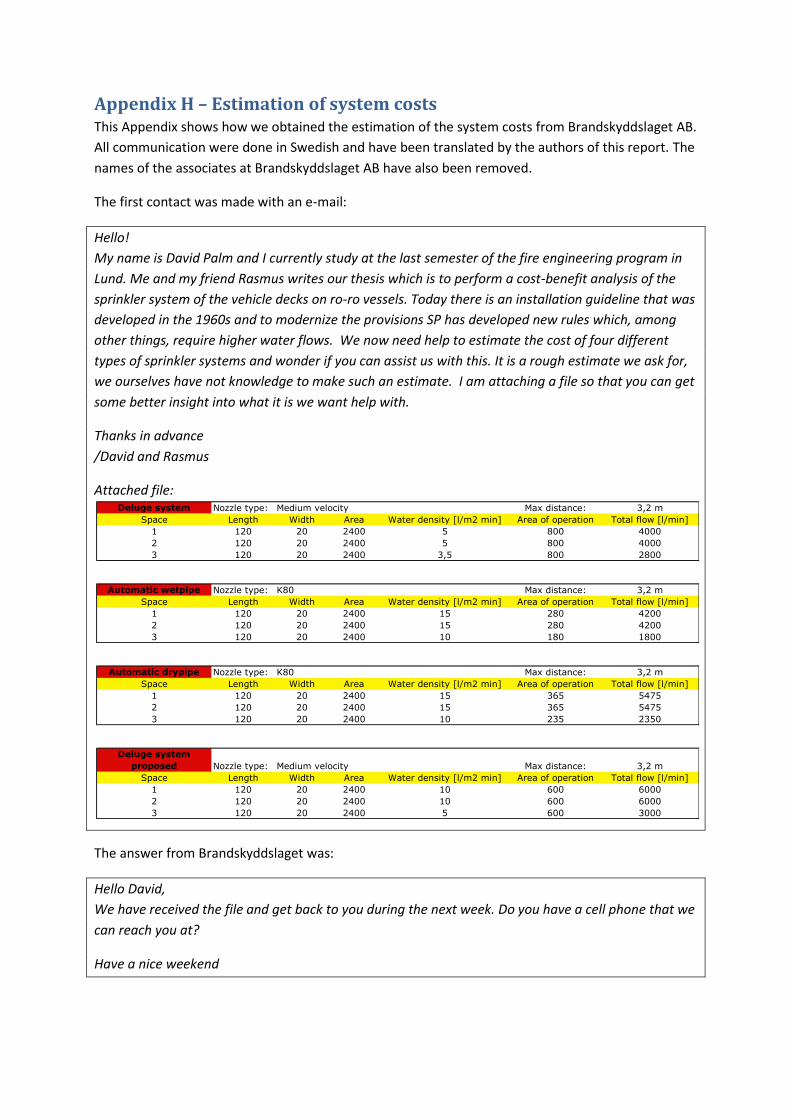
Appendix H – Estimation of system costs This Appendix shows how we obtained the estimation of the system costs from Brandskyddslaget AB.
All communication were done in Swedish and have been translated by the authors of this report. The
names of the associates at Brandskyddslaget AB have also been removed.
The first contact was made with an e-mail:
Hello!
My name is David Palm and I currently study at the last semester of the fire engineering program in
Lund. Me and my friend Rasmus writes our thesis which is to perform a cost-benefit analysis of the
sprinkler system of the vehicle decks on ro-ro vessels. Today there is an installation guideline that was
developed in the 1960s and to modernize the provisions SP has developed new rules which, among
other things, require higher water flows. We now need help to estimate the cost of four different
types of sprinkler systems and wonder if you can assist us with this. It is a rough estimate we ask for,
we ourselves have not knowledge to make such an estimate. I am attaching a file so that you can get
some better insight into what it is we want help with.
Thanks in advance
/David and Rasmus
Attached file:
The answer from Brandskyddslaget was:
Hello David,
We have received the file and get back to you during the next week. Do you have a cell phone that we
can reach you at?
Have a nice weekend
Deluge system Nozzle type: Medium velocity Max distance: 3,2 m
Space Length Width Area Water density [l/m2 min] Area of operation Total flow [l/min]
1 120 20 2400 5 800 4000
2 120 20 2400 5 800 4000
3 120 20 2400 3,5 800 2800
Automatic wetpipe Nozzle type: K80 Max distance: 3,2 m
Space Length Width Area Water density [l/m2 min] Area of operation Total flow [l/min]
1 120 20 2400 15 280 4200
2 120 20 2400 15 280 4200
3 120 20 2400 10 180 1800
Automatic drypipe Nozzle type: K80 Max distance: 3,2 m
Space Length Width Area Water density [l/m2 min] Area of operation Total flow [l/min]
1 120 20 2400 15 365 5475
2 120 20 2400 15 365 5475
3 120 20 2400 10 235 2350
Deluge system
proposed Nozzle type: Medium velocity Max distance: 3,2 m
Space Length Width Area Water density [l/m2 min] Area of operation Total flow [l/min]
1 120 20 2400 10 600 6000
2 120 20 2400 10 600 6000
3 120 20 2400 5 600 3000

Our reply:
Hello!
I am very grateful that you want to help us with this final piece of the puzzle in our thesis. We have
previously been in contact with a company that several months ago promised to help us with the cost
estimate I now asked you to do. Unfortunately they did not live up to what they promised, and that is
why I made contact with you in a very late stage in our writing.
With this background I ask that, if possible, you try to help us as soon as possible. I understand that
we are not in a position to make any requirements, I just want to inform you that we would be very
happy if you have time to make the cost estimate at the beginning of this week.
Best regards
/David Palm
Brandskydslaget replied:
Hello David,
Wet pipe: 200 SEK / square meter
Dry pipe: 300 SEK / square meter
Deluge: 300 SEK / square meter + detection and activation system 300 SEK / square meter
Pre-action same as deluge.These are rough estimations but they use to work for most applications.
The pipes are galvanized for dry pipe and deluge and black for wet pipe.
Brandskyddslaget sent another e-mail soon after the last one:
Hello David!
I and my colleague discussed your table yesterday and you received an email from him with prices per
square meter, I hope that they are helpful. That is how we work when we do estimations. We have
just counted through a project to Vägverket very carefully and it was exactly 200 SEK per square
meter for wet pipe. It is possible to come under 200 SEK per square meter but that is nothing to count
with. Normally raw steel tubes are used in wet pipe system. Hazard level and water density affect
price only to a lesser extent.
Dry pipe system requires at least galvanized pipes and compressor for compressed air which increase
the cost to about 300 SEK per square meter.
The almost double cost for the deluge and preaction system comes from that they always have at
least galvanized pipes and a detection system.
That you were disappointed with the company that did not deliver may indicate that they did not
understand how they would do with the table.
Call us if there is something more you need.
Best regards Brandskyddslaget.
The authors of this report followed up the e-mail conversation with a phone call. In this phone call
the following important information was achieved:
Updated estimation on cost for deluge system: 400 SEK per square meter.
Cost for a single pump: 200 000 SEK
Cost for a sprinkler central: 50 000 SEK
Expected life length of wet pipe system: 50 years
Expected life length of dry pipe system: 25 years
Expected life length of deluge system: Somewhat less than for wet pipe systems (the authors of this
report interpreted this as 40 years)
