an analysis of facebook photo caching - cornell universityqhuang/papers/sosp_fbanalysis.pdf · an...
TRANSCRIPT

An Analysis of Facebook Photo Caching
Qi Huang∗, Ken Birman∗, Robbert van Renesse∗, Wyatt Lloyd†‡, Sanjeev Kumar‡, Harry C. Li‡∗Cornell University, †Princeton University, ‡Facebook Inc.
AbstractThis paper examines the workload of Facebook’s photo-serving stack and the effectiveness of the many layersof caching it employs. Facebook’s image-managementinfrastructure is complex and geographically distributed.It includes browser caches on end-user systems, EdgeCaches at ~20 PoPs, an Origin Cache, and for somekinds of images, additional caching via Akamai. Theunderlying image storage layer is widely distributed, andincludes multiple data centers.
We instrumented every Facebook-controlled layer ofthe stack and sampled the resulting event stream to obtaintraces covering over 77 million requests for more than1 million unique photos. This permits us to study traf-fic patterns, cache access patterns, geolocation of clientsand servers, and to explore correlation between proper-ties of the content and accesses. Our results (1) quantifythe overall traffic percentages served by different layers:65.5% browser cache, 20.0% Edge Cache, 4.6% OriginCache, and 9.9% Backend storage, (2) reveal that a signif-icant portion of photo requests are routed to remote PoPsand data centers as a consequence both of load-balancingand peering policy, (3) demonstrate the potential perfor-mance benefits of coordinating Edge Caches and adoptingS4LRU eviction algorithms at both Edge and Origin lay-ers, and (4) show that the popularity of photos is highlydependent on content age and conditionally dependenton the social-networking metrics we considered.
1 IntroductionThe popularity of social networks has driven a dramaticsurge in the amount of user-created content stored byInternet portals. As a result, the effectiveness of thestacks that store and deliver binary large objects (blobs)
Permission to make digital or hard copies of part or all of this work forpersonal or classroom use is granted without fee provided that copiesare not made or distributed for profit or commercial advantage and thatcopies bear this notice and the full citation on the first page. Copyrightsfor third-party components of this work must be honored. For all otheruses, contact the Owner/Author.
Copyright is held by the Owner/Author(s).SOSP’13, Nov. 3–6, 2013, Farmington, Pennsylvania, USA.ACM 978-1-4503-2388-8/13/11.http://dx.doi.org/10.1145/2517349.2522722
has become an important issue for the social networkprovider community [2, 3]. While there are many formsof digital content, media binaries such as photos andvideos are the most prevalent and will be our focus here.
Our paper explores the dynamics of the full Face-book photo-serving stack, from the client browser toFacebook’s Haystack storage server, looking both atthe performance of each layer and at interactions be-tween multiple system layers. As in many other set-tings [1, 7, 8, 11, 13, 17, 18, 19, 22, 23], the goal ofthis study is to gain insights that can inform design de-cisions for future content storage and delivery systems.Specifically, we ask (1) how much of the access trafficis ultimately served by the Backend storage server, asopposed to the many caching layers between the browserand the Backend, (2) how requests travel through theoverall photo-serving stack, (3) how different cache sizesand eviction algorithms would affect the current perfor-mance, and (4) what object meta data is most predictiveof subsequent access patterns.
Our study addresses these questions by collecting andcorrelating access records from multiple layers of theFacebook Internet hierarchy between clients and Backendstorage servers. The instrumented components includeclient browsers running on all desktops and laptops ac-cessing the social network website, all Edge cache hostsdeployed at geographically distributed points of presence(PoP), the Origin cache in US data centers, and Backendservers residing in US data centers. This enabled us tostudy the traffic distribution at each layer, and the rela-tionship between the events observed and such factors ascache effects, geographical location (for client, Edge PoPand data center) and content properties such as contentage and the owner’s social connectivity. This data setalso enables us to simulate caching performance withvarious cache sizes and eviction algorithms. We focuson what we identified as key questions in shaping a newgeneration of content-serving infrastructure solutions.
1. To the best of our knowledge, our paper is the firststudy to examine an entire Internet image-servinginfrastructure at a massive scale.
2. By quantifying layer-by-layer cache effectiveness,we find that browser caches, Edge caches and theOrigin cache handle an aggregated 90% of the traffic.For the most-popular 0.03% of content, cache hitrates neared 100%. This narrow but high success
This version fixes a typo in section 4 that is present in the official conference version. Updated: 11/12/2013

rate reshapes the load patterns for Backend servers,which see approximately Zipfian traffic but withZipf coefficient α diminishing deeper in the stack.
3. By looking at geographical traffic flow from clientsto Backend, we find that content is often servedacross a large distance rather than locally.
4. We identify opportunities to improve cache hit ra-tios using geographic-scale collaborative caching atEdge servers, and by adopting advanced evictionalgorithms such as S4LRU in the Edge and Origin.
5. By examining the relationship between image ac-cess and associated meta-data, we find that contentpopularity rapidly drops with age following a Paretodistribution and is conditionally dependent on theowner’s social connectivity.
The paper is organized as follows. Section 2 presentsan overview of the Facebook photo serving-stack, high-lighting our instrumentation points. Section 3 describesour sampling methodology. After giving a high leveloverview of the workload characteristics and currentcaching performance in Section 4, Sections 5, 6, and7 further break down the analysis in three categories: ge-ographical traffic distribution, potential improvements,and traffic association with content age and the contentowners’ social connectivity. Related work is discussed inSection 8 and we conclude in Section 9.
2 Facebook’s Photo-Serving StackAs today’s largest social-networking provider, Facebookstores and serves billions of photos on behalf of users. Todeliver this content efficiently, with high availability andlow latency, Facebook operates a massive photo-servingstack distributed at geographic scale. The sheer size of theresulting infrastructure and the high loads it continuouslyserves make it challenging to instrument. At a typicalmoment in time there may be hundreds of millions ofclients interacting with Facebook Edge Caches. These arebacked by Origin Cache and Haystack storage systemsrunning in data centers located worldwide. To maximizeavailability and give Facebook’s routing infrastructureas much freedom as possible, all of these componentsare capable of responding to any photo-access request.This architecture and the full life cycle of a photo requestare shown in Figure 1; shaded elements designate thecomponents accessible in this study.
2.1 The Facebook Photo-Caching StackWhen a user receives an HTML file from Facebook’sfront-end web servers (step 1), a browser or mobile clientapp begins downloading photos based on the embeddedURLs in that file. These URLs are custom-generatedby web servers to control traffic distribution across theserving stack: they include a unique photo identifier,
specify the display dimensions of the image, and encodethe fetch path, which specifies where a request that missesat each layer of cache should be directed next. Once thereis a hit at any layer, the photo is sent back in reverse alongthe fetch path and then returned to the client.
There are two parallel stacks that cache photos, onerun by Akamai and one by Facebook. For this study,we focus on accesses originating at locations for whichFacebook’s infrastructure serves all requests, ensuringthat the data reported here has no bias associated withour lack of instrumentation for the Akamai stack. Theremainder of this section describes Facebook’s stack.
There are three layers of caches in front of the backendservers that store the actual photos. These caches, orderedby their proximity to clients, are the client browser’scache, an Edge Cache, and the Origin Cache.
Browser The first cache layer is in the client’s browser.The typical browser cache is co-located with the client,uses an in-memory hash table to test for existence in thecache, stores objects on disk, and uses the LRU evictionalgorithm. There are, however, many variations on thetypical browser cache. If a request misses at the browsercache, the browser sends an HTTP request out to theInternet (step 2). The fetch path dictates whether thatrequest is sent to the Akamai CDN or the Facebook Edge.
Edge The Facebook Edge is comprised of a set of EdgeCaches that each run inside points of presence (PoPs)close to end users. There are a small number of EdgeCaches spread across the US that all function indepen-dently. (As of this study there are nine high-volume EdgeCaches, though this number is growing and they are be-ing expanded internationally.) The particular Edge Cachethat a request encounters is determined by its fetch path.Each Edge Cache has an in-memory hash table that holdsmetadata about stored photos and large amounts of flashmemory that store the actual photos [10]. If a request hits,it is retrieved from the flash and returned to the clientbrowser. If it misses, the photo is fetched from Face-book’s Origin Cache (step 3) and inserted into this EdgeCache. The Edge caches currently all use a FIFO cachereplacement policy.
Origin Requests are routed from Edge Caches toservers in the Origin Cache using a hash mapping basedon the unique id of the photo being accessed. Like theEdge Caches, each Origin Cache server has an in-memoryhash table that holds metadata about stored photos and alarge flash memory that stores the actual photos. It uses aFIFO eviction policy.
Haystack The backend, or Haystack, layer is accessedwhen there is a miss in the Origin cache. Because Originservers are co-located with storage servers, the image canoften be retrieved from a local Haystack server (step 4). Ifthe local copy is held by an overloaded storage server or is

Figure 1: Facebook photo serving stack: components are linked to show the photo retrieval work-flow. Desktopand Mobile clients initiate request traffic, which routes either directly to the Facebook Edge or via Akamai de-pending on the fetch path. The Origin Cache collects traffic from both paths, serving images from its cache andresizing them if needed. The Haystack backend holds the actual image content. Shading highlights componentstracked directly (dark) or indirectly (light) in our measurement infrastructure.
unavailable due to system failures, maintenance, or someother issue, the Origin will instead fetch the informationfrom a local replica if one is available. Should there be nolocally available replica, the Origin redirects the requestto a remote data center.
Haystack resides at the lowest level of the photo serv-ing stack and uses a compact blob representation, stor-ing images within larger segments that are kept on log-structured volumes. The architecture is optimized tominimize I/O: the system keeps photo volume ids andoffsets in memory, performing a single seek and a singledisk read to retrieve desired data [2].
2.2 Photo TransformationsFacebook serves photos in many different forms to manydifferent users. For instance, a desktop user with a bigwindow will see larger photos than a desktop users witha smaller window who in turn sees larger photos than amobile user. The resizing and cropping of photos com-plicates the simple picture of the caching stack we havepainted thus far.
In the current architecture all transformations are donebetween the backend and caching layers, and thus alltransformations of an image are treated as independentblobs. As a result, a single cache may have many trans-formation of the same photo. These transformations aredone by Resizers (shown closest to the backend serverin Figure 1), which are co-located with Origin Cacheservers. The Resizers also transform photos that are re-quested by the Akamai CDN, though the results of thosetransformations are not stored in the Origin Cache.
When photos are first uploaded to Facebook they arescaled to a small number of common, known sizes, andcopies at each of these sizes are saved to the backendHaystack machines. Requests for photos include not onlythe exact size and cropping requested, but also the orig-inal size from which it should be derived. The cachinginfrastructure treats all of these transformed and croppedphotos as separate objects. One opportunity created by
our instrumentation is that it lets us explore hypotheticalalternatives to this architecture. For example, we eval-uated the impact of a redesign that pushes all resizingactions to the client systems in Section 6.
2.3 Objective of the Caching StackThe goals of the Facebook photo-caching stack differby layer. The primary goal of the Edge cache is to re-duce bandwidth between the Edge and Origin datacenters,whereas the main goal for other caches is traffic shelteringfor its backend Haystack servers, which are I/O bound.This prioritization drives a number of decisions through-out the stack. For example, Facebook opted to treat theOrigin cache as a single entity spread across multipledata centers. Doing so maximizes hit rate, and thus thedegree of traffic sheltering, even though the design some-times requires Edge Caches on the East Coast to requestdata from Origin Cache servers on the West Coast, whichincreases latency.
3 MethodologyWe instrumented Facebook’s photo-serving infrastruc-ture, gathered a month-long trace, and then analyzed thattrace using batch processing. This section presents ourdata gathering process, explains our sampling methodol-ogy, and addresses privacy considerations.
3.1 Multi-Point Data CollectionIn order to track events through all the layers of the Face-book stack it is necessary to start by independently instru-menting the various components of the stack, collectinga representative sample in a manner that permits corre-lation of events related to the same request even whenthey occur at widely distributed locations in the hierarchy(Figure 1). The ability to correlate events across differentlayers provides new types of insights:
• Traffic sheltering: We are able to quantify the degreeto which each layer of cache shelters the systems down-stream from it. Our data set enables us to distinguish

hits, misses, and the corresponding network traffic fromthe browser caches resident with millions of users downthrough the Edge Caches, the Origin Cache, and finallyto the Backend servers. This type of analysis would notbe possible with instrumentation solely at the browseror on the Facebook Edge.
• Geographical flow: We can map the geographical flowof requests as they are routed from clients to the layerthat resolves them. In some cases requests follow sur-prisingly remote routes: for example, we found that asignificant percentage of requests are routed across theUS. Our methodology enables us to evaluate the effec-tiveness of geoscale load balancing and of the cachinghierarchy in light of the observed pattern of traffic.
Client To track requests with minimal code changes,we limit our instrumentation to desktop clients and ex-clude mobile platforms: (1) all browsers use the sameweb code base, hence there is no need to write separatecode for different platforms; and (2) after a code rolloutthrough Facebook’s web servers, all desktop users willstart running that new code; an app update takes effectfar more slowly. Our client-side component is a fragmentof javascript that records when browsers load specificphotos that are selected based on a tunable sampling rate.Periodically, the javascript uploads its records to a remoteweb server and then deletes them locally.
The web servers aggregate results from multiple clientsbefore reporting them to Scribe [15], a distributed loggingservice. Because our instrumentation has no visibilityinto the Akamai infrastructure, we limit data collection torequests for which Facebook serves all traffic; selected togenerate a fully representative workload. By correlatingthe client logs with the logs collected on the Edge cache,we can now trace requests through the entire system.
Edge Cache Much like the client systems, each Edgehost reports sampled events to Scribe whenever an HTTPresponse is sent back to the client. This allows us to learnwhether the associated request is a hit or a miss on theEdge, along with other details. When a miss happens, thedownstream protocol requires that the hit/miss status atOrigin servers should also be sent back to the Edge. Thereport from the Edge cache contains all this information.
Origin Cache While the Edge trace already containsthe hit/miss status at Origin servers, it does not providedetails about communication between the Origin serversand the Backend. Therefore, we also have each Originhost report sampled events to Scribe when a request tothe Backend is completed.
To ensure that the same photos are sampled in all threetraces, our sampling strategy is based on hashing: wesample a tunable percentage of events by means of adeterministic test on the photoId. We explore this furtherin Section 3.3.
Scribe aggregates logs and loads them into Hive [21],Facebook’s data warehouse. Scripts then perform statisti-cal analyses yielding the graphs shown below.
3.2 Correlating RequestsBy correlating traces between the different layers of thestack we accomplish several goals. First, we can askwhat percentage of requests result in cache hits within theclient browser. Additionally, we can study the paths takenby individual requests as they work their way down thestack. Our task would be trivial if we could add uniquerequest-IDs to every photo request at the browser and thenpiggyback that information on the request as it travelsalong the stack, such an approach would be disruptive tothe existing Facebook code base. This forces us to detectcorrelations in ways that are sometimes indirect, and thatare accurate but not always perfectly so.
The first challenge arises in the client, where the detec-tion of client-side cache hits is complicated by a techni-cality: although we do know which URLs are accessed,if a photo request is served by the browser cache ourJavascript instrumentation has no way to determine thatthis was the case. For example, we can’t infer that a localcache hit occured by measuring the time delay betweenphoto fetch and completion: some clients are so closeto Edge Caches that an Edge response could be fasterthan the local disk. Accordingly, we infer the aggregatedcache performance for client object requests by compar-ing the number of requests seen at the browser with thenumber seen in the Edge for the same URL.
To determine the geographical flow between clientsand PoPs, we correlate browser traces and Edge traces ona per request basis. If a client requests a URL and thenan Edge Cache receives a request for that URL from theclient’s IP address, then we assume a miss in the browsercache triggered an Edge request. If the client issuesmultiple requests for a URL in a short time period andthere is one request to an Edge Cache, then we assumethe first request was a miss at browser but all subsequentrequests were hits.
Correlating Backend-served requests in the Edge tracewith requests between the Origin and Backend layers isrelatively easy because they have a one-to-one mapping.If a request for a URL is satisfied after an Origin miss,and a request for the same URL occurs between the sameOrigin host and some Backend server, then we assumethey are correlated. If the same URL causes multiplemisses at the same Origin host, we align the requestswith Origin requests to the Backend in timestamp order.
3.3 Sampling BiasTo avoid affecting performance, we sample requests in-stead of logging them all. Two sampling strategies wereconsidered: (1) sampling requests randomly, (2) sam-

pling focused on some subset of photos selected by adeterministic test on photoId. We chose the latter for tworeasons:
• Fair coverage of unpopular photos: Sampling basedon the photo identifier enables us to avoid bias in favorof transiently popular items. A biased trace could leadto inflated cache performance results because popularitems are likely stored in cache.
• Cross stack analysis: By using a single deterministicsampling rule that depends only on the unique photoId,we can capture and correlate events occurring at differ-ent layers.
A potential disadvantage of this approach is that becausephoto-access workload is Zipfian, a random hashingscheme could collect different proportions of photos fromdifferent popularity levels. This can cause the estimatedcache performance to be inflated or deflated, reflectingan overly high or low coverage of popular objects. Toquantify the degree of bias in our traces, we further down-sampled our trace to two separate data sets, each of whichcovers 10% of our original photoIds. While one set in-flates the hit ratios at browser, Edge and Origin caches by3.6%, 2% and 0.4%, the other set deflates the hit ratios atbrowser and Edge caches 0.5% and 4.3%, resp. Overall,the browser and Edge cache performance are more sen-sitive to workload selection based on photoIds than theOrigin. Comparing to Facebook’s live monitoring data,which has a higher sampling ratio but lower samplingduration, our reported Edge hit ratio is lower by about 5%and our Origin hit ratio is about the same. We concludedthat our sampling scheme is reasonably unbiased.
3.4 Privacy PreservationWe took a series of steps to preserve the privacy of Face-book users. First, all raw data collected for this study waskept within the Facebook data warehouse (which livesbehind a company firewall) and deleted within 90 days.Second, our data collection logic and analysis pipelineswere heavily reviewed by Facebook employees to ensurecompliance with Facebook privacy commitments. Ouranalysis does not access image contents or users profiles(however, we do sample some meta-information: photosize, age and the owner’s number of followers). Finally,as noted earlier, our data collection scheme is random-ized and based on photoId, not user-id; as such, it onlyyields aggregated statistics for a cut across the total setof photos accessed during our study period.
4 Workload CharacteristicsOur analysis examines more than 70 TB of data, all cor-responding to client-initiated requests that traversed theFacebook photo-serving stack during a one-month sam-pling period. Table 1 shows summary statistics for ourtrace. Our trace includes over 77M requests from 13.2M
user browsers for more than 1.3M unique photos. Ouranalysis begins with a high level characterization of thetrace, and then dives deeper in the sections that follow.
Table 1 gives the number of requests and hits at eachsuccessive layer. Of the 77.2M browser requests, 50.6Mare satisfied by browser caches (65.5%), 15.4M by theEdge Caches (20.0%), 3.6M by the Origin cache (4.6%),and 7.6M by the Backend (9.9%). There is an enor-mous working set and the photo access distribution islong-tailed with a significant percentage of accesses aredirected to low-popularity photos. Looking next at bytesbeing transferred at different layers, we see that among492.2GB of photo traffic being delivered to the client,492.2−250.6 = 241.6GB were served by Edge caches,250.6−187.2 = 63.4GB were served by the Origin and187.2GB were derived from Backend fetches, which cor-responds to over 456GB of traffic between the Origin andBackend before resizing.
This table also gives the hit ratio at each caching layer.The 65.5% hit ratio at client browser caches providessignificant traffic sheltering to Facebook’s infrastructure.Without the browser caches, requests to the Edge Cacheswould approximately triple. The Edge Caches have a58.0% hit ratio and this also provides significant traf-fic sheltering to downstream infrastructure: if the EdgeCaches were removed, requests to the Origin Cache andthe bandwidth required from it would more than dou-ble. Although the 31.8% hit ratio achieved by the OriginCache is the lowest among the caches present in the Face-book stack, any hits that do occur at this level reducecosts in the storage layer and eliminate backend networkcost, justifying deployment of a cache at this layer.
Recall that each size of a photo is a distinct object forcaching purposes. The Photos w/o size row ignores thesize distinctions and presents the number of distinct un-derlying photos being requested. The number of distinctphotos requests at each tier remains relatively constant,about 1.3M. This agrees with our intuition about caches:they are heavily populated with popular content repre-sented at various sizes, but still comprise just a smallpercentage of the unique photos accessed in any period.For the large numbers of unpopular photos, cache missesare common. The Photos w/ size row breaks these figuresdown, showing how many photos are requested at eachlayer, but treating each distinct size of an image as a sep-arate photo. While the number decreases as we traversethe stack, the biggest change occurs in the Origin tier,suggesting that requests for new photo sizes are a sourceof misses. The Haystack Backend maintains each photoat four commonly-requested sizes, which helps explainwhy the count seen in the last column can exceed thenumber of unique photos accessed: for requests corre-sponding to these four sizes, there is no need to undertakea (costly) resizing computation.

Inside browser Edge caches Origin cache Backend (Haystack)
Photo requests 77,155,557 26,589,471 11,160,180 7,606,375
Hits 50,566,086 15,429,291 3,553,805 7,606,375
% of traffic served 65.5% 20.0% 4.6% 9.9%
Hit ratio 65.5% 58.0% 31.8% N/A
Photos w/o size 1,384,453 1,301,972 1,300,476 1,295,938
Photos w/ size 2,678,443 2,496,512 2,484,155 1,531,339
Users 13,197,196 N/A N/A N/A
Client IPs 12,341,785 11,083,418 1,193 1,643
Client geolocations 24,297 23,065 24 4
Bytes transferred N/A 492.2 GB 250.6 GB 456.5 GB (187.2 GB after resizing)
Table 1: Workload characteristics: broken down by different layers across the photo-serving stack where trafficwas observed; Client IPs refers to the number of distinct IP addresses identified on the requester side at eachlayer, and Client geolocations refers to the number of distinct geographical regions to which those IPs map.
��
���
���
���
���
����
�� �� ��� ��� ���� �� ��
�������������������
������������������
�������������������������
Figure 2: Cumulative distribution function (CDF) onobject size being transferred through the Origin.
The size distribution of transferred photos dependsupon the location at which traffic is observed. Figure 2illustrates the cumulative distribution of object size trans-ferred before and after going through the Origin Cachefor all Backend fetches. After photos are resized, thepercentage of transferred objects smaller than 32KB in-creases from 47% to over 80%.
The rows labeled Client IPs and Client geolocations inTable 1 offer measurements of coverage of our overall in-strumentation stack. For example, we see that more than12 million distinct client IP addresses covering over 24thousand geolocations (cities or towns) used the system,that 1,193 distinct Facebook Edge caches were tracked,etc. As we move from left to right through the stack wesee traffic aggregate from massive numbers of clients toa moderate scale of Edge regions and finally to a smallnumber of data centers. Section 5 undertakes a detailedanalysis of geolocation phenomena.
4.1 Popularity DistributionA natural way to quantify object popularity is by track-ing the number of repeated requests for each photo. ForHaystack we consider each stored common sized photoas an object. For other layers we treat each resized vari-ant as an object distinct from the underlying photo. Byknowing the number of requests for each object, we canthen explore the significance of object popularity in de-termining Facebook’s caching performance. Prior stud-
ies of web traffic found that object popularity followsa Zipfian distribution [4]. Our study of browser accesspatterns supports this finding. However, at deeper levelsof the photo stack, the distribution flattens, remainingmostly Zipf-like (with decreasing Zipf-coefficient α ateach level), but increasingly distorted at the head and tail.By the time we reach the Haystack Backend, the distri-bution more closely resembles a stretched exponentialdistribution [12].
Figures 3a, 3b, 3c and 3d show the number of requeststo each unique photo blob as measured at different layers,ordered by popularity rank in a log-log scale. Becauseeach layer absorbs requests to some subset of items, therank of each blob can change if popularity is recomputedlayer by layer. To capture this effect visually, we plot-ted the rank shift, comparing popularity in the browserranking to that seen in the Edge (Figure 3e), in the Origintier (Figure 3f) and in Haystack (Figure 3g). In thesegraphs, the x-axis is the rank of a particular photo blobas ordered on browsers, while the y-axis gives the rankon the indicated layer for that same photo object. Thetype of blob is decided by the indicated layer. Had therebeen no rank shift, these graphs would match the straightblack line seen in the background.
As seen in these plots, item popularity distributionsat all layers are approximately Zipfian (Figures 3a-3d).However, level by level, item popularities shift, especiallyfor the most popular 100 photo blobs in the Edge’s pop-ularity ranking. For example, when we look at the rankshift between browser and Edge (Figure 3e), where 3 top-10 objects dropped out of the highest-popularity rankingand a substantial fraction of the 10th-100th most popularobjects dropped to around 1000th and even 10000th onthe Edge (“upward” spikes correspond to items that weremore popular in the browser ranking than in the Edgeranking).
As traffic tunnels deeper into the stack and reaches firstthe Origin Cache and then Haystack, millions of requests

������������������������
��� ��� ��� ��� ��� ��� ��� ���
������������������
����������������������
(a) Browser
������������������������
��� ��� ��� ��� ��� ��� ��� ���
������������������
�������������������
(b) Edge
������������������������
��� ��� ��� ��� ��� ��� ��� ���
������������������
���������������������
(c) Origin
������������������������
��� ��� ��� ��� ��� ��� ��� ���
������������������
�����������������������
(d) Haystack
���������������������
��� ��� ���
������������
���������������
(e) Rank shift from Browser to Edge
���������������������
��� ��� ���
��������������
���������������
(f) Rank shift from Browser to Origin
���������������������
��� ��� ���
����������������
���������������
(g) Rank shift from Browser to Haystack
Figure 3: Popularity distribution. Top: Number of requests to unique photos at each layer, ordered from themost popular to the least. Bottom: a comparison of popularity of items in each layer to popularity in the clientbrowser, with the exact match shown as a straight line. Shifting popularity rankings are thus evident as spikes.Notice in (a)-(d) that as we move deeper into the stack, these distributions flatten in a significant way.
are served by each caching layer, hence the number ofrequests for popular images is steadily reduced. Thisexplains why the distributions seen on the Edge, Originand Haystack remain approximately Zipfian, but the Zipfcoefficient, α , becomes smaller: the stream is becomingsteadily less cacheable. Yet certain items are still beingcached effectively, as seen by the dramatic popularity-rank shifts as we progress through the stack.
4.2 Hit Ratio
Given insight into the popularity distribution for distinctphoto blobs, we can relate popularity to cache hit ratioperformance as a way to explore the question posed ear-lier: To what extent does photo blob popularity shapecache hit ratios? Figure 4a illustrates the traffic sharein terms of percent of client’s requests served by eachlayer during a period of approximately one week. Clientbrowsers resolved ~65% of the traffic from the localbrowser cache, the Edge cache served ~20%, the Origintier ~5%, and Haystack handled the remaining ~10%. Al-though obtained differently, these statistics are consistentwith the aggregated results we reported in Table 1.
Figure 4b breaks down the traffic served by each layerinto image-popularity groups. We assign each photo bloba popularity rank based on the number of requests inour trace. The most popular photo blob has rank 1 andthe least popular blob has rank over 2.6M. We then binitems by popularity, using logarithmically-increasing binsizes. The figure shows that the browser cache and Edgecache served more than 89% of requests for the hundred-thousand most popular images (groups A-E). As photoblobs become less popular (groups F then G) they are lesslikely to be resident in cache and thus a higher percent-age of requests are satisfied by the Haystack Backend. In
particular, we see that Haystack served almost 80% of re-quests for the least popular group (G). The Origin Cachealso shelters the Backend from a significant amount oftraffic, and this sheltering is especially effective for blobsin the middle popularity groups (D, E and F), which arenot popular enough to be retained in the Edge cache.
Figure 4c illustrates the hit ratios binned by the samepopularity groups for each cache layer. It also shows thepercent of requests to each popularity group. One inter-esting result is the dramatically higher hit ratios for theEdge and Origin layers than the browser cache layer forpopular photos (groups A-B). The explanation is straight-forward. Browser caches can only serve photos that thisparticular client has previously downloaded, while theEdge and Origin caches are shared across all clients andcan serve photos any client has previously downloaded.The reverse is true for unpopular photos (groups E-G).They have low hit ratios in the shared caches because theyare quickly evicted for more generally popular content,but remain in the individual browser caches, which seetraffic from only a single user.
Popularity group # Requests # Unique IPs Req/IP ratio
A 5120408 665576 7.7
B 8313854 1530839 5.4
C 15497215 2302258 6.7
Table 2: Access statistics for selected groups. “Viral”photos are accessed by massive numbers of clients,rather than accessed many times by few clients, sobrowser caching is of only limited utility.
Looking closely at the hit ratios, it is at first counter-intuitive that the browser cache has a lower hit ratio forgroup B than the next less popular photo group C. The

��
���
���
���
���
����
��� ��� ��� ��� ��� ��� ���
�������������������
�������������
������� ���� ������ ��������
(a) Traffic share for a week
��
���
���
���
���
����
� � � � � � � ���
�������������������
������������������������
���������������������������������������������������
(b) Traffic share for popularity groups
��
���
���
���
���
����
����� � ������ ����� � ������ � ���� � ������
���������
�����������������������������������������������
��������������������������������������������
(c) Hit ratio for popularity groups
Figure 4: Traffic distribution. Percent of photo requests served by each layer, (a) aggregated daily for a week;(b) binned by image popularity rank on a single day. For (b), 1-10 represent the 10 most popular photos, 10-100the 90 next most popular, etc. (c) shows the hit ratios for each cache layer binned by the same popularity group,along with each group’s traffic share.
likely reason is that many photo blobs in this group are“viral,” in the sense that large numbers of distinct clientsare accessing them concurrently. Table 2 confirms this byrelating the number of requests, the number of distinct IPaddresses, and the ratio between these two for the top 3popularity groups. As we can see, the ratio between thenumber of requests and the number of IP addresses forgroup B is lower than the more popular group A and lesspopular group C. We conclude that although many clientswill access “viral” content once, having done so they areunlikely to subsequently revisit that content. On the otherhand, a large set of photo blobs are repeatedly visitedby the same group of users. This demonstrates that theEdge cache and browser cache complement one anotherin serving these two categories of popular images, jointlyaccounting for well over 90% of requests in popularitygroups A, B and C of Figure 4b.
5 Geographic Traffic DistributionThis section explores the geographical patterns in re-quest flows. We analyze traffic between clients and EdgeCaches, how traffic is routed between the Edge Cachesand Origin Cache, and how Backend requests are routed.Interestingly (and somewhat surprisingly), we find signif-icant levels of cross-country routing at all layers.
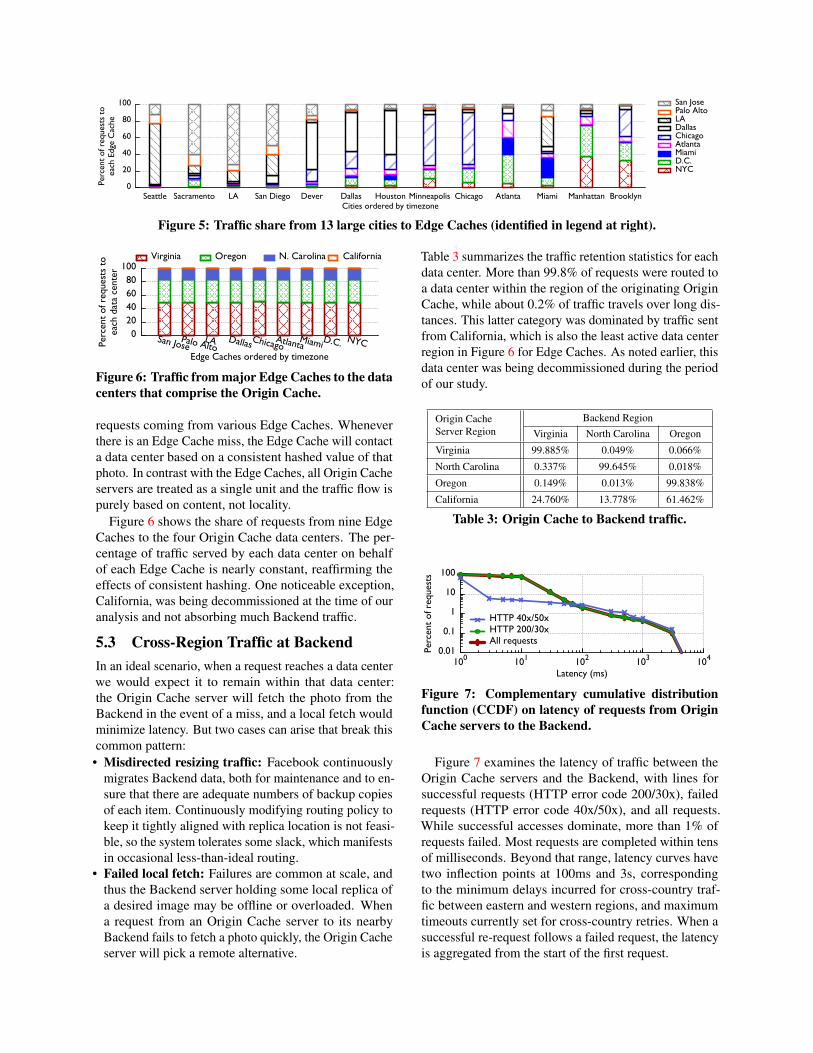
5.1 Client To Edge Cache TrafficWe created a linked data set that traces activities forphoto requests from selected cities to US-based EdgeCaches. We selected thirteen US-based cities and nineEdge Caches, all heavily loaded during the period of ourstudy. Figure 5 shows the percentage of requests fromeach city that was directed to each of the Edge Caches.Timezones are used to order cities (left is West) and EdgeCaches (top is West).
Notice that each city we examine is served by all nineEdge Caches, even though in many cases this includesEdge Caches located across the country that are accessi-ble only at relatively high latency. Indeed, while everyEdge Cache receives a majority of its requests from geo-graphically nearby cities, the largest share does not nec-
essarily go to the nearest neighbor. For example, fewerAtlanta requests are served by the Atlanta Edge Cachethan by the D.C. Edge Cache. Miami is another interest-ing case: Its traffic was distributed among several EdgeCaches, with 50% shipped west and handled in San Jose,Palo Alto and LA and only 24% handled in Miami.
The reason behind this geographical diversity is a rout-ing policy based on a combination of latency, Edge Cachecapacity and ISP peering cost, none of which necessarilytranslates to physical locality. When a client request isreceived, the Facebook DNS server computes a weightedvalue for each Edge candidate, based on the latency, cur-rent traffic, and traffic cost, then picks the best option.The peering costs depend heavily on the ISP peeringagreements for each Edge Cache, and, for historical rea-sons, the two oldest Edge Caches in San Jose and D.C.have especially favorable peering quality with respect tothe ISPs hosting Facebook users. This increases the valueof San Jose and D.C. compared to the other Edge Caches,even for far-away clients.
A side effect of Facebook’s Edge Cache assignmentpolicy is that a client may shift from Edge Cache to EdgeCache if multiple candidates have similar values, espe-cially when latency varies throughout the day as networkdynamics evolve. We examined the percentage of clientsserved by a given number of Edge Caches in our trace:0.9% of clients are served by 4 or more Edge Caches,3.6% of clients are served by 3 or more Edge Caches, and17.5% of clients are served by 2 or more Edge Caches.Client redirection reduces the Edge cache hit ratio be-cause every Edge Cache reassignment brings the poten-tial for new cold cache misses. In Section 6, we discusspotential improvement from collaborative caching.
5.2 Edge Cache to Origin Cache TrafficCurrently Facebook serves user-uploaded photos at fourregional data centers in the United States. Two are on theEast Coast (in Virginia and North Carolina) and two oth-ers are on the West Coast (in Oregon and California). Inaddition to hosting Haystack Backend clusters, these datacenters comprise the Origin Cache configured to handle
��
���
���
���
���
����
������� ���������� �� ��������� ����� ������ ������� ����������� ������� ������� ����� ��������� ��������
����������������������
���������������
��������������������������
���������������������������������������������������
Figure 5: Traffic share from 13 large cities to Edge Caches (identified in legend at right).
������������������
�����������������
�� ��������������������
��������� �������������������������
����������������
�������������������������������
�������� ������ ����������� ����������
Figure 6: Traffic from major Edge Caches to the datacenters that comprise the Origin Cache.
requests coming from various Edge Caches. Wheneverthere is an Edge Cache miss, the Edge Cache will contacta data center based on a consistent hashed value of thatphoto. In contrast with the Edge Caches, all Origin Cacheservers are treated as a single unit and the traffic flow ispurely based on content, not locality.
Figure 6 shows the share of requests from nine EdgeCaches to the four Origin Cache data centers. The per-centage of traffic served by each data center on behalfof each Edge Cache is nearly constant, reaffirming theeffects of consistent hashing. One noticeable exception,California, was being decommissioned at the time of ouranalysis and not absorbing much Backend traffic.
5.3 Cross-Region Traffic at BackendIn an ideal scenario, when a request reaches a data centerwe would expect it to remain within that data center:the Origin Cache server will fetch the photo from theBackend in the event of a miss, and a local fetch wouldminimize latency. But two cases can arise that break thiscommon pattern:
• Misdirected resizing traffic: Facebook continuouslymigrates Backend data, both for maintenance and to en-sure that there are adequate numbers of backup copiesof each item. Continuously modifying routing policy tokeep it tightly aligned with replica location is not feasi-ble, so the system tolerates some slack, which manifestsin occasional less-than-ideal routing.
• Failed local fetch: Failures are common at scale, andthus the Backend server holding some local replica ofa desired image may be offline or overloaded. Whena request from an Origin Cache server to its nearbyBackend fails to fetch a photo quickly, the Origin Cacheserver will pick a remote alternative.
Table 3 summarizes the traffic retention statistics for eachdata center. More than 99.8% of requests were routed toa data center within the region of the originating OriginCache, while about 0.2% of traffic travels over long dis-tances. This latter category was dominated by traffic sentfrom California, which is also the least active data centerregion in Figure 6 for Edge Caches. As noted earlier, thisdata center was being decommissioned during the periodof our study.
Origin CacheServer Region
Backend RegionVirginia North Carolina Oregon
Virginia 99.885% 0.049% 0.066%
North Carolina 0.337% 99.645% 0.018%
Oregon 0.149% 0.013% 99.838%
California 24.760% 13.778% 61.462%
Table 3: Origin Cache to Backend traffic.
�����
����
��
���
����
��� ��� ��� ��� ���
�������������������
������������
������������������������������������
Figure 7: Complementary cumulative distributionfunction (CCDF) on latency of requests from OriginCache servers to the Backend.
Figure 7 examines the latency of traffic between theOrigin Cache servers and the Backend, with lines forsuccessful requests (HTTP error code 200/30x), failedrequests (HTTP error code 40x/50x), and all requests.While successful accesses dominate, more than 1% ofrequests failed. Most requests are completed within tensof milliseconds. Beyond that range, latency curves havetwo inflection points at 100ms and 3s, correspondingto the minimum delays incurred for cross-country traf-fic between eastern and western regions, and maximumtimeouts currently set for cross-country retries. When asuccessful re-request follows a failed request, the latencyis aggregated from the start of the first request.

��
���
������
���
����
���� ������ ������ ������ ������� ���
���������
���������������������
������������ ������������ ����������������
Figure 8: Measured, ideal, and resize-enabled hitratios for clients grouped by activity. 1-10 groupsclients with ≤ 10 requests, 10-100 groups those re-porting 11 to 100 requests, etc. All groups all clients.
6 Potential ImprovementsThis section closely examines Browser, Edge, and OriginCache performance. We use simulation to evaluate theeffect of different cache sizes, algorithms, and strategies.
6.1 Browser CacheFigure 8 shows the aggregated hit ratio we observed fordifferent groups of clients. The “all” group includes allclients and had a aggregated hit ratio of 65.5%. This ismuch higher than the browser cache statistics publishedby the Chrome browser development team for generalcontent: they saw hit ratios with a Gaussian distributionaround a median of 35% for unfilled caches and 45% forfilled caches [6].
The figure also breaks down hit ratios based on theobserved activity level of clients, i.e., how many entriesare in our log for them. The least active group with 1-10logged requests saw a 39.2% hit ratio, while a more activegroup with 1K-10K logged requests saw a 92.9% hit ratio.The higher hit ratio for more active clients matches ourintuition: highly active clients are more likely to accessrepeated content than less active clients, and thus theirbrowser caches can achieve a higher hit ratio.
Browser Cache Simulation Using our trace to drivea simulation study, we can pose what-if questions. InFigure 8 we illustrate one example of the insights gainedin this manner. We investigate what the client browser hitratios would have been with an infinite cache size. Weuse the first 25% of our month-long trace to warm thecache and then evaluate using the remaining 75% of thetrace. The infinite cache size results distinguish betweencold (compulsory) misses for never-before-seen contentand capacity misses, which never happen in an infinitecache. The infinite size cache bar thus gives an upperbound on the performance improvements that could begained by increasing the cache size or improving thecache replacement policy. For most client activity groupsthis potential gain is significant, but the least active clientgroup is an interesting outlier. These very inactive clientswould see little benefit from larger or improved caches:
������������������
���� ��� �����������������������
�� �������������������
��� �����
���������
������������������
������������ ������������ ����������������
Figure 9: Measured, ideal, and resize-enabled hit ra-tios for the nine largest Edge Caches. All is the aggre-gated hit ratio for all regions. Coord gives the resultsfor a hypothetical collaborative Edge Cache.
an unbounded cache improved their hit ratio by 2.6% toslightly over 41.8%.
We also simulated the effect of moving some resiz-ing to the client: clients with a cached full-size imageresize that object rather than fetching the required imagesize. While client-side resizing does not result in largeimprovements in hit ratio for most client groups, it doesprovide a significant 5.5% improvement even relative toan unbounded cache for the least active clients.
6.2 Edge CacheTo investigate Edge cache performance at a finer gran-ularity, we analyzed the hit ratio for nine heavily usedEdge Caches. Figure 9 illustrates the actual hit ratio ob-served at each Edge Cache, a value aggregated acrossall regions, denoted “All”, and a value for a hypotheticalcollaborative cache that combines all Edge Caches into asingle Edge Cache. (We defer further discussion of thecollaborative cache until later in this subsection.) Wealso estimated the highest possible hit ratio for perfectEdge Caches by replaying access logs and assuming aninfinite cache warmed by the first 25% of our month-longtrace. We then further enhanced the hypothetical perfectEdge Caches with the ability to resize images. The resultsare stacked in Figure 9, with the actual value below andthe simulated ideal performance contributing the upperportion of each bar.
The current hit ratios range from 56.1% for D.C. to63.1% in Chicago. The upper bound on improvement,infinite size caches, has hit ratios from 77.7% in LA to85.8% in D.C.. While the current hit ratios representsignificant traffic sheltering and bandwidth reduction, themuch higher ratios for infinite caches demonstrate there ismuch room for improvement. The even higher hit ratiosfor infinite caches that can resize photos makes this pointeven clearer: hit ratios could potentially be improved tobe as high as 89.1% in LA, and to 93.8% in D.C..
Edge Cache Simulation Given the possibility of in-creases as high as 40% in hit ratios, we ran a number ofwhat-if simulations. Figures 10a and 10b explores theeffect of different cache algorithms and cache sizes for

FIFO A first-in-first-out queue is used for cache eviction. This is the algorithm Facebook currently uses.
LRU A priority queue ordered by last-access time is used for cache eviction.
LFU A priority queue ordered first by number of hits and then by last-access time is used for cache eviction.
S4LRU Quadruply-segmented LRU. Four queues are maintained at levels 0 to 3. On a cache miss, the item is inserted at the head ofqueue 0. On a cache hit, the item is moved to the head of the next higher queue (items in queue 3 move to the head of queue 3).Each queue is allocated 1/4 of the total cache size and items are evicted from the tail of a queue to the head of the next lowerqueue to maintain the size invariants. Items evicted from queue 0 are evicted from the cache.
Clairvoyant A priority queue ordered by next-access time is used for cache eviction. (Requires knowledge of the future.)
Infinite No object is ever evicted from the cache. (Requires a cache of infinite size.)
Table 4: Descriptions of the simulated caching algorithms.
��
��
��
��
��
� �� ��
���������
����������
������������������
(a) Object-Hit Ratio at San Jose
��
��
��
��
��
� �� ��
���������
����������
��������
(b) Byte-Hit Ratio at San Jose
��
��
��
��
��
� ��
���������
����������
�������
(c) Byte-Hit Ratio for a Collaborative Edge
Figure 10: Simulation of Edge Caches with different cache algorithms and sizes. The object-hit ratio and byte-hit ratio are shown for the San Jose Edge Cache in (a) and (b), respectively. The byte-hit ratio for a collaborativeEdge Cache is given in (c). The gray bar gives the observed hit ratio and size x approximates the current size ofthe cache.
the San Jose Edge Cache. We use San Jose here becauseit is the median in current Edge Cache hit ratios and theapproximate visual median graph of all nine examinedEdge Caches. The horizontal gray bar on the graph corre-sponds to the observed hit ratio for San Jose, 59.2%. Welabel the x-coordinate of the intersection between that ob-served hit ratio line and the FIFO simulation line, whichis the current caching algorithm in use at Edge Caches,as size x. This is our approximation of the current size ofthe cache at San Jose.
The different cache algorithms we explored are ex-plained briefly in Table 4. We first examine the results forobject-hit ratio. Our results demonstrate that more sophis-ticated algorithms yield significant improvements overthe current FIFO algorithm: 2.0% from LFU, 3.6% fromLRU, and 8.5% from S4LRU. Each of these improve-ments yields a reduction in downstream requests. Forinstance, the 8.5% improvement in hit ratio from S4LRUyields a 20.8% reduction in downstream requests.
The performance of the Clairvoyant algorithm demon-strates that the infinite-size-cache hit ratio of 84.3%is unachievable at the current cache size. Instead, analmost-theoretically-perfect algorithm could only achievea 77.3% hit ratio.1 This hit ratio still represents a verylarge potential increase of 18.1% in hit ratio over thecurrent FIFO algorithm, which corresponds to a 44.4%decrease in downstream requests. The large gap between
1The “Clairvoyant” algorithm is not theoretically perfect because itdoes not take object size into account. It will choose to store an objectof size 2x next accessed at time t over storing 2 objects of size x nextaccessed at times t +1 and t +2.
the best algorithm we tested, S4LRU, and the Clairvoy-ant algorithm demonstrates there may be ample gainsavailable to still-cleverer algorithms.
The object-hit ratios correspond to the success of acache in sheltering traffic from downstream layers, i.e.,decreasing the number of requests (and ultimately disk-based IO operations). For Facebook, the main goal ofEdge Caches is not traffic sheltering, but bandwidth re-duction. Figure 10b shows byte-hit ratios given differentcache sizes. These results, while slightly lower, mostlymirror the object-hit ratios. LFU is a notable exception,with a byte-hit ratio below that of FIFO. This indicatesthat LFU would not be an improvement for Facebook be-cause even though it can provide some traffic shelteringat the Edge, it increases bandwidth consumption. S4LRUis again the best of the tested algorithms with an increaseof 5.3% in byte-hit ratio at size x, which translates to a10% decrease in Origin-to-Edge bandwidth.
Figure 10 also demonstrates the effect of differentcache sizes. Increasing the size of the cache is also aneffective way to improve hit ratios: doubling the cachesize increases the object-hit ratio of the FIFO algorithmby 5.8%, the LFU algorithm by 5.6%, the LRU algorithmby 5.7%, and the S4LRU algorithm by 4.3%. Similarly,it increases the byte-hit ratios of the FIFO algorithm by4.8%, the LFU algorithm by 6.4%, the LRU algorithm by4.8%, and the S4LRU algorithm by 4.2%.
Combining the analysis of different cache algorithmsand sizes yields even more dramatic results. There is aninflection point for each algorithm at a cache size smallerthan x. This translates to higher-performing algorithms

�
��
��
��
��
� ��
���������
����������
�����������������������
����������
Figure 11: Simulation of Origin Cache with differentcache algorithms and sizes.
being able to achieve the current object-hit ratio at muchsmaller cache sizes: LFU at 0.8x, LRU at 0.65x, andS4LRU at 0.35x. The results are similar for the sizeneeded to achieve the current byte-hit ratio: LRU at 0.7xand S4LRU at 0.3x. These results provide a major insightto inform future static-content caches: a small investmentin Edge Caches with a reasonably sophisticated algorithmcan yield major reductions in traffic. Further, the smallera cache, the greater the choice of algorithm matters.
Collaborative Edge Cache We also simulated a col-laborative Edge Cache that combines all current EdgeCaches into a single logical cache. Our motivation forthis what-if scenario is twofold. First, in the currentEdge Cache design, a popular photo may be stored at ev-ery Edge Cache. A collaborative Edge Cache would onlystore that photo once, leaving it with extra space for manymore photos. Second, as we showed in Section 5, manyclients are redirected between Edge Caches, resultingin cold misses that would be avoided in a collaborativecache. Of course, this hypothetical collaborative EdgeCache might not be ultimately economical because itwould incur greater peering costs than the current systemand would likely increase client-photo-load latency.
Figure 10c gives the byte-hit ratio for different cachealgorithms and sizes for a collaborative Edge Cache. Thesize x in this graph is the sum of the estimated cachesize we found by finding the intersection of observed hitratio and FIFO simulation hit ratio for each of the nineEdge Caches. At the current cache sizes, the improve-ment in hit ratio from going collaborative is 17.0% forFIFO and 16.6% for S4LRU. Compared to the currentindividual Edge Caches running FIFO, a collaborativeEdge Cache running S4LRU would improve the byte-hitratio by 21.9%, which translates to a 42.0% decrease inOrigin-to-Edge bandwidth.
6.3 Origin CacheWe used our trace of requests to the Origin Cache toperform a what-if analysis for different cache algorithmsand sizes. We again evaluated the cache algorithms inTable 4. The results are shown in Figure 11. The observedhit ratio for the Origin Cache is shown with a gray line
and our estimated cache size for it is denoted size x.The current hit ratio relative to the Clairvoyant algo-
rithm hit ratio is much lower at the Origin Cache than atthe Edge Caches and thus provides a greater opportunityfor improvement. Moving from the FIFO cache replace-ment algorithm to LRU improves the hit ratio by 4.7%,LFU improves it by 9.8%, and S4LRU improves it by13.9%. While there is a considerable 15.5% gap betweenS4LRU and the theoretically-almost-optimal Clairvoyantalgorithm, S4LRU still provides significant traffic shelter-ing: it reduces downstream requests, and thus Backenddisk-IO operations, by 20.7%.
Increasing cache size also has a notable effect. Dou-bling cache size improves the hit ratio by 9.5% for theFIFO algorithm and 8.5% for the S4LRU algorithm. Adouble-sized S4LRU Origin Cache would increase the hitratio to 54.4%, decreasing Backend requests by 31.9%compared to a current-sized FIFO Origin Cache. Thiswould represent a significant improvement in the shelter-ing effectiveness of Facebook’s Origin Cache. Combin-ing the analysis of different cache sizes and algorithms,we see an inflection point in the graph well below thecurrent cache size: the current hit ratio can be achievedwith a much smaller cache and higher-performing algo-rithms. The current hit ratio (33.0%, in the portion of thetrace used for simulation) can be achieved with a 0.7xsize LRU cache, a 0.35x size LFU cache, or a 0.28x sizeS4LRU cache.
We omit the byte-hit ratio for the Origin Cache, but thedifference is similar to what we see at the Edge Caches.The byte-hit ratio is slightly lower than the object-hitratio, but the simulation results all appear similar withthe exception of LFU. When examined under the lens ofbyte-hit ratio LFU loses its edge over LRU and performscloser to FIFO. The S4LRU algorithm is again the bestfor byte-hit rate with a 8.8% improvement over the FIFOalgorithm, which results in 11.5% less Backend-to-Originbandwidth consumption.
7 Social-Network AnalysisThis section explores the relationship between photo re-quests and various kinds of photo meta-information. Westudied two properties that intuitively should be stronglyassociated with photo traffic: the age of photos and thenumber of Facebook followers associated with the owner.
7.1 Content Age EffectIt is generally assumed that new content will draw atten-tion and hence account for the majority of traffic seenwithin the blob-serving stack. Our data set permits us toevaluate such hypotheses for the Facebook image hierar-chy by linking the traces collected from different layersto the meta-information available in Facebook’s photodatabase. We carried out this analysis, categorizing re-

������������������
���� ��� ���� ����� ����
������������������
������������
�����������
���������������
(a) Age spans from 1 hour to 1 year
���
���
���
���
� � � � � �����
������������������
������������������
(b) Age spans from 1 day to 1 week
��
���
���
���
���
����
���� ��� ���� ����� ����
�������������������
������������
������� ���� ������ ��������
(c) Traffic share for non-profile photos by age
Figure 12: Traffic popularity and requests served by layer for photos at different age. The number of requeststo each image, categorized by age of requested photos in hours, broken down at every layer across the stack.
quests for images by the age of the target content, thenlooking at the way this information varies at each layerof the stack. Photo age (in hours) was determined bysubtracting the photo creation time from the request time.Thus, even a photo uploaded the same day will have as-sociated requests sorted into 24 hourly categories. Thisanalysis excludes profile photos because Facebook’s in-ternal storage procedures for them precludes determiningtheir ago precisely.
Figure 12 plots the number of requests at each layerfor photos of different ages. In Figure 12a, we considera range of ages from 1 hour to 1 year. As content ages,the associated traffic diminishes at every layer; the rela-tionship is nearly linear when plotted on a log-log scale.Figure 12b zooms into the mid-range age scales, focusingon a week. We see a noticeable daily traffic fluctuation.We traced this to a fluctuation in photo creation time,determining that users create and upload greater num-bers of photos during certain periods of the day. Thiscreation-time effect carries through to induce the strikingphoto-access-by-age pattern observed for smaller ages.
Our analysis reveals that traffic differences betweencaches deployed close to clients (browser, Edge Cache)and storage Backend (including the Origin Cache) aremore pronounced for young photos than for old ones.This matches intuition: fresh content is popular andhence tends to be effectively cached throughout the im-age serving hierarchy, resulting in higher cache hit ratios.Figure 12c clearly exhibits this pattern. The age-basedpopularity decay of photos seen in Figure 12a is nearlyPareto, suggesting that an age-based cache replacementalgorithm could be effective.
We should note that although our traces include ac-cesses to profile photos, and we used them in all otheranalyses, we were forced to exclude profile photos for thisage-analysis. The issue relates to a quirk of the Facebookarchitecture: when a user changes his or her profile photo,Facebook creates a new profile object but reuses the samename as for the previous versions. Profile objects can bedistinguished by looking at the ownerId, which Facebooksets to the underlying photoId, but we can not determinethe time of creation. None of our other analyses are im-pacted, but we were forced to exclude profile objects in
our age analysis. The effect is to slightly reduce the com-puted traffic share for caches close to clients, especially inthe categories associated with young and popular photos.
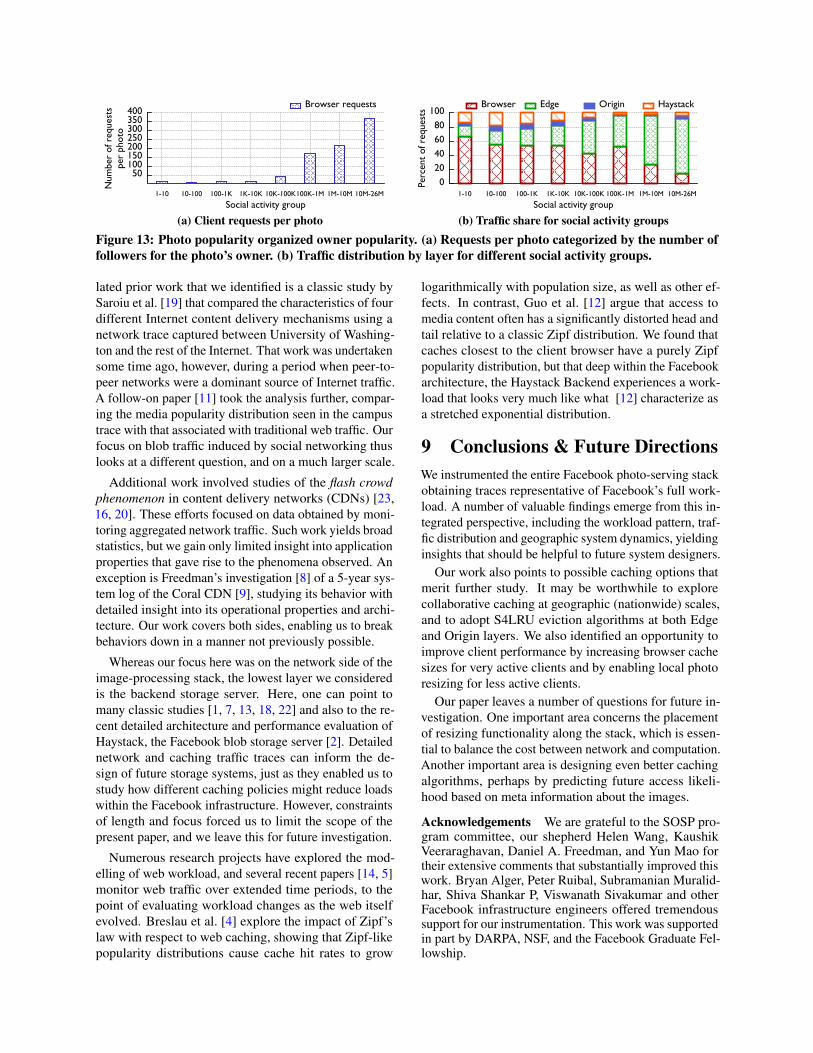
7.2 Social EffectsIntuitively, we expect that the more friends a photo ownerhas, the more likely the photo is to be accessed. Weobserved this phenomenon in our study, but only whenwe condition on owner type. We binned owners by thenumber of followers (friends for normal users, fans forpublic page owners), creating “popularity groups”, andgraphed photo requests by their owners’ groups, yieldingthe data seen in Figure 13. For each photo request, thephoto owner’s friend count was fetched on the day whenthe access happened, thus requests for one photo maybe split into multiple groups when an owner’s popularitychanges. We include profile photos in this analysis.
Figure 13a graphs the number of requests for eachphoto against the photo owner’s popularity group. MostFacebook users have fewer than 1000 friends, and forthat range the number of requests for each photo is al-most constant. For public page owners who can havethousands or millions of fans, each photo has a signifi-cantly higher number of requests, determined by the sizeof the fan base. Figure 13b further breaks down the trafficdistribution at each layer of the photo-serving stack fordifferent social activity groups. For normal users withfewer than 1000 followers (friends), the caches absorb~80% of the requests for their photos; but for public pageowners, more followers (fans) drives higher percentagesof traffic being absorbed by caches. However, browsercaches tend to have lower hit ratios for owners with morethan 1 million followers. This is because these photos fallinto the “viral” category discussed earlier in Section 4.
8 Related WorkMany measurement studies have examined web accesspatterns for services associated with content delivery, stor-age, and web hosting. To the best of our knowledge, ourpaper is the first to systematically instrument and analyzea real-world workload at the scale of Facebook, and tosuccessfully trace such a high volume of events through-out a massively distributed stack. The most closely re-
�������������������������������
���� ������ ������ ������ ��������������� ������ �������
������������������
���������
���������������������
����������������
(a) Client requests per photo
��
���
������
���
����
���� ������ ������ ������ �������� ������� ������ �������
�������������������
���������������������
������� ���� ������ ��������
(b) Traffic share for social activity groups
Figure 13: Photo popularity organized owner popularity. (a) Requests per photo categorized by the number offollowers for the photo’s owner. (b) Traffic distribution by layer for different social activity groups.
lated prior work that we identified is a classic study bySaroiu et al. [19] that compared the characteristics of fourdifferent Internet content delivery mechanisms using anetwork trace captured between University of Washing-ton and the rest of the Internet. That work was undertakensome time ago, however, during a period when peer-to-peer networks were a dominant source of Internet traffic.A follow-on paper [11] took the analysis further, compar-ing the media popularity distribution seen in the campustrace with that associated with traditional web traffic. Ourfocus on blob traffic induced by social networking thuslooks at a different question, and on a much larger scale.
Additional work involved studies of the flash crowdphenomenon in content delivery networks (CDNs) [23,16, 20]. These efforts focused on data obtained by moni-toring aggregated network traffic. Such work yields broadstatistics, but we gain only limited insight into applicationproperties that gave rise to the phenomena observed. Anexception is Freedman’s investigation [8] of a 5-year sys-tem log of the Coral CDN [9], studying its behavior withdetailed insight into its operational properties and archi-tecture. Our work covers both sides, enabling us to breakbehaviors down in a manner not previously possible.
Whereas our focus here was on the network side of theimage-processing stack, the lowest layer we consideredis the backend storage server. Here, one can point tomany classic studies [1, 7, 13, 18, 22] and also to the re-cent detailed architecture and performance evaluation ofHaystack, the Facebook blob storage server [2]. Detailednetwork and caching traffic traces can inform the de-sign of future storage systems, just as they enabled us tostudy how different caching policies might reduce loadswithin the Facebook infrastructure. However, constraintsof length and focus forced us to limit the scope of thepresent paper, and we leave this for future investigation.
Numerous research projects have explored the mod-elling of web workload, and several recent papers [14, 5]monitor web traffic over extended time periods, to thepoint of evaluating workload changes as the web itselfevolved. Breslau et al. [4] explore the impact of Zipf’slaw with respect to web caching, showing that Zipf-likepopularity distributions cause cache hit rates to grow
logarithmically with population size, as well as other ef-fects. In contrast, Guo et al. [12] argue that access tomedia content often has a significantly distorted head andtail relative to a classic Zipf distribution. We found thatcaches closest to the client browser have a purely Zipfpopularity distribution, but that deep within the Facebookarchitecture, the Haystack Backend experiences a work-load that looks very much like what [12] characterize asa stretched exponential distribution.
9 Conclusions & Future DirectionsWe instrumented the entire Facebook photo-serving stackobtaining traces representative of Facebook’s full work-load. A number of valuable findings emerge from this in-tegrated perspective, including the workload pattern, traf-fic distribution and geographic system dynamics, yieldinginsights that should be helpful to future system designers.
Our work also points to possible caching options thatmerit further study. It may be worthwhile to explorecollaborative caching at geographic (nationwide) scales,and to adopt S4LRU eviction algorithms at both Edgeand Origin layers. We also identified an opportunity toimprove client performance by increasing browser cachesizes for very active clients and by enabling local photoresizing for less active clients.
Our paper leaves a number of questions for future in-vestigation. One important area concerns the placementof resizing functionality along the stack, which is essen-tial to balance the cost between network and computation.Another important area is designing even better cachingalgorithms, perhaps by predicting future access likeli-hood based on meta information about the images.
Acknowledgements We are grateful to the SOSP pro-gram committee, our shepherd Helen Wang, KaushikVeeraraghavan, Daniel A. Freedman, and Yun Mao fortheir extensive comments that substantially improved thiswork. Bryan Alger, Peter Ruibal, Subramanian Muralid-har, Shiva Shankar P, Viswanath Sivakumar and otherFacebook infrastructure engineers offered tremendoussupport for our instrumentation. This work was supportedin part by DARPA, NSF, and the Facebook Graduate Fel-lowship.

References[1] M. G. Baker, J. H. Hartman, M. D. Kupfer, K. W. Shirriff,
and J. K. Ousterhout. Measurements of a DistributedFile System. In Proc. Symposium on Operating SystemsPrinciples (SOSP), Pacific Grove, California, USA, 1991.ACM.
[2] D. Beaver, S. Kumar, H. C. Li, J. Sobel, and P. Vajgel.Finding a Needle in Haystack: Facebook’s Photo Storage.In Proc. Symposium on Operating Systems Design andImplementation (OSDI), Vancouver, BC, Canada, Oct.2010. USENIX.
[3] A. Bigian. Blobstore: Twitter’s in-house photo storagesystem. http://tinyurl.com/cda5ahq, 2012.
[4] L. Breslau, P. Cue, P. Cao, L. Fan, G. Phillips, andS. Shenker. Web Caching and Zipf-like Distributions:Evidence and Implications. In Proc. International Confer-ence on Computer Communications (INFOCOM). IEEE,Mar. 1999.
[5] M. Butkiewicz, H. V. Madhyastha, and V. Sekar. Under-standing website complexity: measurements, metrics, andimplications. In Proc. SIGCOMM Internet MeasurementConference (IMC), Berlin, Germany, Nov. 2011. ACM.
[6] W. Chan. Chromium cache metrics. http://tinyurl.com/csu34wa, 2013.
[7] Y. Chen, K. Srinivasan, G. Goodson, and R. Katz. DesignImplications for Enterprise Storage Systems via Multi-Dimensional Trace Analysis. In Proc. Symposium onOperating Systems Principles (SOSP), Cascais, Portugal,2011. ACM.
[8] M. J. Freedman. Experiences with CoralCDN: A five-yearoperational view. In Proc. 7th Symposium on NetworkedSystems Design and Implementation (NSDI 10), San Jose,CA, Apr. 2010.
[9] M. J. Freedman, E. Freudenthal, and D. Mazieres. Democ-ratizing content publication with Coral. In Proc. Sympo-sium on Networked Systems Design and Implementation(NSDI), San Francisco, California, Mar. 2004. USENIX.
[10] A. Gartrell, M. Srinivasan, B. Alger, and K. Sundararajan.McDipper: A key-value cache for Flash storage. http://tinyurl.com/c39w465, 2013.
[11] K. P. Gummadi, R. J. Dunn, S. Saroiu, S. D. Gribble,H. M. Levy, and J. Zahorjan. Measurement, Modeling,and Analysis of a Peer-to-Peer File-Sharing Workload.In Proc. Symposium on Operating Systems Principles,Bolton Landing, NY, USA, Dec. 2003. ACM.
[12] L. Guo, E. Tan, S. Chen, Z. Xiao, and X. Zhang. Thestretched exponential distribution of internet media accesspatterns. In Proc. Symposium on Principles of distributedcomputingi (PODC), Toronto, Canada, Aug. 2008. ACM.
[13] T. Harter, C. Dragga, M. Vaughn, A. C. Arpaci-Dusseau,and R. H. Arpaci-Dusseau. A File is Not a File: Under-standing the I/O Behavior of Apple Desktop Applications.In Proc. Symposium on Operating Systems Principles(SOSP), Cascais, Portugal, 2011. ACM.
[14] S. Ihm and V. S. Pai. Towards Understanding ModernWeb Traffic. In Proc. SIGCOMM Internet Measurement
Conference (IMC), Berlin, Germany, Nov. 2011. ACM.[15] R. Johnson. Facebook’s Scribe technology now open
source. http://tinyurl.com/d7qzest, 2008.[16] J. Jung, B. Krishnamurthy, and M. Rabinovich. Flash
crowds and Denial of Service attacks: Characterizationand implications for CDNs and web sites. In Proc. Inter-national World Wide Web conference (WWW), Honolulu,Hawaii, USA, May 2002. ACM.
[17] S. Kavalanekar, B. L. Worthington, Q. Zhang, andV. Sharda. Characterization of storage workload tracesfrom production Windows Servers. In International Sym-posium on Workload Characterization (IISWC), Seattle,Washington, USA, Sept. 2008. IEEE.
[18] J. K. Ousterhout, H. Da Costa, D. Harrison, J. A. Kunze,M. Kupfer, and J. G. Thompson. A Trace-Driven Analysisof the UNIX 4.2 BSD File System. In Proc. Symposiumon Operating Systems Principles (SOSP), Orcas Island,Washington, USA, 1985. ACM.
[19] S. Saroiu, K. P. Gummadi, R. J. Dunn, S. D. Gribble, andH. M. Levy. An analysis of Internet Content DeliverySystems. In Proc. Symposium on Operating System De-sign and Implementation (OSDI), Boston, Massachusetts,USA, Dec. 2002. USENIX.
[20] S. Scellato, C. Mascolo, M. Musolesi, and J. Crowcroft.Track globally, deliver locally: improving content deliv-ery networks by tracking geographic social cascades. InProc. International World Wide Web conference (WWW),Hyderabad, India, Mar. 2011. ACM.
[21] A. Thusoo. Hive - A Petabyte Scale Data Warehouse usingHadoop. http://tinyurl.com/bprpy5p, 2009.
[22] W. Vogels. File system usage in Windows NT 4.0. In Proc.Symposium on Operating Systems Principles (SOSP),Charleston, South Carolina, USA, 1999. ACM.
[23] P. Wendell and M. J. Freedman. Going viral: flash crowdsin an open CDN. In Proc. SIGCOMM Internet Measure-ment Conference (IMC), Berlin, Germany, Nov. 2011.ACM.