an agent-based model of behavior in “beauty contest” games
TRANSCRIPT
UNR Joint Economics Working Paper Series Working Paper No. 07-010
An Agent-Based Model of Behavior in “Beauty Contest” Games
Mark W. Nichols and Michael J. Radzicki
Department of Economics /0030 University of Nevada, Reno
Reno, NV 89557-0207 (775) 784-6850│ Fax (775) 784-4728
email: [email protected]
November, 2007
Abstract
Recently, computer simulation, particularly agent-based modeling, has grown in popularity as a method to uncover macro patterns and developments that emerge from simple micro behavior. The present paper combines both techniques by using protocol analysis to uncover player strategies in an experiment and encoding those strategies in an agent-based computer simulation. In particular, Keynes’ (1936) beauty contest analogy is simulated in a number-guessing context. Several researchers have conducted experiments asking subjects to play “p-beauty contest games” in order to compare the experimental results with those predicted by the game-theoretic, deductive reasoning concept of iterated dominance. Our results are compared with those found experimentally in order to demonstrate the usefulness of a combining agent-based modeling with protocol analysis.
JEL Classification: C15, E12 Keywords: Agent-Based modeling; Beauty contest games
DRAFT An Agent-Based Model of Behavior in “Beauty Contest” Games
Mark W. Nichols Michael J. Radzicki
Department of Economics
University of Nevada, Reno Reno, NV 89557
and
Department of Social Science and Policy Studies
Worcester Polytechnic Institute Worcester, MA 01609
An Agent-Based Model of Behavior in “Beauty Contest” Games Introduction In an article relating to complexity in economic theory, Arthur (1994) notes that
humans generally use inductive reasoning rather than the deductive reasoning assumed
by most economic models. In other words, people form hypotheses or expectations using
simple rules. These rules are then adapted or even abandoned depending on feedback
obtained from our environment. Human rationality is indeed bounded.
The use of inductive reasoning by humans raises two key issues. First, in any
given situation, what are the simple rules that people follow? Second, assuming these
rules can be uncovered, how do we model the behavior of many interacting,
heterogeneous, bounded-rational agents in that situation? Clearly a difficult task and no
doubt one of the drivers for deductive reasoning (e.g., rational expectations) assumed by
economic modelers.
Running experiments or conducting surveys and interviews are a few methods
researchers have used to infer decision making strategies. More recently, computer
simulation, particularly agent-based modeling, has grown in popularity as a method to
uncover macro patterns and developments that emerge from simple micro behavior. The
present paper combines both techniques by using protocol analysis to uncover player
strategies in an experiment and encoding those strategies in an agent-based computer
simulation. In particular, Keynes’ (1936) beauty contest analogy is simulated in a
number-guessing context. Several researchers have conducted experiments asking
subjects to play “p-beauty contest games” in order to compare the experimental results
with those predicted by the game-theoretic, deductive reasoning concept of iterated
dominance. Our results are compared with those found experimentally in order to
demonstrate the usefulness of a combining agent-based modeling with protocol analysis.
The next section provides an overview of some of the p-beauty contest
experiments that have been conducted and describes further the concept of iterated
dominance. This is followed by a brief overview of agent-based modeling. The fourth
section describes our p-beauty contest experiment, the use of protocol analysis to elicit
decision rules from participants, and the encoding of those rule in an agent based model.
The fifth section presents our results, both experimental and computer generated. The
last section offers some concluding thoughts and ideas for future research.
Expectation Formation and Depth of Reasoning (Iterated Dominance)
Perhaps no other subject in economics has received more scrutiny than
expectations. This is due in large part to their crucial role in human behavior and the
outcome of that behavior. Various theories of expectation formation including rational,
adaptive, quasi-rational, extrapolative, implicit, etc., have been proposed, each with their
own critics and supporters (see, e.g., Nerlove and Bessler, 2006).
For our purpose, we are primarily concerned with the concept of depth of
reasoning or, in game theory parlance, iterated dominance. Namely, how do I form my
expectations based on what I perceive the expectations of others to be, all of whom are
presumably engaged in similar behavior. This is perhaps best illustrated by a quote from
Keynes (1936, 155-56) describing the analogy between professional investment and a
beauty contest:
“professional investment may be likened to those newspaper competitions
in which the competitors have to pick out the six prettiest faces from a
hundred photographs, the prize being awarded to the competitor whose
choice most nearly corresponds to the average preferences of the competitors
as a whole…It is not a case of choosing those which, to the best of one’s
judgment, are really the prettiest, nor even those which average opinion
genuinely thinks the prettiest. We have reached the third degree where we
devote our intelligence to anticipating what average opinion expects the
average opinion to be. And there are some, I believe, who practice the fourth,
fifth, and higher degrees.”
Do individuals actually practice the fourth, fifth, or higher degrees of reasoning as
believed by Keynes? Drawing inspiration from this quote, numerous researchers have
studied individuals’ expectation formation, depth of reasoning, and degree of learning
using experimental methods frequently referred to as “p-beauty contest games” (Nagel,
1995; Duffy and Nagel, 1997; Ho, Camerer, Weigelt, 1998). While their exact makeup
varies, the essence of p-beauty contest games is as follows. Participants choose a number
(rather than a face in a newspaper) over a given, fixed interval [L, H], where L is the low
number (e.g., zero) and H is the high number (e.g., 100). The guesses are then made
known to all participants as is the mean and p*mean, where p is some number greater
than zero, but frequently less than one. The winner(s) is the person(s) whose guess is
closest to p*mean. The game is then repeated. At no time are participants allowed to
communicate with one another.
Variations on p-beauty contest games include altering the value of p and the
chosen metric between mean, median or maximum. The Nash equilibrium, if it exists,
varies according to the structure of the game.1 Learning is generally measured by the
convergence toward that equilibrium.
The concept of iterated dominance or depth of reasoning arises when it comes to
choosing an actual number. To illustrate, consider a p*mean game where p = .5 and L =
0; H = 100. A depth of reasoning of zero is to simply choose randomly. A depth of
reasoning of level one is to choose optimally assuming others are choosing randomly
(i.e., level zero players). A player with a level 1 depth of reasoning will choose a number
between zero and 50 since 50 is the largest p*mean possible and must therefore dominate
any number between 51 and 100. A level 2 depth of reasoning is to choose optimally
assuming others are employing level 1 depth of reasoning. Level 2 players will choose
numbers between zero and 25, since if others are level 1 players they will choose between
zero and 50. Continuing this iteration, all players choose the Nash equilibrium of zero if
their depth of reasoning is infinite.
Duffy and Nagel (1997) conducted an experiment of the above described p*mean
game and find that 73% of first round choices are consistent with a depth of reasoning of
level 1 or 2. However, no games result in the Nash equilibrium of zero even after
repeated play, although there is generally a convergence toward zero over time. Others
have found similar patterns. For example, Ho, Camerer, and Weigelt (1998) find that
first period choices are widely distributed and far from equilibrium but with a median
iterated dominance of level 2. Most choices lie between levels zero and 3, with at least
10% of participants in each category.
1 See Nagel (1995), Duffy and Nagel (1997), or Ho et al. (1998) for examples of variations in the rules and the consequences for equilibrium. Keynes’ beauty contest games is the mean game with p = 1.
However, experiments where only the chosen number is observed are speculative.
They are unable to distinguish between a level 2 player who chooses a number between
zero and 25 and a level 0 (i.e., random guesser) who just happens to choose a number
below 25. Moreover, Ho, Camerer, and Weigelt (1998, 950) note that “choices after the
first period are consistent with 70 percent of the subjects best responding to a weighted
sum of previous target numbers (weighting the previous target most strongly).” This
quote suggests that the observed behavior might be more consistent with Arthur’s (1994)
observation that people use inductive reasoning, following simple rules and adjusting
their behavior based on cues and feedback from the environment, in this case the most
recent target number and its pattern or trend over time. Before describing our procedure
for uncovering the strategies behind such behavior, a brief overview of agent-based
modeling is in order since it will be used to incorporate those strategies and simulate
results.
Agent-Based Modeling
The following is a very abbreviated overview of the key concepts underlying
agent-based modeling. For an excellent guide to the use of agent-based modeling in the
social sciences, see “An On-Line Guide for Newcomers to Agent-Based Modeling in the
Social Sciences,” available at http://www.econ.iastate.edu/tesfatsi/abmread.htm.
Agent-based modeling is a computer simulation technique where agents interact
with one another and their environment (Epstein and Axtell, 1996). Epstein (2005) notes
that agent-based models have the following characteristics: 1) heterogeneity; agents
vary, perhaps in numerous ways across many attributes; 2) Autonomy; there is no top-
down authority such as an auctioneer or benevolent pubic service provider. Rather, the
agents and their macrostructure co-evolve; 3) Explicit Space; agents interact in a given
environment, which may be artificial (e.g., a simple grid) or more realistic, consisting of
a map or other image; 4) Local Interaction; agents generally interact with their neighbors
and immediate environment. Agents frequently adapt their behavior (i.e., learn) based on
those interactions. 5) Bounded Rationality; agents have limited information and
computing power. Agent behavior is generated by simple rules that may adapt over time;
and 6) Non-equilibrium dynamics; agent behavior and feedback between agents and their
environment frequently leads to non-equilibrium outcomes, such as path dependence.
A central theme with any agent-based model is emergence. What macro
characteristics emerge from micro behaviors? If the system is complex and adaptive, i.e.,
involves the interaction of a large number of heterogeneous individuals, the emerged
macro behavior or pattern will be complex and dynamic, and therefore difficult to
determine a priori (Arthur, Durlauf, and Lane, 1997). The importance of emergence in
agent-based modeling is perhaps best exemplified by Epstein (2005, 1; quoting Epstein,
1999) who states, “if you didn’t grow it, you didn’t explain it.”
Design of the Guessing Game using Protocol Analysis and Agent-Based Modeling
Agent based modeling is an excellent tool to model many interacting,
heterogeneous agents, but how do we obtain the simple rules that people follow,
particularly when we may not know the rules a priori? Rather than randomly assign
rules, we sought to elicit strategies from participants directly.
Following the studies reviewed above, we conducted a p*mean experiment using
students from Worcester Polytechnic University. Students were told that they were to
choose a number between 0 and 100 (with 0 and 100 also possible). The person(s)
closest to .5 * mean would receive $5, with ties being split between the winners.
Everyone received $5 for participating. Three sessions were conducted and the number
of students ranged between four (sessions 1 and 3) and eight (session 2). At no time were
participants allowed to communicate with one another.
Unlike other studies that merely infer depth of reasoning from the chosen guesses,
we chose to elicit from students their chosen strategy. In particular, we used written
retrospective reports asking participants after each round the following: “With as much
detail as you can, describe the thought process you used to choose this number.2”
This question and a place to write their chosen number were the only items to
appear on the sheet of paper.3 At the end of each round, the responses were gathered,
and the average and target number (p*mean) calculated. Participants were made aware of
these as well as the individual guesses. This was repeated five times. At the end of the
fifth round, participants were paid their participation fee and any winnings.
It is important to note that participants were asked to describe their strategy after
each round rather than at the end of the experiment. This is because subjects frequently
will change their strategies during the course of an experiment and recall of the just
preceding cognitive process appears to be much better than for earlier processes. In
general, written retrospective reports for specific cognitive processes provide a very
powerful means to uncover information about that process, particularly for tasks that take
between 0.5 and 10 seconds (Ericsson and Simon, 1993). Indeed, according to Ericsson
and Simon (1993, 149), “if subjects are asked to report retrospectively on their last
2 Thaler’s (1987) one round, p*mean (p = .67) guessing game in the Financial Times, where the prize was two business class tickets to the United States from London , also asked this question to participants. 3 Participants had the entire page on which to write their answer so as to not bias them into giving brief answers. We thank Professor Jim Doyle for his assistance with this portion of our experiment.
previous cognitive process, if appears that considerable episodic memory can be retrieved
from information and cues in short-term memory.”
Agent Behavior
Discussing the p*mean game, Thaler (2000) notes that modeling it will be
difficult, but that an appropriate model will have two types of heterogeneity in
sophistication. First, agents will differ in the degree of their depth of reasoning. Second,
agents will also differ in the degree that they think about other agents. Thaler notes that
choosing zero shows a high, indeed infinite, depth of reasoning, but a lack of
consideration into how others will play. Thus, choosing zero may be the Nash
equilibrium, but is highly unlikely to be a winning guess.
There appears to be three unique stages of the experiment. The first stage is the
first period when there is no prior information. The second stage is the second period,
where agents have observed one period, but are not able to determine a pattern or trend.
Finally, the third stage corresponds with all subsequent periods when there is the
potential to observe a trend.
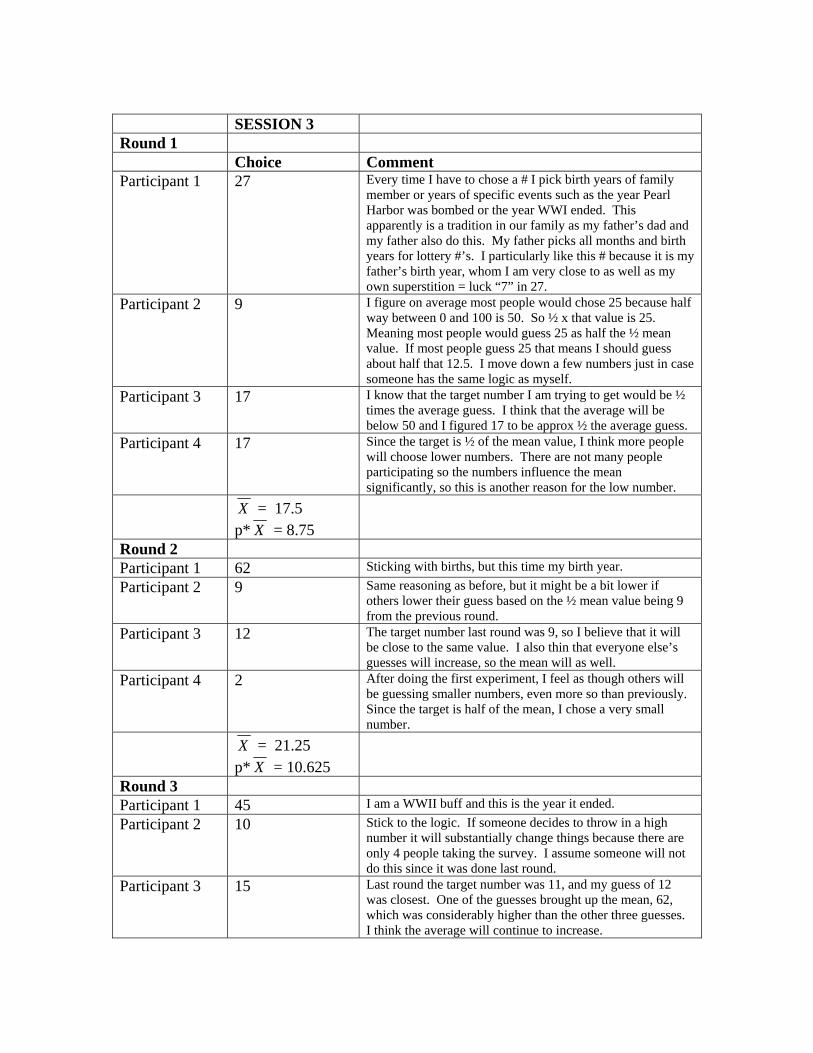
Based on comments from participants (see Appendix 1), we identified four types
of first period behavior, focused around the participant’s depth of reasoning: 1) guessing
randomly, such as choosing a favorite number, birth year, etc; One player, who stuck
with this strategy throughout chose 27 and noted that, “every time I have to choose a
number I pick birth years of family members or years of specific events, such as the year
Pearl Harbor was bombed or WWI ended.” Note that without eliciting this comment, a
guess of 27 would be viewed as rather sophisticated in terms of depth of reasoning. 2)
focusing on the midpoint of 50, being the average of 0 to 100. One participant who chose

47 wrote “I chose the number because it is about halfway between 0 and 100.” Another
wrote: “I figure the high numbers and the low numbers will balance each other out and
give a high average number. Therefore, the ½ mean will be around 50 (plus or minus
10); 3) focusing on p* the midpoint (i.e., a level 1 depth of reasoning). A representative
comment of these types of participants is “I figured the median of 0 – 100 is 50, so one
can assume that by chance the other participants will pick a variety of numbers that
average somewhere near 50. ½ of 50 is 25, so this seems like a reasonable guess.”; 4)
focusing on p2 * the midpoint (i.e., a level 2 depth of reasoning). A comment from a
participant who guessed 14 noted that “I am here to make money. Everyone will guess 0
– 100. The mean is 50, but ½ the mean is 25, so I’m guessing ½ of the ½ mean plus a
little more based on the fact that a few may guess higher than ½ the mean.”
Based on our assessment of the comments from participants, the following four
rules were implemented in our agent-based model in the first period.
A1) randomly guess from a uniform distribution, [0,100]. A2) Choose from a normal distribution (50, 5) A3) Choose from a normal distribution (p*50, 5) A4) Choose from a normal distribution (p2*50, 5)
The number of agents assigned each rule may vary as can the value of p. In our
experiment and model p = .5.
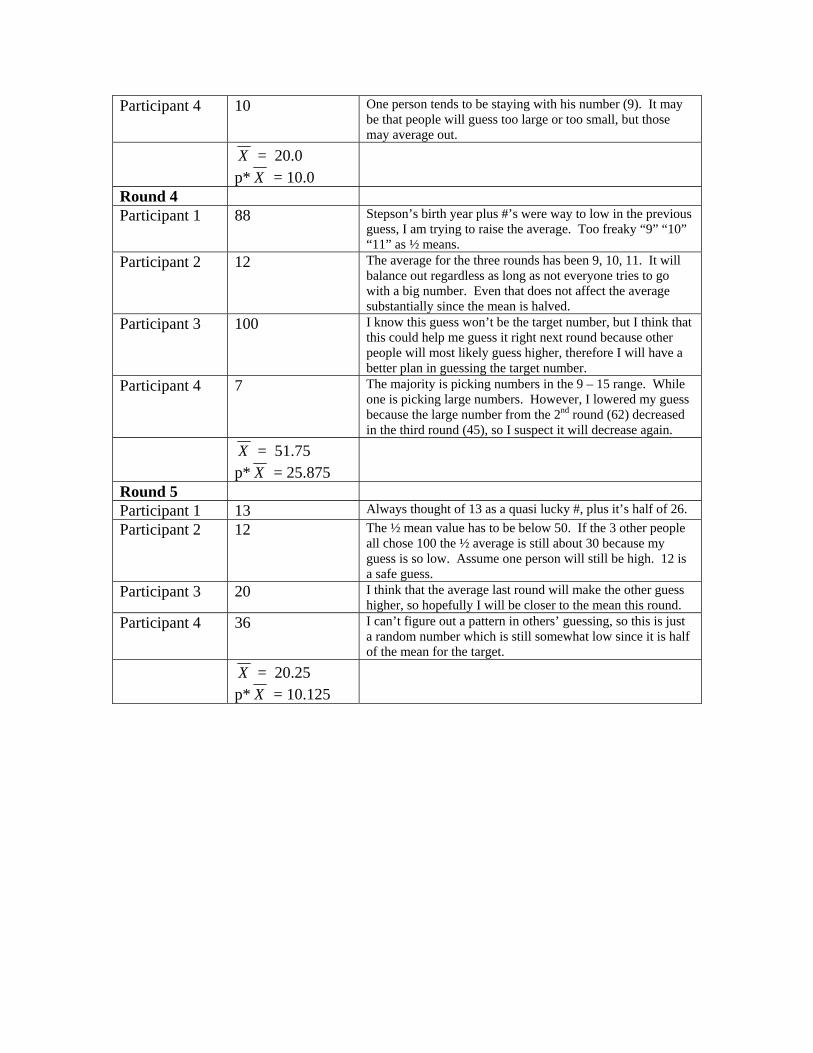
Subsequent periods generally involved behavior that was consistent with
adjustment and anchoring as described by Tversky and Kahneman (1974). In general,
players anchored on the target number from the previous round and, based on what they
expected others to do, adjusted their guesses up or down. For example, a participant who
lowered their guess wrote “after doing the first experiment, I feel as though others will be
guessing smaller numbers, even more so than previously. Since the target is ½ the mean,
I chose a very small number.” Similarly, another participant who lowered their guess
wrote “people who picked big numbers last time will choose a smaller one, and the mean
will definitely go down.”
Some agents, however, thought the numbers would go back up in the second
round, writing, for example, “people guessed low in the first round so this time I figure
they’ll guess higher to avoid a pattern,” or “the target number last round was 9, so I
believe it will be close to the same value. I also think that everyone else’s guesses will
increase, so the mean will as well.”
Those agents that won in the first round generally kept their strategy in the second
writing comments such as “stick to the logic” or “my previous method seems to have
worked.” Consequently, if an agent won in the first round, their strategy is maintained in
the second. Other agents target p*mean and then adjust, guessing either higher or lower
depending on what they expect others to do.
Based on written strategies from participants we devised the following rules for
the second round:
B1) Winners maintain their same strategy from period 1; p*mean replaces the midpoint as the point of reference.
B2) p*mean + random [0, 10] B3) p*mean – (p*mean)*random [0, 0.7] B4) random guess from a uniform distribution [0, 100]
Alterations in the magnitude of adjustment in the above rules are possible and the
implications testable. For example, Rule 2 above specifies an adjustment above p*mean
that varies from 0 to 10. Similarly, Rule 3 specifies a random adjustment in p*mean
ranging from 0 to .7*mean.4 The degree of adjustment in these rules is based on
observations of behavior in our experiment. The generic structure of the rules is to
anchor on p*mean and adjust upward or downward. The exact size of that adjustment
can be determined by the modeler. In addition, the number of agents employing each
rule is also adjustable.
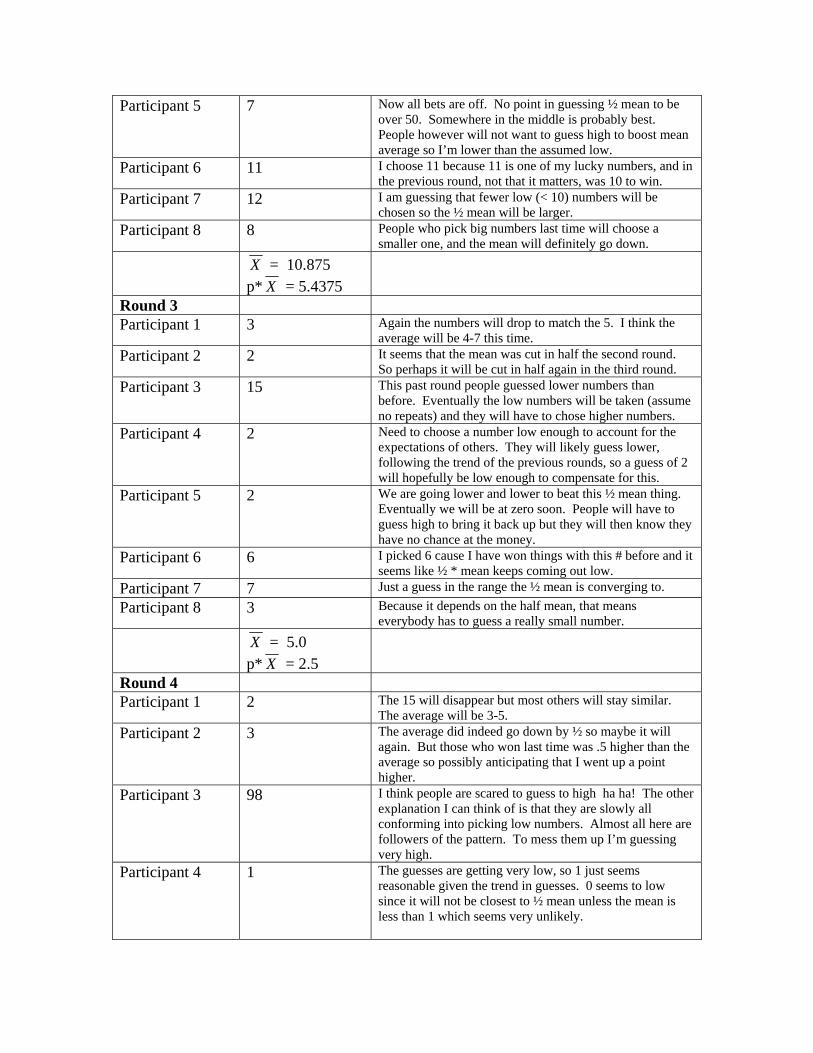
In subsequent rounds, three through five in our experiments, most participants
seemed to notice the trend and follow it, again anchoring on p*mean from the previous
round. Demonstrating this are comments such as, “it seems that the mean was cut in half
the second round, so perhaps it will be cut in half again,” or “need to choose a number
low enough to account for the expectations of others. They will likely guess lower,
following the trend of the previous rounds,” and finally “the last three trial guesses have
been getting smaller and smaller; chances are that trend will continue, so for this round I
halved my last choice.”
Despite this, some contrarians still remained noting “the past round people
guessed lower numbers than before; eventually the low numbers will be taken and they
will have to choose higher numbers,” or “we are going lower and lower to beat this ½
mean thing; eventually we will be at zero soon. People will have to guess high to bring it
back up.”
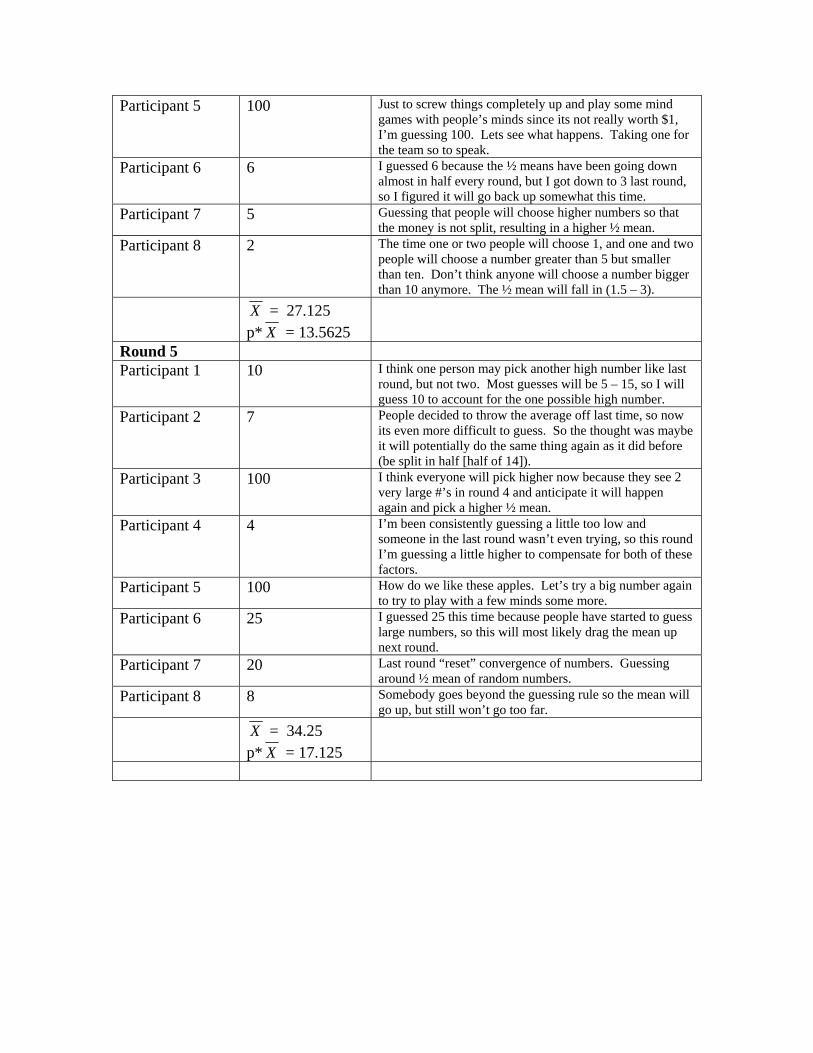
In addition, there was definite vindictive and strategic behavior on the part of
some participants. This usually involved picking a number greater than 98. For example,
one participant who chose 98 in round 4 wrote “I think people are scared to guess high
(ha! ha!). The other explanation I can think of is that they are all slowly conforming into
4 Rule 3 is multiplicative rather than additive like Rule 2 to avoid negative numbers being chosen by the agent based model.
picking low numbers. Almost all here are followers of the pattern. To mess them up, I’m
guessing very high.” Another who chose 100 in the same session and round wrote: “Just
to screw things up completely and play some mind games….I’m guessing 100.”
However, choosing large numbers was not always vindictive. One participant who chose
100 wrote “I tried to up the guesses to push the rounds into the 5’s to 10’s, then guess 4
to win when I didn’t guess 100 again.” Still another indicated that “I know this guess
[100] won’t be the target number, but I think that this could help me guess it right next
round because other people will likely guess higher, therefore I will have a better plan in
guessing the target number.”
This behavior has been witnessed in other p*mean experiments (see Nagel, 1995;
Ho et al., 1998) and attributed to vindictive or “spoiler” behavior. However, our results
indicate that it may also have been a deliberate attempt to manipulate the mean in order to
win in future rounds. Indeed, when the number of participants is small, such actions are
able to increase the mean. In our experiments, most participants, although seemingly
caught off guard by these actions, began following the upward trend. For example, after
these large guesses appeared participants wrote “I’m consistently guessing a little too low
and someone last round wasn’t even trying, so this round I’m guessing a little higher,”
and “I guessed 25 this time because people have started to guess large numbers, so this
will most likely drag the mean up next round.”
The rules ascribed to agents in rounds three through five in our model are as
follows:
C1) If trend of guesses is downward, p*mean – (p*mean)*random [0, 0.7] C2) If trend of guesses is upward, guess + random [0, 9] C3) p*mean + random [0, 12] C4) random guess from a uniform distribution [98, 100]
C5) random guess from a uniform distribution [0, 100]
These rules are nearly identical to those used in period 2 and are again based on
anchoring and adjustment behavior. Rule 4 allows for the vindictive or strategic behavior
of picking a large number, frequently 100, during certain times of the simulation. Those
times and their duration can be set by the modeler as will be more clear below. Rules 1
and 2 are adjustments based on the movement in the trend. Rule 2 is the exception to
anchoring on p*mean, focusing on the participants previous guess instead. This, too, was
based on the observed behavior of participants. The only event in our experiments that
caused a reversal in the downward trend was the vindictive/strategic behavior of choosing
very large numbers. Participants were cautious in increasing their guesses due to the
uncertainty introduced by the introduction of these large guesses and their continuation.
Sample comment from participants who had guessed 2 in the fourth round and 10 and 8,
respectively, in the fifth illustrate this caution: “I think one person may pick another high
number like last round, but not two. Most guesses will be 5 – 15, so I will guess 10 to
count for the one possible high number,” and “somebody goes beyond the guessing rule
so the mean will go up, but still won’t go too far.”
The above rules and comments confirm the earlier observation made by Thaler
(2000) that agents will have variation in their depth of reasoning and in the extent they
think of other agents. To date, p*mean guessing games have mostly focused on the depth
of reasoning. Agent-based modeling allows the incorporation of both types of
heterogeneity, confirming another observation by Thaler (2000, 135) that “sophisticated
economic models will have agents that are both more and less sophisticated than the
agents we are used to modeling.” The comments from our participants reflect this. There
is clearly variation in their depth of reasoning, but also variation in what they think of
their fellow participants. Some believe, correctly, that guesses will continue to fall;
others believe, incorrectly, that guesses will rise. Participants anchor and adjust their
guesses accordingly. Some are simply vindictive, others try to deliberately manipulate
the mean to move the herd, as it were, in a given direction. In our experiments, one
player continued to play randomly, choosing favorite numbers and seemingly
unconcerned with forming another strategy.
Axelrod (1997) notes that computer simulation can be use for many purposes
including prediction, performance, confirmation, and discovery. The above rules are
arguably unique to this particular beauty contest game and our experiment, and will be
used below to confirm their suitability by comparing the predicted outcomes with those
from experiment. Once the model’s suitability is confirmed, it can be used to discover
how variations in the rules and parameters affect the outcome. Questions suitable to
discover might include: What if there are no “deep” depth of reasoning thinkers? What
if no or few people follow the trend? What if we have a large number of random
guessers? What if strategies are assigned randomly? What is the wealth distribution
associated with these different scenarios? Can a small number of really smart agents,
both depth of reasoning and guessing what others will do, win all of the time and become
“rich”?
Summary of Simulated Results
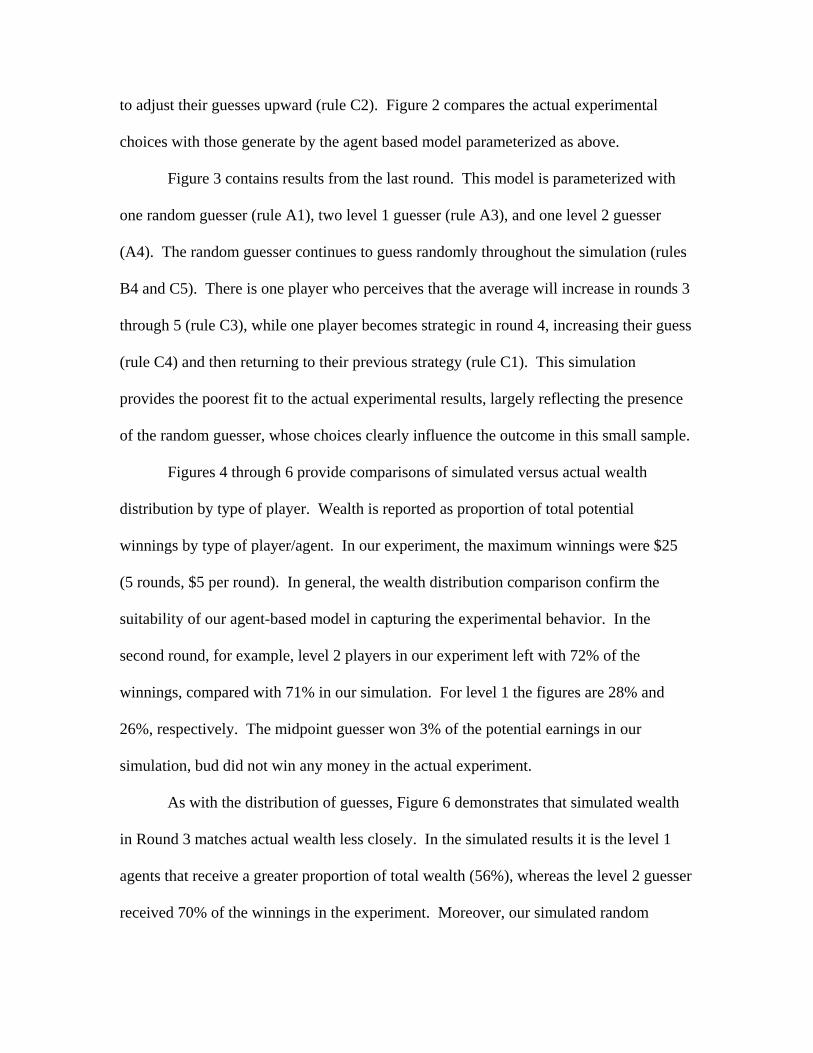
Figure 1 provides a comparison of the experimental results with those averaged
over thirty runs from the agent-based model. The agent based model was parameterized
as follows: no random guessers, 1 player focused on the midpoint (rule A2), 3 focused
on p*midpoint (rule A3), and no players employing level 2 depth of reasoning (rule A4).
In this session two of the level 1 players misunderstood the game in the first round,
thinking that p was 1.5 rather than 0.5 (See Appendix 1). Thus, their decision rules were
modified for this round. In the second round, the winner uses rule B1 (keep their winning
strategy from round 1), while all other agents are assigned B3 (anchoring on p*mean and
adjusting downward). In subsequent rounds, there was one player who perceived that the
average would increase in rounds 3 through 5 and is assigned rule C3, anchoring on
p*mean and adjusting upward5. All others, others adjust downward based on the trend
(rule C1). As demonstrated by Figure 1, the agent-based model generates results that
are remarkably similar to those derived experimentally.
The first session displays a decline toward zero over time and, with the exception
of the misunderstanding in period 1, displays no aberrant behavior on the part of the
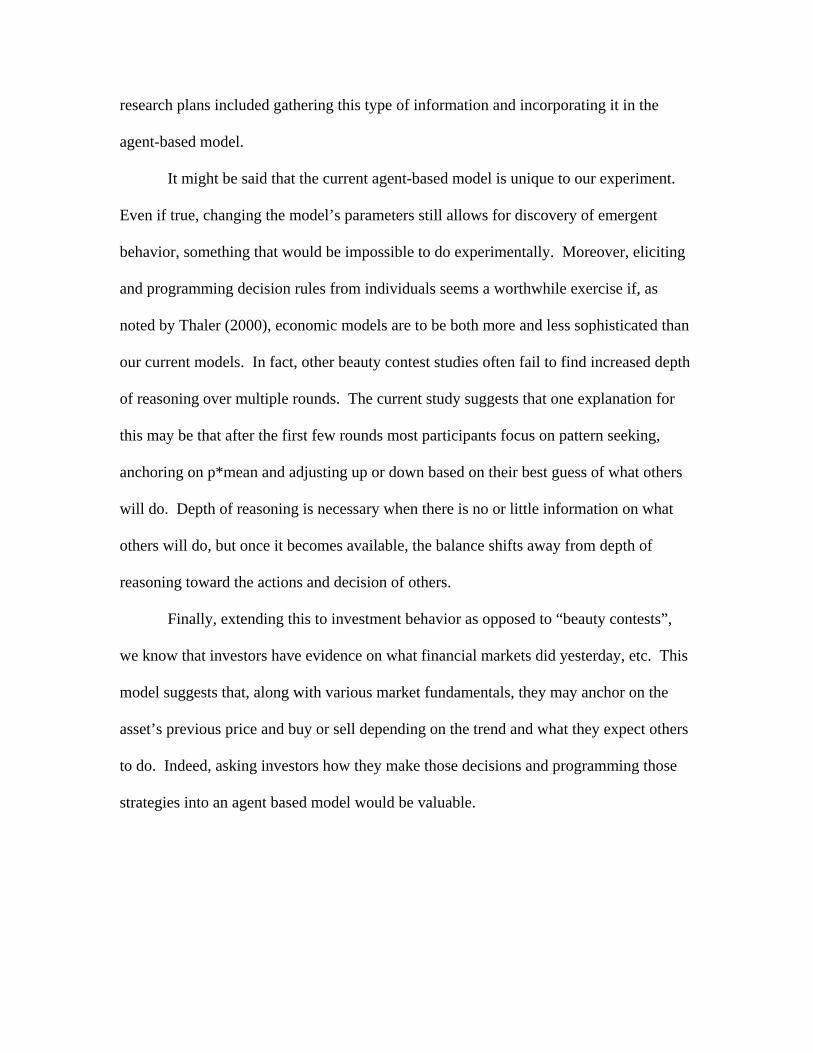
participants. In contrast, as demonstrated in Figures 2 and 3, the results from sessions 2
and 3 are notably different. The agent-based model for session 2 was parameterized as
follows: no random guessers; 1 focused on the midpoint (rule A2), 3 level 1 players (rule
A3), and 4 level 2 players (rule A4). In round 2, four players perceive that guesses may
rise and adjust upward from p*mean (rule B2). The others use B3, except the winner(s)
who adopt B1. Subsequent rounds are more varied. One player continues to perceive
that the average will increase in all rounds (rule C3), while the others believe the
downward trend will continue, adopting rule C1. Two players, however, become
vindictive in rounds 4 and 5 and are assigned rule C4, guessing randomly between 98 and
100, in those rounds. This causes the trend to turn positive resulting in agents beginning
5 This agent is assigned randomly in our program, but it is also possible to assign it to a specific agent.
to adjust their guesses upward (rule C2). Figure 2 compares the actual experimental
choices with those generate by the agent based model parameterized as above.
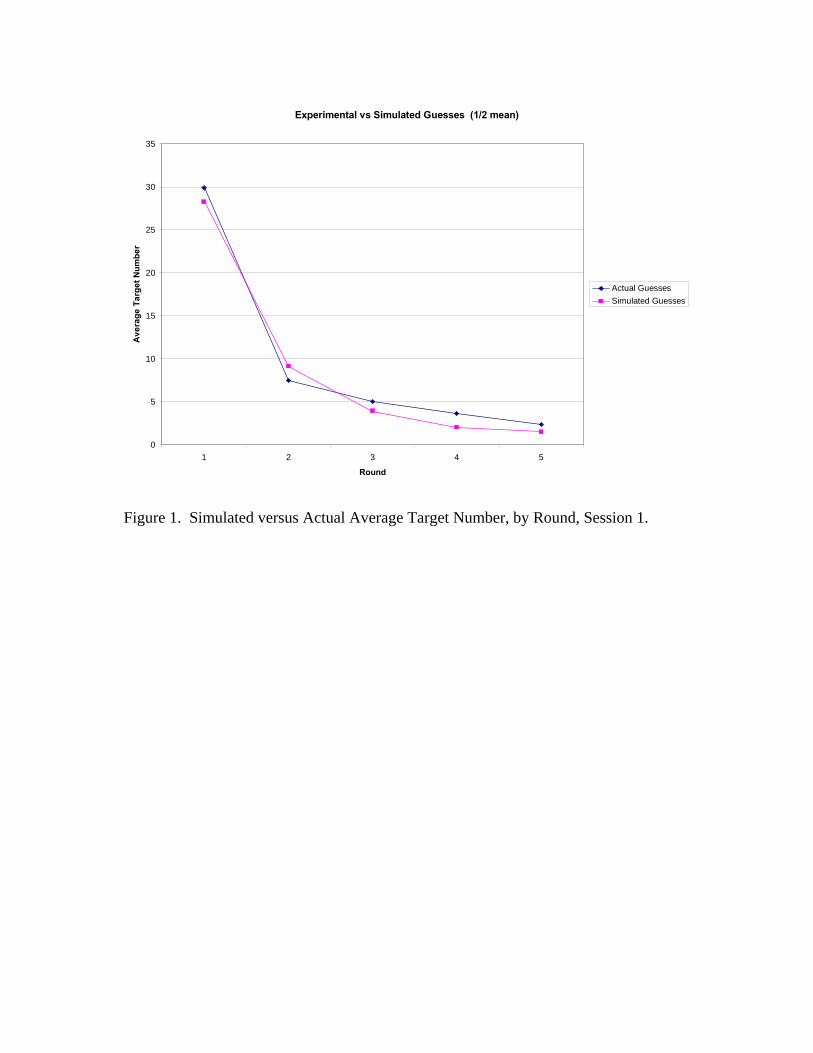
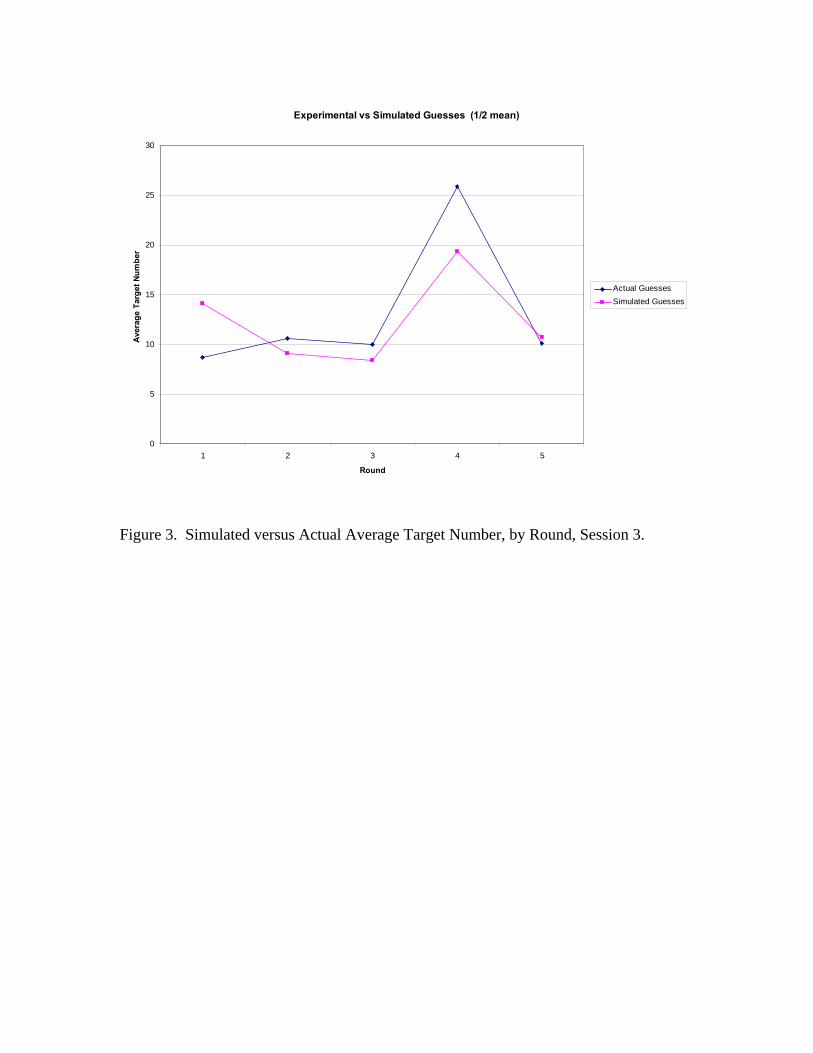
Figure 3 contains results from the last round. This model is parameterized with
one random guesser (rule A1), two level 1 guesser (rule A3), and one level 2 guesser
(A4). The random guesser continues to guess randomly throughout the simulation (rules
B4 and C5). There is one player who perceives that the average will increase in rounds 3
through 5 (rule C3), while one player becomes strategic in round 4, increasing their guess
(rule C4) and then returning to their previous strategy (rule C1). This simulation
provides the poorest fit to the actual experimental results, largely reflecting the presence
of the random guesser, whose choices clearly influence the outcome in this small sample.
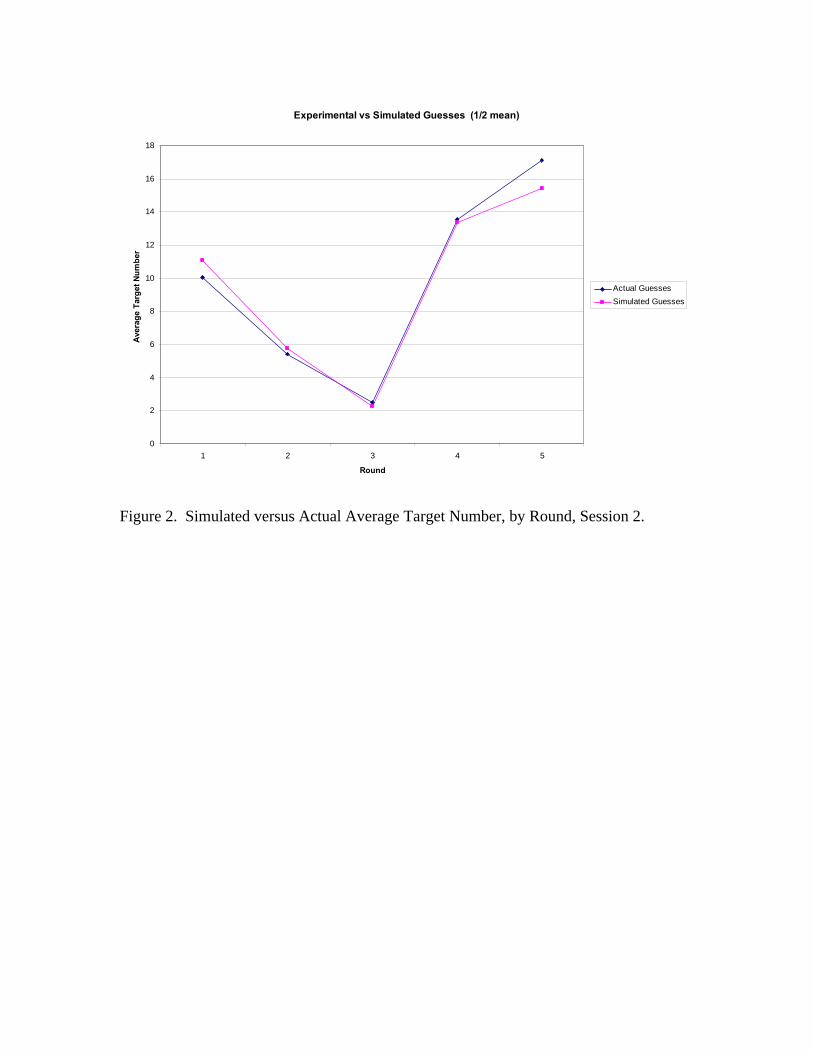
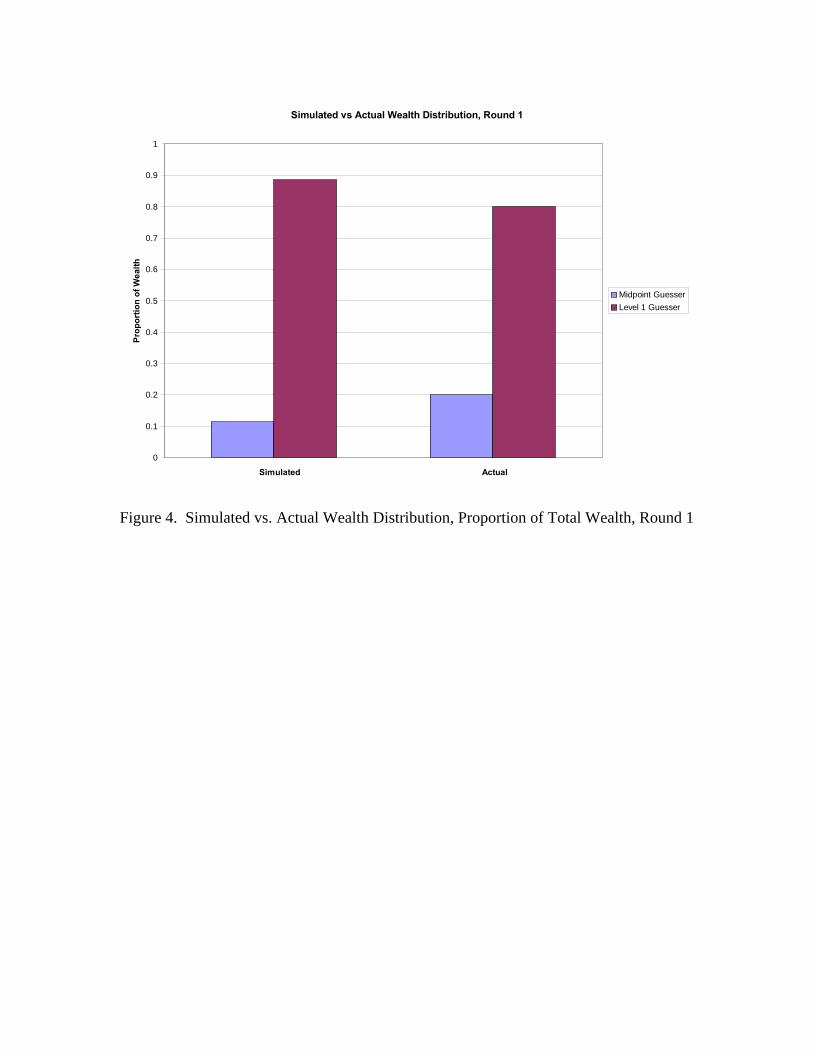
Figures 4 through 6 provide comparisons of simulated versus actual wealth
distribution by type of player. Wealth is reported as proportion of total potential
winnings by type of player/agent. In our experiment, the maximum winnings were $25
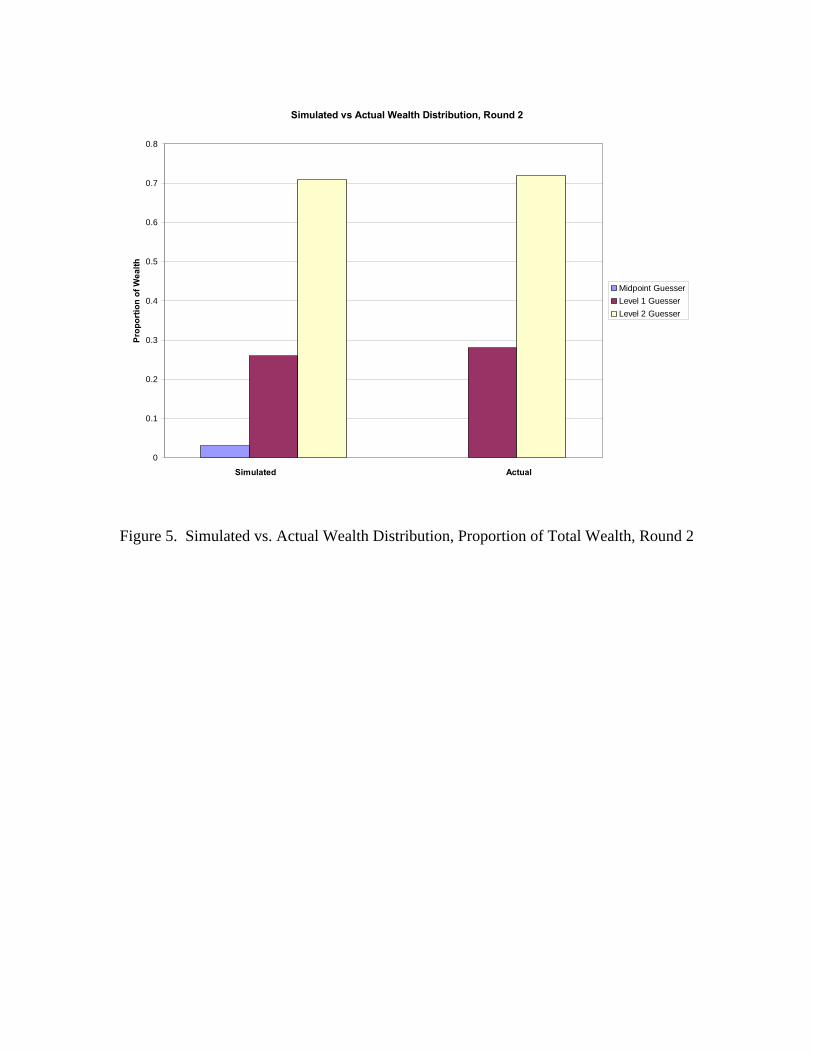
(5 rounds, $5 per round). In general, the wealth distribution comparison confirm the
suitability of our agent-based model in capturing the experimental behavior. In the
second round, for example, level 2 players in our experiment left with 72% of the
winnings, compared with 71% in our simulation. For level 1 the figures are 28% and
26%, respectively. The midpoint guesser won 3% of the potential earnings in our
simulation, bud did not win any money in the actual experiment.
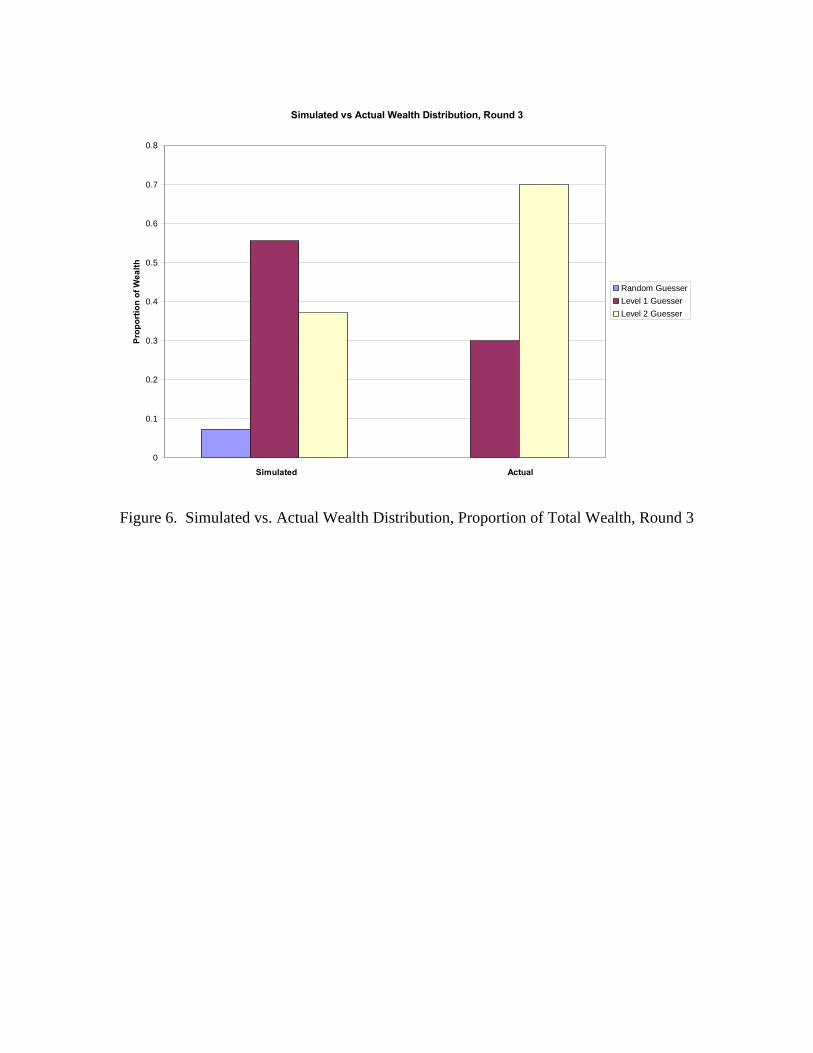
As with the distribution of guesses, Figure 6 demonstrates that simulated wealth
in Round 3 matches actual wealth less closely. In the simulated results it is the level 1
agents that receive a greater proportion of total wealth (56%), whereas the level 2 guesser
received 70% of the winnings in the experiment. Moreover, our simulated random

guesser did better (7% of total wealth) than our actual random guesser, who received no
winnings.
Of course, the differences in wealth reflect the influence of the random guesser.
Our random guessing agent did not guess the same numbers that our experiment
participant did. Given the small number of participants and agents, the random guesses
chosen by each clearly influence the mean (see Figure 3) and who wins. In our
experiments, those with a greater depth of reasoning won more money. However, our
simulated results suggest that the presence of an influential random player may alter that
outcome. Had we conducted our experiment 30 times, our random guesser would have
likely won from time to time just by chance and the distribution of income may have
favored level 1 players. Of course, it would be impossible to repeat an experiment 30
times with the same players without it influencing their strategies, demonstrating yet
again one of the benefits of using agent based modeling.
Conclusion
The current study demonstrates the potential usefulness of agent-based modeling
to explore expectations behavior. The results for the p-mean guessing game derived from
the agent-based model are remarkably similar to those derived in experimental studies.
This is of interest because it suggest that simple, inductive reasoning rules, as opposed to
complex depth of reasoning, may be the source of the observed behavior.
This study also illustrates the inability to distinguish between a high level of
reasoning and random guesses near zero, thereby demonstrating the need for a better
understanding of the decision process employed when people form expectations. Future
research plans included gathering this type of information and incorporating it in the
agent-based model.
It might be said that the current agent-based model is unique to our experiment.
Even if true, changing the model’s parameters still allows for discovery of emergent
behavior, something that would be impossible to do experimentally. Moreover, eliciting
and programming decision rules from individuals seems a worthwhile exercise if, as
noted by Thaler (2000), economic models are to be both more and less sophisticated than
our current models. In fact, other beauty contest studies often fail to find increased depth
of reasoning over multiple rounds. The current study suggests that one explanation for
this may be that after the first few rounds most participants focus on pattern seeking,
anchoring on p*mean and adjusting up or down based on their best guess of what others
will do. Depth of reasoning is necessary when there is no or little information on what
others will do, but once it becomes available, the balance shifts away from depth of
reasoning toward the actions and decision of others.
Finally, extending this to investment behavior as opposed to “beauty contests”,
we know that investors have evidence on what financial markets did yesterday, etc. This
model suggests that, along with various market fundamentals, they may anchor on the
asset’s previous price and buy or sell depending on the trend and what they expect others
to do. Indeed, asking investors how they make those decisions and programming those
strategies into an agent based model would be valuable.
Experimental vs Simulated Guesses (1/2 mean)
0
5
10
15
20
25
30
35
1 2 3 4 5
Round
Ave
rage
Tar
get N
umbe
r
Actual GuessesSimulated Guesses
Figure 1. Simulated versus Actual Average Target Number, by Round, Session 1.
Experimental vs Simulated Guesses (1/2 mean)
0
2
4
6
8
10
12
14
16
18
1 2 3 4 5
Round
Aver
age
Targ
et N
umbe
r
Actual GuessesSimulated Guesses
Figure 2. Simulated versus Actual Average Target Number, by Round, Session 2.
Experimental vs Simulated Guesses (1/2 mean)
0
5
10
15
20
25
30
1 2 3 4 5
Round
Aver
age
Targ
et N
umbe
r
Actual GuessesSimulated Guesses
Figure 3. Simulated versus Actual Average Target Number, by Round, Session 3.
Simulated vs Actual Wealth Distribution, Round 1
0
0.1
0.2
0.3
0.4
0.5
0.6
0.7
0.8
0.9
1
Simulated Actual
Prop
ortio
n of
Wea
lth
Midpoint GuesserLevel 1 Guesser
Figure 4. Simulated vs. Actual Wealth Distribution, Proportion of Total Wealth, Round 1
Simulated vs Actual Wealth Distribution, Round 2
0
0.1
0.2
0.3
0.4
0.5
0.6
0.7
0.8
Simulated Actual
Prop
ortio
n of
Wea
lth
Midpoint GuesserLevel 1 GuesserLevel 2 Guesser
Figure 5. Simulated vs. Actual Wealth Distribution, Proportion of Total Wealth, Round 2
Simulated vs Actual Wealth Distribution, Round 3
0
0.1
0.2
0.3
0.4
0.5
0.6
0.7
0.8
Simulated Actual
Prop
ortio
n of
Wea
lth
Random GuesserLevel 1 GuesserLevel 2 Guesser
Figure 6. Simulated vs. Actual Wealth Distribution, Proportion of Total Wealth, Round 3
References Arthur, Brian W. (1994) “Inductive Reasoning and Bounded Rationality.” American Economic Review, Vol. 84, No. 2, 406-411. Arthur, W. B., Durlauf, S. N., and Lane, D. A. (1997). The Economy as an Evolving Complex System II. Reading: Addison-Wesley. Axelrod, R. (1997). “Advancing the Art of Simulation in the Social Sciences.” Complexity, Vol. 3, No. 2, 16-22. Duffy, John and Nagel, Rosemarie (1997). “On the Robustness of Behaviour in Experimental ‘Beauty Contest’ Games.” The Economic Journal, Vol. 107, November, 1684-1700. Epstein, Joshua. M., and Axtell, Robert. (1996). Growing Artificial Societies: Social Science from the Bottom Up. Washington, D.C, Brookings Institution; Cambridge and London: MIT Press Epstein, Joshua M., (1999). “Agent-based Computational Models and Generative Social Science.” Complexity, Vol. 4, No. 5, 41-57. Epstein, Joshua, M., (2005). “Remarks on the Foundations of Agent-Based Generative Social Science.” CSED Working Paper No. 41. Brookings Foundation, Washington D.C Ericsson, K. Anders, and Simon, Herbert A. (1993). Protocol Analysis: Verbal Reports as Data, Revised Edition. MIT Press: Cambridge, MA. Ho, Reck-Hua, Camerer, Colin, and Weigelt, Keith (1998). “Iterated Dominance and Iterated Best Response in Experimental ‘p-Beauty Contests.’” American Economic Review, Vol. 88, No. 4, 947-969. Keynes, John Maynard (1936). The General Theory of Interest, Employment and Money. London: Macmillan. Nagel, Rosemarie (1995). “Unraveling in Guessing Games: An Experimental Study.” The American Economic Review, Vol. 85, No. 5, 1313-1326. Nerlove, Marc and Bessler, David. (2006). “Expectations, Information, and Dynamics.” Handbook of Agricultural Economics, Vol. 1a. Stahl, Dale. (1996). “Boundedly Rational Rule Learning in Guessing Games.” Games and Economic Behavior, Vol. 16, 303-30. Thaler, Richard, T. (2000). “From Home Economicus to Homo Sapiens.” Journal of Economic Perspectives, Vol. 14, No. 1, 133-141.
Tversky, Amos and Kahneman, Daniel (1974). “Judgment under Uncertainty: Heuristics and Biases.” Science, Vol. 185, September, 1124-1131.
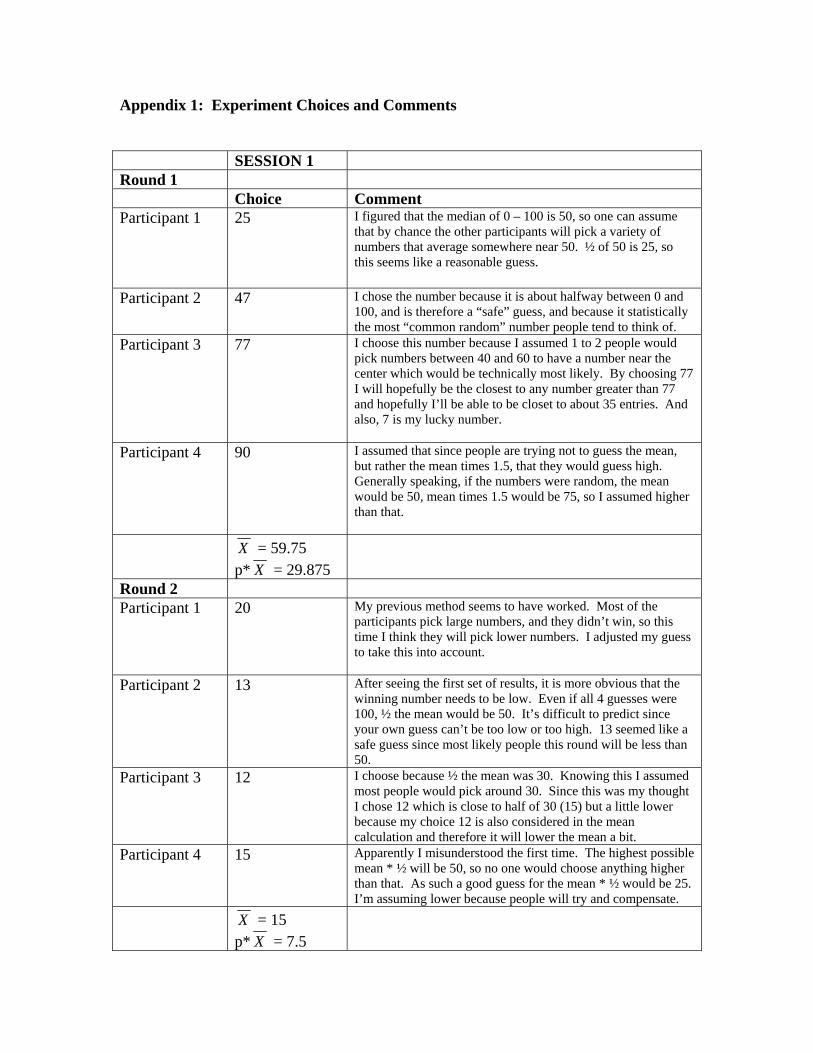
Appendix 1: Experiment Choices and Comments SESSION 1 Round 1 Choice Comment Participant 1 25 I figured that the median of 0 – 100 is 50, so one can assume
that by chance the other participants will pick a variety of numbers that average somewhere near 50. ½ of 50 is 25, so this seems like a reasonable guess.
Participant 2 47 I chose the number because it is about halfway between 0 and 100, and is therefore a “safe” guess, and because it statistically the most “common random” number people tend to think of.
Participant 3 77 I choose this number because I assumed 1 to 2 people would pick numbers between 40 and 60 to have a number near the center which would be technically most likely. By choosing 77 I will hopefully be the closest to any number greater than 77 and hopefully I’ll be able to be closet to about 35 entries. And also, 7 is my lucky number.
Participant 4 90 I assumed that since people are trying not to guess the mean, but rather the mean times 1.5, that they would guess high. Generally speaking, if the numbers were random, the mean would be 50, mean times 1.5 would be 75, so I assumed higher than that.
X = 59.75 p* X = 29.875
Round 2 Participant 1 20 My previous method seems to have worked. Most of the
participants pick large numbers, and they didn’t win, so this time I think they will pick lower numbers. I adjusted my guess to take this into account.
Participant 2 13 After seeing the first set of results, it is more obvious that the winning number needs to be low. Even if all 4 guesses were 100, ½ the mean would be 50. It’s difficult to predict since your own guess can’t be too low or too high. 13 seemed like a safe guess since most likely people this round will be less than 50.
Participant 3 12 I choose because ½ the mean was 30. Knowing this I assumed most people would pick around 30. Since this was my thought I chose 12 which is close to half of 30 (15) but a little lower because my choice 12 is also considered in the mean calculation and therefore it will lower the mean a bit.
Participant 4 15 Apparently I misunderstood the first time. The highest possible mean * ½ will be 50, so no one would choose anything higher than that. As such a good guess for the mean * ½ would be 25. I’m assuming lower because people will try and compensate.
X = 15 p* X = 7.5

Round 3 Participant 1 25 So, they did pick lower numbers, just much lower numbers
than I would have thought. This time I’ll go back to 25, and hopefully the chosen numbers will be random like the first time.
Participant 2 6 It’s hard to predict whether people will guess low numbers again, so this choice is slightly less “logical.” I’m going to assume that the other participants will guess low but not as low as what I guessed.
Participant 3 6 I choose 6 because it is lower than the last ½* average and I assume people will be guessing lower now in order to guess the right number.
Participant 4 3 At this point I’m just voting for a really low number as every else has also dropped.
X = 10 p* X = 5.0
Round 4 Participant 1 18 Okay, so now the numbers are getting very small. Odds are
that they’ll get bigger, so I’m going to go with 18. Participant 2 3 The last three trials guesses have been getting smaller and
smaller, chances are that trend will continue, so for this round I halved my last choice.
Participant 3 5 Guessing lower than the ½ mean seems to be working so I choose 5 hoping some will guess less than 5 and someone will guess around 20 making the mean around 7.
Participant 4 3 If the person with the twenty drops, which they should if they are playing to win, the average should drop. The other two will probably stay the same.
X = 7.25 p* X = 3.625
Round 5 Participant 1 10 Okay, I give up. It’s completely illogical to keep picking
successively smaller numbers, but what the hell, I’ll go with the flow.
Participant 2 4 I’m going to just guess the last round’s ½ mean value and suspend the imposition of my own assumptions. It seems like a sensible number to guess given the last few rounds of guessing.
Participant 3 2 The number seems to keep decreasing and I think since 3’s won last time people will choose 3’s again this time, making the ½ mean something like 3+3+3+1 = 10/4 =2.5. ½ * 2.5 = 1.25 and 2 is close to that.
Participant 4 3 I’m just guessing low.
X = 4.75 p* X = 2.375
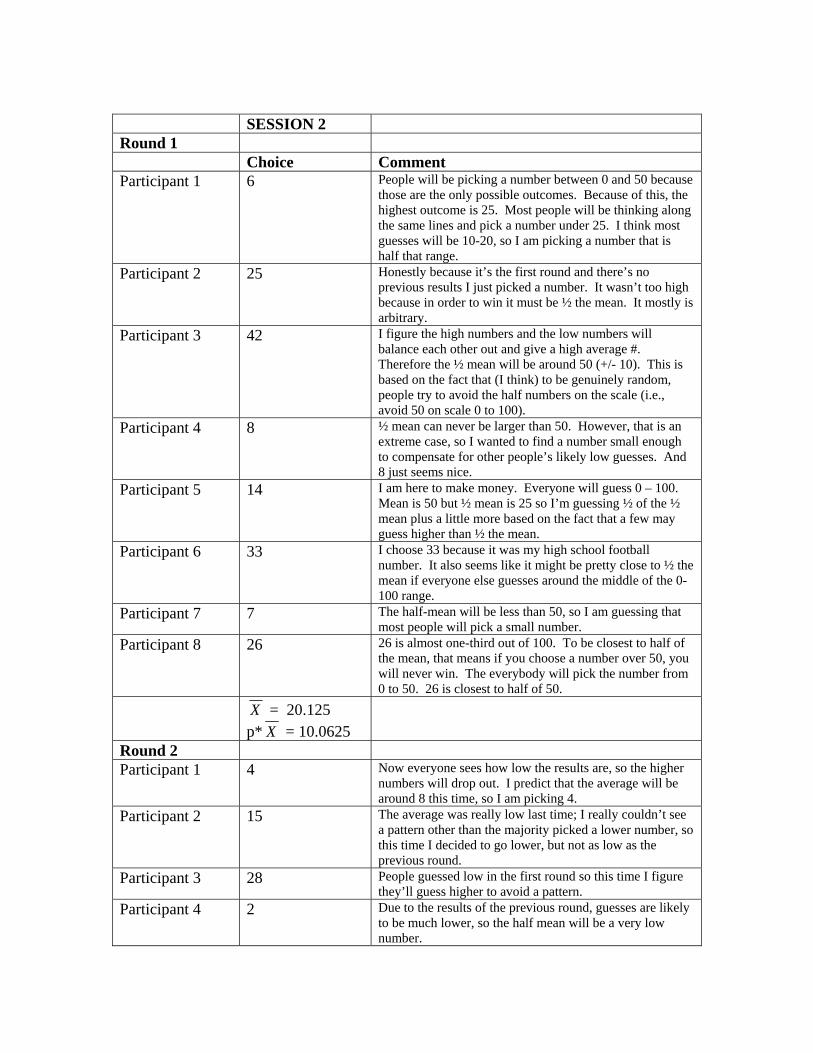
SESSION 2 Round 1 Choice Comment Participant 1 6 People will be picking a number between 0 and 50 because
those are the only possible outcomes. Because of this, the highest outcome is 25. Most people will be thinking along the same lines and pick a number under 25. I think most guesses will be 10-20, so I am picking a number that is half that range.
Participant 2 25 Honestly because it’s the first round and there’s no previous results I just picked a number. It wasn’t too high because in order to win it must be ½ the mean. It mostly is arbitrary.
Participant 3 42 I figure the high numbers and the low numbers will balance each other out and give a high average #. Therefore the ½ mean will be around 50 (+/- 10). This is based on the fact that (I think) to be genuinely random, people try to avoid the half numbers on the scale (i.e., avoid 50 on scale 0 to 100).
Participant 4 8 ½ mean can never be larger than 50. However, that is an extreme case, so I wanted to find a number small enough to compensate for other people’s likely low guesses. And 8 just seems nice.
Participant 5 14 I am here to make money. Everyone will guess 0 – 100. Mean is 50 but ½ mean is 25 so I’m guessing ½ of the ½ mean plus a little more based on the fact that a few may guess higher than ½ the mean.
Participant 6 33 I choose 33 because it was my high school football number. It also seems like it might be pretty close to ½ the mean if everyone else guesses around the middle of the 0-100 range.
Participant 7 7 The half-mean will be less than 50, so I am guessing that most people will pick a small number.
Participant 8 26 26 is almost one-third out of 100. To be closest to half of the mean, that means if you choose a number over 50, you will never win. The everybody will pick the number from 0 to 50. 26 is closest to half of 50.
X = 20.125 p* X = 10.0625
Round 2 Participant 1 4 Now everyone sees how low the results are, so the higher
numbers will drop out. I predict that the average will be around 8 this time, so I am picking 4.
Participant 2 15 The average was really low last time; I really couldn’t see a pattern other than the majority picked a lower number, so this time I decided to go lower, but not as low as the previous round.
Participant 3 28 People guessed low in the first round so this time I figure they’ll guess higher to avoid a pattern.
Participant 4 2 Due to the results of the previous round, guesses are likely to be much lower, so the half mean will be a very low number.
Participant 5 7 Now all bets are off. No point in guessing ½ mean to be over 50. Somewhere in the middle is probably best. People however will not want to guess high to boost mean average so I’m lower than the assumed low.
Participant 6 11 I choose 11 because 11 is one of my lucky numbers, and in the previous round, not that it matters, was 10 to win.
Participant 7 12 I am guessing that fewer low (< 10) numbers will be chosen so the ½ mean will be larger.
Participant 8 8 People who pick big numbers last time will choose a smaller one, and the mean will definitely go down.
X = 10.875 p* X = 5.4375
Round 3 Participant 1 3 Again the numbers will drop to match the 5. I think the
average will be 4-7 this time. Participant 2 2 It seems that the mean was cut in half the second round.
So perhaps it will be cut in half again in the third round. Participant 3 15 This past round people guessed lower numbers than
before. Eventually the low numbers will be taken (assume no repeats) and they will have to chose higher numbers.
Participant 4 2 Need to choose a number low enough to account for the expectations of others. They will likely guess lower, following the trend of the previous rounds, so a guess of 2 will hopefully be low enough to compensate for this.
Participant 5 2 We are going lower and lower to beat this ½ mean thing. Eventually we will be at zero soon. People will have to guess high to bring it back up but they will then know they have no chance at the money.
Participant 6 6 I picked 6 cause I have won things with this # before and it seems like ½ * mean keeps coming out low.
Participant 7 7 Just a guess in the range the ½ mean is converging to. Participant 8 3 Because it depends on the half mean, that means
everybody has to guess a really small number. X = 5.0
p* X = 2.5
Round 4 Participant 1 2 The 15 will disappear but most others will stay similar.
The average will be 3-5. Participant 2 3 The average did indeed go down by ½ so maybe it will
again. But those who won last time was .5 higher than the average so possibly anticipating that I went up a point higher.
Participant 3 98 I think people are scared to guess to high ha ha! The other explanation I can think of is that they are slowly all conforming into picking low numbers. Almost all here are followers of the pattern. To mess them up I’m guessing very high.
Participant 4 1 The guesses are getting very low, so 1 just seems reasonable given the trend in guesses. 0 seems to low since it will not be closest to ½ mean unless the mean is less than 1 which seems very unlikely.
Participant 5 100 Just to screw things completely up and play some mind games with people’s minds since its not really worth $1, I’m guessing 100. Lets see what happens. Taking one for the team so to speak.
Participant 6 6 I guessed 6 because the ½ means have been going down almost in half every round, but I got down to 3 last round, so I figured it will go back up somewhat this time.
Participant 7 5 Guessing that people will choose higher numbers so that the money is not split, resulting in a higher ½ mean.
Participant 8 2 The time one or two people will choose 1, and one and two people will choose a number greater than 5 but smaller than ten. Don’t think anyone will choose a number bigger than 10 anymore. The ½ mean will fall in (1.5 – 3).
X = 27.125 p* X = 13.5625
Round 5 Participant 1 10 I think one person may pick another high number like last
round, but not two. Most guesses will be 5 – 15, so I will guess 10 to account for the one possible high number.
Participant 2 7 People decided to throw the average off last time, so now its even more difficult to guess. So the thought was maybe it will potentially do the same thing again as it did before (be split in half [half of 14]).
Participant 3 100 I think everyone will pick higher now because they see 2 very large #’s in round 4 and anticipate it will happen again and pick a higher ½ mean.
Participant 4 4 I’m been consistently guessing a little too low and someone in the last round wasn’t even trying, so this round I’m guessing a little higher to compensate for both of these factors.
Participant 5 100 How do we like these apples. Let’s try a big number again to try to play with a few minds some more.
Participant 6 25 I guessed 25 this time because people have started to guess large numbers, so this will most likely drag the mean up next round.
Participant 7 20 Last round “reset” convergence of numbers. Guessing around ½ mean of random numbers.
Participant 8 8 Somebody goes beyond the guessing rule so the mean will go up, but still won’t go too far.
X = 34.25 p* X = 17.125
SESSION 3 Round 1 Choice Comment Participant 1 27 Every time I have to chose a # I pick birth years of family
member or years of specific events such as the year Pearl Harbor was bombed or the year WWI ended. This apparently is a tradition in our family as my father’s dad and my father also do this. My father picks all months and birth years for lottery #’s. I particularly like this # because it is my father’s birth year, whom I am very close to as well as my own superstition = luck “7” in 27.
Participant 2 9 I figure on average most people would chose 25 because half way between 0 and 100 is 50. So ½ x that value is 25. Meaning most people would guess 25 as half the ½ mean value. If most people guess 25 that means I should guess about half that 12.5. I move down a few numbers just in case someone has the same logic as myself.
Participant 3 17 I know that the target number I am trying to get would be ½ times the average guess. I think that the average will be below 50 and I figured 17 to be approx ½ the average guess.
Participant 4 17 Since the target is ½ of the mean value, I think more people will choose lower numbers. There are not many people participating so the numbers influence the mean significantly, so this is another reason for the low number.
X = 17.5 p* X = 8.75
Round 2 Participant 1 62 Sticking with births, but this time my birth year. Participant 2 9 Same reasoning as before, but it might be a bit lower if
others lower their guess based on the ½ mean value being 9 from the previous round.
Participant 3 12 The target number last round was 9, so I believe that it will be close to the same value. I also thin that everyone else’s guesses will increase, so the mean will as well.
Participant 4 2 After doing the first experiment, I feel as though others will be guessing smaller numbers, even more so than previously. Since the target is half of the mean, I chose a very small number.
X = 21.25 p* X = 10.625
Round 3 Participant 1 45 I am a WWII buff and this is the year it ended. Participant 2 10 Stick to the logic. If someone decides to throw in a high
number it will substantially change things because there are only 4 people taking the survey. I assume someone will not do this since it was done last round.
Participant 3 15 Last round the target number was 11, and my guess of 12 was closest. One of the guesses brought up the mean, 62, which was considerably higher than the other three guesses. I think the average will continue to increase.
Participant 4 10 One person tends to be staying with his number (9). It may be that people will guess too large or too small, but those may average out.
X = 20.0 p* X = 10.0
Round 4 Participant 1 88 Stepson’s birth year plus #’s were way to low in the previous
guess, I am trying to raise the average. Too freaky “9” “10” “11” as ½ means.
Participant 2 12 The average for the three rounds has been 9, 10, 11. It will balance out regardless as long as not everyone tries to go with a big number. Even that does not affect the average substantially since the mean is halved.
Participant 3 100 I know this guess won’t be the target number, but I think that this could help me guess it right next round because other people will most likely guess higher, therefore I will have a better plan in guessing the target number.
Participant 4 7 The majority is picking numbers in the 9 – 15 range. While one is picking large numbers. However, I lowered my guess because the large number from the 2nd round (62) decreased in the third round (45), so I suspect it will decrease again.
X = 51.75 p* X = 25.875
Round 5 Participant 1 13 Always thought of 13 as a quasi lucky #, plus it’s half of 26. Participant 2 12 The ½ mean value has to be below 50. If the 3 other people
all chose 100 the ½ average is still about 30 because my guess is so low. Assume one person will still be high. 12 is a safe guess.
Participant 3 20 I think that the average last round will make the other guess higher, so hopefully I will be closer to the mean this round.
Participant 4 36 I can’t figure out a pattern in others’ guessing, so this is just a random number which is still somewhat low since it is half of the mean for the target.
X = 20.25 p* X = 10.125