an abstract of the thesis of - ir.library.oregonstate.edu · cooling rate and fin thickness are...
TRANSCRIPT

AN ABSTRACT OF THE THESIS OF
Gopi K. Lingam for the degree of Master of Science in Industrial Engineering presented on September 20, 2010.
Title: Cooling Rate Limitations in the Diffusion Bonding of Large Microchannel Arrays
Abstract approved:
_____________________________________________________________________
Brian K. Paul
A significant barrier to the diffusion bonding of large (i.e. 600 mm) microchannel
devices is the large capital investment required to setup production. This large capital
investment extends from long heating and cooling cycles leading to poor production
capacities. Empirical studies in industry have shown that cooling rate is limited by the
warpage of microchannel laminae which is believed to be caused by thermal buckling.
In this thesis, the limits of cooling rates during the diffusion bonding of microchannel
laminae were investigated. Findings confirm that cooling rates are limited by the
thermal buckling of free-standing microchannel laminae during cooling of the device.
Finite element analyses (FEA) of the transient thermal and static stress behaviors of

these microchannel laminae were conducted to identify the maximum cooling rates for
different lamina thicknesses. FEA results were used to extrapolate implications for
microchannel production.

©Copyright by Gopi K. Lingam
September 20, 2010
All Rights Reserved
Cooling Rate Limitations in the Diffusion Bonding of Large Microchannel Arrays
by
Gopi K. Lingam
A THESIS
submitted to
Oregon State University
in partial fulfillment of
the requirements for the
degree of
Master of Science
Presented September 20, 2010
Commencement June 2011
Master of Science thesis of Gopi K. Lingam presented on September 20, 2010.
APPROVED:
Major Professor, representing Industrial Engineering
Head of the School of Mechanical, Industrial and Manufacturing Engineering
Dean of the Graduate School
I understand that my thesis will become part of the permanent collection of Oregon State University libraries. My signature below authorizes release of my thesis to any reader upon request.
Gopi K. Lingam, Author
ACKNOWLEDGEMENTS
First of all I would like to deeply express my gratitude to my research advisor,
Professor Brian K. Paul for his continual support, guidance and advice he gave me
during my graduate study. I would like to specially thank Dr. Timothy Kennedy for
being my minor professor in Mechanical Engineering and Dr. Karl Haapala for being
on committee.
I would like to extend my appreciation to Dr. Jack Rundel for all his assistance in all
my experimental work at the Microproducts Breakthrough Institute (MBI). My
appreciation is extended to Mr. Steve Etringer for his valuable machining work and
assistance in experimental work. I also like to express my appreciation to Keith Price
for all his help in computer and software support.
I also like to thank all my fellow graduate students and friends for their
encouragement, assistance and making my experience of studying abroad enjoyable.
Most of all, I would like to express my love and gratitude to my parents and siblings
for their endless support in all aspects of my education both mentally and financially.
TABLE OF CONTENTS
Page
1. INTRODUCTION .................................................................................... 1
2. LITERATURE REVIEW ......................................................................... 5
2.1. Introduction .............................................................................................. 5
2.2. Scale-up of MPT devices ......................................................................... 5
2.3. Microlamination ....................................................................................... 6
2.3.1 Patterning and Registration .......................................................... 7
2.3.2 Diffusion Bonding ........................................................................ 8
2.4. Failures during Diffusion Bonding .......................................................... 9
2.4.1 Creep ........................................................................................... 10
2.4.2 Buckling ...................................................................................... 10
2.4.3 Thermal Buckling ....................................................................... 13
3. FINITE ELEMENT MODELING .......................................................... 18
3.1. Introduction ............................................................................................ 18
3.2. Case Study ............................................................................................. 19
3.3. Finite Element Analysis ......................................................................... 20
3.3.1 Uncoupled Heat Transfer Analysis ............................................ 21
3.3.2 Transient Stress/Deformation Analysis ...................................... 24
3.4. Preliminary Results ................................................................................ 26
4. EXPERIMENTAL APPROACH ........................................................... 33
4.1. Overview ................................................................................................ 33
4.2. Test Article Design and Material Selection ........................................... 33
4.3. Test Article Fabrication ......................................................................... 36
4.3.1 Laser Machining ......................................................................... 36
TABLE OF CONTENTS (Continued)
Page
4.3.2 Deburring .................................................................................... 38
4.3.3 Flatness ....................................................................................... 39
4.3.4 Buckling Criteria ........................................................................ 39
4.3.5 Flattening .................................................................................... 41
4.3.6 Bonding ....................................................................................... 41
4.4. Load Cell Validation .............................................................................. 42
4.5. Experimental Design .............................................................................. 43
4.6. Thermocouple Set-up ............................................................................. 44
4.7. Pressure Uniformity with Fuji Pre-scale Film ....................................... 47
4.8. Diffusion Bonding Cycle ....................................................................... 49
5. RESULTS AND DISCUSSION ............................................................. 52
5.1. Critical Buckling Stresses ...................................................................... 52
5.2. Finite Element Analysis Results ............................................................ 53
5.3. Experimental Results ............................................................................. 55
5.4. Discussion .............................................................................................. 57
5.5. Sensitivity Analysis ............................................................................... 60
6. CONCLUSIONS .................................................................................... 62
LIST OF FIGURES
Figure Page
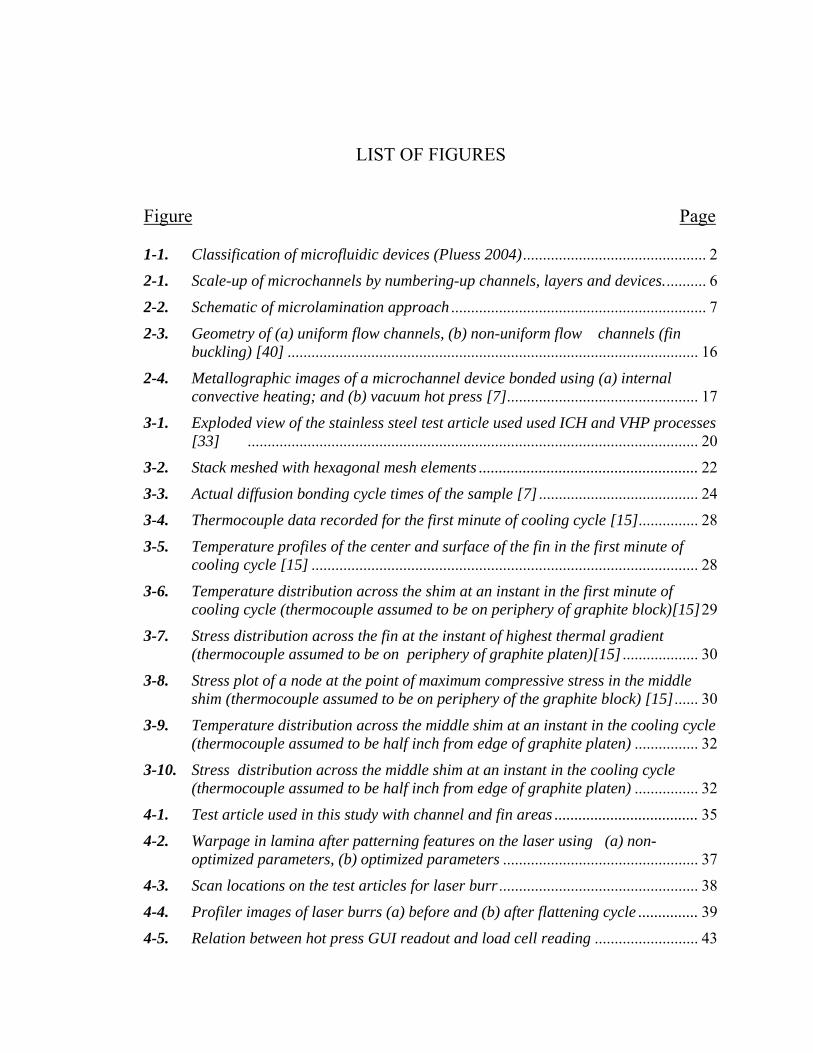
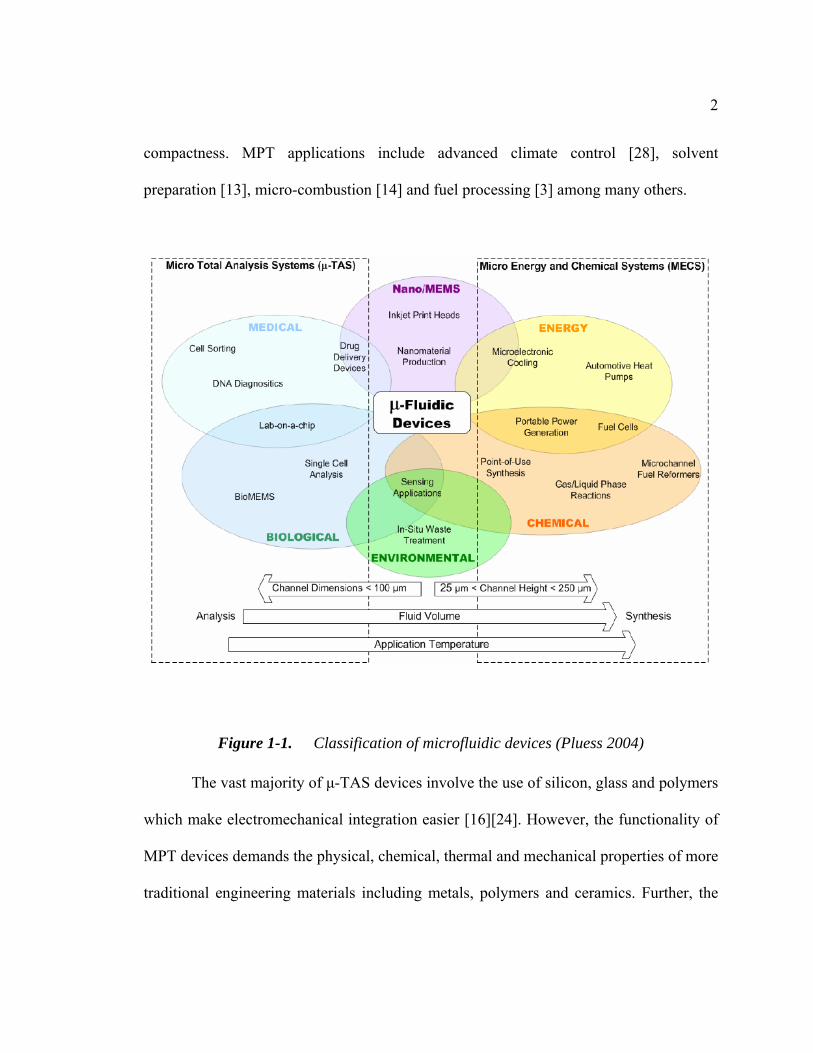
1-1. Classification of microfluidic devices (Pluess 2004) .............................................. 2
2-1. Scale-up of microchannels by numbering-up channels, layers and devices. .......... 6
2-2. Schematic of microlamination approach ................................................................ 7
2-3. Geometry of (a) uniform flow channels, (b) non-uniform flow channels (fin buckling) [40] ....................................................................................................... 16
2-4. Metallographic images of a microchannel device bonded using (a) internal convective heating; and (b) vacuum hot press [7] ................................................ 17
3-1. Exploded view of the stainless steel test article used used ICH and VHP processes [33] ................................................................................................................. 20
3-2. Stack meshed with hexagonal mesh elements ....................................................... 22
3-3. Actual diffusion bonding cycle times of the sample [7] ........................................ 24
3-4. Thermocouple data recorded for the first minute of cooling cycle [15] ............... 28
3-5. Temperature profiles of the center and surface of the fin in the first minute of cooling cycle [15] ................................................................................................. 28
3-6. Temperature distribution across the shim at an instant in the first minute of cooling cycle (thermocouple assumed to be on periphery of graphite block)[15] 29
3-7. Stress distribution across the fin at the instant of highest thermal gradient (thermocouple assumed to be on periphery of graphite platen)[15] ................... 30
3-8. Stress plot of a node at the point of maximum compressive stress in the middle shim (thermocouple assumed to be on periphery of the graphite block) [15] ...... 30
3-9. Temperature distribution across the middle shim at an instant in the cooling cycle (thermocouple assumed to be half inch from edge of graphite platen) ................ 32
3-10. Stress distribution across the middle shim at an instant in the cooling cycle (thermocouple assumed to be half inch from edge of graphite platen) ................ 32
4-1. Test article used in this study with channel and fin areas .................................... 35
4-2. Warpage in lamina after patterning features on the laser using (a) non-optimized parameters, (b) optimized parameters ................................................. 37
4-3. Scan locations on the test articles for laser burr .................................................. 38
4-4. Profiler images of laser burrs (a) before and (b) after flattening cycle ............... 39
4-5. Relation between hot press GUI readout and load cell reading .......................... 43
LIST OF FIGURES (Continued)
Figure Page
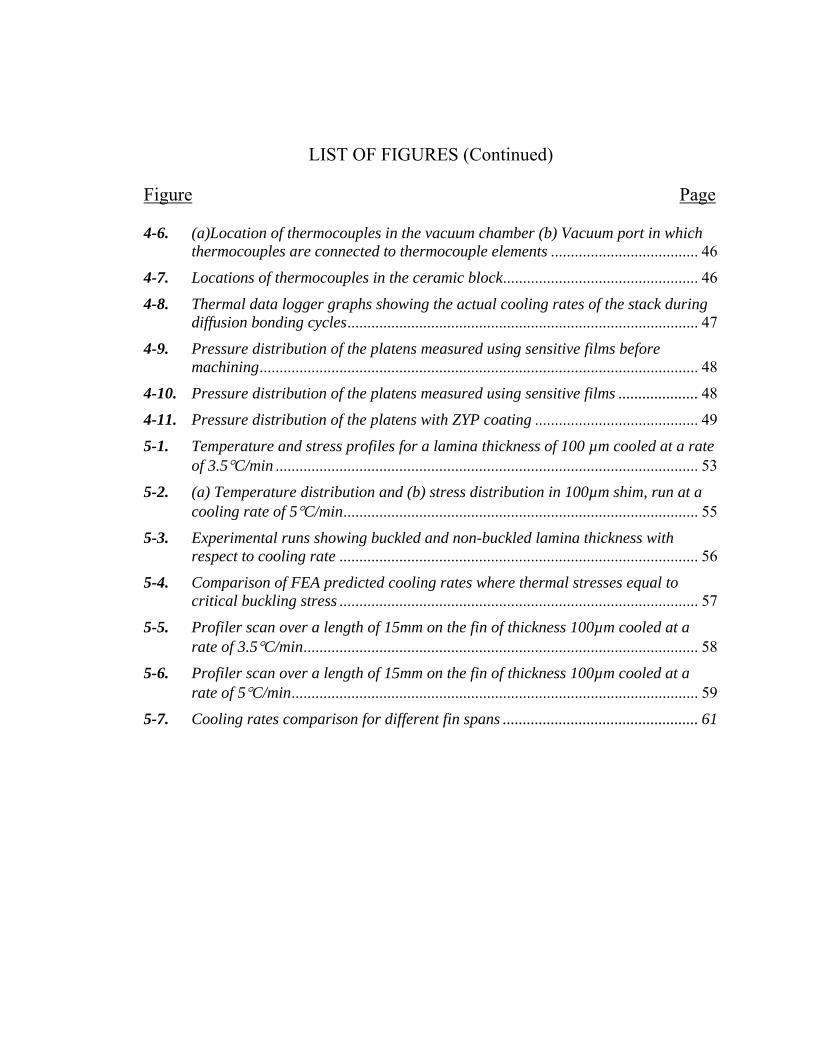
4-6. (a)Location of thermocouples in the vacuum chamber (b) Vacuum port in which thermocouples are connected to thermocouple elements ..................................... 46
4-7. Locations of thermocouples in the ceramic block ................................................. 46
4-8. Thermal data logger graphs showing the actual cooling rates of the stack during diffusion bonding cycles ........................................................................................ 47
4-9. Pressure distribution of the platens measured using sensitive films before machining .............................................................................................................. 48
4-10. Pressure distribution of the platens measured using sensitive films .................... 48
4-11. Pressure distribution of the platens with ZYP coating ......................................... 49
5-1. Temperature and stress profiles for a lamina thickness of 100 µm cooled at a rate of 3.5C/min .......................................................................................................... 53
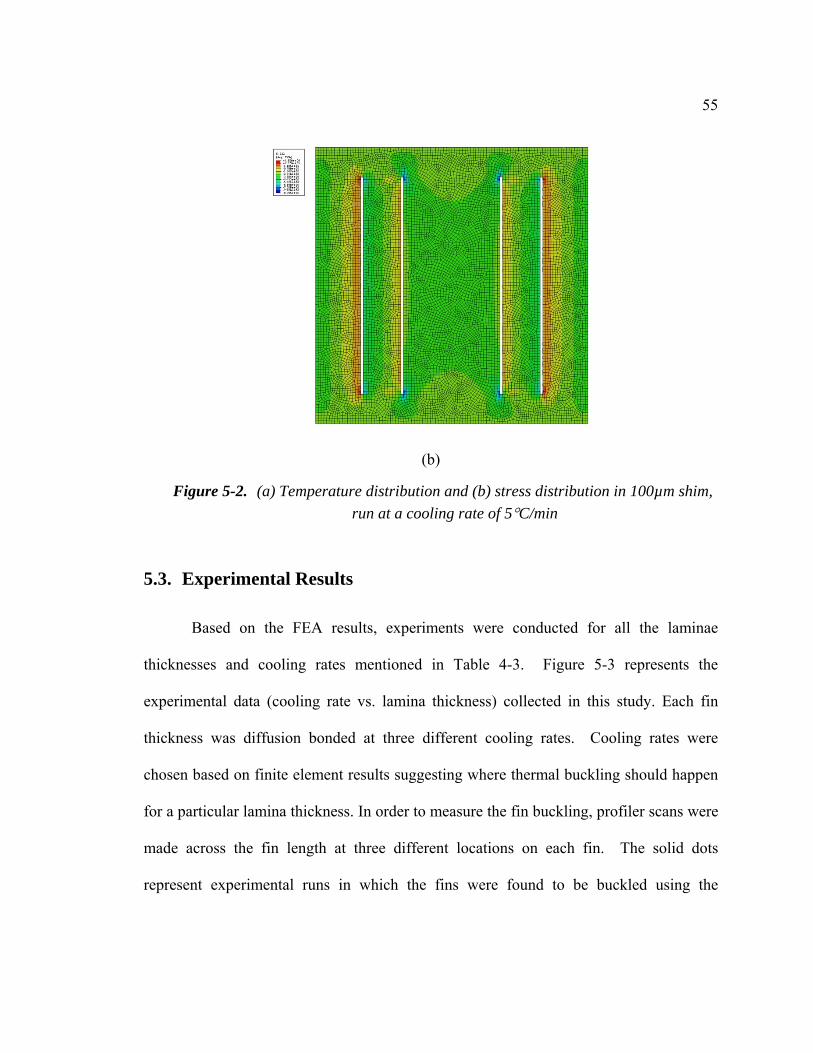
5-2. (a) Temperature distribution and (b) stress distribution in 100µm shim, run at a cooling rate of 5C/min ......................................................................................... 55
5-3. Experimental runs showing buckled and non-buckled lamina thickness with respect to cooling rate .......................................................................................... 56
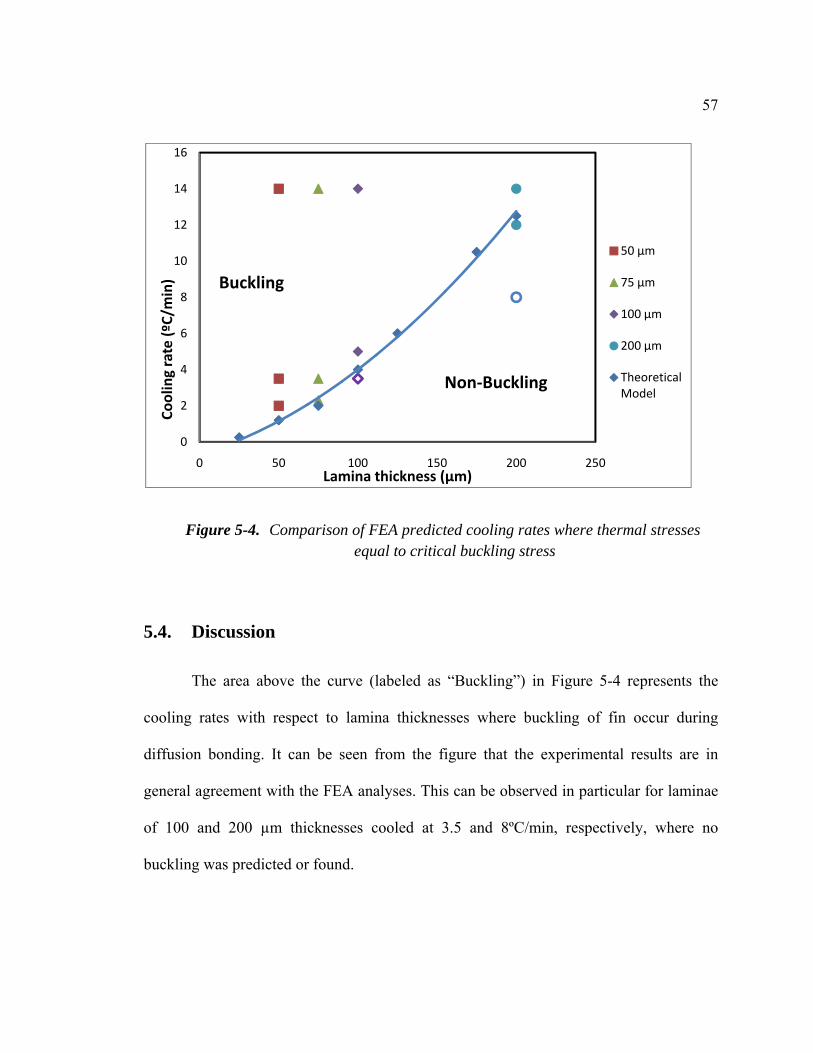
5-4. Comparison of FEA predicted cooling rates where thermal stresses equal to critical buckling stress .......................................................................................... 57
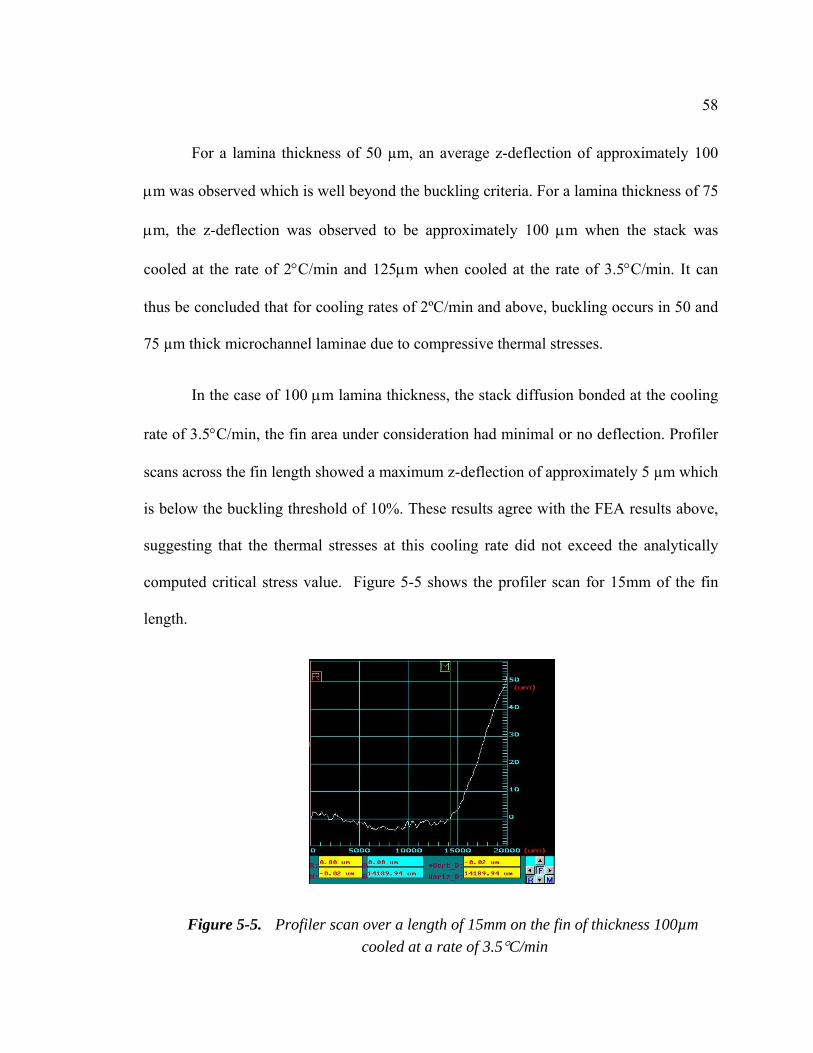
5-5. Profiler scan over a length of 15mm on the fin of thickness 100µm cooled at a rate of 3.5C/min ................................................................................................... 58
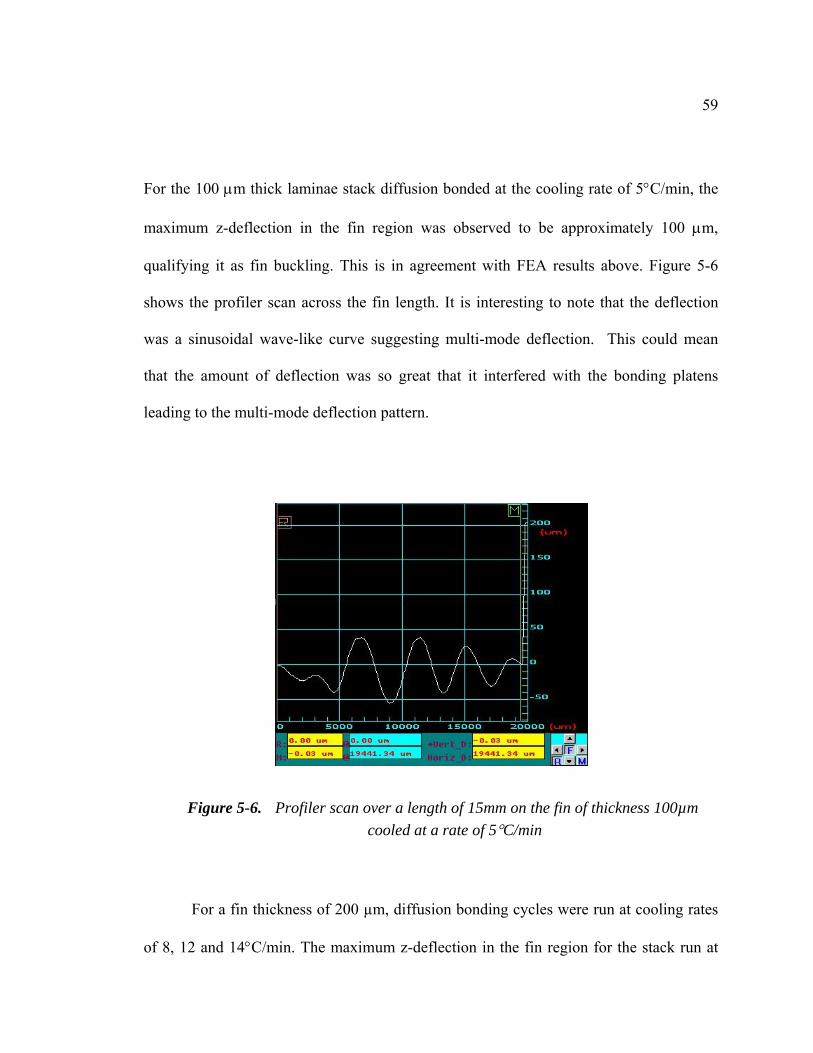
5-6. Profiler scan over a length of 15mm on the fin of thickness 100µm cooled at a rate of 5C/min ...................................................................................................... 59
5-7. Cooling rates comparison for different fin spans ................................................. 61
LIST OF TABLES
Table Page
4-1. Mechanical properties of copper alloy 110 at room and bonding temperatures . 36
4-2. Laser parameters used to pattern features on the copper laminae ...................... 37
4-3. Cooling rates at which the experiments were conducted...................................... 43
5-1. Critical buckling stresses for fin buckling with respect to thickness ……………..52

LIST OF APPENDICES
Appendix A: Test Article Drawings ……………………………………………………69
Appendix B: FE-Model Simulation Settings ……………………………………………72
Appendix C: Properties of Materials at Bonding Temperature ……………………75
Appendix D: FE-Model Results ……………………………………………………76

DEDICATION
Dedicated to my beloved grandfather
Krishna Murthy Lingam,
1930 – 2003
COOLING RATE LIMITATIONS IN THE DIFFUSION BONDING OF LARGE MICROCHANNEL ARRAYS
CHAPTER 1
1. INTRODUCTION
In recent years, there has been a growing interest in the field of microfluidics.
Microfluidics deals with the behavior and manipulation of fluids within sub-millimeter
scale channels (i.e., microchannels). Microfluidic devices can mainly be classified into
two groups: analytical devices, mainly referred to as micro total analysis systems (μ-
TAS), and arrayed devices, referred to as micro energy and chemical systems (MECS) or
microchannel process technology (MPT). These two major categories have significant
differences in their function and in the materials and fabrication technologies needed to
produce them. Micro total analysis systems are used to generate information from nano
and micro-liters of fluids. MPT devices are designed to process bulk quantities of fluids
through the use of microchannel arrays.
MPT devices are microfluidic systems with embedded arrays of microchannels
for processing high rates of fluid mass and thermal energy. Microchannels provide
increased surface-to-volume ratios leading to accelerated heat and mass transfer
compared to conventional macro-scale tubes [19]. For diffusion limited processes, MPT
devices are capable of reducing the sizes of fluidic systems by a factor of 5 to 1000
leading to mass and energy applications characterized by their need for mobility and
2
compactness. MPT applications include advanced climate control [28], solvent
preparation [13], micro-combustion [14] and fuel processing [3] among many others.
Figure 1-1. Classification of microfluidic devices (Pluess 2004)
The vast majority of μ-TAS devices involve the use of silicon, glass and polymers
which make electromechanical integration easier [16][24]. However, the functionality of
MPT devices demands the physical, chemical, thermal and mechanical properties of more
traditional engineering materials including metals, polymers and ceramics. Further, the
3
sizes of MPT devices dictate the use of more economical materials than single crystal
silicon.
Mostly, MPT devices are produced using microlamination architectures [4][38].
Microlamination architectures involve the patterning, registration and bonding of thin
metal or polymer sheet (or laminae) to produce a single monolithic structure with
embedded microchannels. Laminae patterning can include photochemical machining
(PCM), laser machining, wire electrodischarge (wire EDM) or stamping processes.
Registration step employs pinhole or edge registration techniques. Diffusion bonding,
diffusion brazing and other forms of brazing are typically used to bond the registered
laminae into a single device [34].
For diffusion bonding, laminae are typically heated to the bonding temperature
and then an appropriate bonding pressure is applied. The laminae stack is held at these
conditions for a certain period of time (dwell time) so that solid state diffusion occurs
across faying surfaces of the metals and forms a monolithic device. The bonding pressure
must be uniformly distributed throughout the device in order to prevent poor bonding
conditions leading to fluid leakage or warpage. In diffusion bonding or diffusion brazing,
it is well known that cycle times are often dictated by the heating and cooling rates used
during the process. It is also widely believed that heating and cooling rates, that are rapid,
can generate thermal gradients and corresponding thermal stresses across the device
leading to thermal buckling of fins adjacent to microchannels.
4
This research investigates the thermal stresses that arise in the microchannel fins
due to cooling rates. Cooling rate and fin thickness are examined to conclude if thermal
buckling of microchannel fins is a concern and, if so, what constraints are required on
cooling rates.
Chapter 2 summarizes the technical literature about fabricating MPT devices and
different failure modes observed in the past during their fabrication. Chapter 3 presents
the finite element modeling (FEM) approach used for analyzing the cooling cycle of a
laminae stack during diffusion bonding. Chapter 4 explains the experimental approach
used to validate the results of the FEM. A comparison of the FEM and experimental
results is summarized in chapter 5. Chapter 6 states the conclusions of the study and
future work that can be done in this area.
5
CHAPTER 2
2. LITERATURE REVIEW
2.1. Introduction
Distributed MPT systems are expected to be produced in high volumes at
relatively low cost similar to that of integrated circuits (IC) and micro electro mechanical
systems (MEMS) industries. IC and MEMS manufacturing is mainly based on silicon, on
which sub-micrometer features are implemented. However, typical dimensions of
microchannels in MPT devices are in the range of 25 to 500 μm.
2.2. Scale-up of MPT devices
Practical applications of MPT devices involve the processing of bulk fluids and
thermal energy management. The large volumes of fluid processed in MPT devices
require the arraying of microchannels. The process of scaling-up microchannel devices is
referred to as “numbering-up” since increasing fluid volumes are managed by increasing
the number of channels. Arrays of microchannels are patterned across a single lamina and
many such laminae are then stacked and bonded together to form a two-dimensional
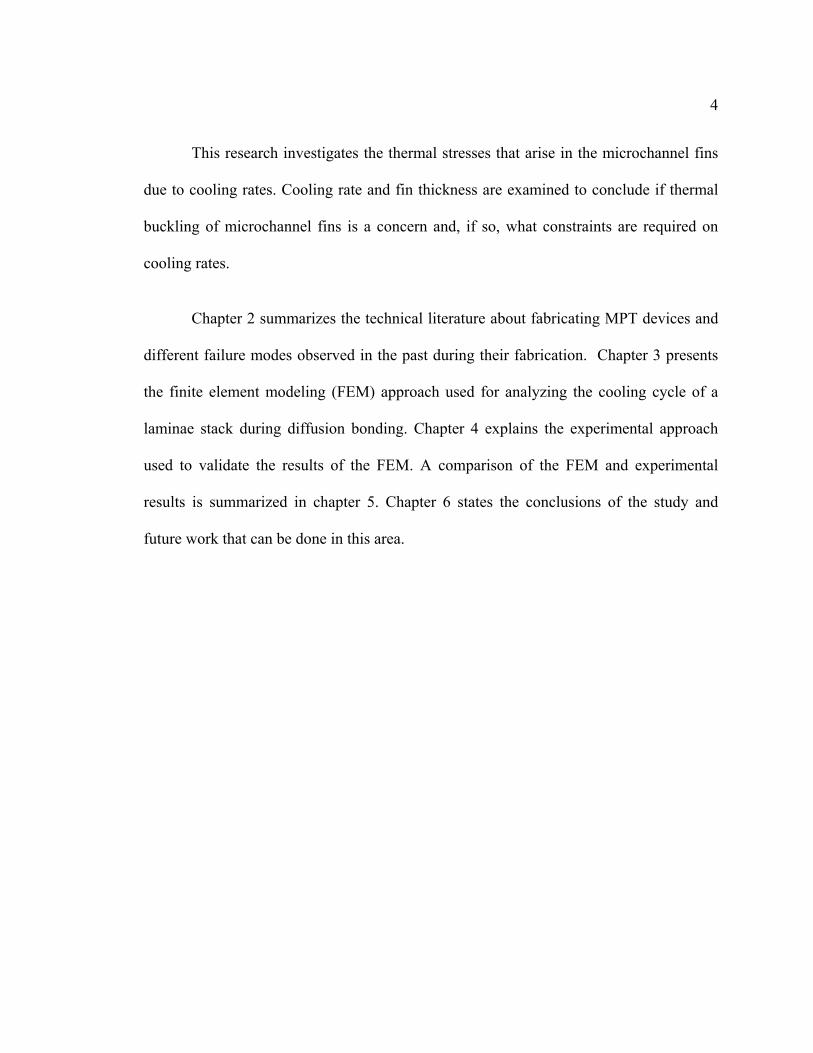
array of channels. These arrays can be banked together to further increase the volume of
fluid processed (Figure 2-1).
6
Figure 2-1. Scale-up of microchannels by numbering-up channels, layers and devices.
2.3. Microlamination
The majority of MPT devices are produced using microlamination architectures
[14] [36][37][27]. Microlamination is a fabrication protocol for producing monolithic
MPT devices with embedded geometries and flow patterns [19][4] necessary for the
microchannel processing of bulk fluid volumes. In general, microlamination architectures
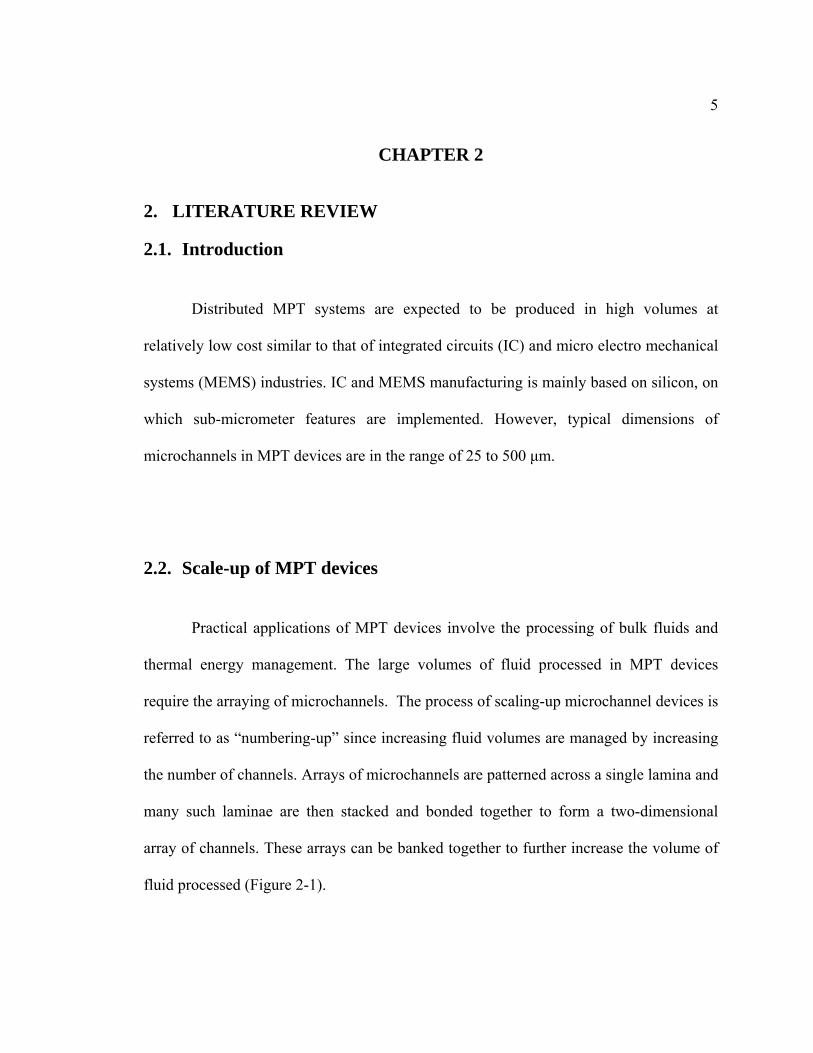
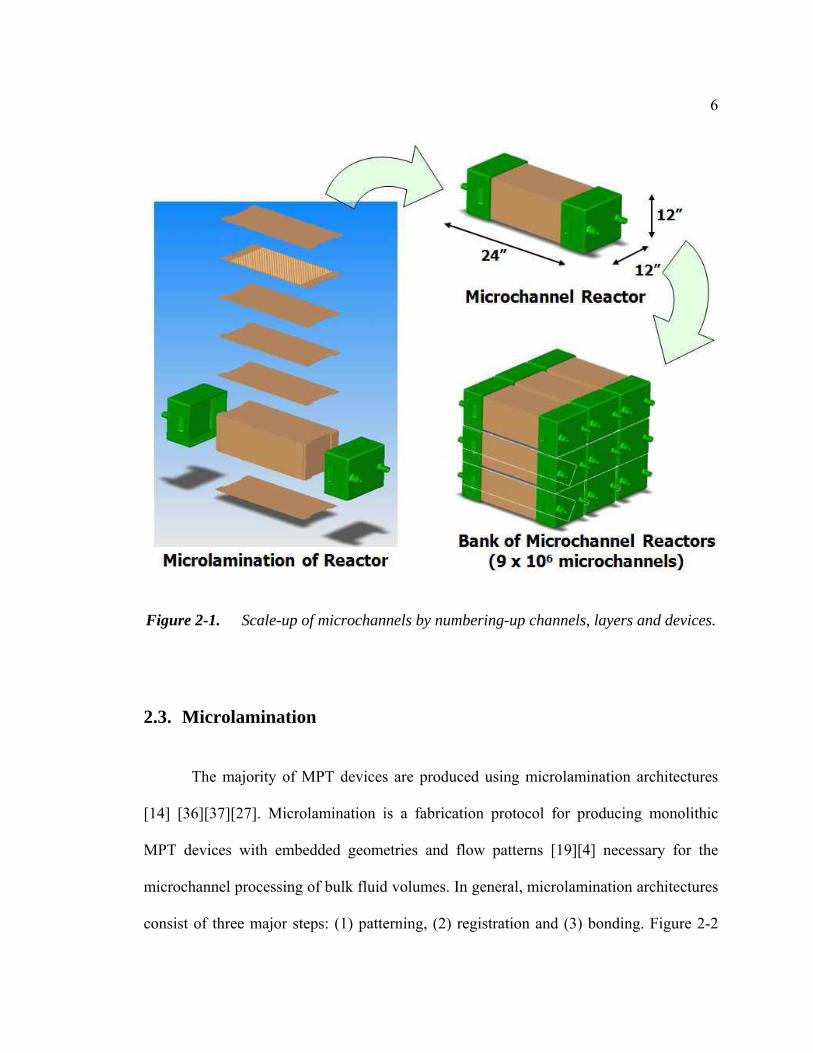
consist of three major steps: (1) patterning, (2) registration and (3) bonding. Figure 2-2
7
shows an exploded view of a typical microchannel array design used for heat and mass
transfer.
Figure 2-2. Schematic of microlamination approach
2.3.1 Patterning and Registration
Patterning is the process of making micro features on thin sheets (laminae).
Various techniques have been employed for patterning of individual laminae. Patterned
laminae with complex channel features and good resolution are typically produced using
photochemical machining (PCM), laser machining, wire electrodischarge (wire-EDM) or
stamping. Wire-EDM can be employed to cut a stack of hundreds of laminae at the same

8
time. Stamping is a potential low cost alternative for mass production. Laser machining is
used when micro-features are to be patterned on polymers. After patterning, the laminae
can be aligned, or registered, using pins and precise pinholes [32]. A thermally-enhanced
edge registration (TEER) technique [40] has been used to align laminae. The TEER
technique employs the difference in thermal expansion between fixtures and laminae to
precisely register the laminae during high temperature bonding cycles.
2.3.2 Diffusion Bonding
Diffusion bonding, diffusion brazing, brazing and other forms of bonding have
been used to bond registered laminae into a monolith device [34]. Diffusion bonding is
mainly influenced by three major parameters: (1) bonding temperature, (2) bonding
pressure and (3) bonding time. Diffusion bonding is typically done in a vacuum hot press
(VHP) where the sample is heated to the bonding temperature in vacuum by radiation
from the heating element onto the surface of the lamina assembly followed by intra-
assembly conduction. Once at the bonding temperature, laminae are pressed uniformly
for a specific period of time necessary for solid state diffusion to take place across lamina
boundaries. The bonding temperature reduces the yield stress of materials and activates
diffusion and mobility of atoms in the lattice, whereas the bonding pressure increases
contact between faying surfaces by plastically deforming surface asperities. A surface
finish of 0.4 μm Ra or better is typically necessary to achieve bond strength close to that
9
of the parent material [32]. The bonding of materials typically takes place at between 0.5
and 0.7 of the melting temperature of the lowest melting material. Typical bonding
pressures range from 5 and 10 MPa for carbon steels, 7 and 12 MPa for stainless steels
and 3 and 7 MPa for aluminum alloys [32]. Bonding time is typically over several hours
depending on the applied temperature and pressure. The strength of the resultant bond is
proportional to the square root of the bonding time. For a properly diffusion bonded
structure with minimal voids and inclusions on the bond line, the bond strength ideally
would be the same as that of the parent material.
2.4. Failures during Diffusion Bonding
Prior studies have shown that the diffusion bonding step can be critical for
controlling yield in microlamination processes where improper bonding conditions can
lead to leakage or warpage defects and flow maldistribution problems across
microchannel arrays. Paul et al. [6] successfully analyzed the design limits on aspect
ratios in counter-flow microchannel arrays and results were matched with empirical data.
Findings showed that leakage due to poor bonding conditions were predicted in regions
of test articles where the stress distribution approached the tensile/compressive boundary.
Schubert, et al. [23] noted that the lack of structural support in microchannel designs
could result in the collapse of microchannels during operation. Warpage is less likely to
10
occur in small test articles where spans are small. In larger devices, complex header
structures can lead to large unsupported spans.
Two common warpage mechanisms within MPT devices generated during the
diffusion bonding process are creep and buckling described below.
2.4.1 Creep
Application of bonding pressures over long durations can result in warpage of
microchannel structures due to creep. Creep is the permanent deformation of a material
at stresses below the yield strength of the material. Creep is a time, temperature and
pressure phenomena. Higher temperatures reduce the amount of time for which pressure
has to be applied on the material for creep to occur. Typically, creep causes fin warpage
by causing adjacent fin supports to deform in a non-uniform manner.
2.4.2 Buckling
Buckling is a failure mechanism characterized by the sudden collapse of a
structural member due to lateral deflection when subjected to high compressive stresses.
The actual compressive stress at the point of buckling can be less than the yield
compressive stress that the material is capable of withstanding. This mode of failure can

11
also be described as failure due to elastic instability. Buckling of microchannel fins
during diffusion bonding has been found to be caused by several factors including
differential thermal expansion between laminae and bonding fixtures [40] and Poisson’s
ratio [9].
In 1757, Leonhard Euler derived a formula for the maximum axial load that a
slender, ideal column can carry without buckling (Equation 1). The critical buckling load
causes the column to be in the state of unstable equilibrium. Any increase of load in the
axial (longitudinal) direction or application of slight force in the lateral direction will
cause the column to buckle.
(Equation – 1)
where,
Fcritical = Critical buckling force [N]
E = Young’s modulus of the material [Pa]
I = area moment of inertia [m4]
b = unsupported structure span [m]
K = column effective length factor
Alfutov [26] has done additional work based on Euler’s formula and developed
additional formulas. In order to adapt the formulas for microchannel applications,
discussed in previous sections, critical buckling load for rectangular plates was
implemented. The microchannel plate structure (subjected to buckling) is supported along
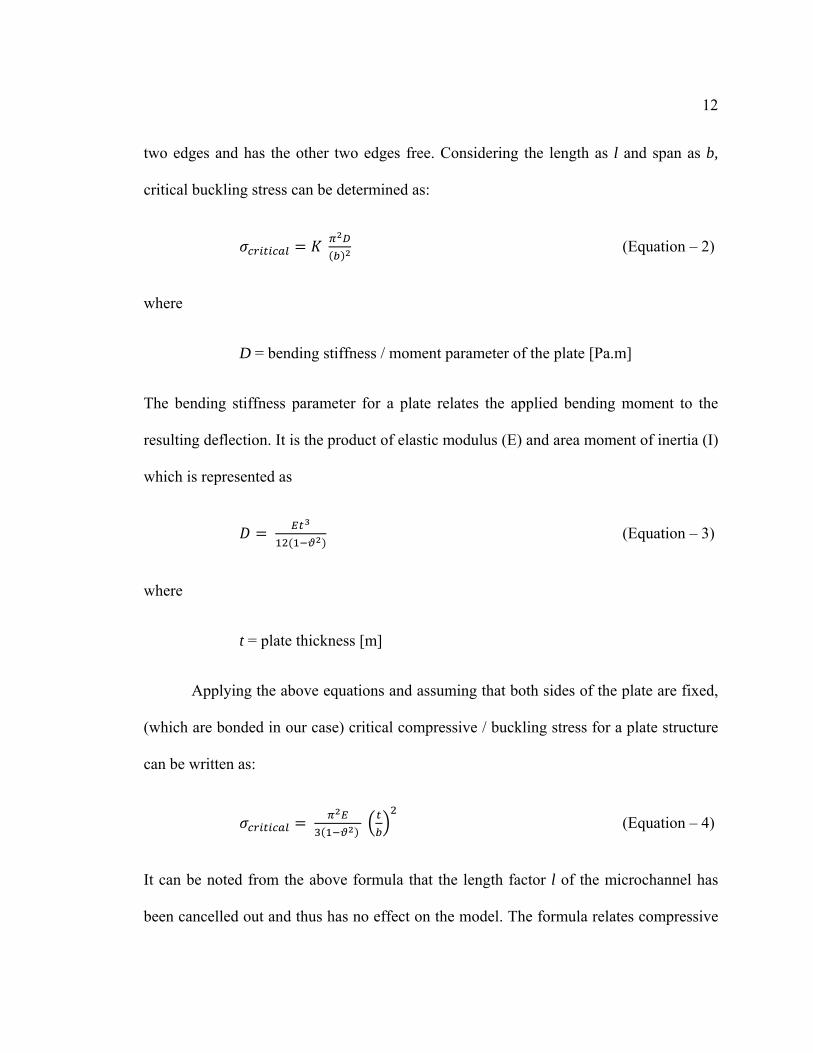
12
two edges and has the other two edges free. Considering the length as l and span as b,
critical buckling stress can be determined as:
(Equation – 2)
where
D = bending stiffness / moment parameter of the plate [Pa.m]
The bending stiffness parameter for a plate relates the applied bending moment to the
resulting deflection. It is the product of elastic modulus (E) and area moment of inertia (I)
which is represented as
(Equation – 3)
where
t = plate thickness [m]
Applying the above equations and assuming that both sides of the plate are fixed,
(which are bonded in our case) critical compressive / buckling stress for a plate structure
can be written as:
(Equation – 4)
It can be noted from the above formula that the length factor l of the microchannel has
been cancelled out and thus has no effect on the model. The formula relates compressive

13
stresses to the material’s mechanical properties (E and ) and the structural dimensions (t
and b).
2.4.3 Thermal Buckling
When a structural element is subjected to a temperature gradient due to a cooling
effect on one end, the material will contract in different amounts in accordance with its
coefficient of thermal expansion (CTE) and the temperature distribution. If the resultant
thermal strain produces compressive stresses beyond the critical buckling stress of the
structural element, the element will buckle. This phenomenon is known as thermal
buckling. Four major scenarios that induce thermal stresses within a material are:
i. When a body is non-uniformly heated. If different portions of a body are exposed
to different thermal conditions, the hotter portion of the body tries to expand more in
comparison to the colder portion. Expansion of the hotter portion is restricted by the
colder portion thus inducing thermal strains within the body.
ii. A CTE mismatch. If a layered composite is exposed to a uniform temperature
change, individual materials expand according to their CTE. One metal expands or
contracts more compared to the other. If the interfacial bond between the materials holds,
one material imposes constraints on the other.
Layered composite of 2 materials,

14
CTEs: α1 > α2
Initial and final temperatures: Ti and Tf
Stress in material1: σ1 E1 α2 α1 ΔT
Stress in material2: σ2 E2 α1 α1 ΔT
where,
E is the Young’s modulus of the material and
ΔT is the raise in temperature from initial state to final state
iii. CTE anisotropy. For some materials, the CTE can differ along different crystal
directions. Changes in temperature across the material results in regions of
expansion/compression in different directions. On cooling of these materials, stresses
develop at grain boundaries which may result in microcracks.
iv. Uniformly heated and restrained. A body free of any forces and restraints is
subjected to temperature change uniformly from an initial temperature Ti to a final
temperature Tf. Stresses do not arise within the body because the expansion/contraction
is unrestrained. The only case where a body which is uniformly heated results in thermal
stresses is when it is restrained either in translational or rotational motion.
A recent study at Oregon State University showed that the diffusion bonding
cycle time can be the largest of all cost factors in the production of MPT devices,
representing 40 to 87% of the fabrication cost [33]. In diffusion bonding, cycle times are
often dictated by the heating and cooling rates used during the process. It is widely
Material 1
Material 2
Composite with materials of different CTE’s
15
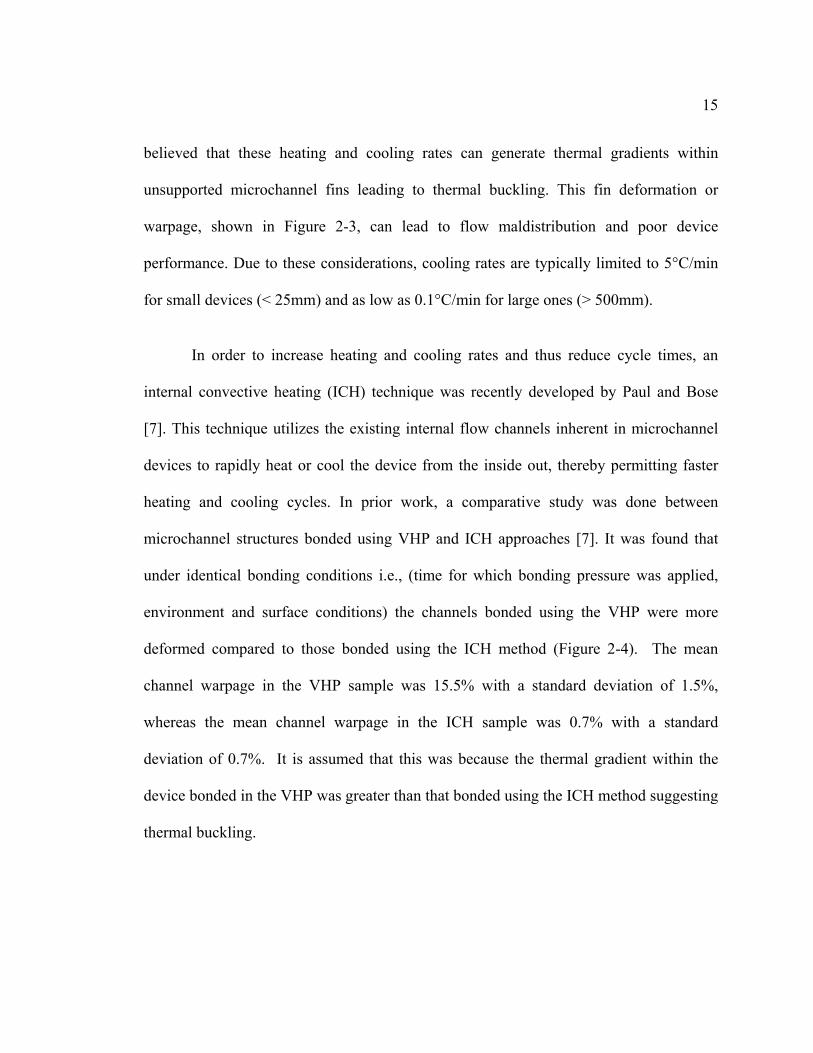
believed that these heating and cooling rates can generate thermal gradients within
unsupported microchannel fins leading to thermal buckling. This fin deformation or
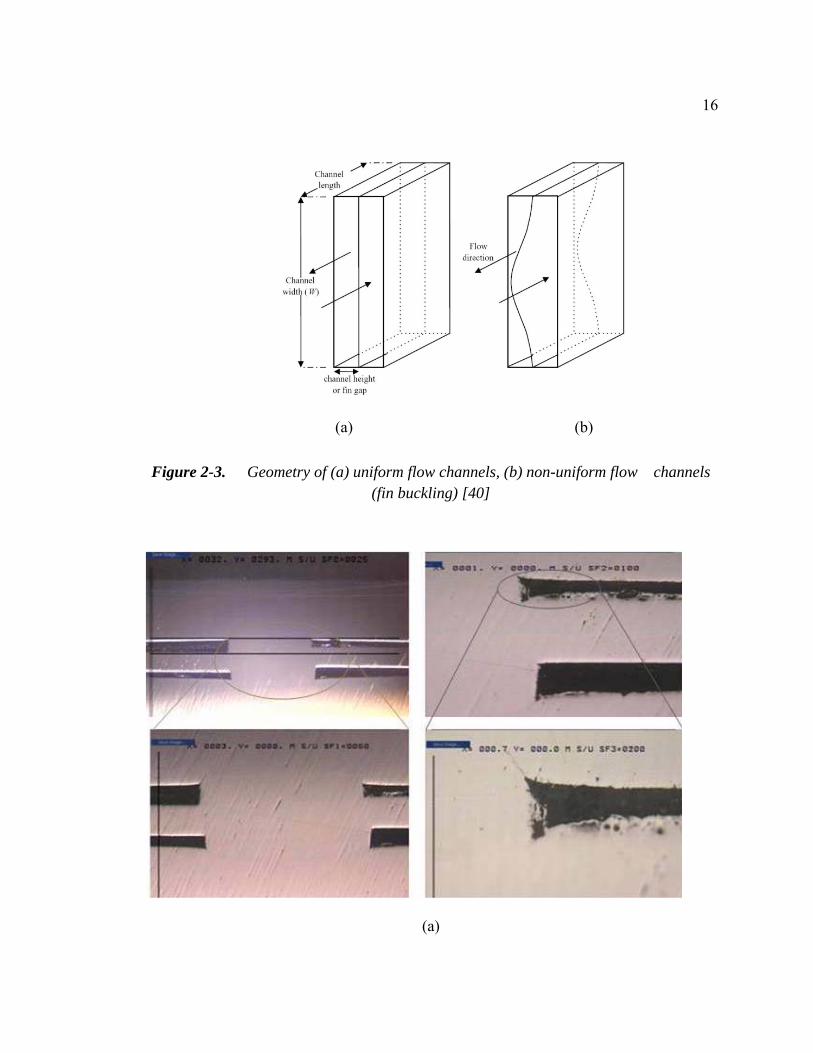
warpage, shown in Figure 2-3, can lead to flow maldistribution and poor device
performance. Due to these considerations, cooling rates are typically limited to 5°C/min
for small devices (< 25mm) and as low as 0.1°C/min for large ones (> 500mm).
In order to increase heating and cooling rates and thus reduce cycle times, an
internal convective heating (ICH) technique was recently developed by Paul and Bose
[7]. This technique utilizes the existing internal flow channels inherent in microchannel
devices to rapidly heat or cool the device from the inside out, thereby permitting faster
heating and cooling cycles. In prior work, a comparative study was done between
microchannel structures bonded using VHP and ICH approaches [7]. It was found that
under identical bonding conditions i.e., (time for which bonding pressure was applied,
environment and surface conditions) the channels bonded using the VHP were more
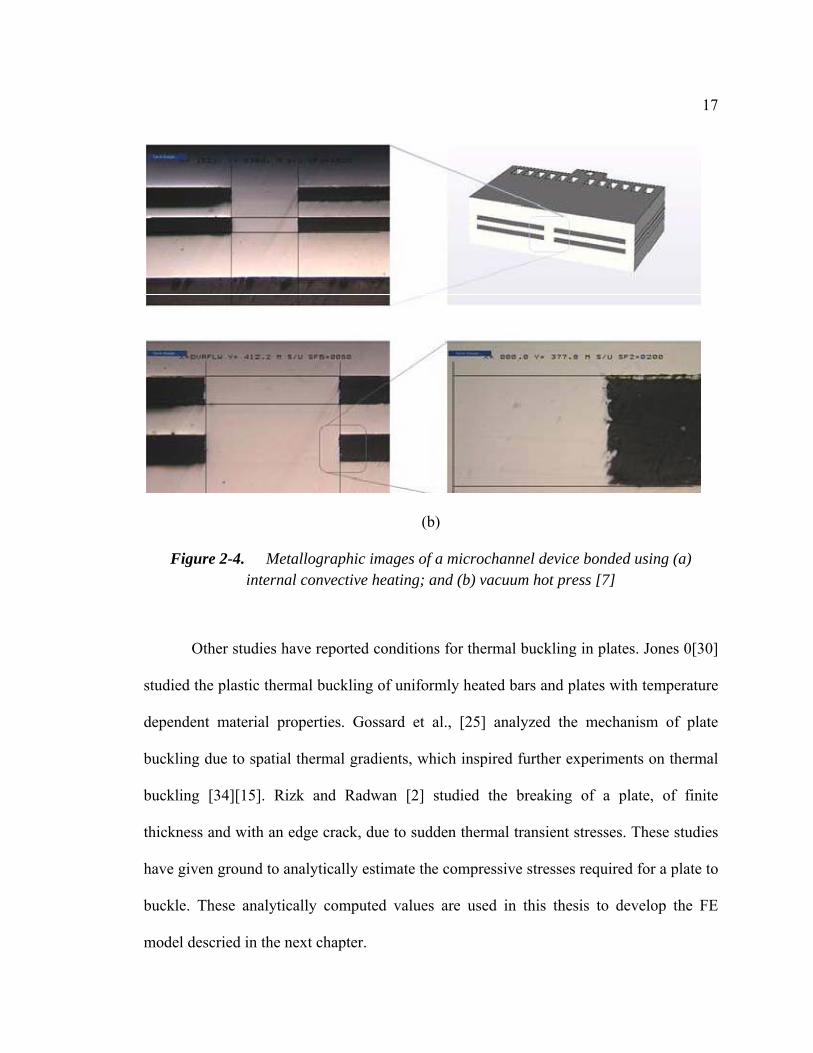
deformed compared to those bonded using the ICH method (Figure 2-4). The mean
channel warpage in the VHP sample was 15.5% with a standard deviation of 1.5%,
whereas the mean channel warpage in the ICH sample was 0.7% with a standard
deviation of 0.7%. It is assumed that this was because the thermal gradient within the
device bonded in the VHP was greater than that bonded using the ICH method suggesting
thermal buckling.
16
(a) (b)
Figure 2-3. Geometry of (a) uniform flow channels, (b) non-uniform flow channels (fin buckling) [40]
(a)
17
(b)
Figure 2-4. Metallographic images of a microchannel device bonded using (a) internal convective heating; and (b) vacuum hot press [7]
Other studies have reported conditions for thermal buckling in plates. Jones 0[30]
studied the plastic thermal buckling of uniformly heated bars and plates with temperature
dependent material properties. Gossard et al., [25] analyzed the mechanism of plate
buckling due to spatial thermal gradients, which inspired further experiments on thermal
buckling [34][15]. Rizk and Radwan [2] studied the breaking of a plate, of finite
thickness and with an edge crack, due to sudden thermal transient stresses. These studies
have given ground to analytically estimate the compressive stresses required for a plate to
buckle. These analytically computed values are used in this thesis to develop the FE
model descried in the next chapter.
18
CHAPTER 3
3. FINITE ELEMENT MODELING
3.1. Introduction
Finite element analysis (FEA) software has been used to simulate the mechanical
behavior of microchannel structures under operating conditions. Zhou et al. [18] used
FEA software to analyze the visco-elastic deflection and stresses of microchannel
structures when subjected to internal (operating) pressure. In this manner, FEA can
facilitate a better understanding of design limitations of arrayed microchannel
components during operation.
Further, finite element analyses (FEA) have been employed in the past to
understand the stress states within bonded joints and laminated stacks during bonding.
Travessa [12] employed FEA to evaluate residual stresses in joining aluminum oxide and
stainless steel using an interlayer. Similarly, finite element simulations were conducted
by Feng [20] to estimate the thermal stresses generated during diffusion bonding of Al2O3
ceramic to aluminum. More recently, Paul et al. [6] employed the FEA technique to
analyze stress state between laminae during diffusion bonding to determine the
conditions necessary for diffusion bonding to take place in areas not subjected to direct
bonding pressure. Pluess and Paul [10] used FEA to model the resultant bonding
pressure generated by a diffusion bonding fixture based on differential thermal
expansion.
19
In this thesis, a finite element model is developed to predict the cooling rates
under which thermal buckling will happen in microchannel fins of MPT devices during
diffusion bonding. The model is subjected to uncoupled thermal-mechanical analysis
with linear elements in ABAQUS.
3.2. Case Study
To investigate the use of FEA to model the thermal buckling behavior discussed
above, experimental results from earlier work performed by Paul and Bose [33] were
used. Paul et al. [7] developed a novel approach known as internal convective heating
(ICH) process to increase the heating and cooling rates of diffusion bonding cycle. This
technique utilizes the existing internal flow channels inherent in the microchannel
devices to rapidly heat or cool the device from inside out, thereby reducing the diffusion
bonding cycle time considerably. A comparative study was made between the ICH
approach and that of a conventional heating process performed in a vacuum hot press
(VHP). It was found that under identical bonding conditions, the microchannel devices
bonded in a VHP had highly deformed channels compared to those bonded using the ICH
process. It was expected that the warpage found was due to thermal buckling of fins
within the device, as the diffusional distance for heat transfer in VHP was more than 10
times that in the ICH process.
Figure 2-4 shows metallographic images of the stainless steel microchannel
device bonded using ICH process and in VHP. An exploded view of the solid model of
20
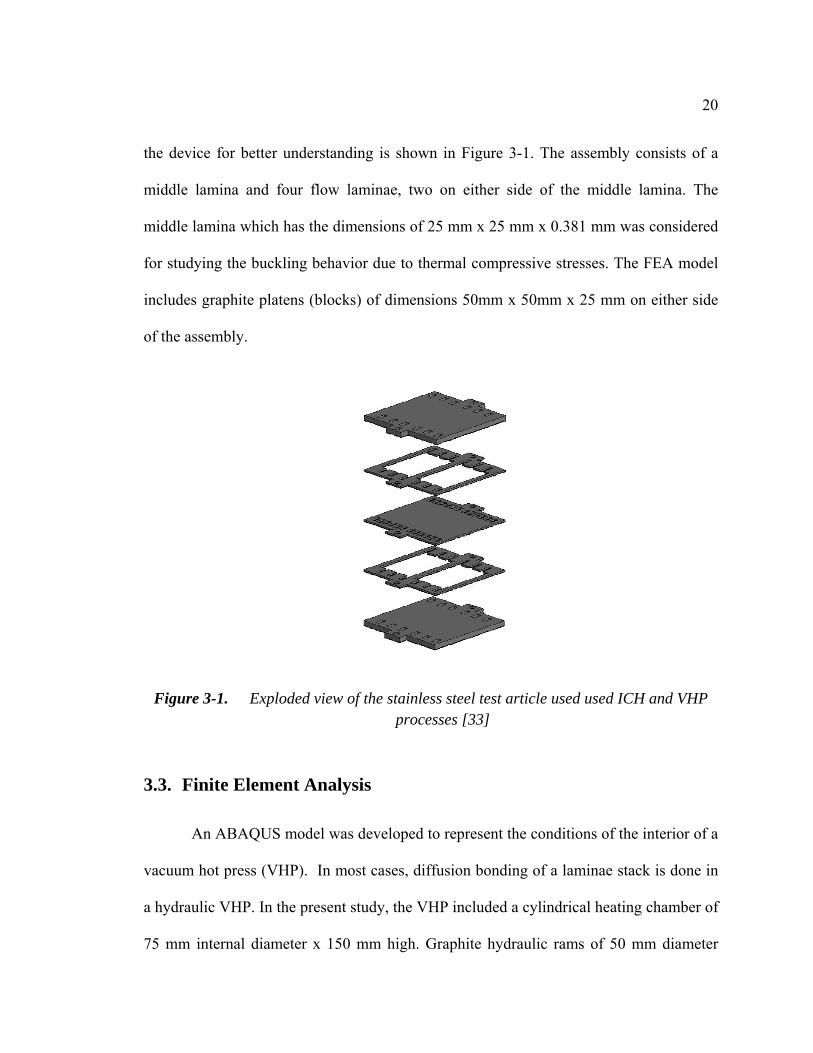
the device for better understanding is shown in Figure 3-1. The assembly consists of a
middle lamina and four flow laminae, two on either side of the middle lamina. The
middle lamina which has the dimensions of 25 mm x 25 mm x 0.381 mm was considered
for studying the buckling behavior due to thermal compressive stresses. The FEA model
includes graphite platens (blocks) of dimensions 50mm x 50mm x 25 mm on either side
of the assembly.
Figure 3-1. Exploded view of the stainless steel test article used used ICH and VHP processes [33]
3.3. Finite Element Analysis
An ABAQUS model was developed to represent the conditions of the interior of a
vacuum hot press (VHP). In most cases, diffusion bonding of a laminae stack is done in
a hydraulic VHP. In the present study, the VHP included a cylindrical heating chamber of
75 mm internal diameter x 150 mm high. Graphite hydraulic rams of 50 mm diameter
21
were present at the center of the chamber and employed to hold and apply pressure on the
lamina stack. Heating elements and coolant circulation tubes were present in a shell
surrounding the chamber. Heat was transferred from the heating elements in the shell to
the surface of the laminae stack by radiation and from the surface to the inside of the
laminae by conduction.
A two-step, sequentially-coupled thermal-stress analysis was performed in
ABAQUS. The most common type of sequentially coupled thermal-stress analysis is one
in which the temperature field in the model does not depend on the stress field but the
stress field is dependent on temperature field. In the present case, the analysis was
performed by first conducting an uncoupled heat transfer analysis to generate a
temperature distribution followed by a stress/deformation analysis based on the results
from the heat transfer analysis.
3.3.1 Uncoupled Heat Transfer Analysis
Uncoupled heat transfer analysis is generally employed to model heat conduction
in a solid body with temperature-dependent conductivity, internal energy (including
latent heat effects), or general convection and radiation boundary conditions, including
cavity radiation. Since our model involves radiation and conduction modes of heat
transfer, an uncoupled heat transfer analysis was employed. Non-linear heat transfer
problems that arise due to temperature-dependent material properties, as in the present
scenario, are solved iteratively in ABAQUS. A transient analysis was run on the model to
22
understand the behavior of thermal gradients in the assembly with respect to time. The
result of the heat transfer analysis was stored in ABAQUS as a nodal temperature
distribution with respect to time.
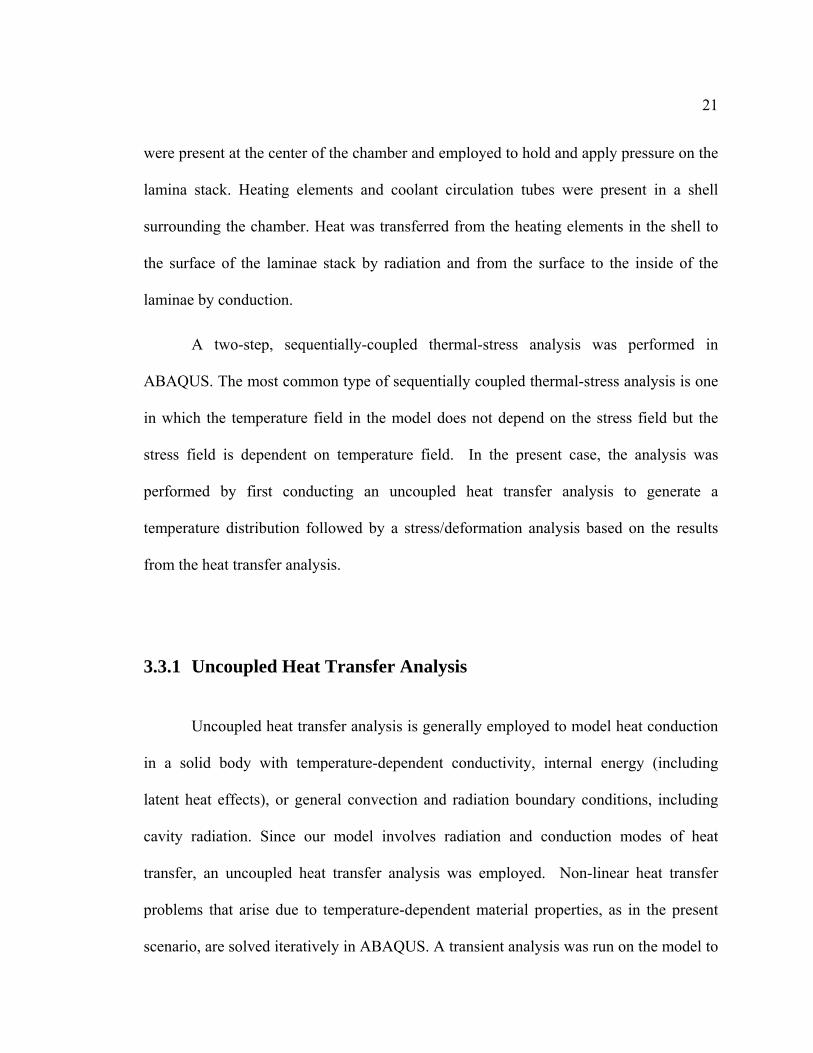
A solid model of the laminae stack was built in Solidworks and imported into
ABAQUS for the analysis. A solid and homogenous section, which includes all
temperature dependent material properties [1][8][22] (specific heat, density and
conductivity), was created and each lamina in the stack was assigned with the section. An
assembly of all the laminae was created. A hexagonal mesh was generated on all the
laminae in the stack. Each stack had approximately 30,000 elements in it, with the size of
each element being less than the smallest feature size in the stack. Figure 3-2 shows a
representation of the test article with hexagonal mesh elements.
Figure 3-2. Stack meshed with hexagonal mesh elements

23
The transient heat transfer (HT) analysis was carried out in iterative loops for the
initial 300 seconds of the ramp down thermal cycle to determine the time period and
location of the maximum compressive thermal stresses during bonding. The transient
analysis for the 300 seconds was conducted with a time increment of 0.01 seconds. For
each increment, the temperature variation at each nodal point was recorded. The
maximum variation of temperature for each increment was set at 50C. The following
assumptions were made for all analyses:
(i) The whole assembly is at bonding temperature (800C) before the cooling
cycle commences. This is because each of the diffusion bonding cycle has a
dwell time of 60 minutes after ramp up, giving sufficient time for each
assembly to stabilize at the bonding temperature.
(ii) All laminae are bonded perfectly since a uniform bonding pressure was
applied to the assembly for 60 minutes at the bonding temperature to permit
solid-state diffusion bonding [10].
(iii) The top and bottom surfaces of the stainless steel laminae stack are insulated
since the stack is bounded by alumina platens.
(iv) All the laminae were perfectly flat.
The following boundary conditions were applied to the model:
(i) A pre-defined field of 800°C was enforced on the stack.
(ii) A tie constraint was applied to all laminae in the stack in order to impart
bonded behavior within the assembly.
24
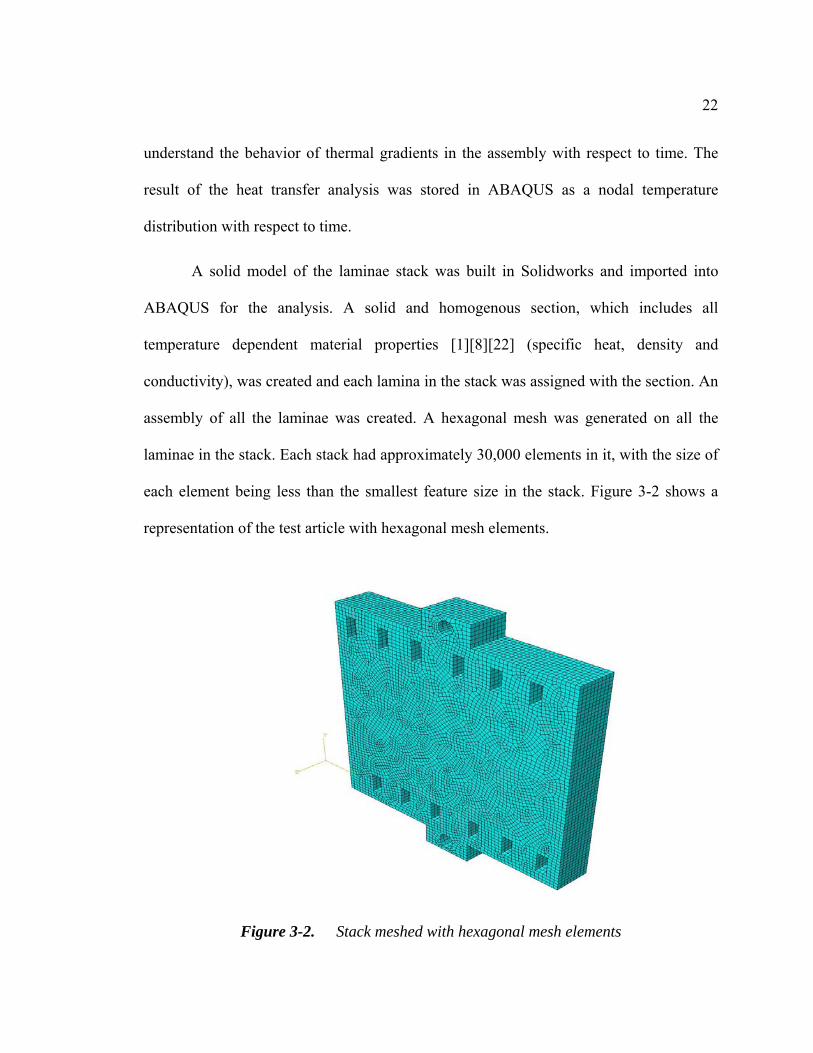
(iii) Heat transfer due to radiation would take place from the sides facing the
heating elements.
Figure 3-3. Actual diffusion bonding cycle times of the sample [7]
3.3.2 Transient Stress/Deformation Analysis
A mesh similar to the one used in the heat transfer analysis was produced in
ABAQUS to conduct the sequentially-coupled transient stress analysis. This analysis was
used to understand the thermal stresses developed in the laminae during the cooling cycle
of the diffusion bonding process. A transient approach was chosen to understand the
stress build-up in the assembly with respect to time.
25
The transient stress analysis was also performed in iterative loops for the first 300
seconds of the cooling cycle in conjunction with the heat transfer analysis to determine
the maximum compressive stress that arises. The stress analysis was carried out by
importing the nodal temperatures (output of HT analysis) as a predefined field. The nodal
temperatures vary with position and time. The nodal temperature set was imported
because it does not change by the stress analysis solution. The predefined fields are read
into ABAQUS at the nodes and are then interpolated to the calculation points with the
elements as needed. To define the temperature in the stress analysis with respect to
position, the temperatures are stored at nodes. To define the temperature in the stress
analysis at different times, the nodal temperatures are stored as a function of time in the
heat transfer analysis results. It is necessary to maintain the same mesh type in both the
heat transfer and stress analyses because ABAQUS assumes that the node numbers are
the same for corresponding nodes in both the analyses. Temperature dependent material
properties [1][8][22] (elasticity, plasticity, yield strength and co-efficient of thermal
expansion) were fed into the model. The following assumptions were made for the stress
analysis:
(i) The whole assembly is at bonding temperature before the cooling cycle
commences.
(ii) All the laminae are perfectly bonded.
(iii) The top and bottom surfaces of the laminae stack are insulated.
(iv) Heat is lost from the stack only due to radiation.
26
(v) All the laminae are perfectly flat.
The following boundary conditions were applied to the stress analysis model:
(i) Nodal temperature set from heat transfer analysis was imported as a
predefined field.
(ii) A pre-defined bonding temperature of 800C was enforced on the stack.
(iii) A tie constraint was applied between all laminae to impart bonded behavior
within the assembly.
(iv) No force was applied on the stack.
(v) A z-axis displacement constraint was enforced on the stack.
3.4. Preliminary Results
Preliminary heat transfer modeling results showed that the maximum thermal
gradient was found to occur in the first few minutes into the cooling cycle. This
corresponds to high rates of radiation taking place at higher temperatures of the test
article according to:
(Equation – 5)
where,
= Power emitted by the body
27
A = surface area of the body ( )
= Stefan Boltzman’s constant )
= emissivity of the body
T = temperature of the body (K)
= temperature of the surroundings (K)
Initial stress analysis results showed that the temperature gradients did not
produce sufficient stresses required for thermal buckling of the fin. Upon closer
examination, the thermocouple data revealed that the device underwent a much larger
cooling rate than originally expected. Figure 3-4 shows a close-up of the thermocouple
data for the first 60 seconds of the cooling cycle. A cooling rate of approximately
660°C/min can be seen at around 20 seconds. In order to match this high cooling rate,
surface radiation to ambient boundary condition was substituted with surface heat flux to
manipulate the cooling rate within the platen assembly. Since the exact location of the
thermocouple was not reported in the study, a series of HT (and stress) analyses were
conducted under various heat flux conditions that placed the desired cooling cycle at
various places within the graphite platen. Assuming that the thermocouple was placed on
the periphery of the graphite block, temperature profiles of the surface and the center of
the fin are shown in Figure 3-5 for the heat flux boundary condition.

28
Figure 3-4. Thermocouple data recorded for the first minute of cooling cycle [15]
Figure 3-5. Temperature profiles of the center and surface of the fin in the first minute of cooling cycle [15]
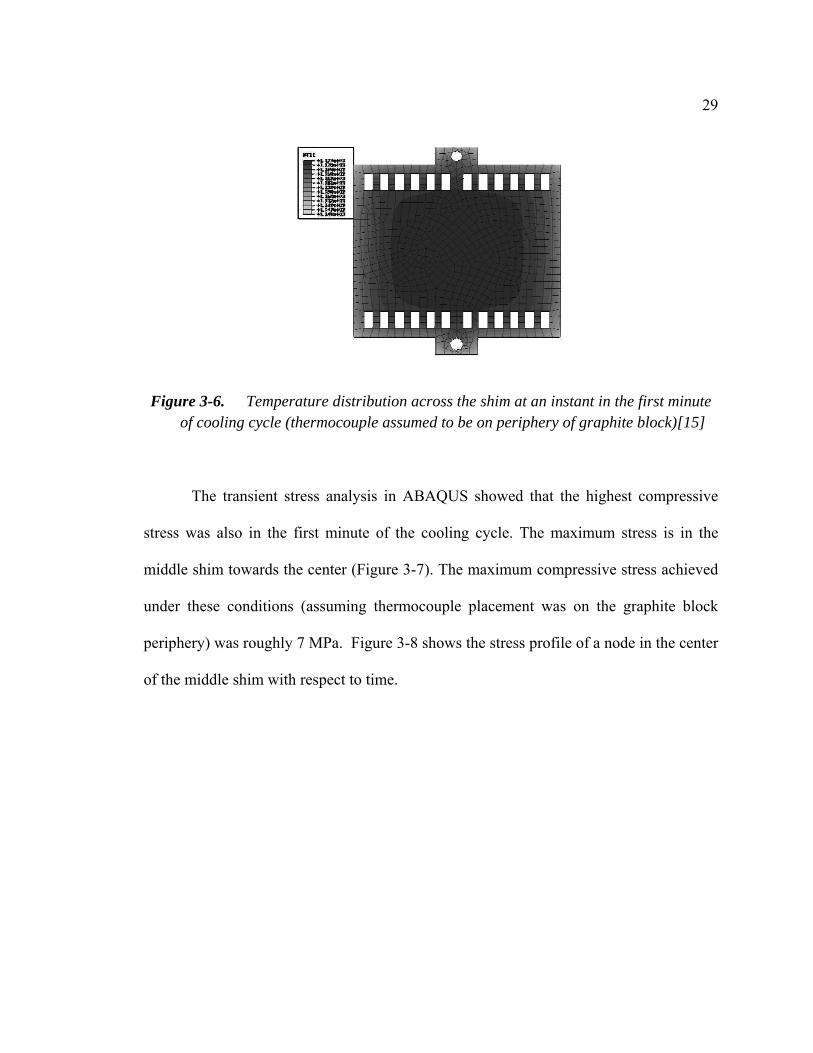
Figure 3-6 shows the temperature distribution across the middle shim at the time
of maximum thermal gradient (56°C/in.), which was found at approximately 24 seconds
into the cooling cycle. The maximum temperature is at the center of the shim as expected
because radiation heat transfer takes place on the periphery.
1120
1130
1140
1150
1160
1170
0 20 40 60
Experimental Temperature
(K)
Time (seconds)
1110
1120
1130
1140
1150
1160
1170
1180
0 10 20 30 40 50
Simulated Temperature (K)
Time (seconds)
At periphery of graphite blockAt center of middle shim
29
Figure 3-6. Temperature distribution across the shim at an instant in the first minute of cooling cycle (thermocouple assumed to be on periphery of graphite block)[15]
The transient stress analysis in ABAQUS showed that the highest compressive
stress was also in the first minute of the cooling cycle. The maximum stress is in the
middle shim towards the center (Figure 3-7). The maximum compressive stress achieved
under these conditions (assuming thermocouple placement was on the graphite block
periphery) was roughly 7 MPa. Figure 3-8 shows the stress profile of a node in the center
of the middle shim with respect to time.

30
Figure 3-7. Stress distribution across the fin at the instant of highest thermal gradient (thermocouple assumed to be on periphery of graphite platen)[15]
Figure 3-8. Stress plot of a node at the point of maximum compressive stress in the middle shim (thermocouple assumed to be on periphery of the graphite block) [15]
‐8.E+06
‐7.E+06
‐6.E+06
‐5.E+06
‐4.E+06
‐3.E+06
‐2.E+06
‐1.E+06
0.E+00
1.E+06
2.E+06
0 5 10Stress (N/m
2)
Fin span (mm)
‐8.E+06
‐6.E+06
‐4.E+06
‐2.E+06
0.E+00
2.E+06
4.E+06
0 20 40
Stress (N/m
2)
Time (seconds)

31
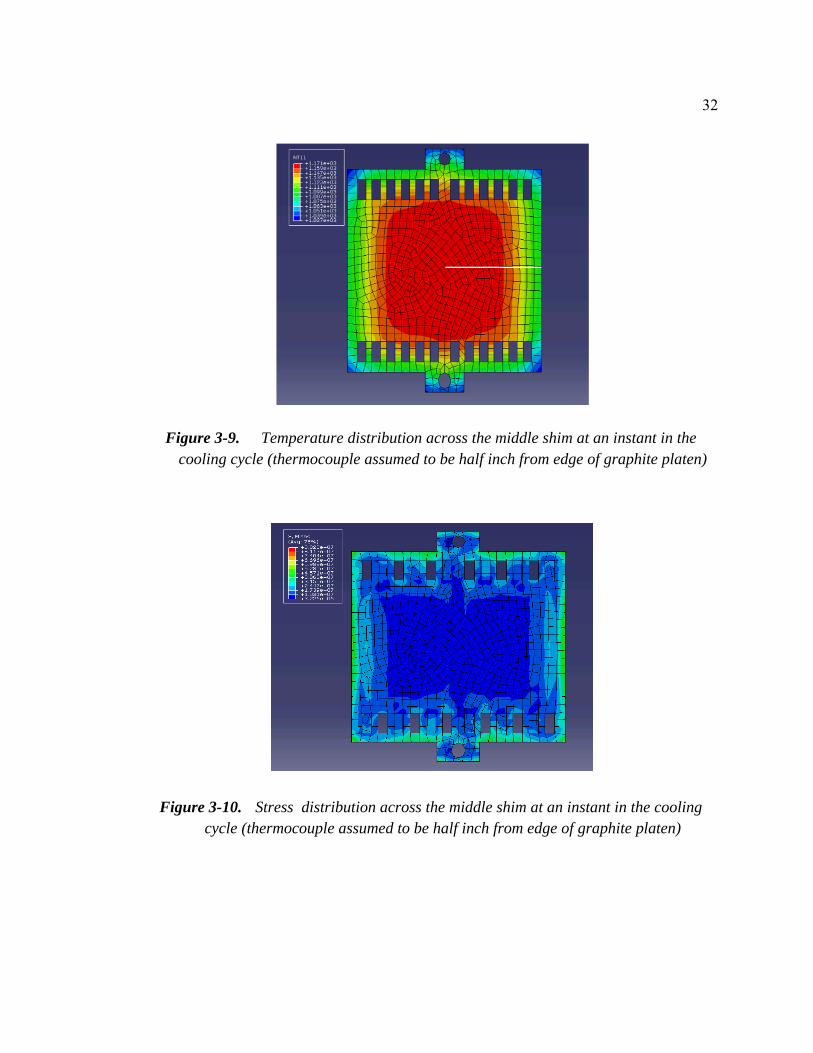
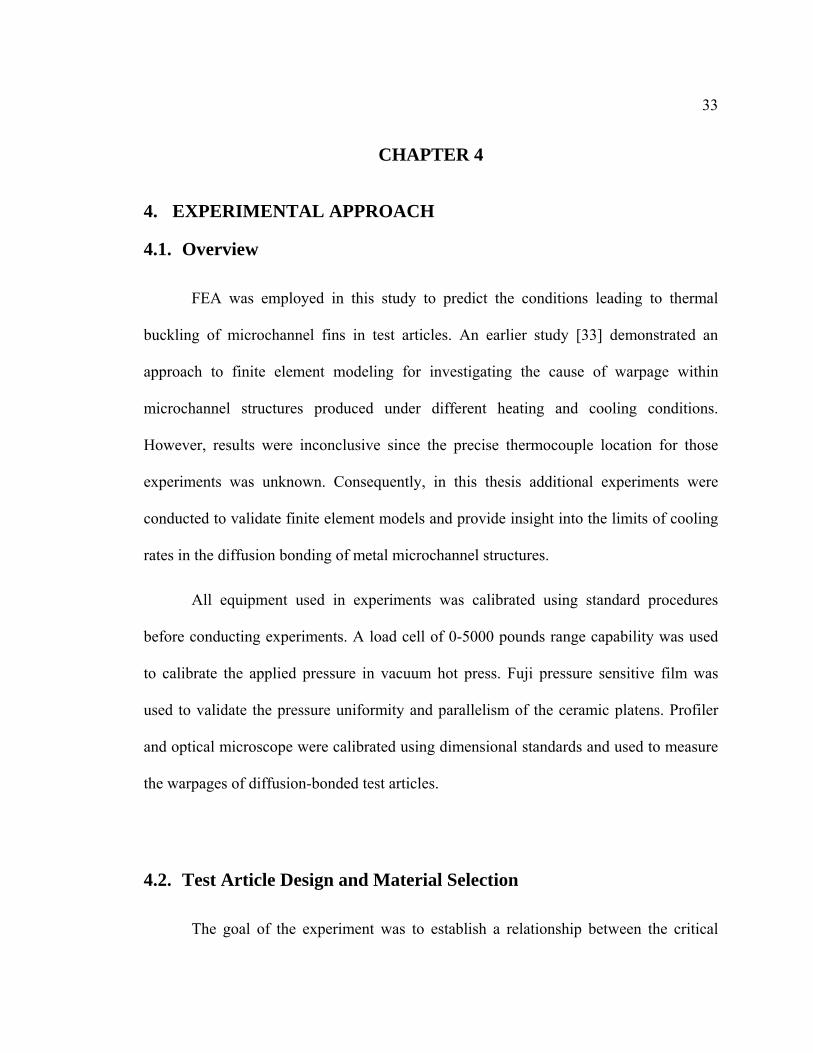
The analytically calculated value for the critical buckling stress of the fin was
found to be 204 MPa which is significantly higher than those calculated in Figure 3-8.
Since the exact location of the thermocouple was unknown, additional analyses were
conducted with the same boundary conditions and assuming different locations of the
thermocouple. To achieve the desired cooling rates within the microchannel structure,
peripheral heat flux conditions were manipulated. Since the manipulation of surface heat
flux boundary condition became difficult for thermocouple locations more than quarter
inch from the periphery, stress values beyond that point were extrapolated. The
extrapolated graph showed that stresses on the order of the critical buckling stress began
appearing when the thermocouple location was assumed to be one half inch from the
periphery of the graphite platen. Figure 3-9 & Figure 3-10 represent the temperature and
stress distributions respectively across the fin for the thermocouple position assumed to
be quarter inch from the periphery.
32
Figure 3-9. Temperature distribution across the middle shim at an instant in the cooling cycle (thermocouple assumed to be half inch from edge of graphite platen)
Figure 3-10. Stress distribution across the middle shim at an instant in the cooling cycle (thermocouple assumed to be half inch from edge of graphite platen)
33
CHAPTER 4
4. EXPERIMENTAL APPROACH
4.1. Overview
FEA was employed in this study to predict the conditions leading to thermal
buckling of microchannel fins in test articles. An earlier study [33] demonstrated an
approach to finite element modeling for investigating the cause of warpage within
microchannel structures produced under different heating and cooling conditions.
However, results were inconclusive since the precise thermocouple location for those
experiments was unknown. Consequently, in this thesis additional experiments were
conducted to validate finite element models and provide insight into the limits of cooling
rates in the diffusion bonding of metal microchannel structures.
All equipment used in experiments was calibrated using standard procedures
before conducting experiments. A load cell of 0-5000 pounds range capability was used
to calibrate the applied pressure in vacuum hot press. Fuji pressure sensitive film was
used to validate the pressure uniformity and parallelism of the ceramic platens. Profiler
and optical microscope were calibrated using dimensional standards and used to measure
the warpages of diffusion-bonded test articles.
4.2. Test Article Design and Material Selection
The goal of the experiment was to establish a relationship between the critical
34
buckling stress, lamina thickness and cooling rates for fabrication of microchannel
devices. A test article concept was developed which could be used to rapidly assess the
warpage of a microchannel fin due to transient thermal gradients that arise during
diffusion bonding. The test article consisted of 3 layers made from copper alloy 110.
Copper was selected as the material for study, since it has a low modulus of elasticity and
yield strength at higher temperatures which are necessary for producing thermal buckling
behavior with small test articles. The mechanical properties of copper reduce drastically
near the bonding temperatures [21][29]. In addition, copper is readily machinable using
laser patterning techniques which were readily accessible. Finally, copper has been
diffusion bonded across a wide range of bonding parameters [10].
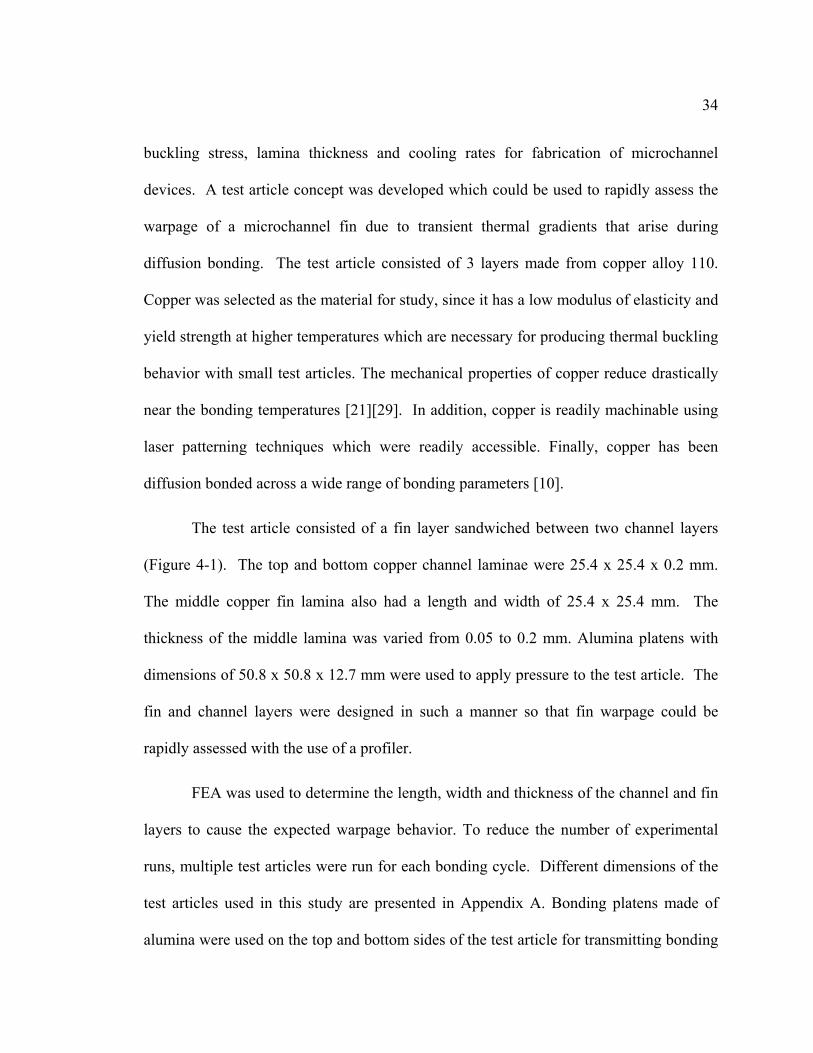
The test article consisted of a fin layer sandwiched between two channel layers
(Figure 4-1). The top and bottom copper channel laminae were 25.4 x 25.4 x 0.2 mm.
The middle copper fin lamina also had a length and width of 25.4 x 25.4 mm. The
thickness of the middle lamina was varied from 0.05 to 0.2 mm. Alumina platens with
dimensions of 50.8 x 50.8 x 12.7 mm were used to apply pressure to the test article. The
fin and channel layers were designed in such a manner so that fin warpage could be
rapidly assessed with the use of a profiler.
FEA was used to determine the length, width and thickness of the channel and fin
layers to cause the expected warpage behavior. To reduce the number of experimental
runs, multiple test articles were run for each bonding cycle. Different dimensions of the
test articles used in this study are presented in Appendix A. Bonding platens made of
alumina were used on the top and bottom sides of the test article for transmitting bonding
35
pressures uniformly in the vacuum hot press. These alumina platens (manufactured by
Coorstek) have a very low thermal conductivity value and work as insulators impeding
heat flow through the top and bottom of the laminae stack. The platens were designed to
be 50.8 X 50.8 x 12.7 mm and were double side grounded to have good flatness and
parallelism. The parallelism of the blocks is less than 10 µm over the whole surface and
surface roughness was observed to be less than 0.5 µm.
Figure 4-1. Test article used in this study with channel and fin areas
Mechanical and structural properties of copper alloy 110 shimstock, used in experiments,
at room and bonding temperatures are presented in Table 4-1.
Channel areas
Fin areas
36
Table 4-1. Mechanical properties of copper alloy 110 at room and bonding temperatures
Properties Room temperature (25C) Bonding temperature (800C)
Young’s modulus (E) 1.15 x 10¹¹ [N/m2] 25 x 1011 [N/m2]
Poisson’s ratio () 0.343 0.3
4.3. Test Article Fabrication
4.3.1 Laser Machining
Each test article used for the study consisted of three layers: one fin layer and
two-channel layers. The fin layer was sandwiched between the two channel layers. All
the layers of the test article were made of copper shim stock alloy 110 (annealed temper,
99.9% copper). For all the experiments conducted, the channel layers were 200 µm thick
whereas fin layers are made of four thicknesses (50, 75, 100 and 200 µm). An ESI 5530
Nd: YAG laser machine manufactured by Electro Scientific Industries (ESI) was used to
cut the shim stock with the desired features. The laser machine operates at the second
harmonic (532nm) with a maximum power output of 5.8W. Cutting speed, pulse
frequency, z-offset and the number of repetitions were modified and adjusted as needed
for different thicknesses shim stock. High cutting speed and low number of repetitions
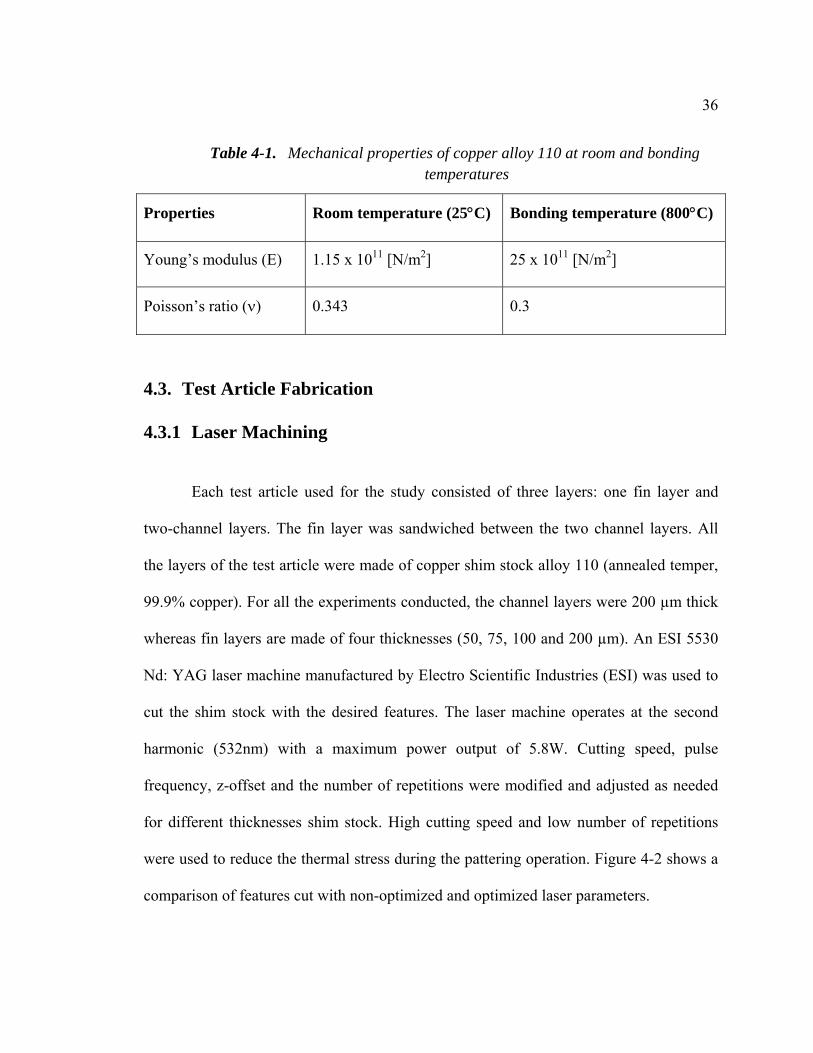
were used to reduce the thermal stress during the pattering operation. Figure 4-2 shows a
comparison of features cut with non-optimized and optimized laser parameters.
37
(a) (b)
Figure 4-2. Warpage in lamina after patterning features on the laser using (a) non-optimized parameters, (b) optimized parameters
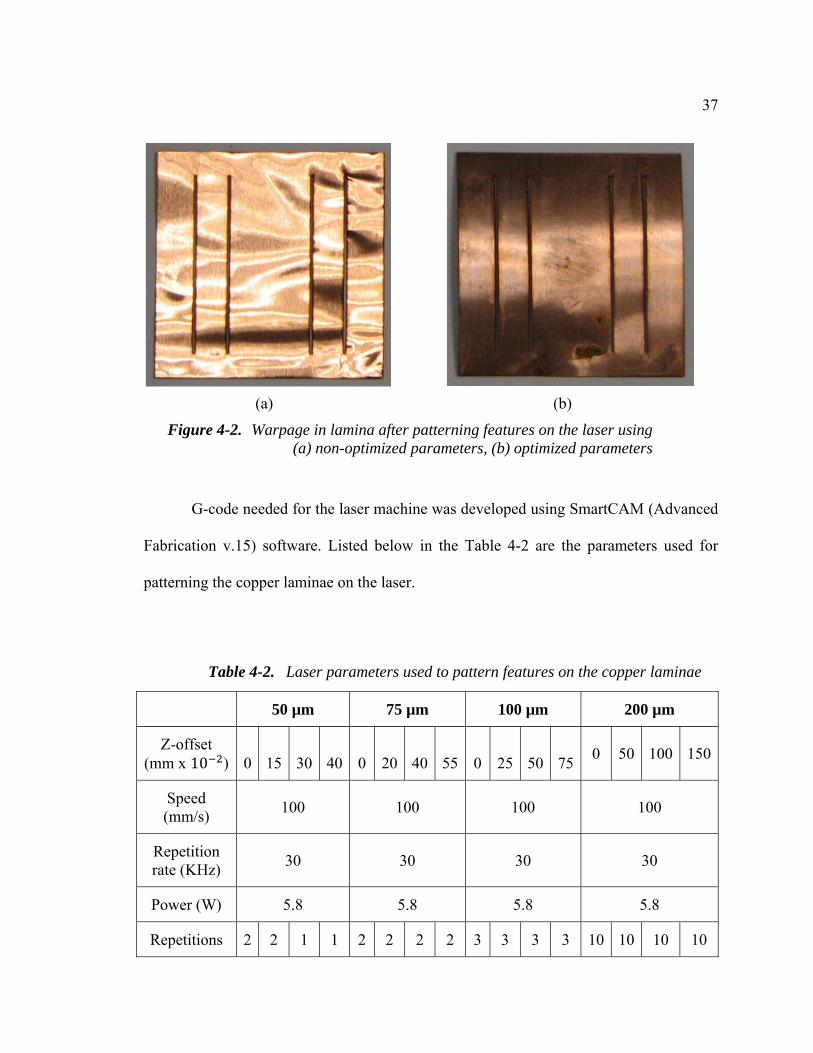
G-code needed for the laser machine was developed using SmartCAM (Advanced
Fabrication v.15) software. Listed below in the Table 4-2 are the parameters used for
patterning the copper laminae on the laser.
Table 4-2. Laser parameters used to pattern features on the copper laminae
50 µm 75 µm 100 µm 200 µm
Z-offset (mm x 10 ) 0 15 30 40 0 20 40 55 0 25 50 75
0 50 100 150
Speed (mm/s)
100 100 100 100
Repetition rate (KHz)
30 30 30 30
Power (W) 5.8 5.8 5.8 5.8
Repetitions 2 2 1 1 2 2 2 2 3 3 3 3 10 10 10 10
38
4.3.2 Deburring
A contact profiler (Veeco Dektak 3) was used to evaluate the flatness and burr
height of the patterned laminae after laser machining. The profiler was equipped with a
12.5 µm diamond tipped stylus with a capability of measuring a minimum z-dimension of
50 nm. Laser burrs, caused by deposition of laser ablation ejecta, were found and
measured at three different locations on each of the lamina and the average value was
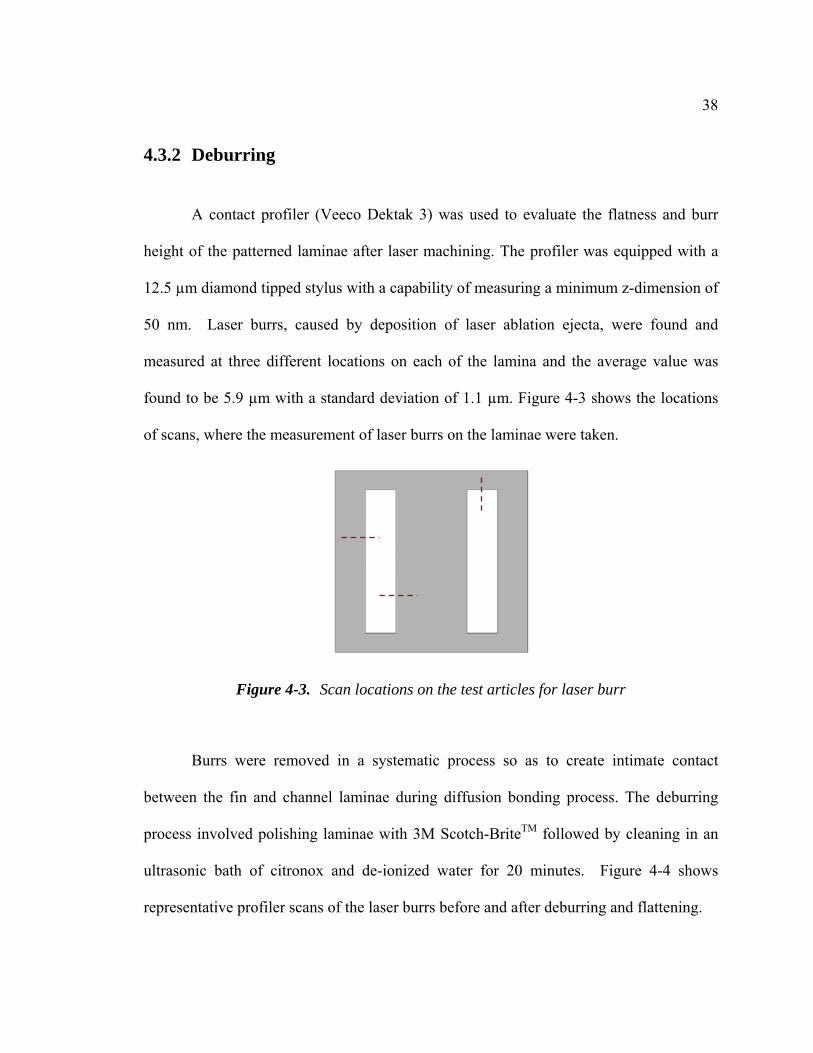
found to be 5.9 µm with a standard deviation of 1.1 µm. Figure 4-3 shows the locations
of scans, where the measurement of laser burrs on the laminae were taken.
Figure 4-3. Scan locations on the test articles for laser burr
Burrs were removed in a systematic process so as to create intimate contact
between the fin and channel laminae during diffusion bonding process. The deburring
process involved polishing laminae with 3M Scotch-BriteTM followed by cleaning in an
ultrasonic bath of citronox and de-ionized water for 20 minutes. Figure 4-4 shows
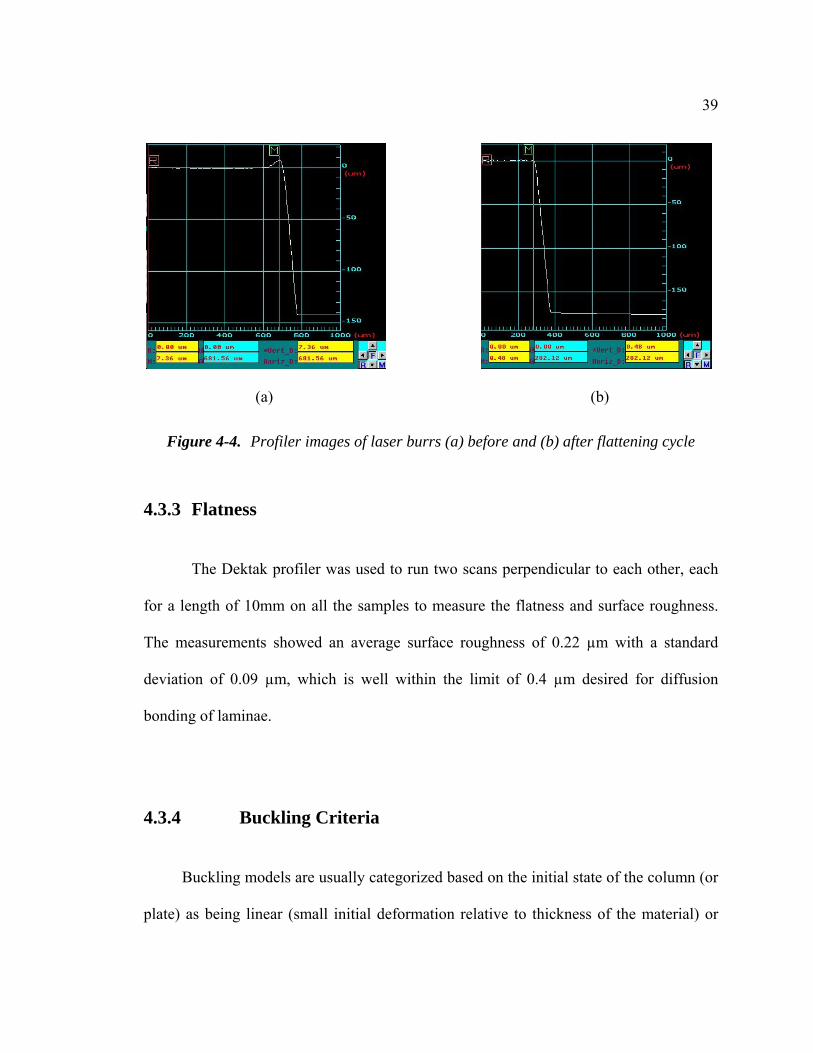
representative profiler scans of the laser burrs before and after deburring and flattening.
39
(a) (b)
Figure 4-4. Profiler images of laser burrs (a) before and (b) after flattening cycle
4.3.3 Flatness
The Dektak profiler was used to run two scans perpendicular to each other, each
for a length of 10mm on all the samples to measure the flatness and surface roughness.
The measurements showed an average surface roughness of 0.22 µm with a standard
deviation of 0.09 µm, which is well within the limit of 0.4 µm desired for diffusion
bonding of laminae.
4.3.4 Buckling Criteria
Buckling models are usually categorized based on the initial state of the column (or
plate) as being linear (small initial deformation relative to thickness of the material) or
40
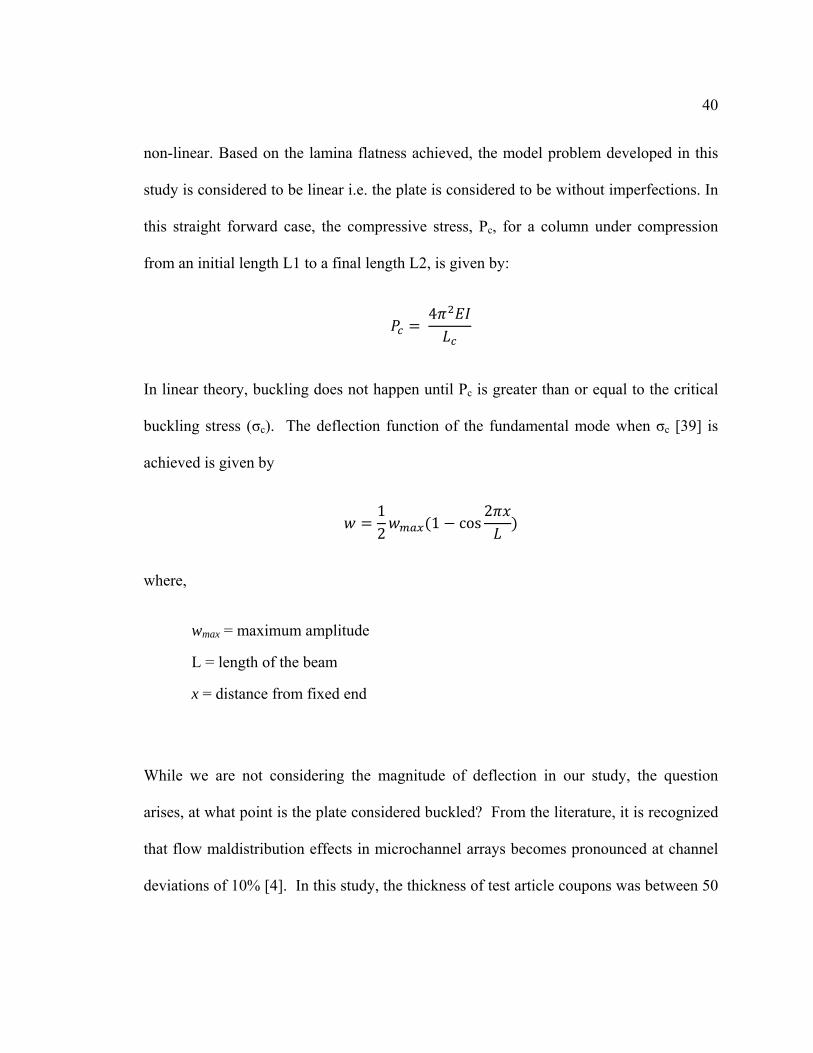
non-linear. Based on the lamina flatness achieved, the model problem developed in this
study is considered to be linear i.e. the plate is considered to be without imperfections. In
this straight forward case, the compressive stress, Pc, for a column under compression
from an initial length L1 to a final length L2, is given by:
4
In linear theory, buckling does not happen until Pc is greater than or equal to the critical
buckling stress (σc). The deflection function of the fundamental mode when σc [39] is
achieved is given by
1
21 cos
2
where,
wmax = maximum amplitude
L = length of the beam
x = distance from fixed end
While we are not considering the magnitude of deflection in our study, the question
arises, at what point is the plate considered buckled? From the literature, it is recognized
that flow maldistribution effects in microchannel arrays becomes pronounced at channel
deviations of 10% [4]. In this study, the thickness of test article coupons was between 50

41
and 200 µm. Therefore, deflections beyond 10% of the lamina thickness were considered
as buckling.
4.3.5 Flattening
In order to establish initial flatness of the laminae, the patterned and deburred
laminae were placed in-between graphite platens and run through a flattening cycle. This
cycle along with flattening the samples, also serves in relieving any residual stresses from
the cold rolling process. During the flattening cycle the laminae were raised to a
temperature of 500C and a pressure of 2.5 MPa (350 psi) was applied for 30 minutes.
The cycle was run in a vacuum hot press under 10-4 torr vacuum to prevent any oxidation
of the copper laminae. The flatness of the laminae was then measured by scanning the
laminae over a length of 20mm using Dektak profiler. The flatness across the laminae
was found to be approximately 3 µm with a standard deviation of 0.2 µm after flattening.
Note that this flatness is below the buckling threshold outlined above.
4.3.6 Bonding
Before bonding, all the laminae were stacked in a wafer holder and cleaned in the
ultrasonic cleaner with acetone, methanol and de-ionized water (AMD rinse) to remove
any grease and residues on the faying surfaces to have good bonding. After ultrasonic
42
cleaning, the laminae are dried in a vacuum oven for 20 minutes to remove any moisture
on the surfaces. The laminae are then aligned between the alumina platens using
alignment pins and then diffusion bonded.
4.4. Load Cell Validation
One of the important settings needed for this study was the magnitude of bonding
pressure applied on the stack during the diffusion bonding process. Diffusion bonding of
the laminae is usually performed in a vacuum hot press and the bonding force is applied
using the hydraulic rams present inside. Since a high pressure induces lateral stresses in
the stack due to Poisson’s effect [9], which may affect the understanding of warpages, the
hydraulic rams were calibrated using a load cell before the experiments were conducted.
A load cell with a calibration range of 0 – 5000 pounds manufactured by Omega was
used to calibrate the force applied by the hydraulic rams. The excitation of the load cell is
rated as 10V maximum, i.e., a force of 5000 pounds represent a voltage read out of 10V
and 0 pounds represent voltage readout of 0V. A linear relation has been established
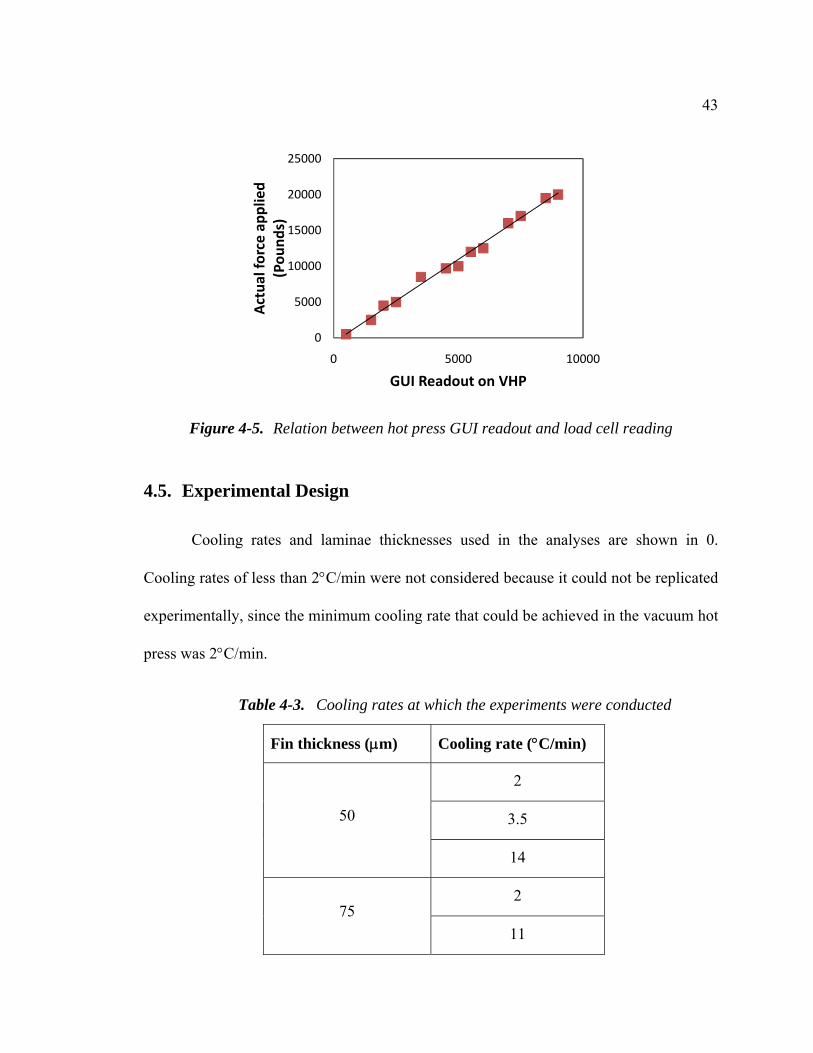
between the GUI read out of the vacuum hot press and the actual applied load. Figure 4-5
shows the relation between the GUI reading on the vacuum hot press and the actual load
applied.
43
Figure 4-5. Relation between hot press GUI readout and load cell reading
4.5. Experimental Design
Cooling rates and laminae thicknesses used in the analyses are shown in 0.
Cooling rates of less than 2C/min were not considered because it could not be replicated
experimentally, since the minimum cooling rate that could be achieved in the vacuum hot
press was 2C/min.
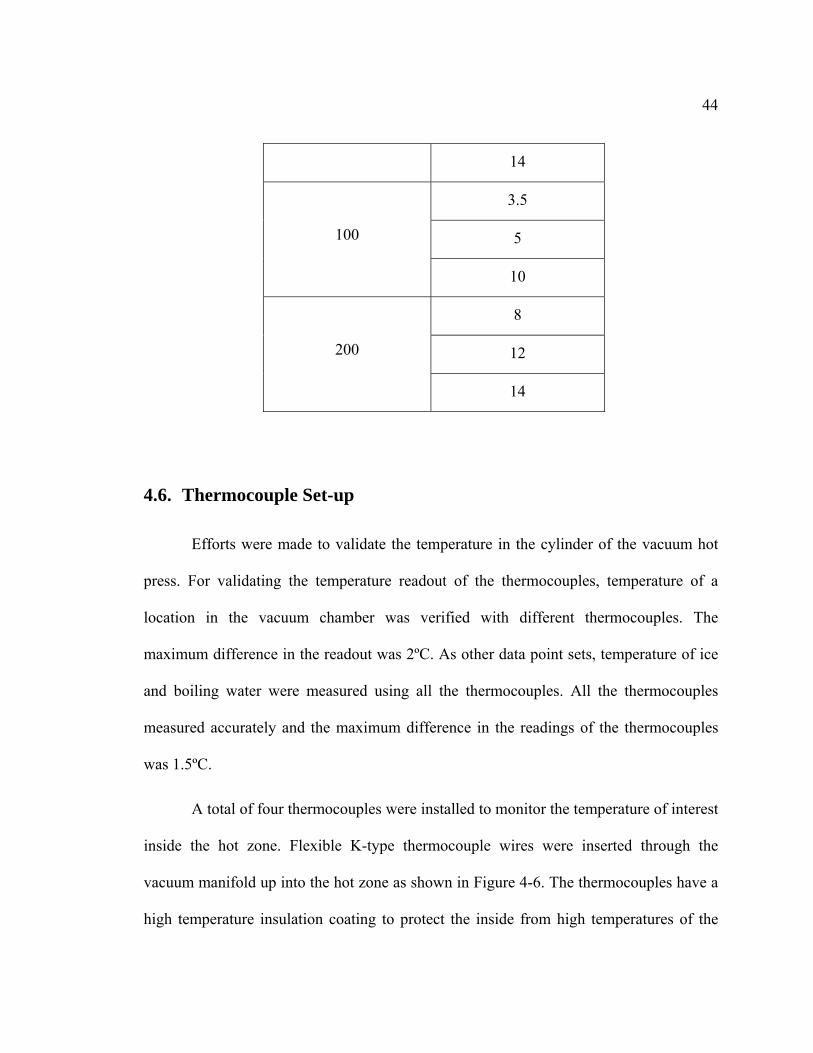
Table 4-3. Cooling rates at which the experiments were conducted
Fin thickness (m) Cooling rate (C/min)
50
2
3.5
14
75 2
11
0
5000
10000
15000
20000
25000
0 5000 10000
Actual force applied
(Pounds)
GUI Readout on VHP
44
14
100
3.5
5
10
200
8
12
14
4.6. Thermocouple Set-up
Efforts were made to validate the temperature in the cylinder of the vacuum hot
press. For validating the temperature readout of the thermocouples, temperature of a
location in the vacuum chamber was verified with different thermocouples. The
maximum difference in the readout was 2ºC. As other data point sets, temperature of ice
and boiling water were measured using all the thermocouples. All the thermocouples
measured accurately and the maximum difference in the readings of the thermocouples
was 1.5ºC.
A total of four thermocouples were installed to monitor the temperature of interest
inside the hot zone. Flexible K-type thermocouple wires were inserted through the
vacuum manifold up into the hot zone as shown in Figure 4-6. The thermocouples have a
high temperature insulation coating to protect the inside from high temperatures of the

45
vacuum hot press. The ends of the thermocouples are connected to thermocouple
elements that are in-turn connected to a thermal data logger. A 4-inlet temperature data
logger manufactured by Sper Scientific Ltd. (type 800024) was used to record the
thermocouple readings. The instrument has a working range of -200°C to 1370°C with a
resolution of 1°C or 1 second and an accuracy of ± 0.2% based on the reading. The
temperature conversion of the instrument follows National Bureau of Standards and
IEC584 temperature/voltage table for type K thermocouples. The data logger has an
internal storage capacity to store 16000 readings per inlet and can be connected to PC
over a RS232 interface and TestLink SE-309 software.
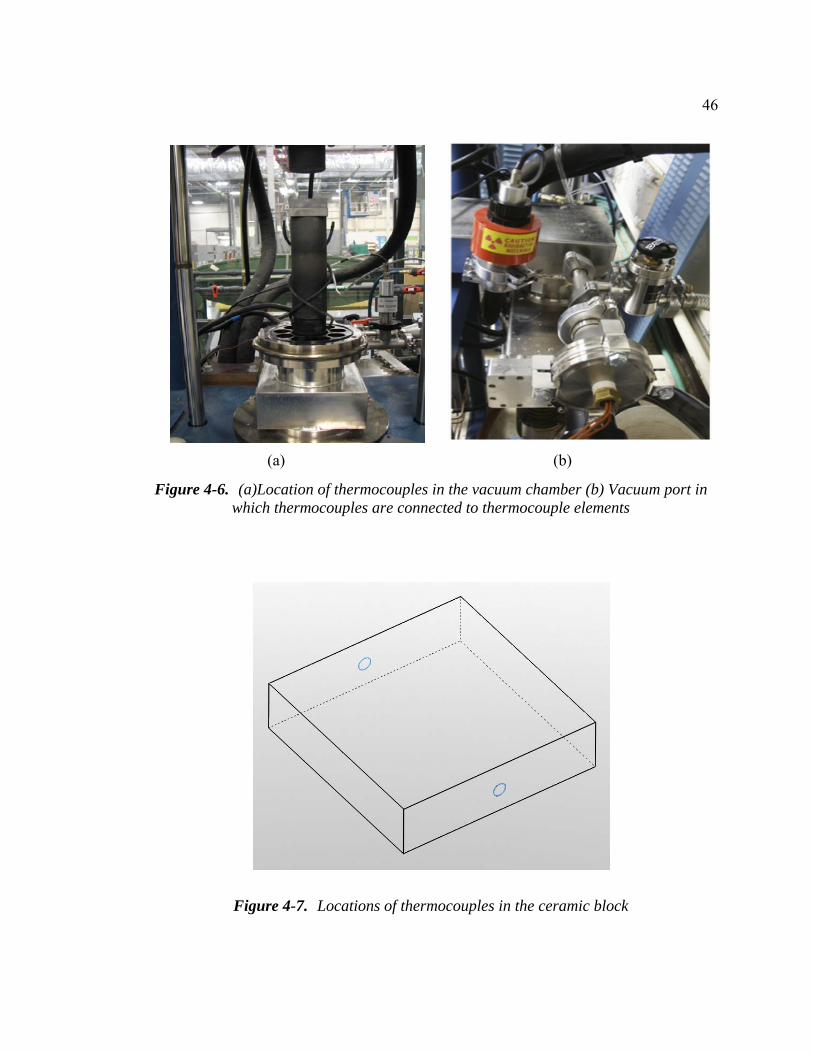
One of the thermocouples, placed on the surface of the stack, was used to send
feedback of the temperature to the eurotherm of the heating element circuit. Another
thermocouple was placed on the opposite surface of the stack to ensure uniform heating
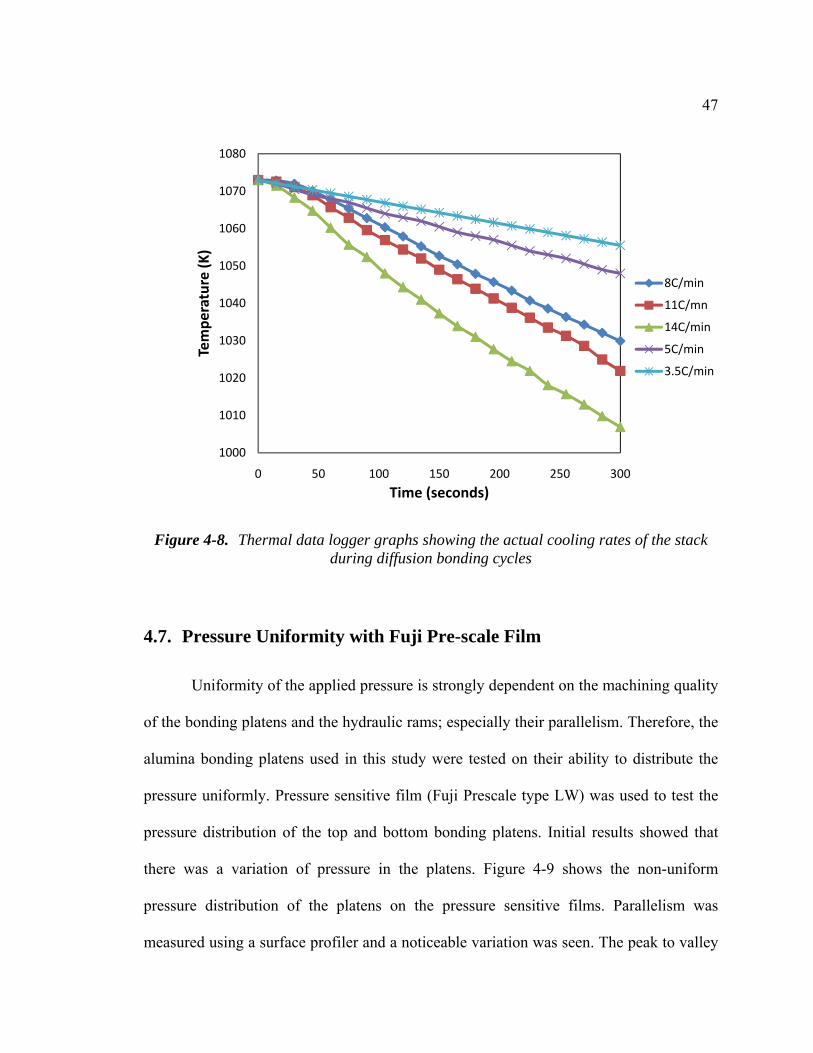
of the stack on all sides. Figure 4-7 shows the Solidworks model of a ceramic platen
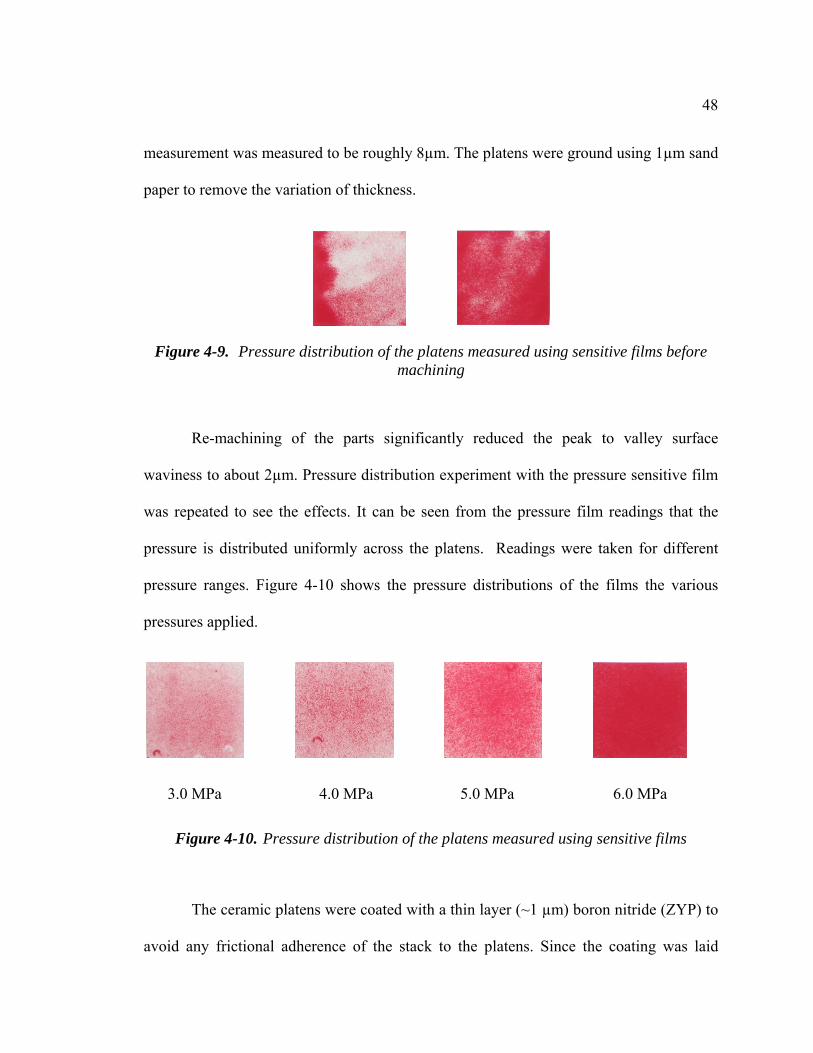
representing the locations of the thermocouples. Figure 4-8 shows actual thermal data
logger readings for various cooling rates used during experimentation.
46
(a) (b)
Figure 4-6. (a)Location of thermocouples in the vacuum chamber (b) Vacuum port in which thermocouples are connected to thermocouple elements
Figure 4-7. Locations of thermocouples in the ceramic block
47
Figure 4-8. Thermal data logger graphs showing the actual cooling rates of the stack during diffusion bonding cycles
4.7. Pressure Uniformity with Fuji Pre-scale Film
Uniformity of the applied pressure is strongly dependent on the machining quality
of the bonding platens and the hydraulic rams; especially their parallelism. Therefore, the
alumina bonding platens used in this study were tested on their ability to distribute the
pressure uniformly. Pressure sensitive film (Fuji Prescale type LW) was used to test the
pressure distribution of the top and bottom bonding platens. Initial results showed that
there was a variation of pressure in the platens. Figure 4-9 shows the non-uniform
pressure distribution of the platens on the pressure sensitive films. Parallelism was
measured using a surface profiler and a noticeable variation was seen. The peak to valley
1000
1010
1020
1030
1040
1050
1060
1070
1080
0 50 100 150 200 250 300
Temperature (K)
Time (seconds)
8C/min
11C/mn
14C/min
5C/min
3.5C/min
48
measurement was measured to be roughly 8µm. The platens were ground using 1µm sand
paper to remove the variation of thickness.
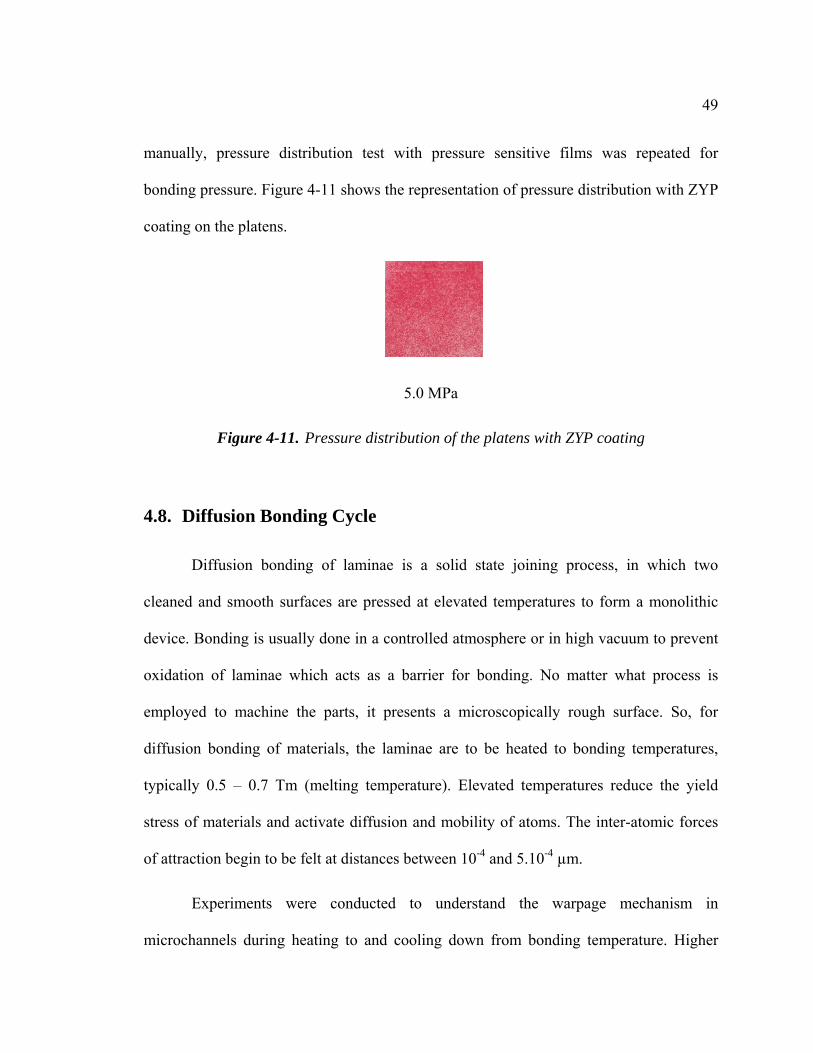
Figure 4-9. Pressure distribution of the platens measured using sensitive films before machining
Re-machining of the parts significantly reduced the peak to valley surface
waviness to about 2µm. Pressure distribution experiment with the pressure sensitive film
was repeated to see the effects. It can be seen from the pressure film readings that the
pressure is distributed uniformly across the platens. Readings were taken for different
pressure ranges. Figure 4-10 shows the pressure distributions of the films the various
pressures applied.
3.0 MPa 4.0 MPa 5.0 MPa 6.0 MPa
Figure 4-10. Pressure distribution of the platens measured using sensitive films
The ceramic platens were coated with a thin layer (~1 µm) boron nitride (ZYP) to
avoid any frictional adherence of the stack to the platens. Since the coating was laid
49
manually, pressure distribution test with pressure sensitive films was repeated for
bonding pressure. Figure 4-11 shows the representation of pressure distribution with ZYP
coating on the platens.
5.0 MPa
Figure 4-11. Pressure distribution of the platens with ZYP coating
4.8. Diffusion Bonding Cycle
Diffusion bonding of laminae is a solid state joining process, in which two
cleaned and smooth surfaces are pressed at elevated temperatures to form a monolithic
device. Bonding is usually done in a controlled atmosphere or in high vacuum to prevent
oxidation of laminae which acts as a barrier for bonding. No matter what process is
employed to machine the parts, it presents a microscopically rough surface. So, for
diffusion bonding of materials, the laminae are to be heated to bonding temperatures,
typically 0.5 – 0.7 Tm (melting temperature). Elevated temperatures reduce the yield
stress of materials and activate diffusion and mobility of atoms. The inter-atomic forces
of attraction begin to be felt at distances between 10-4 and 5.10-4 µm.
Experiments were conducted to understand the warpage mechanism in
microchannels during heating to and cooling down from bonding temperature. Higher
50
rates of heating / cooling induce thermal gradients in the body which induce thermal
strains which raise thermal stresses in the body. At elevated temperatures, since the yield
stress of the material is low, the laminae tend to deform at lower thermal stresses.
Experimental runs were designed by selecting different cooling rates and laminae
thicknesses. Four different thicknesses (50, 75, 100 and 200 µm) of copper shims were
chosen to conduct the experiments and to relate the thickness of lamina to cooling rate.
Cooling rates were decided for each thickness based on finite element analyses data.
After flattening and cleaning cycles, the patterned shims were stacked and aligned
using alignment pins. Each stack consisted of a fin layer bounded by two channel layers.
The assembled shim stack was placed in between two alumina platens of sizes 50.8 X
50.8 X 12.7 mm. These platens acted as insulators on the top and bottom of the shim
stack leaving only the sides as path for heat (input / output) due to radiation. The platens
were coated with a thin layer (~ 1 µm) of boron nitride (ZYP coating) to avoid any
adherence of shims to the alumina platens. Four thermocouples were placed: two at the
surfaces of alumina platen, one at a depth of quarter inch from the side of alumina platen
and one at a depth of half inch from the side of alumina for understanding the
temperature distribution across the chamber. Temperature data was logged for all the
thermocouples using a Sper temperature data logger with a time interval of 1 second
during the cooling cycles.
Bonding parameters for diffusion bonding the laminae were temperature = 800C;
heating rate = 20C /min; dwell time at bonding temperature = 90 minutes; bonding
pressure during dwell time = 7MPa. A high vacuum of 10-5 torr was maintained in the hot

51
press throughout the bonding cycle to avoid any oxidation of materials.
Each thickness of the fin layer was run at three different cooling rates to estimate
the cooling rate at which warpage appears. For each thickness of the lamina, one cooling
rate is chosen which does not warp the material, one which warps the material and one
that would raise just enough thermal stresses in the body to cause warpage. Estimation of
these cooling rates for the runs was based on the finite element analyses data. Cooling
rates with respect to thicknesses are mentioned in the Appendix.
52
CHAPTER 5
5. RESULTS AND DISCUSSION
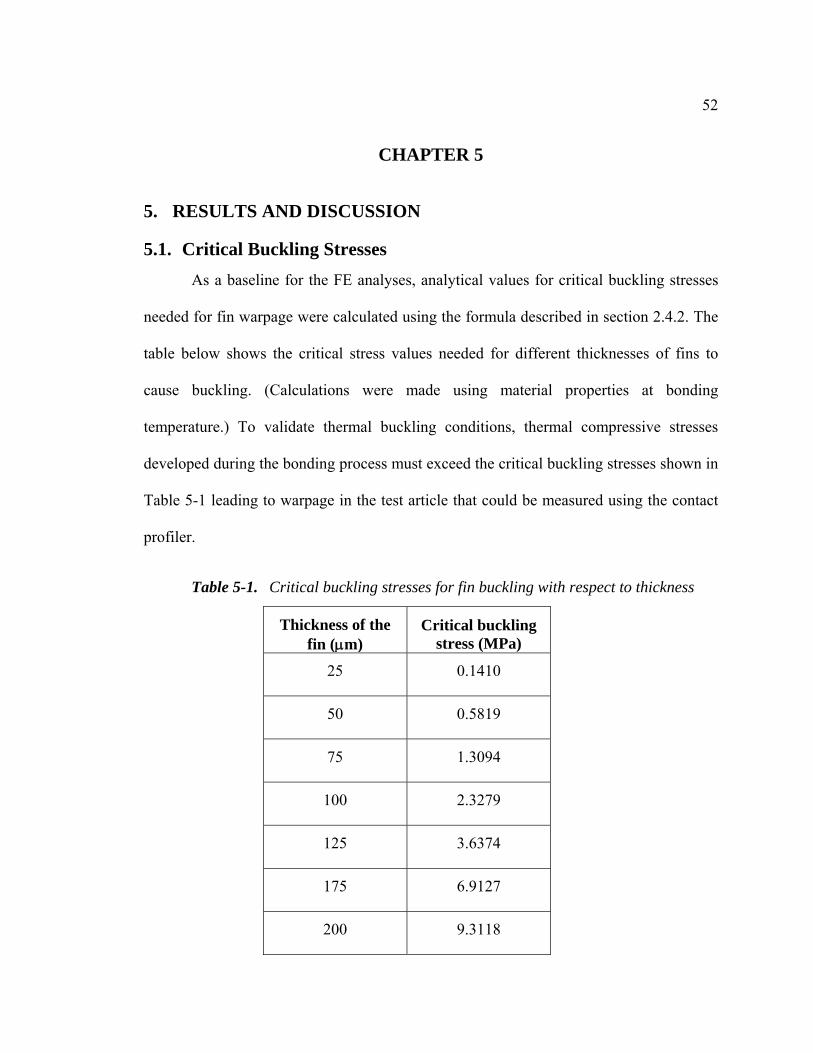
5.1. Critical Buckling Stresses
As a baseline for the FE analyses, analytical values for critical buckling stresses
needed for fin warpage were calculated using the formula described in section 2.4.2. The
table below shows the critical stress values needed for different thicknesses of fins to
cause buckling. (Calculations were made using material properties at bonding
temperature.) To validate thermal buckling conditions, thermal compressive stresses
developed during the bonding process must exceed the critical buckling stresses shown in
Table 5-1 leading to warpage in the test article that could be measured using the contact
profiler.
Table 5-1. Critical buckling stresses for fin buckling with respect to thickness
Thickness of the fin (m)
Critical buckling stress (MPa)
25 0.1410
50 0.5819
75 1.3094
100 2.3279
125 3.6374
175 6.9127
200 9.3118
53
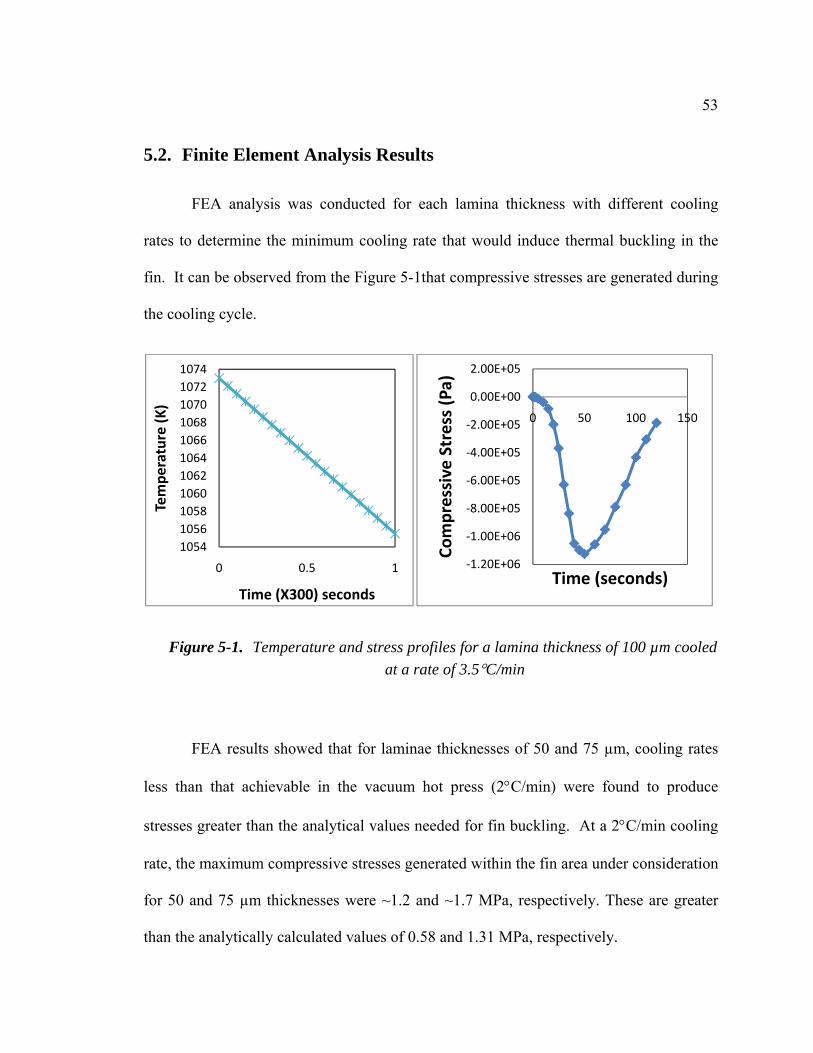
5.2. Finite Element Analysis Results
FEA analysis was conducted for each lamina thickness with different cooling
rates to determine the minimum cooling rate that would induce thermal buckling in the
fin. It can be observed from the Figure 5-1that compressive stresses are generated during
the cooling cycle.
Figure 5-1. Temperature and stress profiles for a lamina thickness of 100 µm cooled
at a rate of 3.5C/min
FEA results showed that for laminae thicknesses of 50 and 75 µm, cooling rates
less than that achievable in the vacuum hot press (2C/min) were found to produce
stresses greater than the analytical values needed for fin buckling. At a 2C/min cooling
rate, the maximum compressive stresses generated within the fin area under consideration
for 50 and 75 µm thicknesses were ~1.2 and ~1.7 MPa, respectively. These are greater
than the analytically calculated values of 0.58 and 1.31 MPa, respectively.
1054
1056
1058
1060
1062
1064
1066
1068
1070
1072
1074
0 0.5 1
Temperature (K)
Time (X300) seconds
‐1.20E+06
‐1.00E+06
‐8.00E+05
‐6.00E+05
‐4.00E+05
‐2.00E+05
0.00E+00
2.00E+05
0 50 100 150
Compressive Stress (Pa)
Time (seconds)
54
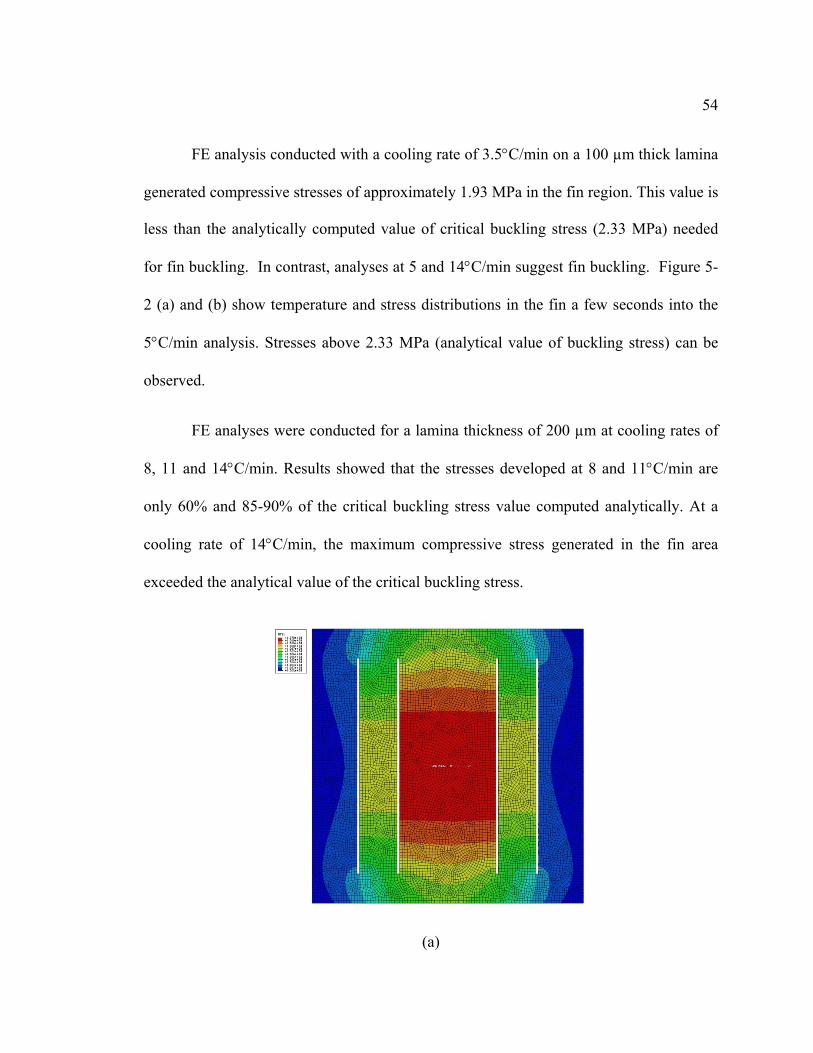
FE analysis conducted with a cooling rate of 3.5C/min on a 100 µm thick lamina
generated compressive stresses of approximately 1.93 MPa in the fin region. This value is
less than the analytically computed value of critical buckling stress (2.33 MPa) needed
for fin buckling. In contrast, analyses at 5 and 14C/min suggest fin buckling. Figure 5-
2 (a) and (b) show temperature and stress distributions in the fin a few seconds into the
5C/min analysis. Stresses above 2.33 MPa (analytical value of buckling stress) can be
observed.
FE analyses were conducted for a lamina thickness of 200 µm at cooling rates of
8, 11 and 14C/min. Results showed that the stresses developed at 8 and 11C/min are
only 60% and 85-90% of the critical buckling stress value computed analytically. At a
cooling rate of 14C/min, the maximum compressive stress generated in the fin area
exceeded the analytical value of the critical buckling stress.
(a)
55
(b)
Figure 5-2. (a) Temperature distribution and (b) stress distribution in 100µm shim,
run at a cooling rate of 5C/min
5.3. Experimental Results
Based on the FEA results, experiments were conducted for all the laminae
thicknesses and cooling rates mentioned in Table 4-3. Figure 5-3 represents the
experimental data (cooling rate vs. lamina thickness) collected in this study. Each fin
thickness was diffusion bonded at three different cooling rates. Cooling rates were
chosen based on finite element results suggesting where thermal buckling should happen
for a particular lamina thickness. In order to measure the fin buckling, profiler scans were
made across the fin length at three different locations on each fin. The solid dots
represent experimental runs in which the fins were found to be buckled using the

56
established buckling criteria and hollow dots represent the runs in which the fins were not
buckled.
Figure 5-3. Experimental runs showing buckled and non-buckled lamina thickness with respect to cooling rate
Figure 5-4 represents a comparison of the FEA predicted stress values for fin
buckling and the experimental results. FEA results are plotted in blue and overlaid on the
previous experimental results. FEA results were established by running simulations with
different cooling rates. For a given lamina thickness, a point was plotted when the
maximum thermal stress at a particular cooling rate was found to be within ±10% of the
critical buckling stress for that lamina thickness. Therefore, the curve in the figure is the
approximate loci of FEA predicted cooling rates with respect to lamina thickness for the
onset of buckling. The form of this equation is consistent with the fact that the critical
buckling stress varies with the square of the lamina thickness
0
2
4
6
8
10
12
14
16
0 50 100 150 200 250
Coolin
g rate (ºC/m
in)
Lamina thickness (µm)
50 µm
75 µm
100 µm
57
Figure 5-4. Comparison of FEA predicted cooling rates where thermal stresses equal to critical buckling stress
5.4. Discussion
The area above the curve (labeled as “Buckling”) in Figure 5-4 represents the
cooling rates with respect to lamina thicknesses where buckling of fin occur during
diffusion bonding. It can be seen from the figure that the experimental results are in
general agreement with the FEA analyses. This can be observed in particular for laminae
of 100 and 200 µm thicknesses cooled at 3.5 and 8ºC/min, respectively, where no
buckling was predicted or found.
0
2
4
6
8
10
12
14
16
0 50 100 150 200 250
Coolin
g rate (ºC/m
in)
Lamina thickness (µm)
50 µm
75 µm
100 µm
200 µm
Theoretical Model
Buckling
Non‐Buckling
58
For a lamina thickness of 50 µm, an average z-deflection of approximately 100
m was observed which is well beyond the buckling criteria. For a lamina thickness of 75
m, the z-deflection was observed to be approximately 100 m when the stack was
cooled at the rate of 2C/min and 125m when cooled at the rate of 3.5C/min. It can
thus be concluded that for cooling rates of 2ºC/min and above, buckling occurs in 50 and
75 µm thick microchannel laminae due to compressive thermal stresses.
In the case of 100 m lamina thickness, the stack diffusion bonded at the cooling
rate of 3.5C/min, the fin area under consideration had minimal or no deflection. Profiler
scans across the fin length showed a maximum z-deflection of approximately 5 µm which
is below the buckling threshold of 10%. These results agree with the FEA results above,
suggesting that the thermal stresses at this cooling rate did not exceed the analytically
computed critical stress value. Figure 5-5 shows the profiler scan for 15mm of the fin
length.
Figure 5-5. Profiler scan over a length of 15mm on the fin of thickness 100µm
cooled at a rate of 3.5C/min
59
For the 100 m thick laminae stack diffusion bonded at the cooling rate of 5C/min, the
maximum z-deflection in the fin region was observed to be approximately 100 m,
qualifying it as fin buckling. This is in agreement with FEA results above. Figure 5-6
shows the profiler scan across the fin length. It is interesting to note that the deflection
was a sinusoidal wave-like curve suggesting multi-mode deflection. This could mean
that the amount of deflection was so great that it interfered with the bonding platens
leading to the multi-mode deflection pattern.
Figure 5-6. Profiler scan over a length of 15mm on the fin of thickness 100µm
cooled at a rate of 5C/min
For a fin thickness of 200 µm, diffusion bonding cycles were run at cooling rates
of 8, 12 and 14C/min. The maximum z-deflection in the fin region for the stack run at
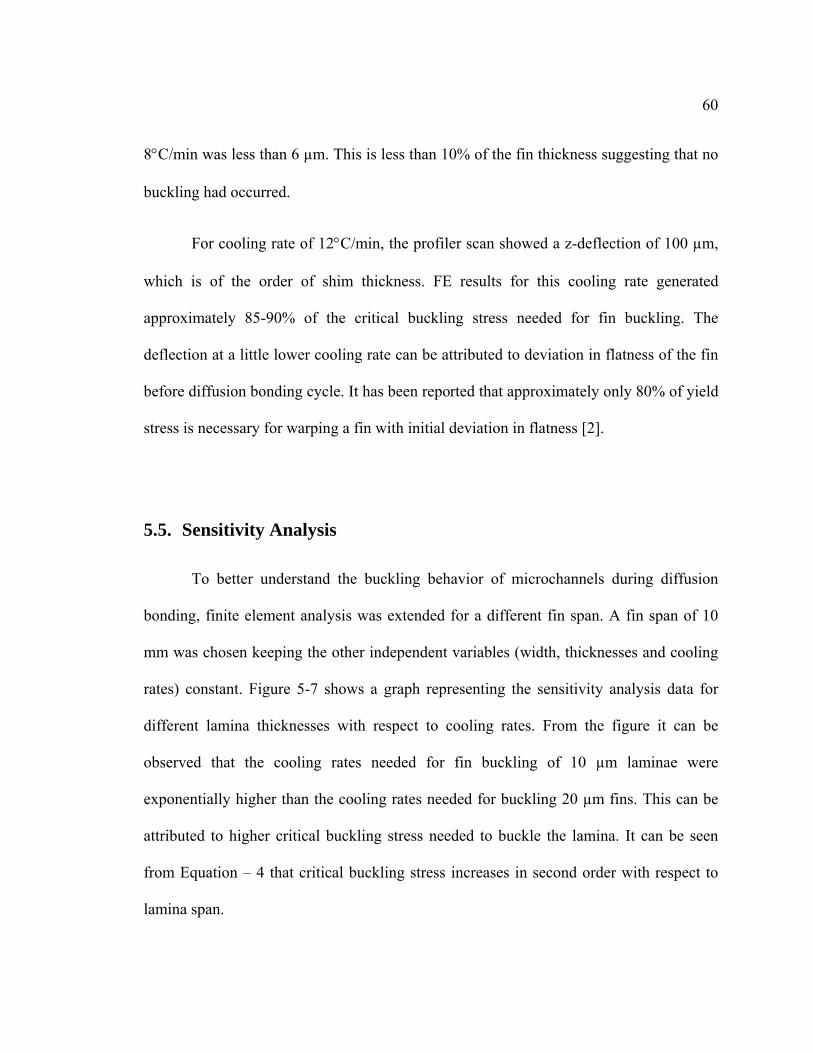
60
8C/min was less than 6 µm. This is less than 10% of the fin thickness suggesting that no
buckling had occurred.
For cooling rate of 12C/min, the profiler scan showed a z-deflection of 100 µm,
which is of the order of shim thickness. FE results for this cooling rate generated
approximately 85-90% of the critical buckling stress needed for fin buckling. The
deflection at a little lower cooling rate can be attributed to deviation in flatness of the fin
before diffusion bonding cycle. It has been reported that approximately only 80% of yield
stress is necessary for warping a fin with initial deviation in flatness [2].
5.5. Sensitivity Analysis
To better understand the buckling behavior of microchannels during diffusion
bonding, finite element analysis was extended for a different fin span. A fin span of 10
mm was chosen keeping the other independent variables (width, thicknesses and cooling
rates) constant. Figure 5-7 shows a graph representing the sensitivity analysis data for
different lamina thicknesses with respect to cooling rates. From the figure it can be
observed that the cooling rates needed for fin buckling of 10 µm laminae were
exponentially higher than the cooling rates needed for buckling 20 µm fins. This can be
attributed to higher critical buckling stress needed to buckle the lamina. It can be seen
from Equation – 4 that critical buckling stress increases in second order with respect to
lamina span.
61
Figure 5-7. Cooling rates comparison for different fin spans
0
2
4
6
8
10
12
14
16
0 50 100 150 200 250
Co
olin
g r
ate
(ºC
/min
)
Lamina thickness (µm)
20mm span
10mm span
62
CHAPTER 6
6. CONCLUSIONS
A finite element model was developed to predict thermal stresses within
microchannel fins as a function of the cooling cycle in a vacuum hot press. The model
was used to predict the conditions for thermal buckling of unsupported microchannel
fins. Finite element and analytical calculations were found to be in good agreement with
experimental results suggesting that thermal buckling of microchannel laminae is
possible during the diffusion bonding of microchannel arrays.
Finite element analyses were conducted for different laminae thicknesses and
cooling rates to understand the warpage mechanism. It was observed that fin buckling
during diffusion bonding was sensitive to the magnitude of the cooling rate and lamina
thickness. A relation has been established between the laminae thicknesses and cooling
rates. As fin span decreases and fin thickness increases, the allowable cooling rates
increase exponentially.
Most MPT devices are presently diffusion bonded at low cooling rates to reduce
the effects of thermal stresses. Limits on cooling rates during diffusion bonding of MPT
devices investigated in this thesis suggest that with thicker laminae and shorter fin spans,
the rate of cooling can be increased leading to significantly reduced cycle times. This
would reduce production costs and opens the possibility of applying MPT to more
applications.
63
Implications of the current study are currently limited to copper. However, it is
expected that similar findings are likely within a wide variety of microlaminated
materials. The present study can be taken as a baseline and should be extended to find
cooling rate limitations for the diffusion bonding of MPT devices made from different
materials.
64
REFERENCES
[1] A. A. Abduluyahed and K. J. Kurzydłowski “Tensile Properties of a type 316 stainless steel strained in air and vacuum.” Journal of Materials Science and Engineering, Vol. A256, pp. 34-38, 1998
[2] A. A. Rizk, S. F. Radwan, “Fracture of a Plate under Transient Thermal Stresses”, Journal of Thermal Stress, v16, pp. 79-102, 1993
[3] A. Y. Tonkovich, S. Fitzgerald, J. L. Zilka, M. J. LaMont, Y. Wang, D. P. Vanderwiel and R. S. Wegeng, “ Microchannel Chemical Reactors for Fuel Processing Applications. II. Compact Fuel Vaporization”, Proceedings 3rd International conference on Microreaction Technology, 1999, pp. 364-371
[4] B. K. Paul, “Micro energy and chemical systems and multi-scale fabrication”, in Micromanufacturing and Nanotechnology, 1st ed., N. P. Mahalik, Ed. Berlin, Germany: Springer-Verlag, pp.323-352, 2006
[5] B. K. Paul and R.B. Peterson “Microlamination for Microtechnology-based Energy, Chemical, and Biological Systems”, ASME International Mechanical Engineering Congress and Exposition, Nashville, Tennessee, AES Vol. 39, pp. 45-52, 1999
[6] B. K. Paul, P. Kwon, and R. Subramanian “Understanding limits on fin aspect ratios in counter-flow microchannel arrays produced by diffusion bonding”, Journal of Manufacturing Science and Engineering, Vol. 128(4), pp. 977-983
[7] B.K. Paul, S. Bose, D. Palo, An internal convective heating technique for diffusion bonding arrayed microchannel architectures, Precision Engineering, Available online 22 January 2010, ISSN 0141-6359, DOI: 10.1016/j.precisioneng.2010.01.005.
[8] British Stainless Steel Association (BSSA) database, http://www.bssa.org.uk/topics.php?article=139
65
[9] C. H. Tseng, B. K. Paul, “Sources of Flow Maldistribution in Microreactor-Assisted Synthesis of Ceria Nanoparticles”, Ph.D. Dissertation, Oregon State University, 2008
[10] C. Pluess, “Application of Controlled Thermal Expansion in Diffusion Bonding for the High-Volume Microlamination of MECS Devices”, M.S. Thesis, Oregon State University, 2004
[11] C. Pluess and B.K. Paul, “Application of controlled Thermal Expansion in Microlamination for the Economical Production of Bulk Microchannel Systems,” Chemical Engineering Communications, 194(9), pp. 1259-1270, 2007
[12] D. N. Travessa, M. Ferrante, and G. Ouden “Finite element method simulation of residual stresses in Al2O3 – AISI 304 steel joints.” Journal of Materials Science and Engineering, Vol. 16, Number 6, pp. 687-691, 2001
[13] D. W. Matson, P. M. Martin, W. D. Bennett, D. C. Stewart and J. W. Johnson, “Laser Machined Microchannel Solvent Separator”, Proceedings SPIE, v3223, pp253-259, 1997
[14] D. W. Matson, P.M. Martin, A. Y. Tonkovich and G. L. Roberts, “Fabrication of a Stainless Steel Microcombustor Using a Lamination Process”, Proceedings SPIE, v3514, pp386-392, 1998
[15] E. A. Thornton, M. F. Coyle and R. N. McLeod, “Experimental study of plate buckling induced by spatial temperature gradients”, Journal of Thermal Stresses, Vol. 17, n 2, pp. 191-210, 1994
[16] G. K. Lingam and B. K. Paul, “Modeling of Microchannel Buckling due to Thermal Stresses during Diffusion Bonding”, Thirty-Eighth Annual North American Manufacturing Research Conference (NAMRC), 2010
[17] G. Kovacs, “Micromachined Transducers Sourcebook”, McGraw-Hill, New York, 1998
[18] G. Y. Zhou, S. T. Tu, “Viscoelastic analysis of rectangular passage of microchanneled plates subjected to internal pressure,” International Journal of Solids and Structures, Vol. 44, n. 21, pp. 6791-6804, 2007
66
[19] H. Loewe and W. Ehrfeld “State-of-the-Art in Microreaction Technology:
Concepts, Manufacturing and Applications”, Electrochimica Acta, Vol. 44, pp. 3679-3689, 1998
[20] J. Feng, D.Wang, H. Liu and Z. Li “Finite element simulation of thermal stresses during diffusion bonding of Al2O3 ceramic to Aluminum.” Science and Technology of Welding and Joining, Vol. 8, Number 2, pp. 138-142, 2003
[21] J. R. Davis, Metals Handbook, Materials Park, Ohio: ASM International, 1998
[22] J. X. Zhang, R.S. Chandel, Y.Z. Chen, and H.P. Seow “Effect of residual stress on the strength of an alumina-steel joint by partial transient liquid phase (PTLP) brazing.” Journal of Materials Processing Technology, pp. 220-225, 2000
[23] K. Schubert, J. Brandner, M. Fichtner, G. Linder, U. Schygulla and A. Wenka, “Microstructure devices for applications in thermal and chemical process engineering,” Microscale Thermophysical Engineering, v 5, n 1, pp. 17-39, 2001
[24] M. Koch, A. Evans, and A. Brunnschweiler, “Microfluidic Technology and Applications”, Research Studies Press Ltd., Hertfordshire, England, 2000
[25] M. L. Gossard, P. Seide, W. M. Roberts, “Thermal buckling of plates,” NACA Technical Note 2771, Document ID# 19930083554, pp. 1-40, 1952
[26] N. A. Alfutov, translated by E. Evseev, V. B. Balmont, Stability of Elastic Structures, Berlin; New York: Springer, 2000
[27] P. M. Martin, D. W. Matson, W. D. Bennett, D. C. Steward, Y. Lin, Laser Micromachined and Laminated Microfluidic Components for Miniaturized Thermal, Chemical and Biological Systems“, Proceedings of SPIE, v. 3680, p. 826-833, 1999
[28] P. M. Martin, W. D. Bennett and J. W. Johnson, “Microchannel Heat Exchangers for Advanced Climate Control”, Proceedings, SPIE, v2639, pp82-88, 1996
[29] R. L. Templin et al., Properties of Metals in Materials Engineering, Cleveland, 1948
67
[30] R. M. Jones, “Plastic Thermal Buckling of Uniformly Heated Plates with
Temperature-Dependent Material Properties, AIAA 2004-1709
[31] R. M. Jones, “Plastic Thermal Buckling of Uniformly Heated Bars with Temperature-Dependent Material Properties, AIAA 2005-1935
[32] S. Bose, B. K. Paul, “An Internal Convective Heating Technique for Diffusion Bonding Highly Parallel Microchannel Architectures”, M.S. Thesis, Oregon State University, 2008
[33] S. Bose, D. R. Palo and B. K. Paul “Leakage Rates in Thermal Requirements for the Diffusion Bonding of Microchannel Arrays via Internal Convective Heating”, 2nd International Conference on Micromanufacturing, 2007
[34] S. K. Tiwari and B.K. Paul “Application of Nickel Nanoparticles in Diffusion Bonding of Stainless Steel Surfaces”, ASME International Conference on Manufacturing Science and Engineering (MSEC), 2008
[35] T. R. Tauchert, “Thermally induced flexure, buckling, and vibration of plates”, Applied Mechanics Reviews, Vol. 44, n 8, pp. 347, 1991
[36] U. S. Patent No. 5,611,214, “Microcomponent sheet architecture” R. S. Wegeng, K. M. Drost, C. E. McDonald, 1997
[37] U. S. Patent No. 5,811,062, “Microchannel chemical process sheet architecture” R. S. Wegeng, K. M. Drost, C. J. Call, J. G. Brimingham, C. E. McDonald, D. E. Kurath, M. Fredrich, 1998
[38] W. Ehrfeld, V. Hessel, H. Lowe, Chapter 2, “Modern Microfabrication Techniques for Microreactors”, New Technology for Modern Chemistry, Wiley-VCH, New York, pp. 30-33, 2000
[39] W. Fang and J. A. Wickert, “Post buckling of micromachined beams”, Journal of Micromechanics and Microengineering, Vol. 4, pp. 116-122, 1994
68
[40] W. Wattanutchariya and B.K. Paul “Bonding fixture tolerances for high-volume metal microlamination based on fin buckling and laminae misalignment behavior.” Journal of Precision Engineering, Vol. 28, pp. 117-128, 2004
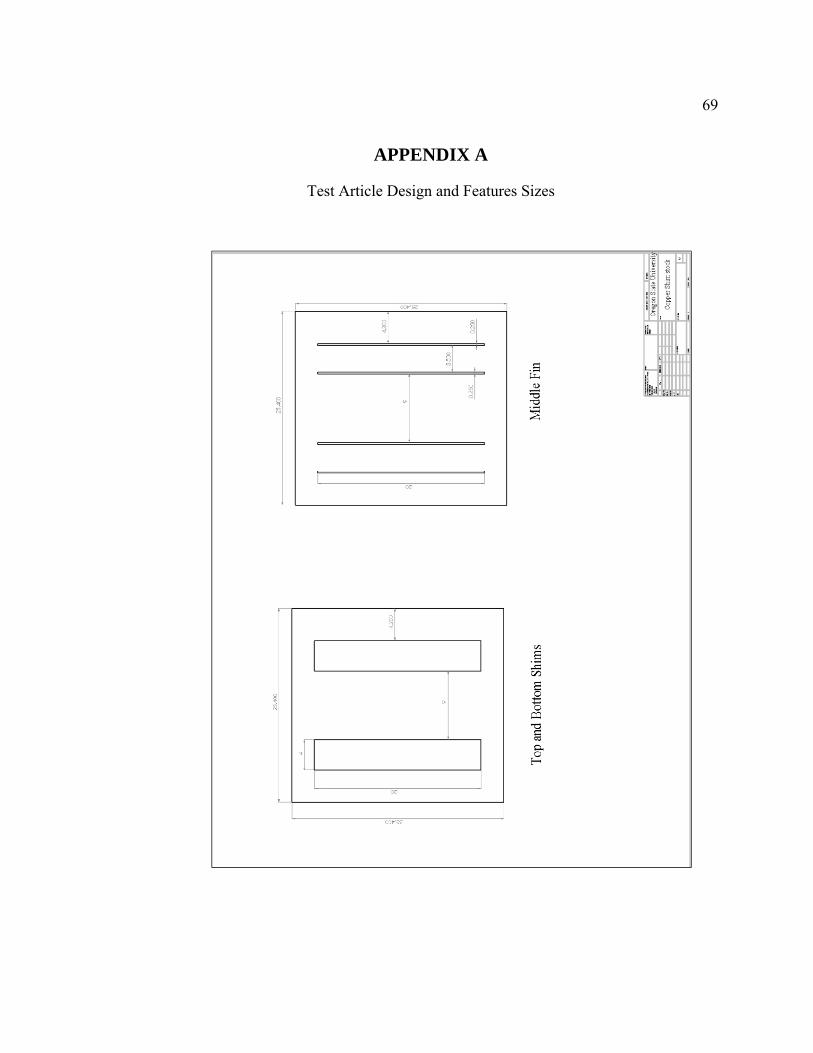
69
APPENDIX A
Test Article Design and Features Sizes
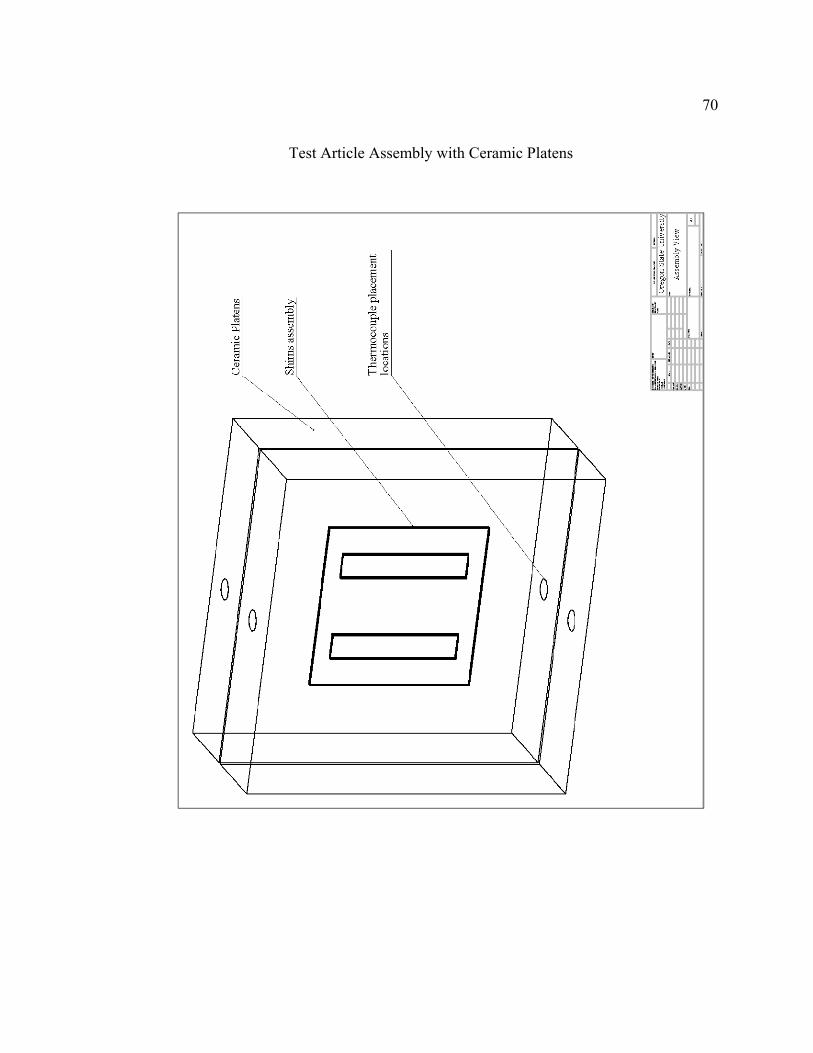
70
Test Article Assembly with Ceramic Platens
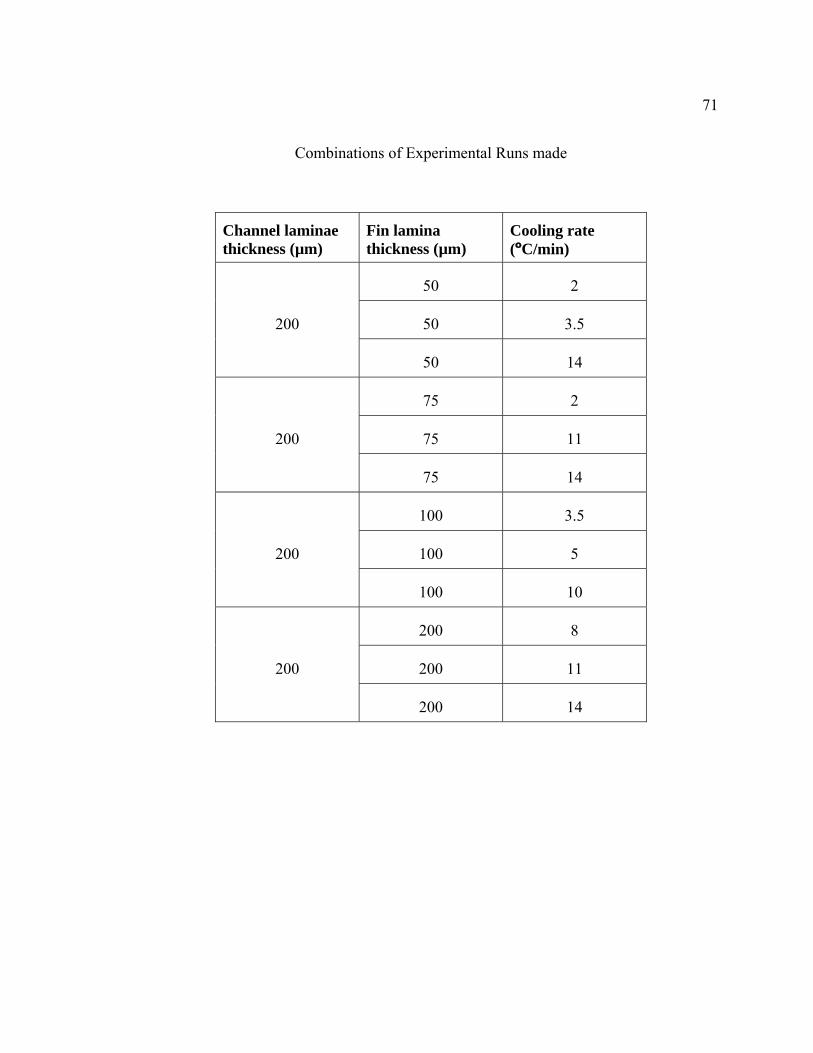
71
Combinations of Experimental Runs made
Channel laminae thickness (µm)
Fin lamina thickness (µm)
Cooling rate (ºC/min)
200
50 2
50 3.5
50 14
200
75 2
75 11
75 14
200
100 3.5
100 5
100 10
200
200 8
200 11
200 14
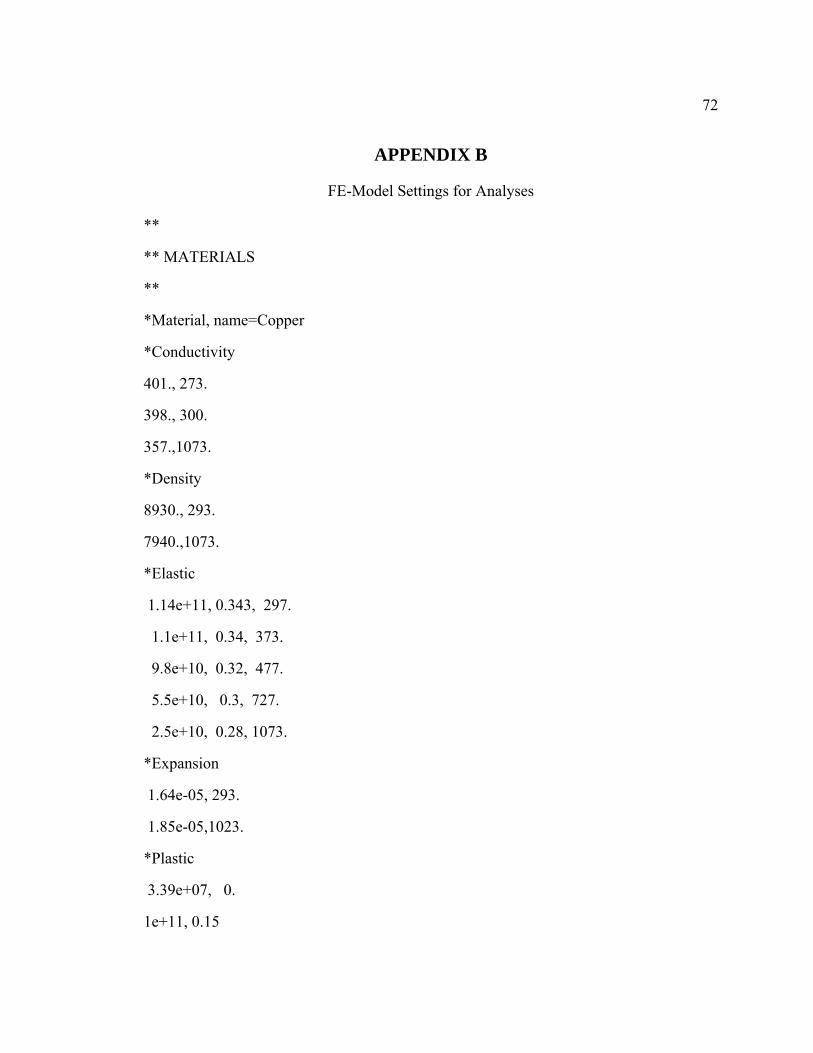
72
APPENDIX B
FE-Model Settings for Analyses
**
** MATERIALS
**
*Material, name=Copper
*Conductivity
401., 273.
398., 300.
357.,1073.
*Density
8930., 293.
7940.,1073.
*Elastic
1.14e+11, 0.343, 297.
1.1e+11, 0.34, 373.
9.8e+10, 0.32, 477.
5.5e+10, 0.3, 727.
2.5e+10, 0.28, 1073.
*Expansion
1.64e-05, 293.
1.85e-05,1023.
*Plastic
3.39e+07, 0.
1e+11, 0.15

73
*Specific Heat
385.,
**
** PHYSICAL CONSTANTS
**
*Physical Constants, absolute zero=-273., stefan boltzmann=5.68e-08
**
** PREDEFINED FIELDS
**
** Name: Predefined Field-1 Type: Temperature
*Initial Conditions, type=TEMPERATURE
_PickedSet9, 1073.
** ----------------------------------------------------------------
**
** STEP: Step-1
**
*Step, name=Step-1, extrapolation=PARABOLIC, inc=200
*Static
0.01, 300., 0.003, 20.
**
** BOUNDARY CONDITIONS
**
** Name: BC-1 Type: Displacement/Rotation
*Boundary
_PickedSet8, 3, 3
**
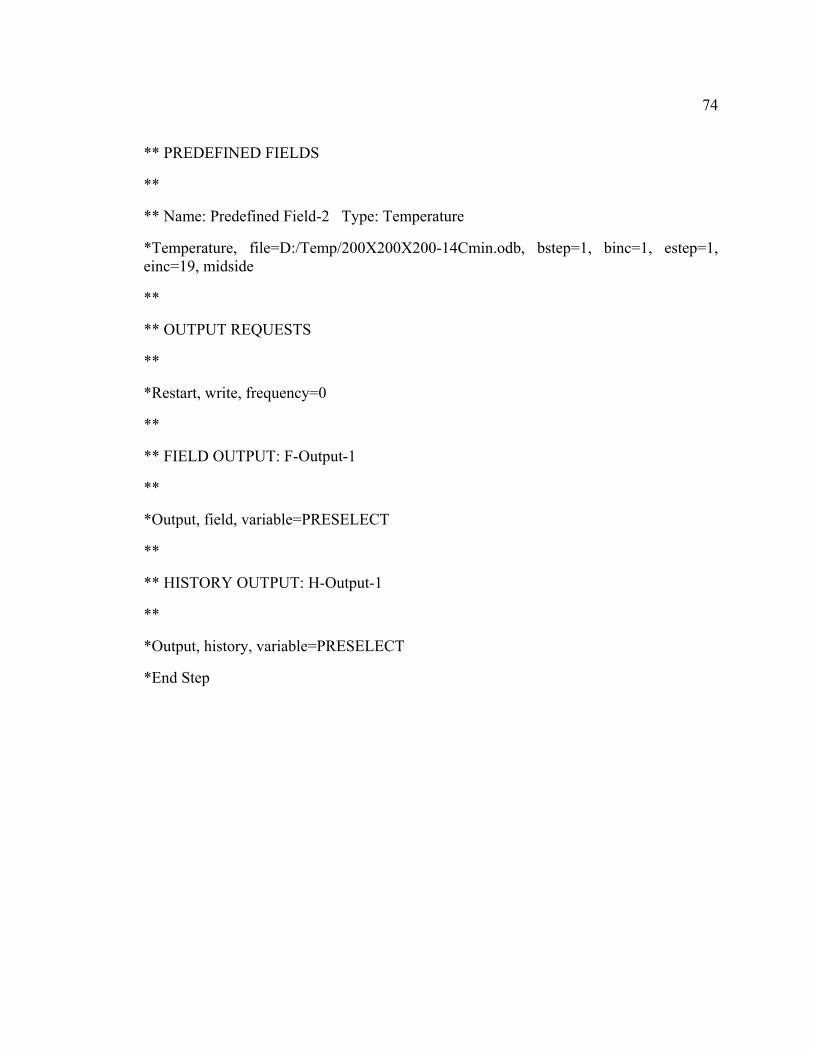
74
** PREDEFINED FIELDS
**
** Name: Predefined Field-2 Type: Temperature
*Temperature, file=D:/Temp/200X200X200-14Cmin.odb, bstep=1, binc=1, estep=1, einc=19, midside
**
** OUTPUT REQUESTS
**
*Restart, write, frequency=0
**
** FIELD OUTPUT: F-Output-1
**
*Output, field, variable=PRESELECT
**
** HISTORY OUTPUT: H-Output-1
**
*Output, history, variable=PRESELECT
*End Step
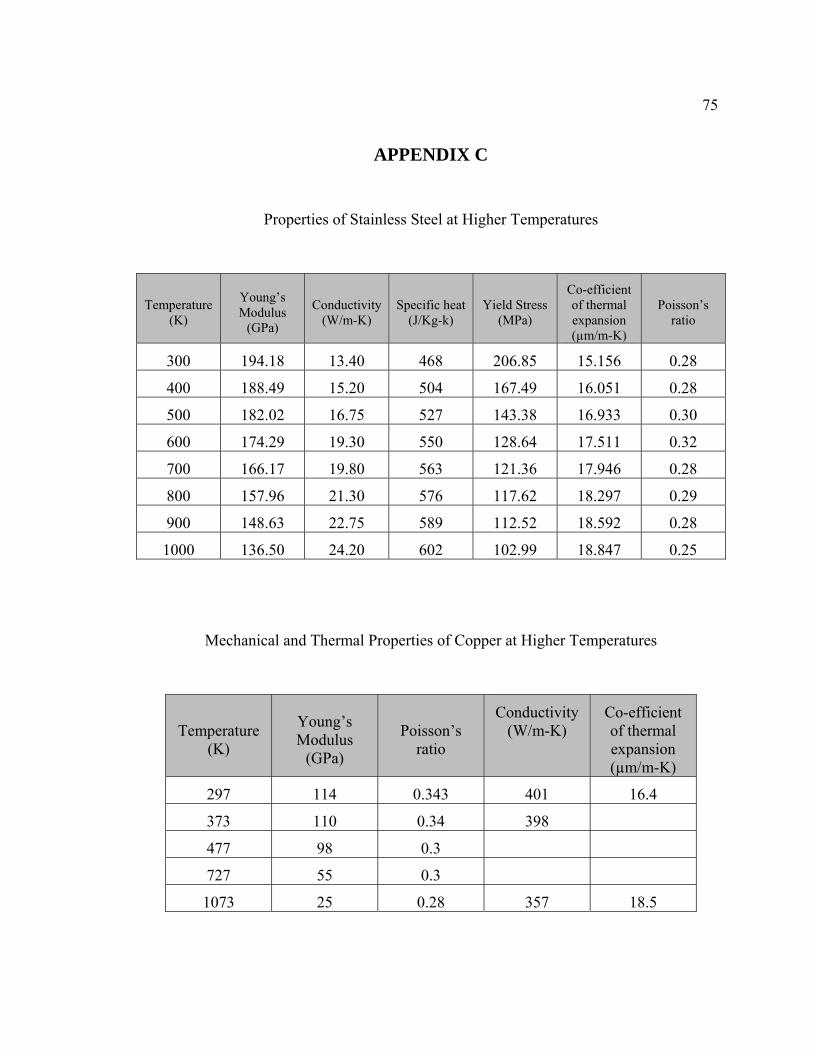
75
APPENDIX C
Properties of Stainless Steel at Higher Temperatures
Temperature (K)
Young’s Modulus
(GPa)
Conductivity (W/m-K)
Specific heat (J/Kg-k)
Yield Stress (MPa)
Co-efficient of thermal expansion (µm/m-K)
Poisson’s ratio
300 194.18 13.40 468 206.85 15.156 0.28
400 188.49 15.20 504 167.49 16.051 0.28
500 182.02 16.75 527 143.38 16.933 0.30
600 174.29 19.30 550 128.64 17.511 0.32
700 166.17 19.80 563 121.36 17.946 0.28
800 157.96 21.30 576 117.62 18.297 0.29
900 148.63 22.75 589 112.52 18.592 0.28
1000 136.50 24.20 602 102.99 18.847 0.25
Mechanical and Thermal Properties of Copper at Higher Temperatures
Temperature (K)
Young’s Modulus
(GPa)
Poisson’s ratio
Conductivity (W/m-K)
Co-efficient of thermal expansion (µm/m-K)
297 114 0.343 401 16.4
373 110 0.34 398
477 98 0.3
727 55 0.3
1073 25 0.28 357 18.5
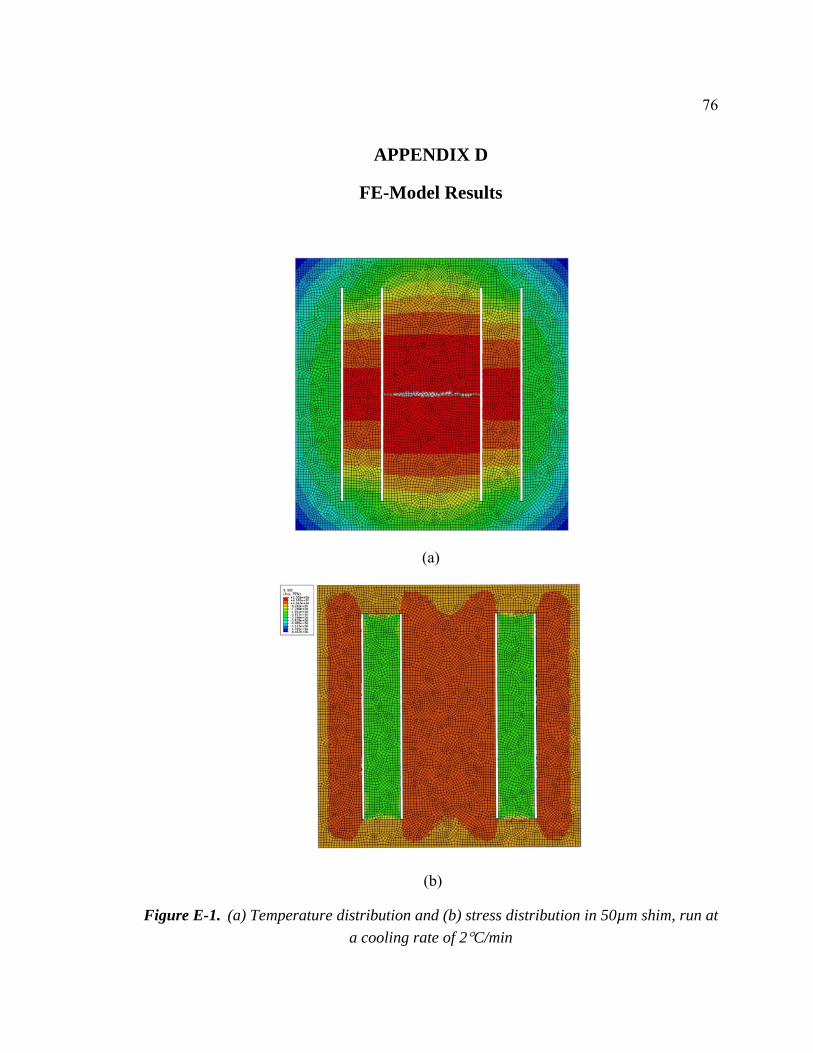
76
APPENDIX D
FE-Model Results
(a)
(b)
Figure E-1. (a) Temperature distribution and (b) stress distribution in 50µm shim, run at
a cooling rate of 2C/min
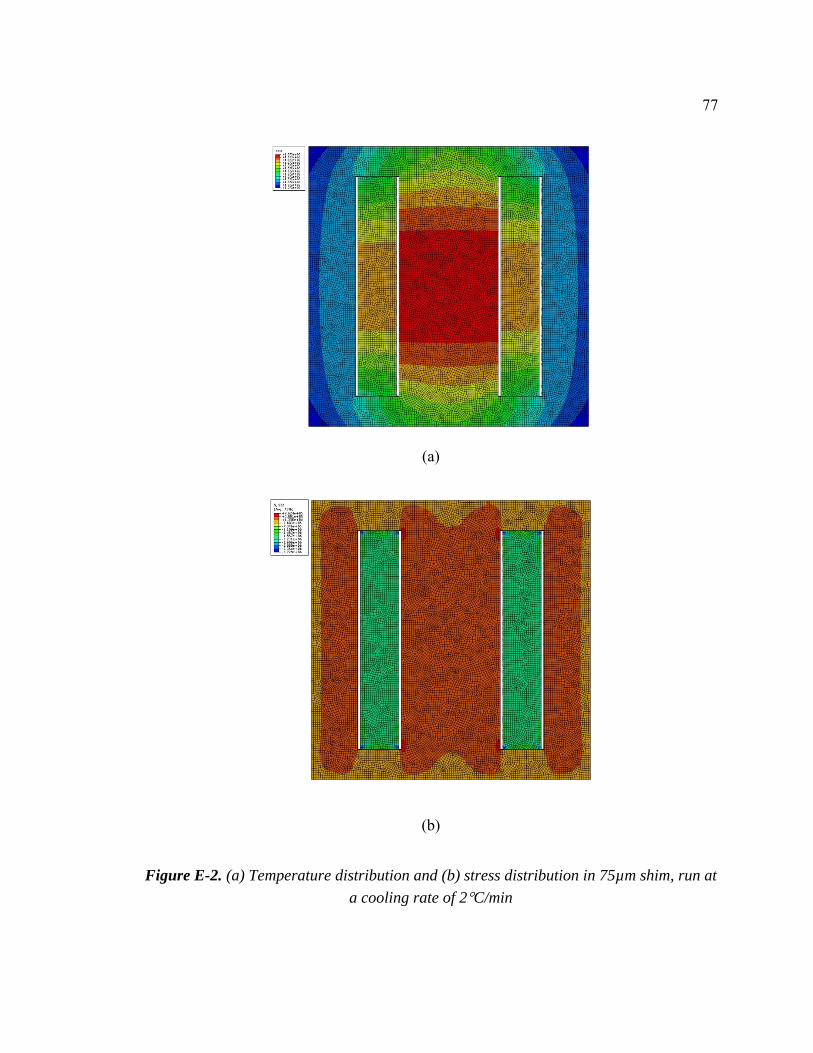
77
(a)
(b)
Figure E-2. (a) Temperature distribution and (b) stress distribution in 75µm shim, run at
a cooling rate of 2C/min

78
(a)
(b)
Figure E-3. (a) Temperature distribution and (b) stress distribution in 100µm shim, run
at a cooling rate of 3.5C/min
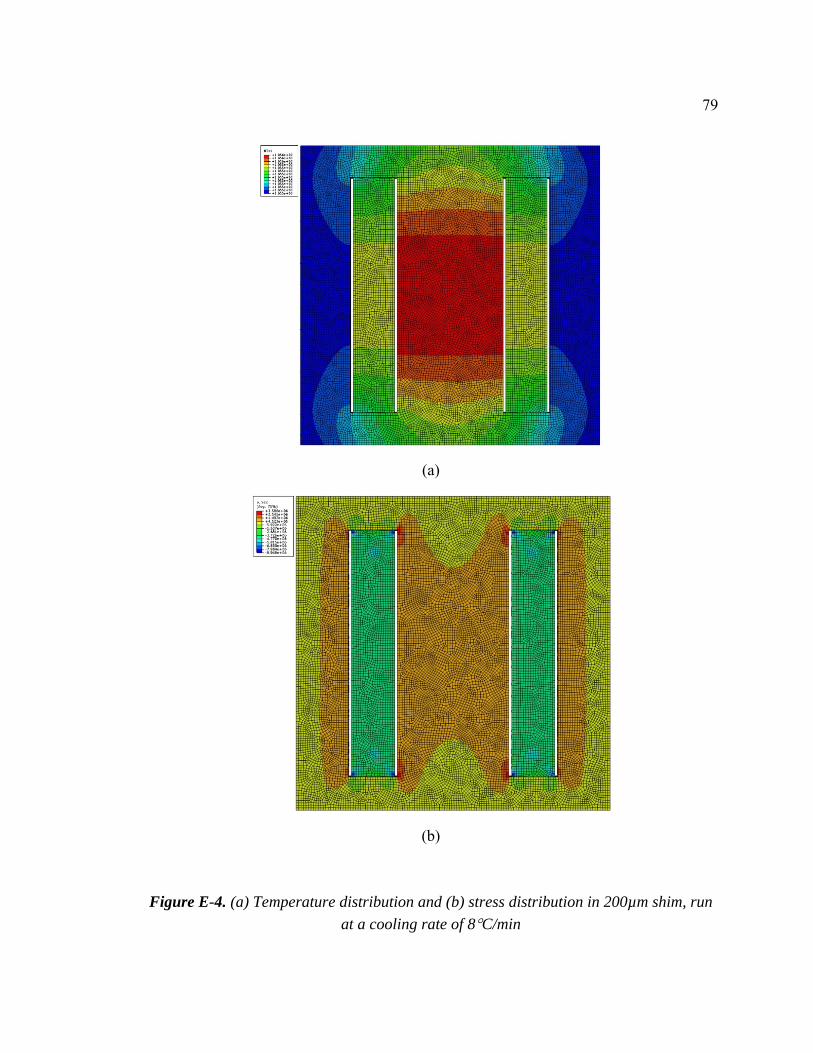
79
(a)
(b)
Figure E-4. (a) Temperature distribution and (b) stress distribution in 200µm shim, run
at a cooling rate of 8C/min
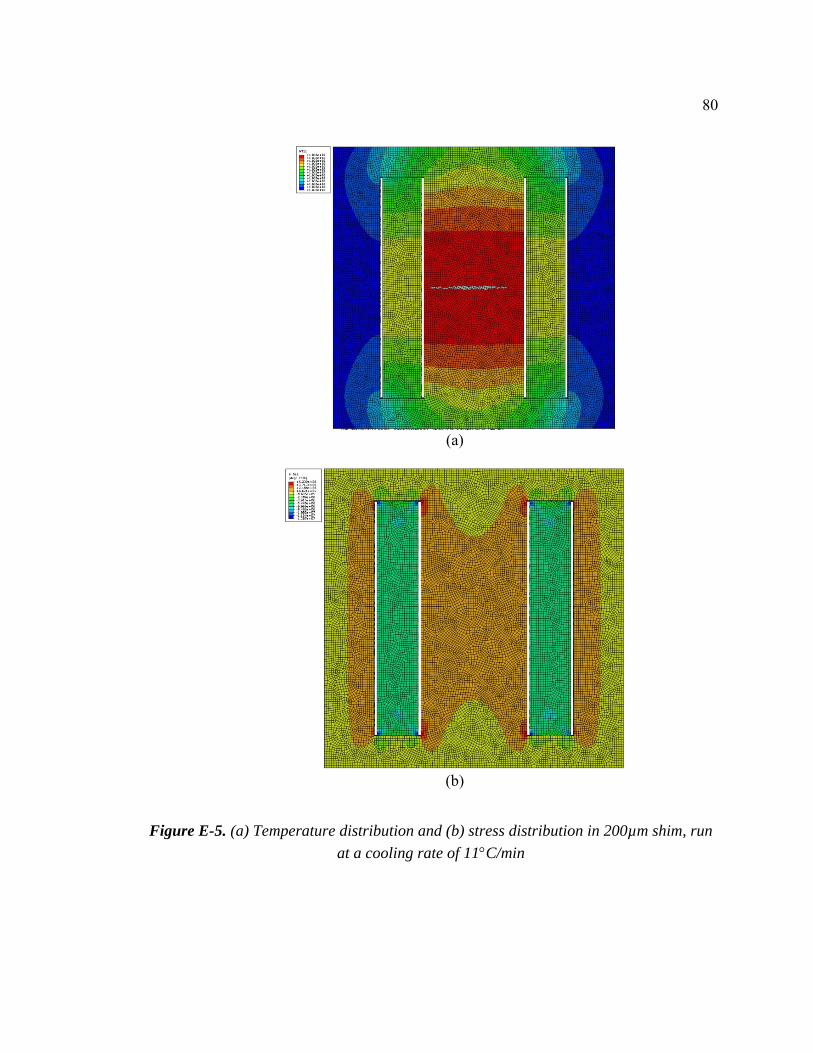
80
(a)
(b)
Figure E-5. (a) Temperature distribution and (b) stress distribution in 200µm shim, run
at a cooling rate of 11C/min
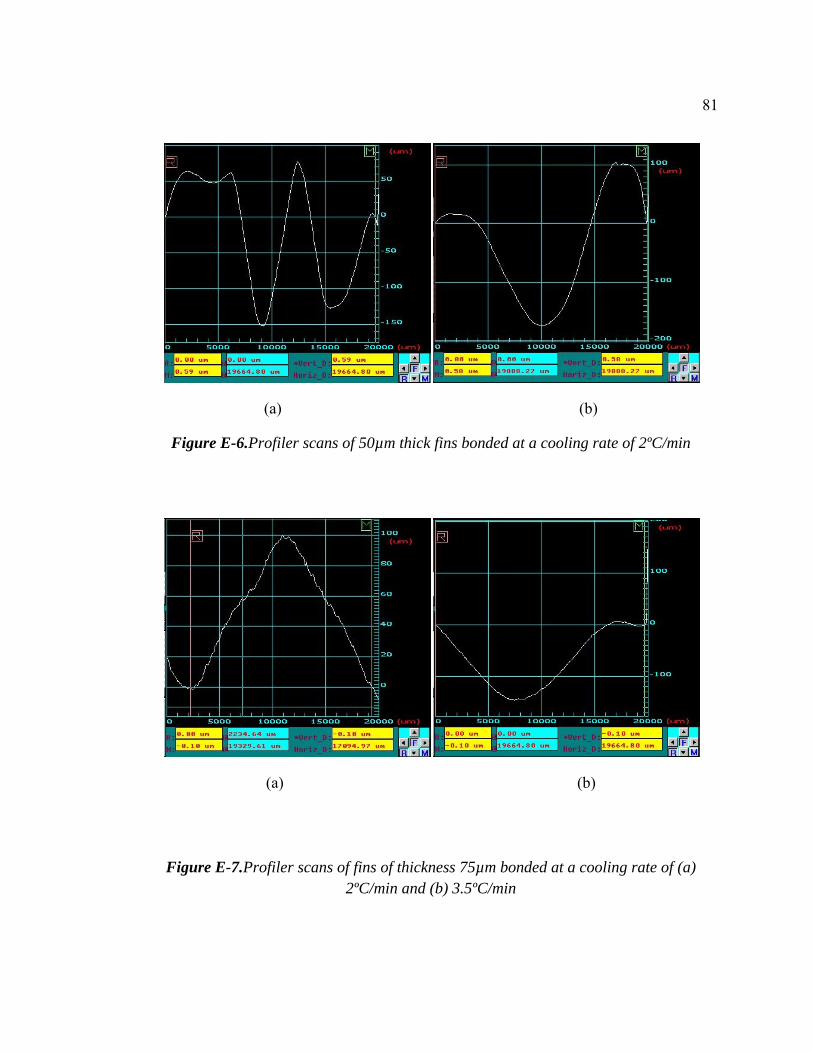
81
(a) (b)
Figure E-6.Profiler scans of 50µm thick fins bonded at a cooling rate of 2ºC/min
(a) (b)
Figure E-7.Profiler scans of fins of thickness 75µm bonded at a cooling rate of (a) 2ºC/min and (b) 3.5ºC/min

82
Figure E-8.Profiler scan over a length of 15mm on the fin of thickness 200µm cooled at
a rate of 8C/min
Figure E-9.Profiler scan over a length of 15mm on the fin of thickness 200µm cooled at
a rate of 11C/min