an abrupt switch in magmatic plumbing taps porphyry copper
TRANSCRIPT
An abrupt switch in magmatic plumbing tapsporphyry copper deposit-forming magmasLawrence Carter ( [email protected] )
University of Exeter https://orcid.org/0000-0003-3083-2361Simon Tapster
Geochronology and Tracers Facility, British Geological Survey https://orcid.org/0000-0001-9049-0485Ben Williamson
Camborne School of Mines, University of Exeter https://orcid.org/0000-0002-2639-3725Yannick Buret
Natural History MuseumDavid Selby
University of DurhamIan Millar
British Geological Survey https://orcid.org/0000-0002-9117-7025Daniel Parvaz
Lightning Machines https://orcid.org/0000-0001-7690-7854
Article
Keywords: magma, porphyry-type deposits, porphyry copper
Posted Date: June 24th, 2021
DOI: https://doi.org/10.21203/rs.3.rs-608569/v1
License: This work is licensed under a Creative Commons Attribution 4.0 International License. Read Full License

1
An abrupt switch in magmatic plumbing taps porphyry copper 1
deposit-forming magmas 2
3
Lawrence C. Carter1*, Simon R. Tapster2, Ben J. Williamson1,3, Yannick Buret3, David Selby4,5, Ian Miller2 & 4
Daniel B. Parvaz6,7 5
6
1Camborne School of Mines, University of Exeter, Cornwall, TR10 9FE, UK 7
2Geochronology and Tracers Facility, British Geological Survey, Keyworth, Nottingham, NG12 5GG, UK 8
3Natural History Museum, Cromwell Road, London, SW7 5BD, UK 9
4Department of Earth Sciences, Durham University, DH1 3LE, UK 10
5State Key Laboratory of Geological Processes and Mineral Resources, School of Earth Resources, China 11
University of Geosciences, Wuhan, 430074 Hubei, China 12
6Selfrag AG, Biberenzelgli 18, 3210 Kerzers, Switzerland 13
7Lightning Machines, 2nd Floor, Grove House, 774-780 Wilmslow Road, Didsbury, Greater Manchester 14
M20 2DR, UK 15
16
*Corresponding author: [email protected] 17
18

2
Abstract 19
Porphyry-type deposits are a vital source of green technology metals such as copper and molybdenum. They 20
typically form in subduction-related settings from large, long-lived magmatic systems. The most widely 21
accepted model for their formation requires that mantle-derived magmas undergo a multi-million year 22
timescale ramp-up in volatiles and ore-forming constituents in mid- to lower-crustal reservoirs, however this 23
does not explain why porphyry deposits are absent from the vast majority of arc magmatic systems. To 24
address this, we have carried out geochemical and geochronological studies on the tilted, ~8 km depth 25
equivalent, cross-section through the classic Yerington magmatic system, Nevada. Here we show that the 26
magmas underwent a major and abrupt change in chemistry over a period of 100 kyrs which is coincident 27
with the initiation of ore formation. This is attributed to a wholesale switch in the magmatic plumbing system 28
whereby volatile-rich granitic melts were extracted from an estimated ~30 km depth and transported to 29
shallow levels (~3-8 km) where exsolving fluids were focussed through highly permeable pathways to form 30
porphyry deposits. The change in magma chemistry is documented across the entire plutonic to volcanic 31
record. Its rapidity suggests that the increase in a magma’s ore-forming potential is not solely driven by 32
tectonic factors, that occur over multi-million year scales, but through internal processes within the melt 33
evolution zone, operating at more than an order of magnitude faster than previously envisaged. This short 34
timescale narrows the temporal-geochemical footprint of magmas associated with porphyry mineralisation 35
which will aid in targeting the next generation of ore deposits. 36
37

3
Introduction 38
The shift to new and green technologies is driving the increasing requirement for metals1,2. Copper demand 39
is forecast to increase by 140-350% from 2010 to 20503,4. Porphyry-type deposits provide more than 70% of 40
global copper, around 95% of molybdenum (~95%) and important amounts of gold (20%) and other metals5. 41
They form from hydrothermal fluids produced by large and long-lived calc-alkaline to slightly alkaline, water-42
rich and relatively oxidising trans-crustal magmatic systems, mostly in subduction-related settingse.g.5-9. Whilst 43
such magmas are arguably relatively common, porphyry-, and particularly large porphyry-type deposits are 44
extremely rare and increasingly difficult to find7. Their formation probably requires a series of specific 45
conditions and events during the evolution of the magmatic-hydrothermal system. 46
47
In the drive to discover new ore-deposits, there have been many recent attempts to develop whole-rock and 48
mineral geochemical indicators to assess the ore-forming potential, or the fertility, of magmatic systems10. 49
Their main advantage compared with conventional exploration techniques is that they are cheap and have 50
low environmental impact. Most indicators reflect the geochemical signatures of amphibole fractionation and 51
plagioclase suppression due to the hydrous nature of the magmas from which porphyry-type deposits 52
forme.g.7,11-20. 53
54
The current paradigm is that the hydrous magmas that form porphyry-deposits result from an extremely long 55
(multi-million year), arc-scale, tectonically driven “ramp-up” in volatiles and ore-forming constituents in mid- 56
to lower-crustal magmatic reservoirs11,16,21-25. Here, mantle-derived melts develop their hydrous ore-forming 57
geochemical signatures over protracted time scales due to cyclical fractionation and re-fertilisation by mafic 58
magmas, before emplacement into the upper crust. The macro-scale tectonic regime has been suggested to 59
progressively deepen the melt evolution zone and slow the upwards migration of magmas through the 60
crust22,24,26. In an alternative model, it is suggested that magmas acquire their ore-forming geochemical 61
signatures during evolution within an upper crustal staging grounde.g.5,27,28. Such conceptual models for the 62
evolution of magmatic systems linked to porphyry-style mineralisation are however greatly limited by a 63
paucity of vertically extensive exposure over the crustal windows of porphyry ore-forming systems29. We 64
therefore have a fragmented understanding of the timescales of porphyry-deposit formation and the 4-D 65
architecture of the systems which produce them, which has hampered the development of genetic models 66
and exploration tools. 67
68
The Yerington magmatic system, Nevada, due to its unique ~8 km deep profile, from volcanic to plutonic 69
environments, through at least four porphyry copper deposits (Fig. 1 & 2) has provided constraints for many 70
of the most trusted porphyry system modelse.g.5,6,27-32. 71
72
Here we reconstruct the Yerington magmatic system across the deep plutonic to volcanic environment, 73
encompassing deep-seated melt evolution zones, through to the development and focusing of magmatic-74
hydrothermal fluids to form porphyry-type deposits. In doing so, we examine the fundamental timescales and 75
drivers for the emergence of the magmatic system’s ore-forming potential and associated geochemical 76
signatures that can be identified within the rock record. 77
78

4
The construction of a porphyry-forming magmatic system 79
Late Cenozoic basin and range extensional faulting and associated fault block rotation has exposed a <1 to 80
~8 km palaeodepth cross-section through the middle Jurassic composite Yerington batholith27,33-36 (Fig. 1 & 81
2). There are three main plutonic phases, which listed in order of increasing emplacement depth are: 1) the 82
McLeod Hill quartz monzodiorite (McLeod QMD); 2) Bear quartz monzonite (Bear QM); and 3) Luhr Hill 83
granite (LHG) (Dilles, 1987). Swarms of granite-composition porphyry and aplite dykes cross-cut these, 84
appearing to be structurally focused through apophyses of the LHG27,32. These dykes are spatially associated 85
with the batholith’s four known porphyry copper deposits: Ann Mason; Yerington; MacArthur and Bear (Fig. 86
1 & 2). Combined, these host a resource in excess of 9 Mt of contained Cu35,37-39. 87
88
The Yerington batholith was emplaced into Triassic to Jurassic intermediate composition volcanics, 89
volcaniclastic and argillaceous sedimentary rocks, and basal exposures of the Jurassic Artesia Lake 90
Volcanics, which are unconformably overlain by the Jurassic latitic Fulstone Spring Volcanics27,34,40 (Fig. 1 & 91
2). Units of the Fulstone Volcanics are thought to have been cogenetic with granite porphyry dykes 92
associated with the Luhr Hill granite40,41 or rather have been cogenetic with the nearby younger Shamrock 93
batholith and post-date porphyry mineralisation34. 94
95
Temporal constraints from field relations 96
Field-based observations place constraints on the relative timing of events. The LHG is the youngest of the 97
three main plutons having been emplaced into the McLeod QMD and Bear QM27. Contacts between the LHG 98
and McLeod QMD are sharp (Fig. S1), with no chilled margins or evidence of interaction with precursor 99
granitoids. No metasomatic effects are present at the contacts beyond the later, pervasive, mostly sodic-100
calcic and propylitic porphyry-related alteration42. In deeper portions of the LHG (~7.5 km palaeo-depth27), 101
banding defined by grain size variations is locally observed (Fig. S2). 102
103
The onset of porphyry mineralisation is constrained by cross-cutting relationships; multiple generations of 104
variably mineralised granite-composition porphyry and aplite dykes clearly cross-cut the upper (Fig. 3 & S3) 105
and lower parts of the LHG32,40 and appear to have been focused through apophyses of the LHG41,42. The 106
dykes generally have sharp contacts with the LHG, with some showing chilled margins and others lobate 107
contacts (Fig. 3a). It was previously suggested that both the porphyry and aplite dykes emanated from 108
cupolas and upper zones (~3 to 6 km depth) of the LHG27, however we could not trace either to their source 109
and therefore suggest that they were likely to be intruded from below the deepest levels exposed in the LHG 110
(>~7 km). Different generations of the aplite dykes either cross-cut and/or mingle with the porphyry dykes 111
(Fig. 3b) indicating that, locally, emplacement was near contemporaneous. 112
113
Despite their close temporal relationship, the porphyry and aplite dykes show very different internal textures. 114
The porphyry dykes show no direct textural evidence for fluid exsolution (e.g. miarolitic cavities43), rather are 115
only seen to be cross-cut by mineralised veins. In contrast, multiple generations of aplite dykes invariably 116
contain miarolitic cavities and pegmatitic segregations that often host hypogene mineralisation (chalcopyrite 117
± bornite ± molybdenite), as well as early A-type veins (nomenclature after 44) and quartz unidirectional 118

5
solidification textures (USTs), but are also cross-cut by mineralised veins (Fig. 3c-f & S3). The quartz USTs 119
within the aplites is likely to indicate rapid temperature or pressure fluctuations45 and fluid exsolution via first-120
type boiling46, suggesting that the mineralising aplite dykes were strongly undercooled having been emplaced 121
rapidly to shallow depths. Given the aplite dykes host mineralised miarolitic cavities which are closely 122
associated with early mineralised veins (A-type44) (Fig. 3e & 3f), they capture the nature and timing of 123
magmatic-hydrothermal fluid exsolution and mineralisation, as well as having acted as “crystal mush” 124
conduits for mineralising fluids from deep portions of the LHG32. 125
126
Field relations indicate that some parts of the Fulstone volcanics were cogenetic with the emplacement of 127
porphyry dykes associated with the LHG40,41. Propylitic alteration is ubiquitous across the Fulstone Spring 128
Volcanics (e.g. epidote replacing primary plagioclase and chlorite replacing mafic minerals) (Fig. S4), 129
indicating that the hydrothermal system was active for some time after volcanism. The lack of more acidic 130
alteration (e.g. advanced argillic) indicates that these volcanics, if related, were distal to ore-forming 131
hydrothermal activity. 132
133
Absolute age constraints on porphyry system evolution 134
The determination of zircon CA-ID-TIMS U-Pb ages provides a temporal framework for the construction of 135
the Yerington batholith and eruption of overlying volcanics, over an indicated period of ~2.8 Myrs (~169.1 Ma 136
to ~166.3 Ma; Zircon ages are reported in Fig. 4 and Supplementary Data 1). The McLeod QMD (AM72 and 137
AM4QMD) and Bear QM plutons (BH10 and MA9) were emplaced over a period of >~1.6 Myrs (~169.1 Ma 138
to ~167.5 Ma). The overlapping ages of these two units indicates some degree of contemporaneous 139
emplacement, with crystallisation of their latest phases within ~100 kyrs of each other. These mineralogically 140
and texturally distinct plutons both young downwards over a palaeo-vertical distance of ~3 km, suggesting 141
under-accretion as the mode of emplacemente.g.47. 142
143
For the LHG, its upper region (AM18LHG; ~5 km palaeo-depth27) and a deeper portion (LH24S; ~7.5 km 144
palaeo-depth27) show overlapping zircon 206Pb/238U dates with closely comparable weighted means of 145
167.365 ± 0.041 Ma and 167.275 ± 0.027 Ma, respectively (Fig. 4). These ages define the maximum repose 146
time between the McLeod QMD/BH and LHG of 215 ± 59 kyrs. When the 167.440 ± 0.039 Ma age of a 147
mineralised porphyry dyke (AC25) is considered, which cross-cuts the LHG cupola ~1 km higher in the 148
system than AM18LHG, then this repose time must be even shorter (140 ± 57 kyrs, or ~ 100 kyrs). The 149
crosscutting relationships imply a protracted emplacement of the exposed LHG over >~150 kyrs. These new 150
timescales also indicate that construction of the Yerington batholith was significantly longer than previously 151
estimated – meaning that long-term emplacement rates by protracted episodes of magma recharge were 152
~two times slower than the minimum rates previously estimated31. 153
154
A stratigraphically lower unit of the Fulstone volcanics (BS1) yielded an age (168.318 ± 0.054 Ma; Fig. 4) 155
within the emplacement duration defined by the Bear QM and McLeod QMD, whereas the stratigraphically 156
higher unit (BS16) gave a much younger age (166.285 ± 0.059 Ma; Fig. 4), ~1.1 Myrs younger than the 157
formation of the LHG cupola. The new geochronological data supports a volcanic record that spans over ~2 158
Myrs, rather than a single post-ore volcanic event34. 159

6
160
The timing of porphyry-style Cu-Mo mineralisation has been constrained from cross-cutting relationships and 161
Re-Os molybdenite ages (Fig. 4). Ages for the mineralised porphyry dykes that cross-cut the cupolas of the 162
LHG and the youngest ages for the McLeod QMD and Bear QM both constrain the onset of ore formation at 163
~167.4 Ma. The multiple generations of aplite dykes (AM63A and AM13BAP) capture the nature and timing 164
of magmatic-hydrothermal fluid exsolution and mineralisation, and acted as conduits for the transport of 165
mineralising fluids into the ore-forming environment32 (Fig 3 & S3). As the youngest zircon growth contained 166
within the aplite dykes likely crystallised as part of the magmatic assemblage, the U-Pb ages of 167.282 ± 167
0.040 Ma and 167.045 ± 0.057 Ma (Fig. 4) offer upper limits for the mineralisation they host, showing 168
mineralisation occurred episodically for at least ~400 kyrs. 169
170
Within the Ann Mason porphyry deposit, Re-Os molybdenite ages for a chalcopyrite-molybdenite-quartz vein 171
(AC21) and a fine grained molybdenite vein (AC12MP) (Fig. 4 & S5; Supplementary Data 1) indicate that 172
mineralisation occurred during multiple hydrothermal events over a period of ~600 kyrs, from 166.8 ± 0.1 to 173
166.2 ± 0.1 Ma. Comparison between the hydrothermal Re-Os molybdenite ages with magmatic zircon U-Pb 174
ages requires that total uncertainties, relating to the tracer calibrations and decay constant intercalibration 175
must be considered, which equate to ± 0.8 Myrs on Re-Os dates and ~± 0.2 Myrs for U-Pb. Results therefore 176
indicate porphyry-style mineralisation occurred potentially over a period in excess of 1 Myrs, roughly 177
coincident with the eruption of the younger propylitically altered components of the Fulstone volcanics 178
(BS16), at 166.285 ± 0.059 Ma (Fig. S4). 179
180
Geochemical change within the magmatic system 181
In terms of their whole-rock geochemical compositions, the McLeod QMD and Bear QM (pre-mineralised) 182
are similar and notably different to the LHG, porphyry and aplite dykes (inter-mineralised) (Fig. 5, 6 & S6; 183
Supplementary Data 2). The McLeod QMD and Bear QM have similar ranges in SiO2 (~60-68 wt.%) whilst 184
the LHG samples either overlap with these or are marginally more evolved (~67-69 wt.% SiO2). The porphyry 185
dykes show a range in SiO2 (60-71 wt.%), whilst aplite dykes are the most evolved, generally having >73 186
wt.% SiO2. Compared to the McLeod QMD and Bear QM, the LHG and porphyry dykes possess higher Sr/Y 187
ratios (Sr/Y >130), steeper LREE/HREE and MREE/HREE patterns (e.g. La/Yb >30; Gd/Yb >3.7), lower 188
ƩREEs (<100 ppm), and positive Eu anomalies (Eu/Eu* >1.05). The Dy/Yb values (~2) do not significantly 189
change between the McLeod QMD, Bear QM and LHG. 190
191
From their whole-rock geochemistry, the pre-mineralised McLeod QMD and Bear QM are likely to be 192
genetically related, despite their mineralogical and textural differences27. A change in the bulk fractionating 193
assemblage is indicated to yield the signatures of the inter-mineralised LHG. As previously shown27, this is 194
likely from clinopyroxene (in which Y, MREEs and HREEs are compatible, although more weakly when 195
compared to amphibole48,49) and plagioclase dominated (in which Sr and Eu are compatible50) in the pre-196
mineralised units to amphibole-dominated, with the suppression of plagioclase crystallisation, in the inter-197
mineralised units, leading to the increased Sr/Y and Eu/Eu* values and depletion in REEs48,49,51 (Figs. 5 & 198
6). 199
200
7
Zircon geochemistry is a function of pressure, temperature and melt composition52,53. During the interval of 201
zircon saturation, the composition of zircon documents these changes within the melt storage zones and 202
migration pathways. Zircon from across the Yerington magmatic system (Fig. 7 & S7-10; Supplementary 203
Data 3) can be separated into two distinct geological groups: pre-mineralisation (McLeod QMD, Bear QM 204
and older volcanic units) and inter-mineralisation (LHG, aplite dykes and younger volcanic units). Zircon Hf 205
concentrations (typically thought to reflect melt evolution52) is comparable between pre- and inter-206
mineralisation units. Zircons from the pre-mineralisation McLeod QMD and Bear QM have relatively high Ti 207
(5-20 ppm), lower Eu/Eu* (0.2-0.5) and Gd/Yb (MREE/HREE, 8-21), overlapping with the pre-mineralisation 208
Artesia volcanics and older units of the overlying Fulstone volcanics. From outer to inner portions of the 209
McLeod QMD and Bear QM, there is an increase in Gd/Yb (rising from ~10 to ~16) with decreasing zircon Ti 210
concentration. There is a step-wise change to zircon from inter-mineralised LHG and aplite dykes, 211
characterised by lower Ti (2-5 ppm), higher Eu/Eu* (~0.4 to 0.9) and Gd/Yb (~10-35). Zircons from younger 212
units of the Fulstone volcanics sit within this group. 213
214
There is no major difference in zircon composition between the LHG and aplite dykes. Zircon data of the 215
porphyry dykes show no notable trace element differences between dyke generations of the “early” and “late” 216
mineralised dykes from both the Ann Mason and Yerington porphyry copper deposits, in agreement with 217
previous zircon data from the Yerington system36. Regardless of age, the porphyry dykes show no clear 218
division between the geochemical groups of pre- and inter-mineralisation plutonic rocks, which we attribute 219
to recycling of pre-mineralisation zircon grains form a magmatic system at depth. That the same zircon 220
geochemical signatures seen in the intrusive units are expressed in the volcanic terrane indicates that all 221
plutonic units were associated with volcanism. 222
223
As melt chemistry is largely linked to the composition of the source54, major differences in zircon chemistry, 224
and by extrapolation melt chemistry, between the samples is likely to reflect differences in the source prior 225
to magma emplacement. The zircon chemistry of the McLeod QMD and Bear QM indicate a shared magmatic 226
evolution, despite their mineralogical and textural differences27. The contrasting zircon geochemical signature 227
of the inter-mineralised units (LHG and aplite dykes) suggest their source underwent amphibole-dominated 228
fractionation, evidenced by the increasing MREE/HREE signature, and likely titanite fractionation, with 229
suppressed plagioclase crystallisation to give high Eu/Eu* values51,55. The low Ti concentration seen in the 230
inter-mineralised zircon signature could also reflect lower temperatures within the system (as per the Ti-in-231
zircon geothermometer56) induced by increased melt water content and solidus suppression. Absolute 232
temperatures were not calculated from the zircons given uncertainties in the activity of TiO2 through the 233
evolution of the magmatic system. Alternatively (or in combination), the low Ti concentration could be due to 234
decreased TiO2 activity in the magma, due to greater incorporation of Ti into amphibole and titanite, as well 235
as possibly biotite and magnetite. Importantly, the changes shown by previous work27 and whole-rock data 236
(Fig. 5 & 6) indicative of a shift from a clinopyroxene-plagioclase-dominated system to an increasingly 237
hydrous, amphibole-dominated system at the transition from a non-mineralising to mineralising magmatic 238
system is consistent with, and more pronounced, in zircon geochemistry. This changing signature can be 239
seen in both the plutonic and volcanic record. 240
241

8
Isotopic constraints on magma pathways 242
From a study of whole-rock 87Sr/86Srt 27, there was a subtle transition from more radiogenic, crustal-like 243
values57 within the pre-mineralisation intrusions to less radiogenic values within inter-mineralised intrusions, 244
indicating a decreasing amount of crustal assimilation within the magmatic system. Similarly, zircon O-245
isotopes36 also document a transition from δ18O ~6 ‰, nominally above values for zircon equilibrated with 246
mantle-derived melts, indicating crustal contamination, to ~4.5 ‰, more within the expected range for the 247
mantle58,59 (Fig. 8). 248
249
The ɛHft composition of the zircon used to calculate crystallisation ages, and therefore a good approximation 250
for the late-stage melt at the emplacement level, provide further insights into the evolution of the magma 251
system (Fig. 8; Supplementary Data 4). Over the period of construction of the Yerington magmatic system, 252
the main features of the data are best described by two metrics: the changes in the weighted mean ɛHft for 253
the sample and differences in the corresponding over-dispersion where the MSWD is in excess of that 254
expected for a single population at the stated level of uncertainty. With an ɛHft uncertainty of ~±0.5 ɛHft (2σ), 255
the data show that: 1) The LHG and aplite dyke samples form reproducible single populations without over-256
dispersion indicating zircon crystallised from a melt with homogenous ɛHf, whereas the pre-mineralisation 257
samples (>167.4 Ma) show over dispersion that must result from variable ɛHf between zircon and indicate 258
isotopic heterogeneity within the melt; 2) The mean value is consistent (within ~0.2 ɛHft) for inter-259
mineralisation samples, yet is ~1 ɛHft lower in the oldest Bear QM sample. The increased range and lower 260
ɛHft indicates greater crustal assimilation, which probably occurred during ascent into the sub-volcanic 261
environment. 262
263
Given the paucity of evidence for any significant component of zircon xenocrysts older than the Triassic 264
volcanic and sedimentary country rocks (Fig. 4 & 7; Supplementary Data 1 & 3), we infer that there was little 265
mature crustal material present to impart large variations in ɛHft upon assimilation. Nevertheless, there is a 266
systematic variation between earlier and later pre-mineralisation intrusions that is best explained by the pre-267
mineralising magmas (prior to ~167.4 Ma; McLeod QMD and Bear QM) having undergone transport, storage 268
and evolution within, and were contaminated by, the crustal column leading to the more varied and crustal 269
isotopic signatures (Sr, O and Hf). In contrast, after ~167.4 Ma, these rocks no longer show this signature, 270
indicating no discernible assimilation of previous crust after the melts were extracted. This indicates that the 271
mineralising melts evolved within an environment where they were only exposed to a single, homogenous, 272
mantle-derived source melt prior to emplacement. This supports different evolution zones for the pre- and 273
inter-mineralisation melts. These could be either disparately within the crust, or within the same “hot-zone”54 274
reflecting melt extraction with different proximity to the country rock, with LHG melts being entirely 275
encapsulated by the juvenile, mantle-derived rocks with negligible crustal interaction and assimilation prior 276
to emplacement 277
278
Depth of melt evolution 279
The composition of H2O-saturated minima and eutectics (i.e. the last melt to crystallise after fractional 280
crystallisation60) for haplogranitic melts is a function of pressure61. The pressures at which H2O-saturated 281

9
melts differentiated54 can therefore be tracked through normative mineralogy. The normative mineralogy of 282
the LHG and aplite dyke samples indicates a close relationship with the minima and for H2O-saturated 283
haplogranitic melts61 (Fig. 9), indicating the melt from which they formed were H2O-saturated. LHG samples 284
cluster between the ~450 MPa minima and 1000 MPa eutectic. Aplite dyke samples plot between the ~75-285
200 MPa minima. Assuming lithostatic pressure with an average overburden density of 2.5 g/cm3, these 286
pressures roughly equate to a melt evolution depth of ~20-40 km for LHG and porphyry dykes, and ~3-8 km 287
for aplite dykes. Outliers with very little apparent orthoclase, either do not represent H2O saturated melts, 288
have complex crystal cargoes, or were subject to overprinting Na-Ca and propylitic hydrothermal alteration 289
(as previously mapped42). 290
291
These data support deep evolution of the melts which formed the LHG plutonic rocks, and likely the porphyry 292
dykes. It also indicates that following emplacement of the LHG-forming magmas from their deep (~20-40 km) 293
source to shallow levels (~3-8 km), further evolution lead to the aplite dyke forming melts which were volatile- 294
and Cu-rich (documented by fluid exsolution and mineralisation textures32; Fig. 3 & S3). 295
296
A rapid switch to porphyry ore-forming magmas 297
The unique geological cross section of the Yerington district (Fig. 1) has recorded evidence of how magmatic 298
systems develop the potential to form Cu-porphyry deposits. In contrast to the previous emplacement models 299
for the Yerington plutonic rocks27,31,42, which suggested sequential emplacement of the McLeod QMD and 300
Bear QM, the revised chronology indicates that the pre-mineralisation magmas were produced and 301
episodically emplaced over the same >1.6 Myrs period of time (Fig. 4 & 10). Whilst these units are 302
mineralogical and texturally distinct27, their isotopic signatures, whole-rock and zircon geochemistry are not 303
distinct (Fig. 5-8), supporting protracted melt evolution and pathways under similar evolutionary conditions, 304
likely in a mid- to lower-crustal storage zone (~15-20 km; Fig. 10 & S11). 305
306
The most significant geochemical change within the system was an abrupt switch from signatures that 307
indicate clinopyroxene-plagioclase-dominated fractionation to an amphibole-dominated system, documented 308
within both zircon and whole-rock chemistry (Fig. 5-7 & S6-10). This change occurred between the relatively 309
evolved plutonic rocks which have comparable indicators of fractionation, such as whole-rock SiO2 and zircon 310
Hf concentration (Fig. 6 & 7). This abrupt shift in the dominant fractionating assemblage is constrained to 311
within ~100 kyrs and is coincident with the onset of porphyry mineralisation. Following this, the mineralising 312
magmatic system was stable for potentially in excess of 1 Myrs, with the youngest magmatic activity being 313
documented within the propylitically altered volcanics, that bear the same zircon geochemical signatures as 314
the inter-mineralisation LHG samples (Fig. 4, 7 & S4). 315
316
The abrupt change in the magmatic chemistry to more hydrous and amphibole-dominated signatures can be 317
explained by a phase boundary change in the magma extracted from a single magma evolutionary zone, 318
during its longer-term progressive evolution. Within the lower crust, fractionation of anhydrous phases in the 319
relatively dry magmas, as magmatism continued over 1.6 Myrs, progressively ramped up the concentrations 320
of volatiles. The sudden change reflects the point at which the “amphibole-in” line was suddenly crossed due 321
to the volatile build up, or due to the injection of new melts into a lower crustal clinopyroxene cumulate pile 322
or “sponge”, that reacts with new melt to become progressively replaced by amphibole62. The dated porphyry 323

10
dyke that sits at the temporal onset of mineralisation (AC25; Fig. 4) and has zircon geochemistry appearing 324
to straddle the pre-and inter-mineralised signatures (Fig. 7 & S8-10) could mark this threshold being crossed. 325
326
Although we cannot rule out this transitional model to describe the evidence, there are a number of features 327
that do not support that they resulted from progression within a single magma evolution zone. For example, 328
the porphyry dykes hosted by and therefore relatively later than the LHG also contain zircon with pre-329
mineralisation chemistry. The sharp contacts between the mineralogical distinct McLeod QMD and LHG 330
plutonics27 and the temporally abrupt stepwise change in magma geochemistry following 1.6 Myrs of pre-331
cursor magmatism is suggestive of a fundamental shift in where the melt is extracted from, rather than a 332
transition of a single melt extraction zone within the system. A scenario where a single melt extraction zone 333
suddenly changes fractionating assemblage is also challenging to reconcile given the shift in the isotopic 334
data from a heterogeneous signature, which indicates interaction with crustal components, to a 335
homogeneous more juvenile, mantle-derived signature particularly over the short timescale the data identify 336
(Fig. 8). 337
338
The abrupt, ~100 kyrs change after the >1.6 Myrs period of emplacement of the pre-mineralisation plutons 339
is better explained by a rapid switch in the magmatic plumbing system, probably within the mid- to lower- 340
crustal melt evolution zone from where the magmas feeding the upper crustal reservoir were derived (Fig. 341
10). We envisage that the earlier, pre-mineralisation stage magmas were derived from the mid- to lower-342
crust (~15-20 km; Fig. S11). During protracted storage and evolution, these assimilated crustal material. It is 343
feasible that the contrasting nature of the McLeod QMD and Bear QM27, yet in-part contemporaneous 344
emplacement periods (Fig. 4), reflect slightly different zones of storage and evolution during this period of 345
batholith growth. After the switch, magmas in the lower crustal “hot-zone”54 (~20-40 km; Fig. 9 & 10) evolved 346
to more volatile-rich compositions which initiated the crystallisation of amphibole and/or the reaction of the 347
more hydrous melts with clinopyroxene in a mush or pre-existing cumulate pile. The more evolved melts 348
tapped from this zone had only interacted with precursor mantle-derived magmas, and possibly cumulates, 349
explaining their lack of crustal isotopic signatures (Fig. 8). In this scenario the pre-mineralisation geochemical 350
signature of the zircon cargo of the porphyry dykes would be acquired as they punched up through the pre-351
cursor magmatic system on route to their emplacement levels. 352
353
Although there is little distinction between the LHG and porphyry dykes in terms of whole-rock geochemistry 354
(Fig. 5 & S6), from differences in their zircon trace element compositions and isotopes (Fig. 7 & 8), 355
comparable melt minima barometry (Fig. S11) along with the paucity of field evidence, it is very unlikely that 356
the porphyry dykes were derived from the upper parts of the LHG (as per previous modelse.g.27). From textural 357
evidence (Fig. S2), once emplaced at shallow crustal levels, the magmas underwent further magmatic 358
differentiation (at ~ 3-8 km depth, based on melt minima plots; Fig. 9) to form the more evolved and volatile-359
rich melts that were episodically injected as undercooled aplite dykes over a period of at least ~400 kyrs. 360
Multiple generations of aplite dykes acted as crystal mush conduits for the mineralising fluids32, episodically 361
over time periods potentially in excess of ~1 Myrs post-emplacement of the LHG cupola (Figs. 3, 4 & S3), as 362
magma and volatile transport was likely decoupled. This suggests that relatively evolved, internal parts of the 363
LHG produced the magmas and associated fluids responsible for porphyry deposit formation rather than the 364
carapace of the pluton. 365

11
366
The proposed time-period for porphyry ore formation, which is likely to have exceeded 1 Myrs post 367
emplacement of the LHG, is not uncommon for medium to large scale, composite porphyry systemse.g.24,63-368
65. Given the similar zircon trace element geochemistry between mineralised porphyry dykes in the Ann 369
Mason and Yerington porphyry deposits36 (Fig. S8-10), along with their petrographic similarities27, they are 370
most likely co-genetic. It is probable that these are also co-cogenetic with porphyry dykes in the Yerington 371
districts’ two other known porphyry deposits: Bear and MacArthur. It is therefore salient for future numerical 372
models and computational simulations of batholith construction and porphyry mineralisation to include fluids 373
derived from across all porphyry centres, which would produce a considerably larger copper endowment. 374
375
Genetic implications for porphyry deposit-forming magmatic 376
systems 377
The apparent change in geochemistry (whole-rock and zircon) as the Yerington system began to produce 378
porphyry deposits is consistent with observations across a wide range of global localities where precursor 379
magmatism and syn-mineralisation intrusions have been examinede.g.19,20,22,25,66. Typically these changes 380
have been interpreted as being due to long-term, arc-scale, transitional “ramp-ups” towards ore-formation 381
over millions of yearse.g.11,16,21,23, however this model was constrained by limited exposure in most systems29. 382
Our detailed studies of the considerably better-exposed Yerington batholith suggest that the switch to 383
porphyry deposit-producing magmatism was at least an order of magnitude faster than previously thought. 384
The short timescale of the geochemical changes suggested here does not necessarily contradict longer-term 385
progressions towards hydrous, ore-forming arc magmas seen in other magmatic systems. The longer 386
durations documented in other systems between precursor and ore-related magmatism, and their 387
corresponding changes in geochemistry, may simply relate to the juxtaposition of upper crustal magmatic 388
expressions over the protracted duration of the magmatic system. For example, when temporally comparing 389
dyke to host rock in Yerington, there is a difference of up to ~1.7 Myrs for dykes that intruded up through the 390
LHG and into shallower levels of the McLeod QMD. This means the footprint of ore-bearing systems may 391
differ with exposure level – at shallower levels the record would look discrete and appear to develop over 392
longer timescales, whereas at depth the system appears more concurrent. 393
394
We, however, recognise that a wholesale change in the deeper magmatic system occurs at a resolution 395
which can be used to isolate geochemical signatures in the rock record. The timescale of this process 396
appears to be beyond a multi-million year magmatic “ramp-up” driven by the macro-scale tectonic regime 397
11,16,21-26. Instead, our results indicate how the magmatic systems can much more rapidly develop their ability 398
to form porphyry copper deposits and that this must relate to processes that are driven internally by the 399
magmatic processes of melt generation and the extraction of evolved melts within the system itself (Fig. 10). 400
401
The recognition of a rapid ~100 kyrs switch within the magmatic plumbing system requires a new approach 402
in the interpretation of plutonic processes in ore-forming systems. The magmas responsible for ore-formation 403
underwent different routes of evolution and were tapped from spatially independent melt zones within the 404
lower crust compared to the magmas which formed the pre-cursor plutons. We suggest from this that the 405
12
processes and evolution histories of early intruded plutons cannot necessarily be used to infer whether other 406
parts of the batholith may have produced porphyry-type deposits. 407
408
Our research offers new constraints on the depth of different melt evolution zones below the Yerington 409
porphyry district, and the abrupt nature of the change between zones of melt extraction at the onset of 410
mineralisation. This has important implications for models of batholith construction, the formation of porphyry-411
type deposits and the development of porphyry exploration indicators. This is mainly because the short-412
timescale over which the geochemical signatures associated with mineralisation appeared throughout the 413
magmatic system, in plutons, dykes and volcanics, significantly narrows the temporal window for ore 414
formation. This increases the potential efficacy of using these geochemical signatures to isolate areas 415
prospective for porphyry-style mineralisation. This greater confidence in the resolution of these signatures is 416
important in aiding discovery of the next generation of porphyry deposits, which are likely to be deeper and 417
often under cover and so will be more difficult to find10. Such discoveries are vital for the supply of certain 418
new technology metals which are crucial to the growth of green economies. 419
420
Conclusions 421
Using the unique and archetypal geological section of the Yerington district, the timing of batholith 422
construction, magmatic evolution and magmatic-hydrothermal mineralisation has been constrained. By doing 423
so we have identified an abrupt change in whole-rock and zircon geochemistry at the onset of porphyry 424
mineralisation. This relates to a rapid switch in the magma plumbing system to tap a deep-seated, volatile-425
rich, zone of magma evolution in the lower crust. The rapidity of this change (~100 kyrs) shows that 426
geochemical signatures of certain plutonic and volcanic rocks can be used to interpret the specific magmatic 427
process that eventually lead to porphyry mineralisation. The results also support the contention that, in the 428
Yerington district, aplite dykes (as magmatic-hydrothermal crystal mush conduits) were the main transport 429
mechanism for porphyry-mineralising fluids from the most evolved internal portions of a voluminous upper 430
crustal pluton32. These findings provide an improved framework for new conceptual models for magmatic 431
systems and batholith construction, porphyry mineralisation, as well as relationships to volcanism. Isolating 432
short-timescale fluctuations that can be linked to abrupt changes in magmatic plumbing, from the melt 433
extraction zone within the lower crust, in addition to the longer, tectonically-driven multi-million year 434
timescales of arc-scale magmatic evolution, allows for the refinement and increased efficacy of geochemical 435
“fertility indicator” tools that extend into the volcanic environment, to aid exploration for the next generation 436
of ore deposits. 437
438

13
Data availability 439
All data supporting the findings of this study are available within the paper and its Supplementary files. 440
441
Acknowledgments 442
L. Carter is supported by a NERC GW4+ Doctoral Training Partnership studentship from the Natural 443
Environment Research Council [NE/L002434/1], with additional support from the Natural History Museum, 444
London and the British Geological Survey, Keyworth. This work was supported by a NERC Isotope 445
Geosciences Facilities grant [IP-1876-1118] and from the NERC Highlight Topic project “From Arc Magmas 446
to Ores (FAMOS): A Mineral Systems Approach” [NE/P017452/1]. D. Selby acknowledges the Total 447
Endowment Fund and the CUG (Wuhan) scholarship. L. Carter is thankful for additional funding from the 448
Society of Economic Geologists Foundation’s Hugh McKinstry Fund. D. First, Quaterra Resources and 449
Hudbay Resources (previously Mason Resources) are thanked for introductions, access to drill core and field 450
support. SelFrag AG are thanked for use of their EPF device. S. Pendray (Camborne School of Mines, 451
University of Exeter) and A. Wood (British Geological Survey, Keyworth) are thanked for supporting sample 452
preparation. T. Barry, L. Marvin-Dorland and A. Cox (University of Leicester) are thanked for whole-rock XRF 453
and ICP-MS analysis. J. Wilkinson (Natural History Museum, London), J. Blundy (University of Oxford) and 454
D. Smith (University of Leicester) are thanked along with other members of the FAMOS consortium for fruitful 455
proof of concept discussions. 456
457
Author Contributions 458
L.C.C and B.J.W performed field studies. L.C.C carried out petrographic and textural studies. L.C.C., S.R.T 459
and D.B.P. performed sample preparation. L.C.C. and Y.B. performed LA-ICP-MS analyses at the Natural 460
History Museum, London. S.R.T. performed zircon CA-ID-TIMS analyses and I.M. performed zircon Hf-Lu 461
isotope analyses at the British Geological Survey, Keyworth. D.S. performed molybdenite Re-Os analyses 462
at Durham University. L.C.C. wrote the first draft of the manuscript and prepared the figures. All authors 463
contributed to the final version of the manuscript. 464
465
Competing Interests 466
The authors declare no competing interests. 467
468

14
Methods 469
The fundamental first-order controls for this study are from field observations of cross-cutting relationships, 470
disequilibrium phenomena and textures indicative or fluid exsolution and mineralisation in outcrop across the 471
Yerington District and drillcore from the Ann Mason and Yerington porphyry copper deposits. Based on these 472
observations, select samples were chosen for whole-rock XRF and ICP-MS analysis (Supplementary Data 473
2), zircon LA-ICP-MS (Supplementary Data 3) analysis, zircon U-Pb CA-ID-TIMS and Re-Os molybdenite 474
geochronology (Supplementary Data 1) and zircon Lu-Hf isotope analysis (Supplementary Data 4). 475
476
Electric Pulse Fragmentation (EPF) 477
Initial sample preparation for subsequent whole-rock and zircon analyses was by electric pulse fragmentation 478
(EPF), also known as electrodynamic fragmentation (EDF), electrical disintegration (ED) and electric pulse 479
disaggregation (EPD)71,72. EPF utilises highly energetic (150–750 J/pulse) pulsed electrical discharges with 480
a fast pulse rise time (<500 ns) to break composite materials apart along internal compositional or mechanical 481
boundaries. Samples are submerged in a dielectric process medium such as water, which is more resistive 482
than solids at these pulse rise times, resulting in the discharge being forced through the relatively conductive 483
solid and along internal phase boundaries such as mineral-mineral contacts. Each discharge event is a 484
movement of electrons from the working electrode to the ground electrode as a plasma channel71,73. The 485
rapid formation of this plasma channel causes explosive expansion within the material along the discharge 486
pathway71,72. In addition to direct breakage from the plasma channel, this explosion creates a shockwave that 487
propagates through the material. Varying elasticity moduli between minerals results in shear stresses being 488
focussed on mineral contact surfaces, causing intra-mineral breakage and disaggregating the rock. This 489
tensile intra-mineral breakage is less damaging to individual minerals which are liberated from the rock larger 490
and more intact than mechanical crushing. 491
492
The treatment was conducted using the ‘Lab’, a laboratory scale EPF device for the batch processing of 493
material, manufactured by SELFRAG AG, Switzerland. The Lab is designed to process samples of up to 494
approximately 1 L volume, or single particles with a top passing size of 40 – 45 mm in a 4 L process vessel 495
filled with de-mineralized water. It produces high voltage (90 – 200 kV) electric discharges of short duration 496
between two electrodes: the ‘working’ electrode is immersed in the upper part of the process vessel, while 497
the bottom of the vessel constitutes the ‘counter/grounding’ electrode. The operating parameters that can be 498
changed are the discharge voltage, electrode gap, pulse repetition rate and number of electric pulses applied 499
to the sample, with treatment conditions for this work listed in Table 1. Further information on the Lab system 500
can be found in 74. 501
502
Table 1 Treatment conditions for electric pulse fragmentation. 503
Vessel
(open/closed)
Sieve
Aperture
Voltage Pulse Repetition
Rate
Electrode Gap Pulses Per
Cycle
Open 2 mm 180 kV 5 Hz 40 mm 100
504
Samples were manually crushed to 40 – 45 mm to fit into the process vessel. From optical studies the zircons 505
have an average grain diameter of ~250 microns which guided selection of an appropriate aperture sieve for 506

15
the SELFRAG open process vessel. Appropriate sieve aperture diameter is generally equal to 10x the target 507
particle diameter. A series of 100 pulses were applied to the sample followed by visual inspection of the 508
remaining sample; if >10 % if the sample remained above the sieve, another cycle of 100 pulses were 509
administered. When >90 % of sample material had passed through the sieve, treatment was stopped, and 510
the sample recovered from the process vessel collection cup before drying at 70°C. 511
512
Whole-Rock XRF and ICP-MS analysis, and CIPW Normative Mineralogy 513
Fully quantitative X-ray fluorescence (XRF) for whole-rock geochemistry was performed at the University of 514
Leicester’s Department of Geology on a PANalytical Axios Advanced XRF spectrometer. Major elements 515
were determined on fused glass beads (prepared from ignited powders; sample to flux ratio 1:5, 80% Li 516
metaborate: 20% Li tetraborate flux) and trace elements were analysed on pressed powder briquettes (32 517
mm diameter; 7.5 g sample mixed with 15-20 drops 7% PVA solution as binding agent, pressed at 10 tons 518
per sq. inch). Major element results were quoted as component oxide weight percent, re-calculated to include 519
loss on ignition (LOI). Information on the standards analysed and the accuracy and precision of the XRF 520
analysis is available in Supplementary Data 2. 521
522
Inductively coupled plasma mass spectrometry (ICP-MS) for whole-rock trace element geochemistry was 523
also performed at the University of Leicester’s Department of Geology on a ThermoScientific ICAP-Qc 524
quadrupole ICP mass spectrometer. Analysis for rare earth elements (REEs), Hf, Sr and Y was performed 525
on solution from the same fused glass beads used for XRF analysis. Information on the standards analysed 526
and the accuracy and precision of the ICP-MS analysis is available in Supplementary Data 2. 527
528
Whole-rock XRF geochemistry was used to calculate CIPW normative mineralogy (method of 70, after 75). 529
Normative mineralogy data was then plotted on the H2O-saturated melt minima ternary plot61 to estimate the 530
pressures of melt differentiation54 of H2O-saturated melts. Assuming lithostatic conditions, pressures from 531
this plot were used to equate approximate depths of melt differentiation using P = ρgh and assuming an 532
average overburden density of 2.5 g/cm3. 533
534
Zircon Separation 535
Zircons were separated from disaggregated samples at the British Geological Survey, Keyworth, using the 536
sequentially described circuit: Sieve to <500 μm using a Fritsch automatic sieve; Pass the <500 μm fraction 537
over a Gemini water table, twice; Separate non-magnetic minerals using a Frantz isodynamic separator - 538
subsequent paramagnetic charges of 0.1 A, 0.3 A, 0.7 A, 1.1 A and 1.7 A were used to reduce the bulk 539
material in stages; Perform gravity separation utilising methylene iodide (ca. 3.32 SG) as a density medium. 540
The final zircon (amongst other phases) separate was thermally annealed at 900°C for 12 hours. Annealed 541
zircon grains were then picked by hand and prepared as polished blocks. Cathodoluminescence (CL) images 542
of these were generated by SEM-CL, using an FEI Quanta 650F FEG-SEM equipped with a Gatan 543
monochrome CL detector at the University of Exeter’s Environment and Sustainability institute operating at 544
an accelerating voltage of 20 kV, as well as using a CITL Mk5 electron source, operating at approximately 545
250 uA and 10 kV. For the latter, images were captured using a Nikon DS-Ri2 camera, attached to a 546
petrographic microscope, and operated using NiS-elements software. Images were captured in a darkened 547
room, with an exposure time of 2 seconds. 548

16
549
Zircon LA-ICP-MS 550
Zircon cores and rims were analysed for their trace element geochemistry in the LODE Laboratory at the 551
Natural History Museum, London, using an ESI (New Wave Research) NWR193 excimer laser coupled to 552
an Agilent 7700x quadrupole ICP-MS. Individual zircon grains were located using images obtained by cold-553
cathode CL and SEM-CL at Camborne School of Mines. A spot size of 30 μm was used and ablation was 554
performed at a repletion rate of 5 Hz and fluence of 3.5 J/cm2. For each spot, approximately 20 seconds of 555
background signal followed by 40 seconds of signal acquisition during ablation. Analytical conditions, 556
including isotopes measured and dwell times are summarised in Supplementary Data 3. 557
558
Zircon U-Pb CA-ID-TIMS geochronology 559
Chemical abrasion isotope dilution thermal ionization mass spectrometry (CA-ID-TIMS) U-Pb zircon 560
geochronology was undertaken at the Geochronology and Tracers Facility, British Geological Survey, 561
Keyworth. After thermal annealing at 900°C zircon were chemically abraded at 190 °C for 12 hours following 562
76. The methodology for all other analytical procedures, instrumental conditions, corrections and data 563
reduction follows that outlined in detail in 77 using the ET(2)535 tracers78,79. Isotope ratio measurements were 564
made using a Thermo Triton thermal ionization mass-spectrometer (TIMS), with the U decay constants of 80, 565
the 238U/235U ratio of 81, and the decay constants for 230Th of 82. The 206Pb/238U dates were corrected for initial 566
230Th disequilibrium83 upon zircon crystallisation using the zircon/melt partition coefficient fTh/U of 0.24684. 567
Results are reported in Supplementary Data 1. 568
569
The estimate of crystallisation ages are selected from the 206Pb/238U (Th corrected) weighted mean of the 570
youngest population of data where the date had a statistically acceptable MSWD (Mean square of weighted 571
deviates) for the given population size and attributed 2σ uncertainties, indicating that any dispersion between 572
the selected analyses can be attributable to the measurement of a single population. All samples, with the 573
exception of the volcanic sample BS1, display over-dispersion between the dates of individual zircons or 574
zircon fragment dates in excess of that expected due to analytical scatter. Dates that are older than the 575
statistically valid weighted mean single population are attributed to antecrystic zircon growth, either being 576
sourced from deeper within the magmatic system than the emplacement level or due to protracted 577
crystallisation of zircon upon emplacement. To further evaluate the sensitivity of the age interpretation to the 578
selection of dates we evaluated two further scenarios of date calculation: 1) Selecting the youngest date as 579
being representative of youngest zircon growth; 2) selecting the weighted mean date of the youngest three 580
dates that give a statistically acceptable MSWD. These evaluations of date selections are provided in 581
Supplementary Data 1, and illustrate that regardless of the approach adopted the timescales we discuss are 582
robust. 583
584
When comparing dates either internally or to other data sets that are undertaken with the Earthtime mixed 585
U-Pb tracers78,79 only the analytical uncertainties need to be considered. To evaluate U-Pb dates against 586
other isotopic systems, systematic uncertainties must also be acknowledged within the interpretation. The 587
total uncertainty including systematic components from tracer calibration and decay constants are provided 588
with age interpretations in Supplementary Data 1. For comparison with the Re-Os dates where they include 589

17
the Re-Os decay constant uncertainty we recommend that only the tracer calibration uncertainty is 590
considered for the U-Pb data as λ187Re is derived from inter-calibration with U-Pb data85,86. 591
592
Zircon Lu-Hf Isotopes 593
The Lu-Hf fractions were obtained from elements eluted under 3M HCl within the ion exchange U and Pb 594
purification scheme during CA-ID-TIMS U-Pb analysise.g.87. Results of the Lu-Hf isotope analysis 595
(Supplementary Data 4) therefore correspond to the same volume of material as the associated zircon U-Pb 596
date. By selecting zircon from the young weighted mean population this provides temporal constraints that 597
the volume best captures the nature of the melt upon emplacement. The Lu and Hf elution was dried at 70°C 598
to a chloride before being dissolved in 1 ml of 2% HNO3 + 0.1M HF, prior to analysis on a Thermo-Electron 599
Neptune Plus mass spectrometer, using a Cetac Aridus II desolvating nebuliser. 0.006 l/min of nitrogen were 600
introduced via the nebulizer in addition to Ar in order to minimise oxide formation. The instrument was 601
operated in static multicollection mode, with cups set to monitor 172Yb, 173Yb, 175Lu, 176Lu+Hf+Yb, 177Hf, 178Hf, 602
179Hf and 180Hf. 1% dilutions of each sample were tested prior to analysis, and samples diluted to c. 20ppb. 603
Standard sample cones and X-skimmer cones were used, giving a typical signal of c. 800-1000 V/ppm Hf. 604
Correction for 176Yb on the 176Hf peak was made using reverse-mass-bias correction of the 176Yb/173Yb ratio 605
empirically derived using Hf mass-bias corrected Yb-doped JMC475 solutions88. 176Lu interference on the 606
176Hf peak was corrected by using the measured 175Lu and assuming 176Lu/175Lu = 0.02653. Data are reported 607
relative to 179Hf/177Hf = 0.7325. The Hf standard solution JMC475 was analysed during each analytical 608
session and sample 176Hf/177Hf ratios are reported relative to a value of 0.282160 for this standard88. Eleven 609
analyses of JMC475 gave a mean 176Hf/177Hf value of 0.282146 ± 0.000007 (1σ). Typical external precision 610
was in the range between 13-22 ppm. Data were reduced with an in-house calculation and time corrected 611
values include uncertainty propagated from the weighted mean date of the sample. 612
613
Rhenium-Osmium molybdenite geochronology 614
Molybdenite Re-Os ages were determined for a quartz-chalcopyrite-molybdenite quartz vein (sample AC12) 615
and molybdenite paint vein (sample AC21MP) sampled from drill core from the Ann Mason porphyry deposit. 616
Sample details in Supplementary Data 1 and Fig. S5. 617
618
The Re-Os molybdenite analysis were carried out in the Source Rock and Sulfide Geochemistry and 619
Geochronology, and Arthur Holmes Laboratories at University of Durham (United Kingdom) to establish the 620
Re-Os age of molybdenite mineralisation. A total of five analyses were conducted. One from sample AC12 621
and four from sample AC21MP (For which sample AC21MP was approximately split into four equal 622
subsamples; Fig. S5). Pure molybdenite separates were obtained from the silicate matrix was achieved using 623
the HF purification method89, and then further purified (removal of any pyrite and/or chalcopyrite and 624
undissolved silicate phases) by hand under a binocular microscope. 625
626
An aliquant of the molybdenite separate (~20 mg) together with a known amount of tracer solution (185Re + 627
Os bearing a normal isotope composition) were placed into a carius tube and digested with 3mL HCl and 628
6mL HNO3 at 220°C for 23 hrs. Osmium was isolated and purified using solvent extraction (CHCl3) and micro-629
distillation methods, with the resulting Re-bearing fraction purified using NaOH-Acetone solvent extraction 630

18
and anion chromatography90,91. Although negligible in comparison to the Re and Os abundance in the 631
molybdenite, the final Re-Os data are blank corrected. A full analytical protocol blank run parallel with the 632
molybdenite analysis yields 3.9 pg Re and 0.5 pg Os, the latter possessing a 187Os/188Os composition of 0.21 633
± 0.2. Data treatment follows that outlined in 91. All Re-Os data are given with 2σ absolute uncertainties 634
(Supplementary Data 1). Molybdenite Re-Os ages are calculated using a 187Re decay constant of 1.666×10-635
11 y-1 with an uncertainty of 0.31%85,86. The Henderson molybdenite reference material (RM8599) analyzed 636
during the course of this study yields a Re-Os age of 27.62 ± 0.11 (2σ; n = 1), which is in good agreement 637
with the recommended value of 27.66 ± 0.10 Ma92-93, and that reported by 91 (27.695 ± 0.038 Ma, n = 9) and 638
previous analysis at Durham (e.g., 27.65 ± 0.12 Ma89). 639
640

19
References 641
1. Jowitt, S. M., Mudd, G. M. & Thompson, J. F. H. Future availability of non-renewable metal resources and the influence of 642 environmental, social, and governance conflicts on metal production. Commun Earth Environ 1, 13 (2020). 643 https://doi.org/10.1038/s43247-020-0011-0 644
645 2. Herrington, R. Mining our green future. Nat. Rev. Mater. (2021). https://doi.org/10.1038/s41578-021-00325-9 646
647 3. Elshkaki, A., Graedel T. E., Ciacci, L. & Reck, B. K. Copper demand, supply, and associated energy use to 2050. Global 648
Environmental Change 39, 305-315 (2016). https://doi.org/10.1016/j.gloenvcha.2016.06.006 649 650
4. Watari, T., Nansai, K. & Nakajima, K. Major metals demand, supply, and environmental impacts to 2100: A critical review. 651 Resources, Conservation and Recycling 164, 105107 (2021). https://doi.org/10.1016/j.resconrec.2020.105107 652
653 5. Sillitoe, R. H. Porphyry Copper Systems. Econ. Geol. 105, 3-41 (2010). https://doi.org/10.2113/gsecongeo.105.1.3 654
655 6. Richards, J. P. Cumulative factors in the generation of giant calc-alkaline porphyry Cu deposits. In: Porter, T.M. (ed.), Super 656
porphyry copper and gold deposits: A global perspective, v. 1: Adelaide, PGC Publishing, 7−25 (2005). 657 658
7. Wilkinson, J. J. Triggers for the formation of porphyry deposits in magmatic arcs. Nature Geoscience 6, 917-925 (2013). 659 https://doi.org/10.1038/ngeo1940 660
661 8. Richards, J. P. Tectonic, magmatic, and metallogenic evolution of the Tethyan orogen: From subduction to collision. Ore 662
Geol. Rev. 70, 323-345 (2015). https://doi.org/10.1016/j.oregeorev.2014.11.009 663 664
9. Cashman, K. V., Stephen, R. J. & Blundy, J. D. Vertically extensive and unstable magma systems: A unified view of igneous 665 processes. Science 355, 6331 (2017). https://doi.org/10.1126/science.aag3055 666
667 10. Cooke, D. R., Agnew, P., Hollings, P. et al. Porphyry indicator minerals (PIMS) and porphyry vectoring and fertility tools 668
(PVFTS) – Indicators of mineralisation styles and recorders of hypogene geochemical dispersion halos. In: Tschirhart, V. 669 & Thomas, M. D. (eds.) Proceedings of Exploration 17: Sixth Decennial International Conference on Mineral Exploration, 670 457-470 (2017). 671
672 11. Rohrlach, B. & Loucks, R. Multi-million-year cyclic ramp-up of volatiles in a lower crustal magma reservoir trapped below 673
the Tampakan copper-gold deposit by Mio-Pliocene crustal compression in the southern Philippines. Adelaide, PGC Publ. 674 2:369–407 (2005). 675
676 12. Richards, J. P. High Sr/Y arc magmas and porphyry Cu±Mo±Au deposits: Just add water. Econ. Geol. 106(7), 2075-1081 677
(2011). https://doi.org/10.2113/econgeo.106.7.1075 678 679 13. Chiaradia, M., Ulianov, A., Kouzmanov, K. et al. Why large porphyry Cu deposits like high Sr/Y magmas? Sci. Rep. 2, 685 680
(2012). https://doi.org/10.1038/srep00685 681 682 14. Chiaradia, M. Crustal thickness control on Sr/Y signatures of recent arc magmas: an Earth scale perspective. Sci. 683
Rep. 5, 8115 (2015). https://doi.org/10.1038/srep08115 684 685 15. Richards, J. P. High Sr/Y Magmas Reflect Arc Maturity, High Magmatic Water Content, and Porphyry Cu ± Mo ± Au 686
Potential: Examples from the Tethyan Arcs of Central and Eastern Iran and Western Pakistan. Econ. Geol. 107(2), 295-687 332 (2012). https://doi.org/10.2113/econgeo.107.2.295 688
689 16. Loucks, R. R. Distinctive composition of copper-ore-forming arc magmas. Aust. J. Earth Sci. 61, 5–16 (2014). 690
https://doi.org/10.1080/08120099.2013.865676 691 692
17. Lu, Y., Loucks, R. R., Fiorentini, M. et al. Zircon Compositions as a Pathfinder for Porphyry Cu ± Mo ± Au Deposits. Society 693 of Economic Geologists. Special Publications Series 19, 329-347 (2016). https://doi.org/10.5382/SP.19.13 694
695 18. Williamson, B., Herrington, R. & Morris, A. Porphyry copper enrichment linked to excess aluminium in plagioclase. Nature 696
Geosci. 9, 237–241 (2016). https://doi.org/10.1038/ngeo2651 697 698
19. Nathwani, C. L., Loader, M. A, Wilkinson, J. J. et al. Multi-stage arc magma evolution recorded by apatite in volcanic rocks. 699 Geology 48(4), 323-327 (2020). https://doi.org/10.1130/G46998.1 700
701 20. Lee, R. G., Byrne, K., D’Angela, M. et al. Using zircon trace element composition to assess porphyry copper potential of 702
the Guichon Creek batholith and Highland Valley Copper deposit, south-central British Columbia. Miner. Deposita 56, 215-703 238 (2021). https://doi.org/10.1007/s00126-020-00961-1 704
705 21. Ballard, J. R., Palin, J. M. & Campbell, I. H. Relative oxidation states of magmas inferred from Ce(IV)/Ce(III) in zircon: 706
application to porphyry copper deposits of northern Chile. Contrib. Mineral. Petrol. 144, 347-364 (2002). 707 https://doi.org/10.1007/s00410-002-0402-5 708
709 22. Chiaradia, M., Meino, D. & Spikings, R. Rapid transition to long-lived deep crustal magmatic maturation and the formation 710
of giant porphyry-related mineralization (Yanacocha, Peru). Earth. Planet. Sci. Lett. 288, 505-515 (2009) 711 712

20
23. Rezeau, H., Moritz, R., Wotzlaw, J. et al. Temporal and genetic link between incremental pluton assembly and pulsed 713 porphyry Cu-Mo formation in accretionary orogens. Geology 44(8), 627–630 (2016). https://doi.org/10.1130/G38088.1 714
715 24. Chiaradia, M. & Caricchi, L. Stochastic modelling of deep magmatic controls on porphyry copper deposit endowment. Sci. 716
Rep. 7, 44523 (2017). https://doi.org/10.1038/srep44523 717 718
25. Nathwani, C. L., Simmons A. T., Large, S. J. E. et al. From long‑lived batholith construction to giant porphyry copper deposit 719 formation: petrological and zircon chemical evolution of the Quellaveco District, Southern Peru. Contrib. Mineral. Petrol. 720 176, 12 (2021). https://doi.org/10.1007/s00410-020-01766-1 721
722 26. Richards, J. P. Tectono-Magmatic Precursors for Porphyry Cu-(Mo-Au) Deposit Formation. Econ. Geol. 98, 1515-1533 723
(2003). https://doi.org/10.2113/gsecongeo.98.8.1515 724 725
27. Dilles, J. H. Petrology of the Yerington Batholith, Nevada: Evidence for evolution of porphyry copper ore fluids. Econ. Geol. 726 82, 1750-1789 (1987). 727
728 28. Seedorff, E., Dilles, J. H., Proffett, J. M. et al. Porphyry deposits: Characteristics and origin of hypogene features. Econ. 729
Geol. 100, 251-298 (2005). 730 731
29. Seedorff, E., Barton, M. D., Stavast, W. J. A & Maher, D. J. Root Zones of Porphyry Systems: Extending the Porphyry 732 Model to Depth. Econ. Geol. 103, 939-956 (2008). 733
734 30. Weis, P., Driesner, T. & Heinrich, C. A. Porphyry-copper ore shells form at stable pressure-temperature fronts within 735
dynamic fluid plumes. Science 338, 1613-1616 (2012). https://doi.org/10.1126/science.1225009 736 737
31. Schöpa, A., Annen, C., Dilles, J. H., Sparks, R. S. J. & Blundy, J. D. Magma emplacement rates and porphyry copper 738 deposits: Thermal modeling of the Yerington Batholith, Nevada. Econ. Geol. 112, 1653-1672 (2017). 739 https://doi.org/10.5382/econgeo.2017.4525 740
741 32. Carter, L. C., Williamson, B. J., Tapster, S. R. et al. Crystal mush dykes as conduits for mineralising fluids in the Yerington 742
porphyry copper district, Nevada. Commun. Earth Environ. 2, 59 (2021). https://doi.org/10.1038/s43247-021-00128-4 743 744 33. Proffett, J. M. Cenozoic geology of the Yerington district, Nevada, and implications for the nature and origin of Basin and 745
Range faulting. GSA Bull. 88(2), 247-266 (1977). 746 747
34. Dilles, J. H. & Wright, J. E. The chronology of early Mesozoic arc magmatism in the Yerington district of western Nevada 748 and its regional implications. GSA Bull. 100(5), 644-652 (1988). 749
750 35. Dilles, J. H. & Proffett, J. M. Metallogenesis of the Yerington batholith, Nevada. In: Pierce, F. W., & Bolm, J. G. (Eds.), 751
Porphyry copper deposits of the American cordillera: Arizona Geological Society Digest, 20, 306–315 (1995). 752 753 36. Banik, T. J., Coble, M. A. & Miller, C. F. Porphyry Cu formation in the middle Jurassic Yerington batholith, Nevada, USA: 754
Constraints from laser Raman, trace element, U-Pb age, and oxygen isotope analyses of zircon. Geosphere 13(4), 1113-755 1132 (2017). https://doi.org/10.1130/GES01351.1 756
757 37. Bryan, R. C. NI 43-101 Technical Report Mineral Resource Update Yerington Copper Project Lyon County, Nevada. 758
TetraTech (2014). Available: https://quaterra.com/projects/quaterras-yerington-copper-projects/yerington-deposit/. 759 760 38. Henderson, M. R., Byan, R. C., Welhener, H. E., Jolk, R. W. & Willow, M. A. MacArthur Copper Project; Amended NI 43-761
101 Technical Report Preliminary Economic Assessment. M3 Engineering. https://quaterra.com/projects/quaterras-762 yerington-copper-projects/macarthur-copper-deposit/ (2014). 763
764 39. Hudbay Minerals Inc. Mason Preliminary Economic Assessment Summary. https://hudbayminerals.com/investors/press-765
releases/press-release-details/2021/Hudbay-Announces-Positive-Preliminary-Economic-Assessment-for-its-Mason-766 Copper-project/default.aspx (2021). 767
768 40. Proffett, J. M. Report on the geology and genesis of the Yerington porphyry copper district, Nevada, a four dimensional 769
study. Final report for: USGS mineral resource external research program grant 06HQGR0171 (2007). 770 771 41. Proffett, J. M. High Cu grades in porphyry Cu deposits and their relationship to emplacement depth of magmatic sources. 772
Geology 37(8), 675-378 (2009). https://doi.org/10.1130/G30072A.1 773 774 42. Dilles, J. H., Einaudi, M. T., Proffett, J. & Barton, M. D. Overview of the Yerington Porphyry Copper District: Magmatic to 775
Nonmagmatic Sources of Hydrothermal Fluids, Their Flow Paths, Alteration Affects on Rocks, and Cu-Mo-Fe-Au Ores. 776 Society of Economic Geologists Guidebook Series 32, 55-66 (2000). https://doi.org/10.5382/GB.32 777
778 43. Candela, P. A. A review of shallow, ore-related granites: Textures, volatiles, and ore metals. J. Petrol. 38(12), 1619-1633 779
(1997). 780 781
44. Gustafson, L. B. & Hunt, J. P. The porphyry copper deposit at El Salvador, Chile. Econ. Geol. 70, 857-912 (1975). 782 783
45. Kirwin, D. J. Unidirectional solidification textures associated with intrusion-related Mongolian mineral deposits. In: 784 Seltmann, R., Gerel, O., & Kirwin, D.J., (eds.), Geodynamics and metallogeny of Mongolia with special emphasis on copper 785 and gold deposits: Society of Economic Geologists-International Association for the Genesis of Ore Deposits Field Trip, 786 2005: IAGOD Guidebook Series 11: London, Centre for Russian and Central EurAsian Mineral Studies, Natural History 787

21
Museum, 63−84 (2005). 788 789
46. Candela, P. A. Felsic magmas, volatiles, and metallogenesis. In: Whitney, J. A. & Naldrett, A. J. (Eds.), Ore Deposition 790 Associated with Magmas. Reviews in Economic Geology, 223-233 (1989). 791
792 47. Menand, T. Physical controls and depth of emplacement of igneous bodies: A review. Tectonophysics 500(1-4), 11-19 793
(2011). https://doi.org/10.1016/j.tecto.2009.10.016 794 795 48. Luhr, J. F., Carmicheal, I. S. E. & Varekamp, J. C. The 1982 eruptions of El Chichón Volcano, Chiapas, Mexico: Mineralogy 796
and petrology of the anhydritebearing pumices. J. Volcanol. Geotherm. 23(1-2), 69-108 (1984). 797 https://doi.org/10.1016/0377-0273(84)90057-X 798
799 49. Nandedkar, R. H., Hürlimann, N., Ulmer, P. & Müntener, O. Amphibole–melt trace element partitioning of fractionating 800
calc‑alkaline magmas in the lower crust: an experimental study. Contrib. Mineral. Petrol. 171, 71 (2016). 801 https://doi.org/10.1007/s00410-016-1278-0 802
803 50. Aigner-Torres, M., Blundy, J., Ulmer, P. & Pettke, T. Laser Ablation ICPMS study of trace element partitioning between 804
plagioclase and basaltic melts: An experimental approach. Contrib. Mineral. Petrol. 153, 647–667 (2007). 805 https://doi.org/10.1007/s00410-006-0168-2 806
807 51. Sisson, T. W. Hornblende-melt trace-element partitioning measured by ion microprobe. Chemical Geology 117(1-4), 331-808
344 (1994). 809 810 52. Claiborne, L. L., Miller, C. F., Walker, B. A. et al. (2006) Tracking magmatic processes through Zr/Hf rations in rocks and 811
Hf and Ti zoning in zircons: An example from the Spirit Mountain batholith, Nevada. Mineral. Mag. 70:517–543 (2006). 812 813 53. Burnham, A. Key concepts in interpreting the concentrations of the rare earth elements in zircon. Chem. Geol. 551, 119765 814
(2020). https://doi.org/10.1016/j.chemgeo.2020.119765 815 816
54. Annen, C., Blundy, J. D. & Sparks R. S. J. The Genesis of Intermediate and Silicic Magmas in Deep Crustal Hot Zones. 817 Jour. Petrol. 47(3), 505-539 (2006). https://doi.org/10.1093/petrology/egi084 818
819 55. Loader, M. A., Wilkinson, J.J. & Armstrong, R. N. The effect of titanite crystallisation on Eu and Ce anomalies in zircon 820
and its implications for the assessment of porphyry Cu deposit fertility. Earth Planet. Sci. Lett. 472, 107-119 (2017). 821 https://doi.org/10.1016/j.epsl.2017.05.010 822
823 56. Watson, E. B. & Harrison, T. M. Zircon thermometer reveals minimum melting conditions on earliest earth. Science 308, 824
841-844 (2005). https://doi.org/10.1126/science.1110873 825 826
57. Taylor, H. P. The effects of assimilation of country rocks by magmas on 18O/16O and 87Sr/86Sr systematics of igneous 827 rocks. Earth. Planet. Sci. Lett. 47, 243-254 (1980). 828
829 58. Valley, J. W. Oxygen isotopes in zircon. Rev. Mineral. Geochem. 53(1), 343-385 (2003). https://doi.org/10.2113/0530343 830 831 59. Bindeman, I. Oxygen isotopes in mantle and crustal magmas as revealed by single crystal analysis. Rev. Mineral. 832
Geochem. 69, 445-478 (2008). https://doi.org/10.2138/rmg.2008.69.12 833 834 60. Tuttle, O. F. & Bowen, N. L. Origin of granite in the light of experimental studies in the system NaAlSi3O8-KAlSi3O8-SiO,-835
H,O. Geol. Soc. Am. Mem. 74, 153 (1958). 836 837 61. Blundy, J. & Cashman, K. Ascent-driven crystallisation of dacite magmas at Mount St Helens, 1980-1986. Contrib. Mineral. 838
Petrol. 140, 631-650 (2001). https://doi.org/10.1007/s004100000219 839 840 62. Smith, D. Clinopyroxene precursors to amphibole sponge in arc crust. Nat. Commun. 5, 4329 (2014). 841
https://doi.org/10.1038/ncomms5329 842 843
63. Romero, B., Kojima, S, Wong, C. et al. Molybdenite mineralization and Re-Os geochronology of the Escondida and 844 Escondida Norte porphyry deposits, Northern Chile. Resour. Geol. 61(1), 91-100 (2010). https://doi.org/10.1111/j.1751-845 3928.2010.00150.x 846
847 64. Stein H. J. Dating and Tracing the History of Ore Formation. In: Holland H. D. and Turekian K. K. (eds.) Treatise on 848
Geochemistry, Second Edition, 13, 87-118. Oxford: Elsevier (2014). 849 850
65. Chang, J., Li, J.-W., Selby, D., Liu, J.-C. & Deng, X.-D. Geological and chronological constraints on the long-lived Eocene 851 Yulong porphyry Cu-Mo deposit, eastern Tibet, China: implications for lifespan of magmatic-hydrothermal processes 852 forming giant and supergiant porphyry Cu deposits. Econ. Geol. 112(7), 1719-1746 (2017). 853 https://doi.org/10.5382/econgeo.2017.4527 854
855 66. Dilles, J. H., Kent, A. J. R., Wooden, J. L. et al. (2015) Zircon compositional evidence for sulfur-degassing from ore-forming 856
arc magmas. Econ. Geol. 110, 241–251 (2015). https://doi.org/10.2113/econg eo.110.1.241 857 858
67. Hudson, D. M. & Oriel, W. M. Geologic map of the Buckskin Range, Nevada. Nevada Bureau of Mines and Geology, map 859 64 (1979). 860
861 68. Proffett, J. M. & Dilles, J. H. Geological map of the Yerington district, Nevada: Nevada Bureau of Mines and Geology, map 862
22
77 (1984). 863 864
69. McDonough, W. F. & Sun, S. S. The composition of the Earth. Chem. Geol. 120, 223-253 (1995). 865 866
70. Lowenstern, J. B. C.I.P.W. norm. Calculator. USGS (2000). 867 https://volcanoes.usgs.gov/observatories/yvo/jlowenstern/other/software_jbl.html 868
869 71. Andres, U., Jirestig, J. & Timoshkin, I. Liberation of minerals by high-voltage electrical pulses, Powder Technology 104, 870
37–49 (1999). https://doi.org/10.1016/S0032-5910(99)00024-8 871 872 72. Bluhm, H., Frey, W., Giese, H. et al. Application of pulses HV discharges to material fragmentation and recycling, IEEE 873
Trans. Dieletr. Electr. Insul. 7, 625–636, (2000). 874 875
73. van der Wielen, K. P. Application of high voltage breakage to a range of rock types of varying physical properties. Ph.D. 876 thesis, Camborne School of Mines, University of Exeter, UK (2013). 877
878 74. Bru, K., Beaulieu, M., Sousa, R., et al. 2020. Comparative laboratory study of conventional and Electric Pulse 879
Fragmentation (EPF) technologies on the performances of the comminution and concentration steps for the beneficiation 880 of a scheelite skarn ore. Minerals Engineering 150, 106302 (2020). https://doi.org/10.1016/j.mineng.2020.106302 881
882 75. Kelsey, C. H. Calculation of the C.I.P.W. norm. Mineral. Mag. 34, 276-282 (1965). 883
884 76. Mattinson, J. M. Zircon U-Pb chemical abrasion (“CA-TIMS”) method: Combining annealing and multi-step partial 885
dissolution analysis for improved precision and accuracy of zircon ages. Chem. Geol. 220(1-2), 47-66 (2005). 886 https://doi.org/10.1016/j.chemgeo.2005.03.011 887
888 77. Tapster, S., Condon, D.J., Naden, J. et al. Rapid thermal rejuvenation of high-crystallinity magma linked to porphyry copper 889
deposit formation; evidence from the Koloula Porphyry Prospect, Solomon Islands. Earth. Planet. Sci. Lett. 442, 206-217 890 (2016). https://doi.org/10.1016/j.epsl.2016.02.046 891
892 78. Condon, D. J., Schoene, B., McLean, N. M., et al. Metrology and Traceability of U-Pb Isotope Dilution Geochronology 893
(EARTHTIME Tracer Calibration Part I). Geochim. Cosmochim. Acta. 164, 464-480 (2015). 894 https://doi.org/10.1016/j.gca.2015.05.026 895
896 79. McLean, N. M., Condon, D. J. Schoene, B. & Bowring, S. A. Evaluating uncertainties in the calibration of isotopic reference 897
materials and multi-element isotopic tracers (EARTHTIME Tracer Calibration Part II). Geochim. Cosmochim. Acta. 164, 898 481-501 (2015). https://doi.org/10.1016/j.gca.2015.02.040 899
900 80. Jaffey, A. H., Flynn, K. F., Glendenin, L. E. et al. Precision Measurement of Half-Lives and Specific Activities of U-235 and 901
U-238. Phys. Rev. 4(5), 1889-1906 (1971). 902 903 81. Hiess, J., Condon, D. J., McLean, N., & Noble, S. R. U-238/U-235 Systematics in Terrestrial Uranium-Bearing Minerals. 904
Science 335(6076), 1610-1614 (2012). https://doi.org/10.1126/science.1215507 905 906 82. Cheng, H. Edwards, R. L. Hoff, J. et al. The half-lives of uranium-234 and thorium-230. Chem. Geol. 169(1-2), 17-33 (2000). 907
https://doi.org/10.1016/S0009-2541(99)00157-6 908 909 83. Schärer, U. The effect of initial 230Th disequilibrium on young U-Pb ages: the Makalu case, Himalaya. Earth. Planet. Sci. 910
Lett. 67, 191-204 (1984). 911 912
84. Rubatto, D. & Hermann, J. Experimental zircon/melt and zircon/garnet trace element partitioning and implications for the 913 geochronology of crustal rocks. Chem. Geol. 241, 38–61 (2007). https://doi.org/10.1016/j.chemgeo.2007.01.027 914
915 85. Smoliar, M. I., Walker, R. J., & Morgan, J. W. Re-Os ages of group IIA, IIIA, IVA, and IVB iron meteorites. Science 271, 916
1099–1102 (1996). 917 918
86. Selby, D., Creaser, R. A., Stein, H. J. et al. Assessment of the 187Re decay constant by cross calibration of Re–Os 919 molybdenite and U–Pb zircon chronometers in magmatic ore systems. Geochim. Cosmochim. Acta. 71(8), 1999-2013 920 (2007). https://doi.org/10.1016/j.gca.2007.01.008 921
922 87. Schoene, B., Latkoczy, C., Schaltegger, U. & Günther, D. A new method integrating high-precision U-Pb geochronology 923
with zircon trace element analysis (U-Pb TIMS-TEA). Geochim. Cosmochim. Acta. 74(24), 7144-7159 (2010). 924 https://doi.org/10.1016/j.gca.2010.09.016 925
926 88. Nowell, G.M. & Parrish, R.R. Simultaneous acquisition of isotope compositions and parent/daughter ratios by non-isotope 927
dilution-mode plasma ionisation multi-collector mass spectrometry (PIMMS). In Plasma Source Mass Spectrometry: The 928 New Millennium (Holland, G. & Tanner, S.D. eds) Royal Soc. Chem.,Spec. Publ. 267, 298-310 (2001). 929
930 89. Lawley, C. J. M. & Selby, D. Re-Os Geochronology of Quartz Enclosed Ultra-fine Molybdenite: Implications for Ore 931
Geochronology. Econ. Geol. 107(7), 1499-1506 (2012). https://doi.org/10.2113/econgeo.107.7.1499 932 933
90. Selby, D. & Creaser, R. A. Macroscale NTIMS and microscale LA-MC-ICP-MS Re-Os isotopic analysis of molybdenite: 934 Testing spatial restrictions for reliable Re-Os age determinations, and implications for the decoupling of Re and Os within 935 molybdenite. Geochim. Cosmochim. Acta. 68, 3897-3908 (2004). https://doi.org/10.1016/j.gca.2004.03.022 936

23
937 91. Li, Y., Selby, D., Condon, D. & Tapster, S. Cyclic magmatic-hydrothermal evolution in porphyry systems: High-precision U-938
Pb and Re-Os geochronology constraints from the Tibetan Qulong porphyry Cu-Mo deposit. Econ. Geol. 112(6), 1419-939 1440 (2017). https://doi.org/10.5382/econgeo.2017.4515 940
941 92. Markey, R., Stein, H. J., Hannah, J. L. et al. Standardizing Re-Os geochronology: A new molybdenite reference material 942
(Henderson, USA) and the stoichiometry of Os salts. Chem. Geol. 244, 74–87 (2007). 943 944 93. Zimmerman, A., Stein, H. J., Morgan, J. W., Markey, R. J., & Watanabe, Y. Re-Os geochronology of the El Salvador 945
porphyry Cu-Mo deposit, Chile: Tracking analytical improvements in accuracy and precision over the past decade. 946 Geochim. Cosmochim. Acta. 131, 13–32 (2014). 947
948

24
Supplementary Data 949
1/ Zircon U-Pb CA-ID-TIMS and molybdenite Re-Os geochronology data 950
2/ Whole-rock XRF & ICP-MS geochemistry data 951
3/ Zircon LA-ICP-MS data 952
4/ Zircon Lu-Hf isotope data 953
954
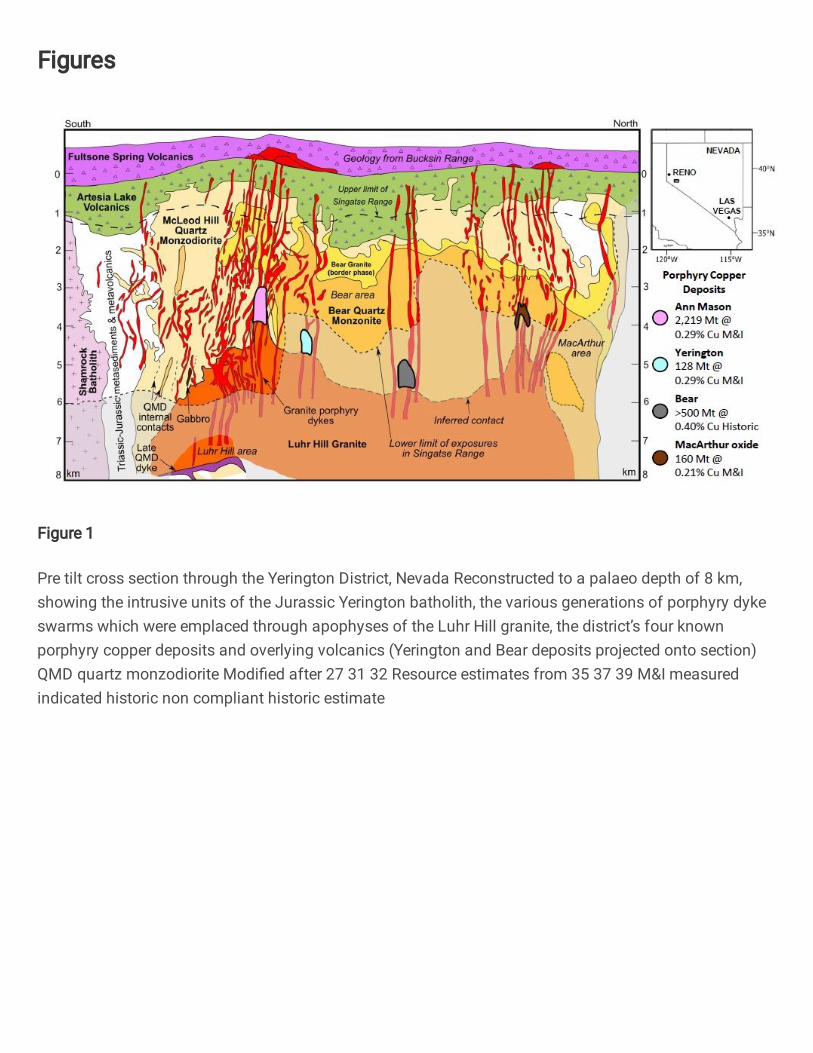
Figures
Figure 1
Pre tilt cross section through the Yerington District, Nevada Reconstructed to a palaeo depth of 8 km,showing the intrusive units of the Jurassic Yerington batholith, the various generations of porphyry dykeswarms which were emplaced through apophyses of the Luhr Hill granite, the district’s four knownporphyry copper deposits and overlying volcanics (Yerington and Bear deposits projected onto section)QMD quartz monzodiorite Modi�ed after 27 31 32 Resource estimates from 35 37 39 M&I measuredindicated historic non compliant historic estimate

Figure 2
Simpli�ed geological map of the Yerington District, Nevada annotated with known major mineral depositsand localities sampled for zircon U Pb CA ID TIMS geochronology (Fig 4 Geology is modi�ed from 34 6768 QM quartz monzonite, QMD quartz monzodiorite WGS 1984

Figure 3
Temporal relations in the Yerington magmatic system Field photographs of a cross cutting relations ofmultiple porphyry dyke generations which cut the LHG cupola b lobate contacts and evidence formingling of co eval magmas between an aplite dyke and porphyry dyke Secondary copper stainingprevalent in the aplite dyke c d, multiple generations of aplite dykes hosting pegmatitic segregations andmineralised miarolitic cavities (MC The aplite dykes sharply cross cut the cupola zone of the LHG and a
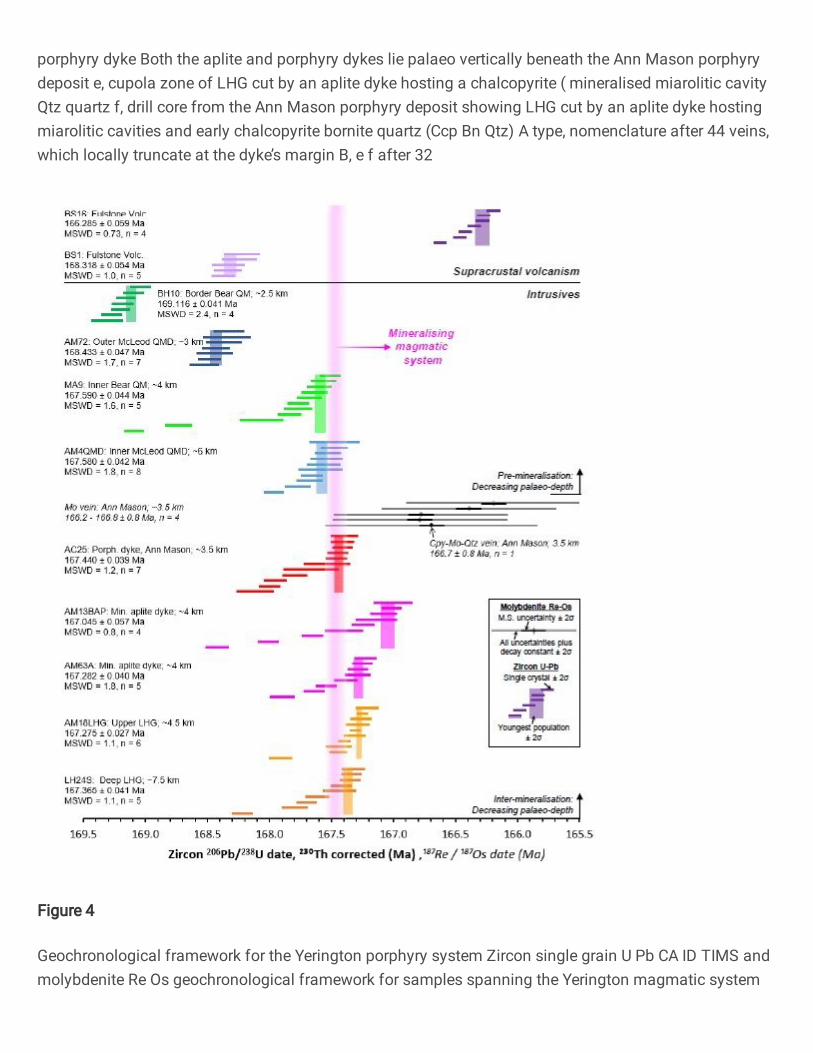
porphyry dyke Both the aplite and porphyry dykes lie palaeo vertically beneath the Ann Mason porphyrydeposit e, cupola zone of LHG cut by an aplite dyke hosting a chalcopyrite ( mineralised miarolitic cavityQtz quartz f, drill core from the Ann Mason porphyry deposit showing LHG cut by an aplite dyke hostingmiarolitic cavities and early chalcopyrite bornite quartz (Ccp Bn Qtz) A type, nomenclature after 44 veins,which locally truncate at the dyke’s margin B, e f after 32
Figure 4
Geochronological framework for the Yerington porphyry system Zircon single grain U Pb CA ID TIMS andmolybdenite Re Os geochronological framework for samples spanning the Yerington magmatic system

Pre and inter mineralisation intrusive samples grouped and plotted in order of approximate palaeo depth27 Sample details in S upplementary Data 1 We take the weighted mean of the youngest population ofzircon dates that formed a statistically acceptable Mean Square Weighted Deviation ( or chi squared) asthe best approximation for the crystallisation of the host magma Porph porphyry M S mass spectrometryError bars at 2 σ
Figure 5
Chondrite normalised 69 mean whole rock REE plots LHG and porphyry dykes are distinct from the BearQM and McLeod QMD intrusions, having slightly positive Eu anomalies and steeper MREE/HREE curves

Figure 6
Whole rock geochemical compositions of plutonic units in the Yerington magmatic system Majorelements in part overlap between the mineralogically distinct 27 intrusive units Distinct differencesbetween pre mineralisation (Bear QM and McLeod QMD) and inter mineralisation ( units are seen in traceelement ratios

Figure 7
Zircon trace element signatures through the Yerington porphyry system Zircon LA ICP MS trace elementdata from samples spanning, temporally and spatially, the Yerington porphyry system ..‘Premineralisation’ and ‘inter mineralisation’ �elds shaded Only zircon rim data have been plotted See Fig S 710 for full sample breakdown along with zircon core data

Figure 8
Zircon Hf t through the Yerington porphyry system Time corrected zircon Hf Hf t versus interpretedzircon age for samples spanning the Yerington porphyry system Age determinations for each sample areweighted mean ( from zircon single grain U Pb CA ID TIMS analyses, with error bars at 2 σ (Fig 4 Hf terror bars at 95 con�dence interval ( with overdispersion ..‘Pre and ‘inter mineralisation �elds shadedProbability density plots ( inset, coloured as per sample From the MSWD data for Hf t ,,‘premineralisation’ units show over dispersion (MSWD 1 and ‘inter mineralisation’ units show underdispersion (MWSD 1 Data compared to previous whole rock 87 Sr/ 86 Sr t 27 and zircon δ 18 O 36isotope studies, which show subtle shifts from crustal to mantle isotopic signatures 57 59

Figure 9
Depth of different magma sources CIPW normative mineralogy (method of 70 from whole rock XRF datafor LHG and aplite dykes plotted on the H O saturated haplogranitic melt minima plot 61 Cotectic linesand eutectics are a function of pressure and therefore the whole rock data can be used to provideconstraints for the pressure of magma differentiation 54 from which depth can be approximated Otherunits plotted in Fig S 11

Figure 10
A rapid switch in magmatic plumbing to tap porphyry mineralising magmas Simpli�ed systemparagenesis and conceptual cross section through the porphyry system A long lived 1 6 Myrs) evolutionand contemporaneous emplacement of precursor plutonics, with volcanic activity, was followed by arapid 100 kyrs) switch in magmatic plumbing to tap fertile porphyry deposit forming magmas from a 2040 km deep lower crustal staging ground where they predominately underwent amphibole dominatedfractional crystallisation From this zone of melt evolution, fertile magmas were emplaced into theshallow crust to form plutons and porphyry stocks, and underwent further differentiation at 3 8 km depth,with episodic upward injection of multiple generations of aplite dykes for 400 kyrs, which acted as crystalmush conduits for mineralising �uids 32 As mineralising �uids exploited these conduits, porphyry depositformation continued episodically for potentially in excess of 1 Myrs, and may have been co eval withvolcanism M cavs miarolitic cavities USTs unidirectional solidi�cation textures Vein nomenclature after44 Modi�ed after 5 32 54
Supplementary Files
This is a list of supplementary �les associated with this preprint. Click to download.
CarteretalSupplementaryData1ZirconUPbandmolybdeniteReOsgeochronology.xlsx

CarteretalSupplementaryData2WholerockXRFXICPMSgeochemistry.xlsx
CarteretalSupplementaryData3ZirconLAICPMSdata.xlsx
CarteretalSupplementaryData4ZirconLuH�sotopedata.xlsx
CarteretalSupplementaryFigures.pdf