amylobben) university)of)oregon)
TRANSCRIPT

Instrument Integrity
Amy Lobben University of Oregon

the process…
what are we studying?
various human constructs of geospa=al cogni=on what are our
methods?
computer tes=ng, par=cipant observa=on, eye-‐tracking, neuroimaging
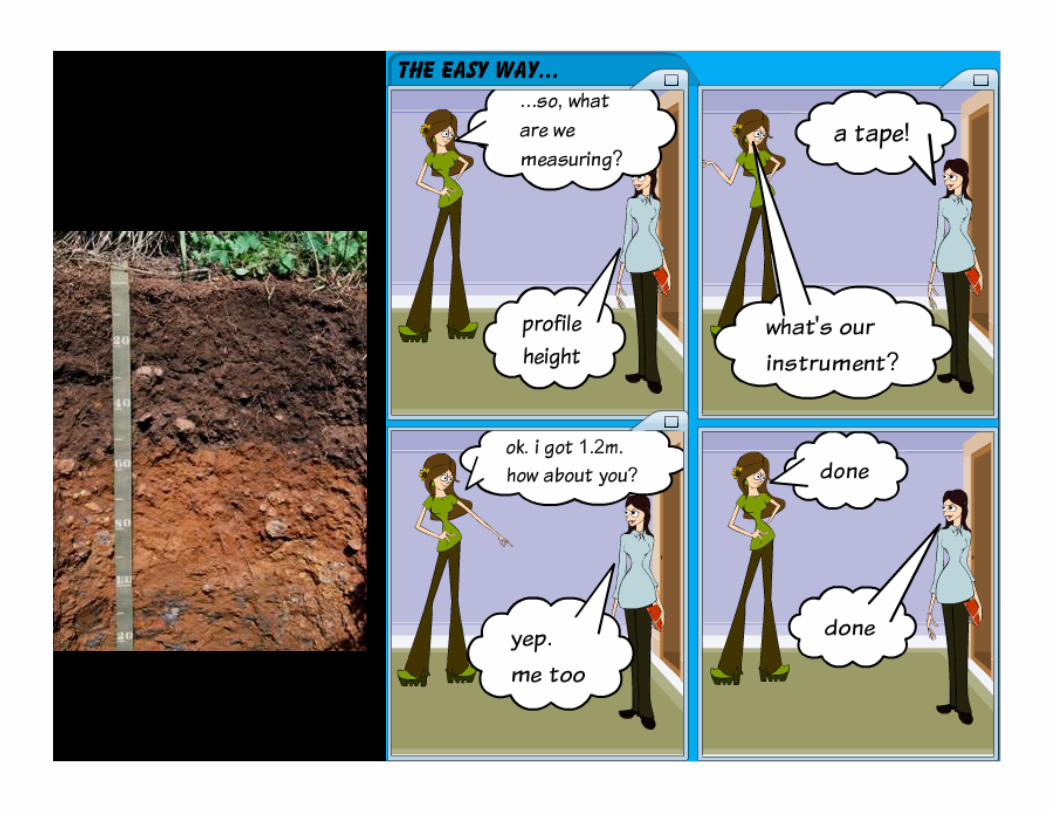
how do we measure?
psychological assessment – performance test

the process…
what are we studying?
various human constructs of geospa=al cogni=on what are our
methods?
computer tes+ng (performance), par=cipant observa=on, eye-‐tracking, neuroimaging
how do we measure?
Psychological assessment – performance test

the process…
what are we studying?
various human constructs of geospa=al cogni=on what are our
methods?
computer tes=ng, par=cipant observa=on, eye-‐tracking, neuroimaging
how do we measure?
psychological assessment – performance test

let’s pose this one…
RQ: what environmental factors affect mental map encoding efficiency and effec=veness?

basically what we do…
-‐ recruit par=cipants -‐ balanced, randomized, true experimental design, …
-‐ walk par=cipants through an environment -‐ ask them to make sketch map of the environment -‐ maybe add talk aloud protocol just for fun -‐ develop systema=c, robust post-‐hoc verbal analysis protocol
-‐ all sounds good!!

voila! research ques=on answered.
voila! research ques=on answered.
but, are we sure?

did we really measure the mental map?
response #1 – yes. i know this because i’m well-‐trained and really smart.
response #2 – yes. i know this because i assessed the reliability of the instrument.

basically what we do…
-‐ recruit par=cipants -‐ balanced, randomized, true experimental design, …
-‐ walk par=cipants through an environment -‐ ask them to make sketch map of the environment -‐ maybe add talk aloud protocol just for fun -‐ develop systema=c, robust post-‐hoc verbal analysis protocol
-‐ all sounds good!!
ask them to make sketch map of the environment
maybe add talk aloud protocol just for fun

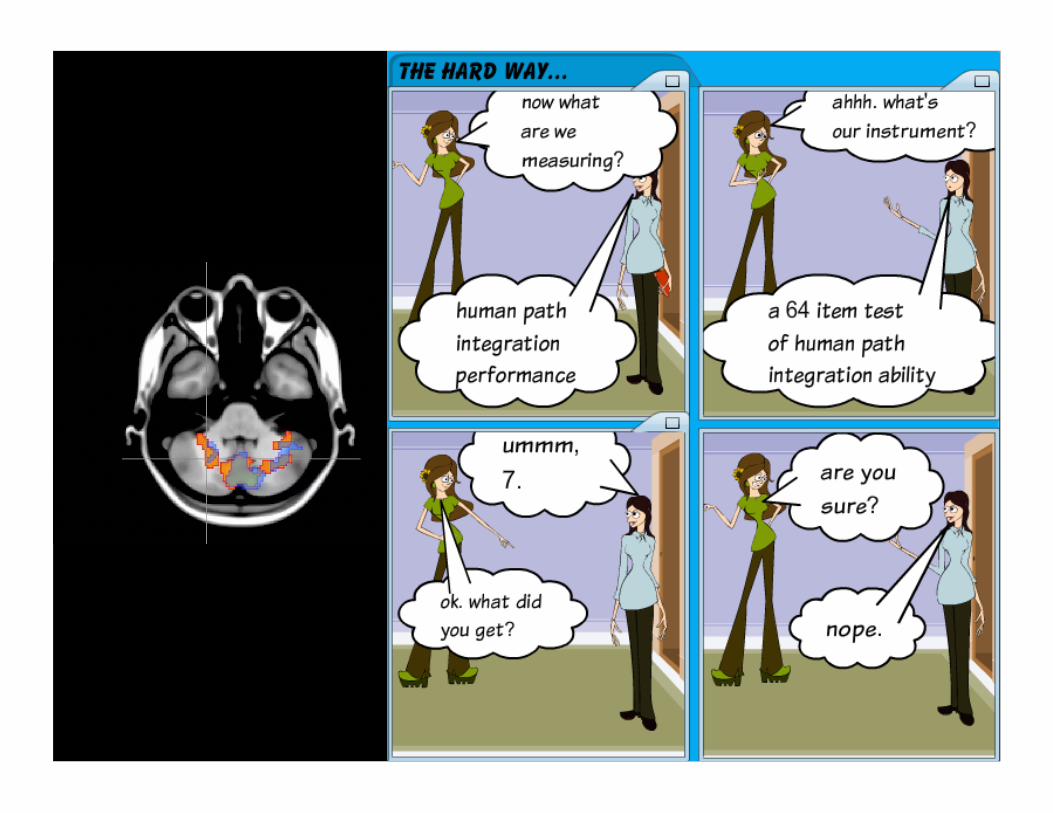
so, how do we assess the integrity of the measurement instrument (i.e. the reliability and validity of the sketch map and the talk-‐aloud protocol?
as designed…it’s impossible

a word about reliability and validity
-‐ reliabilty – the consistency of a measure -‐ validity – the “truthiness” of a measure
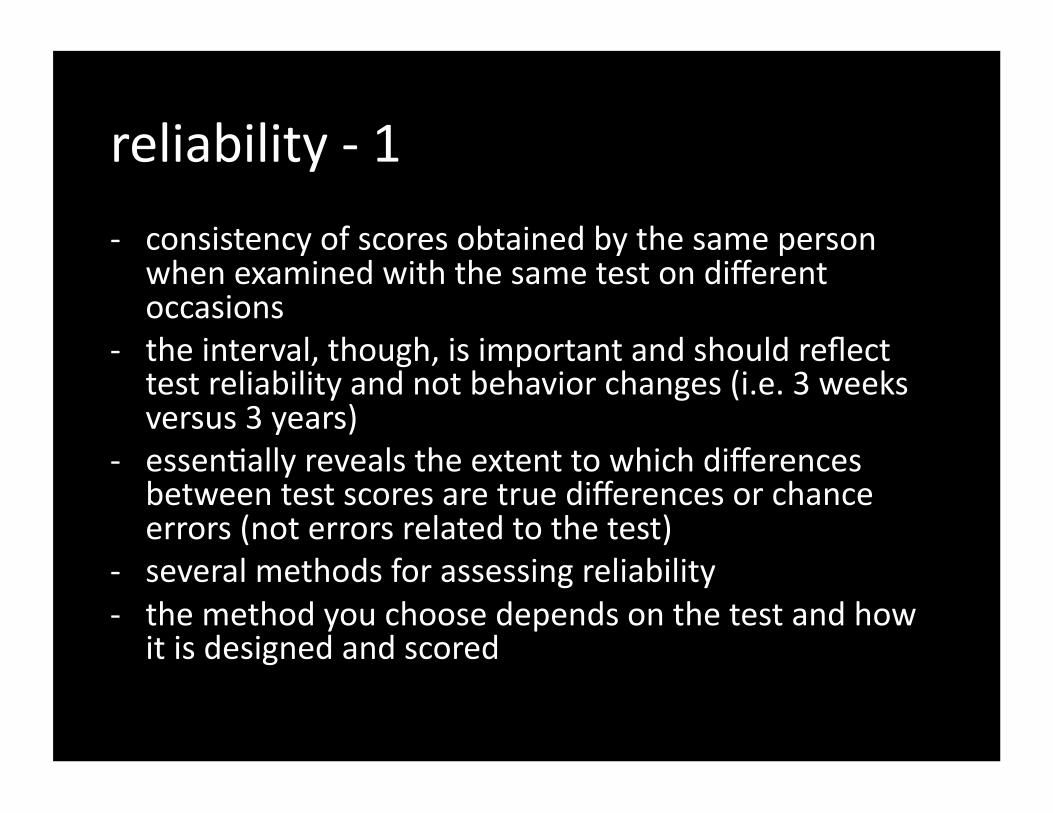
reliability -‐ 1
-‐ consistency of scores obtained by the same person when examined with the same test on different occasions
-‐ the interval, though, is important and should reflect test reliability and not behavior changes (i.e. 3 weeks versus 3 years)
-‐ essen=ally reveals the extent to which differences between test scores are true differences or chance errors (not errors related to the test)
-‐ several methods for assessing reliability -‐ the method you choose depends on the test and how it is designed and scored
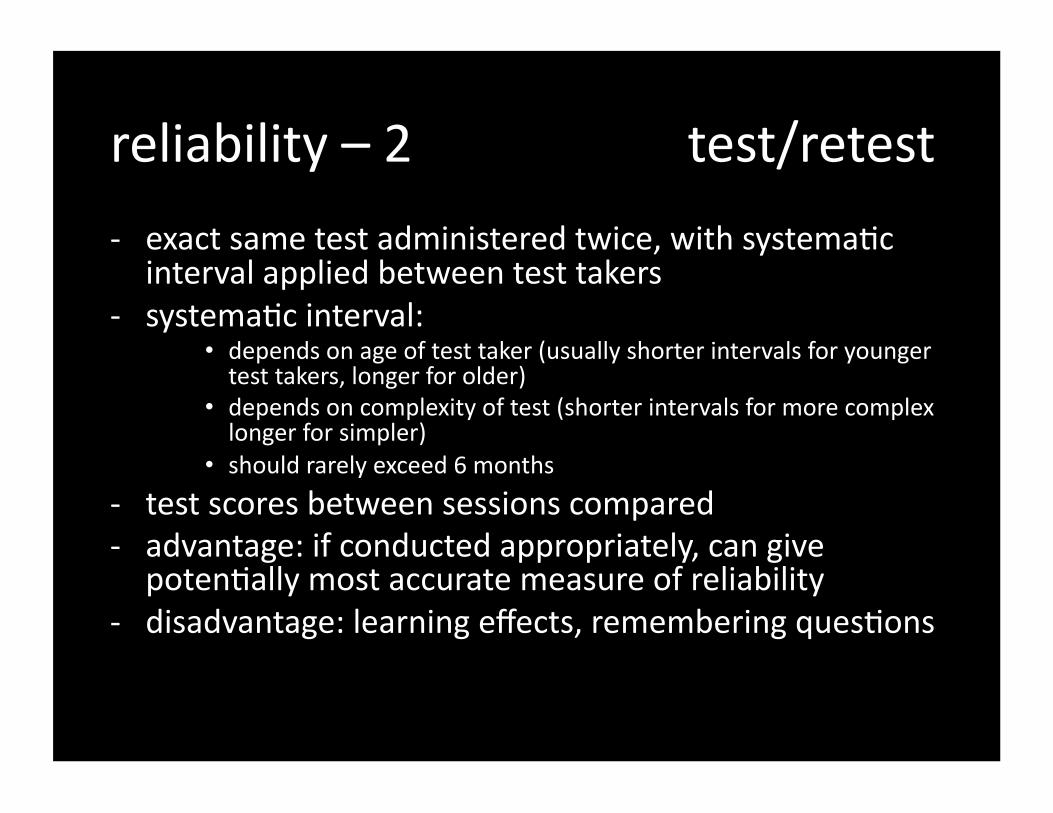
reliability – 2 test/retest
-‐ exact same test administered twice, with systema=c interval applied between test takers
-‐ systema=c interval: • depends on age of test taker (usually shorter intervals for younger test takers, longer for older)
• depends on complexity of test (shorter intervals for more complex longer for simpler)
• should rarely exceed 6 months
-‐ test scores between sessions compared -‐ advantage: if conducted appropriately, can give poten=ally most accurate measure of reliability
-‐ disadvantage: learning effects, remembering ques=ons

reliability – 3 test/retest
-‐ in our example: -‐ par=cipants would perform the same walk through the environment and create the same mental map
-‐ probably a couple of months apart

reliability – 4 alternate form
-‐ two forms of the test created -‐ administered in separate sessions over short interval
-‐ direct comparison between scores
-‐ higher correla=on = be]er the reliability -‐ advantage: don’t have ques=on memory issue, can administer over shorter interval
-‐ disadvantage: not the same test

reliability – 5 alternate form
-‐ in our example: -‐ par=cipants would perform a similar walk through a similar environment and create a similar mental map
-‐ shorter =me interval – even same day
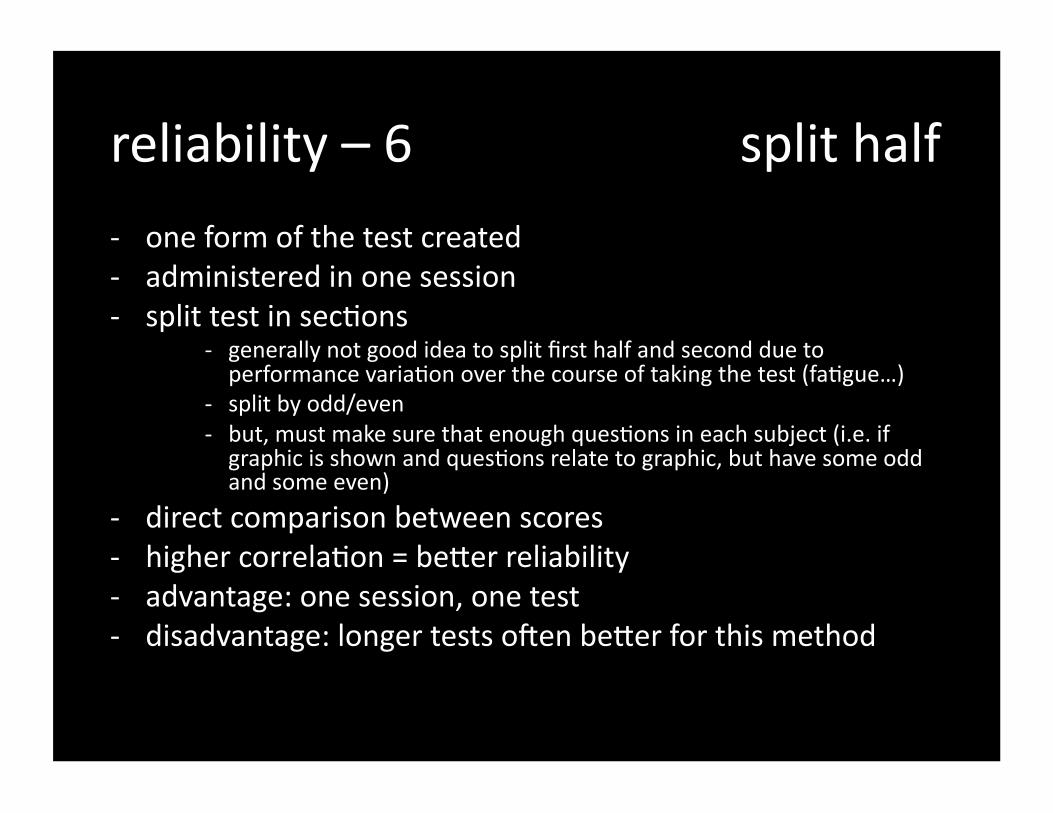
reliability – 6 split half
-‐ one form of the test created -‐ administered in one session -‐ split test in sec=ons
-‐ generally not good idea to split first half and second due to performance varia=on over the course of taking the test (fa=gue…)
-‐ split by odd/even -‐ but, must make sure that enough ques=ons in each subject (i.e. if graphic is shown and ques=ons relate to graphic, but have some odd and some even)
-‐ direct comparison between scores -‐ higher correla=on = be]er reliability -‐ advantage: one session, one test -‐ disadvantage: longer tests o`en be]er for this method

reliability – 7 split half
-‐ in our example: -‐ par=cipants would perform walk through many similar environments and create several mental maps
-‐ at least 10 -‐ probably odd/even split half

reliability – 8 internal consistency
-‐ measures homogeneity of test items, i.e. how closely related a group of ques=ons are
-‐ useful if the ques=ons are designed to measure the same construct
-‐ if a mul=ple construct test is assessed, treat each “sec=on” as different test for reliability analysis
-‐ internal consistency is indicated by Cronbach Alpha score, closer to 1 is higher reliability, above .8 is good
-‐ advantage: one test, one tes=ng session -‐ disadvantage: only measures test consistency, not necessarily between session consistency
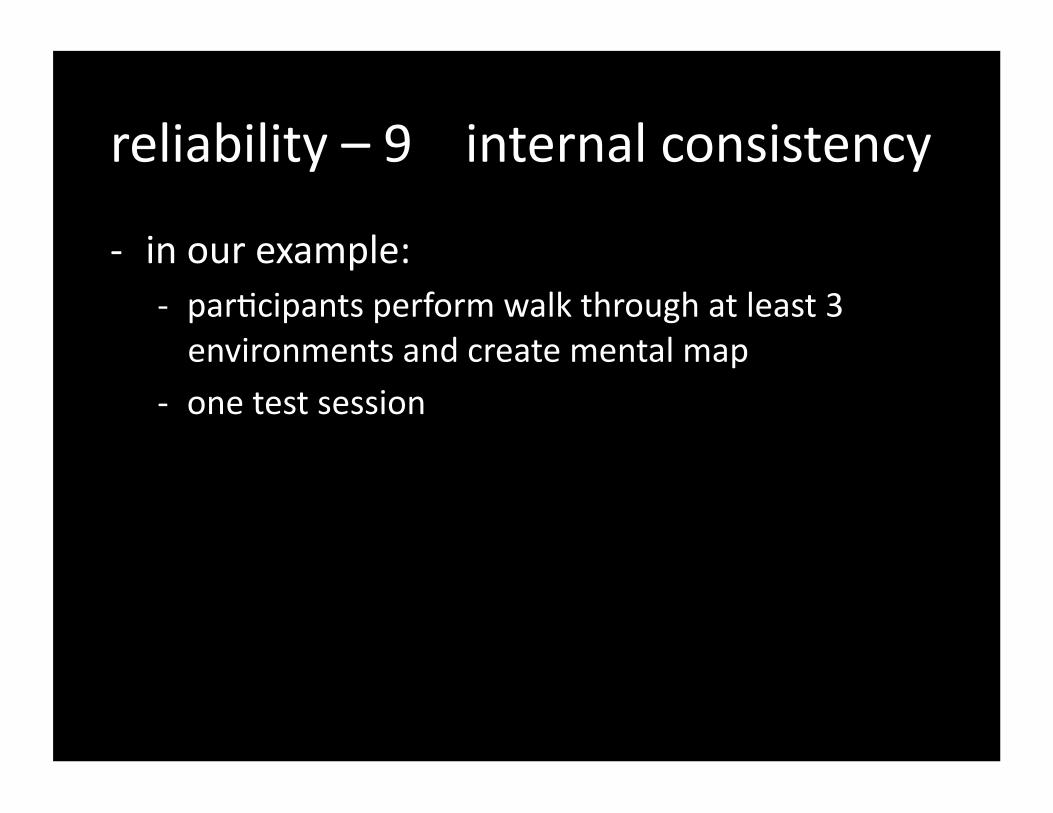
reliability – 9 internal consistency
-‐ in our example: -‐ par=cipants perform walk through at least 3 environments and create mental map
-‐ one test session

reliability – 10 interrater
-‐ useful for both qualita=ve instrument and data analysis -‐ when open-‐ended ques=ons are analyzed, a systema=c
scoring rubric should be developed -‐ mul=ple raters use the same rubric to analyze the same test
taker’s ques=ons -‐ higher correla=on between raters = higher reliability -‐ also useful for analyzing interviews; again, systema=c
coding sheet developed -‐ advantage: provides indica=on of post-‐hoc analysis
reliability -‐ disadvantage: only provides indica=on of post-‐hoc analysis;
not par=cipant tes=ng reliability

reliability – 11 interrater
-‐ in our example: -‐ systema=c coding scheme for evalua=ng mental map construc=on
-‐ at least two raters apply the scheme

basically what we do…
-‐ recruit par=cipants -‐ balanced, randomized, true experimental design, …
-‐ walk par=cipants through an environment -‐ ask them to make sketch map of the environment -‐ maybe add talk aloud protocol just for fun -‐ develop systema=c, robust post-‐hoc verbal analysis protocol
-‐ all sounds good!!
ask them to make sketch map of the environment
maybe add talk aloud protocol just for fun
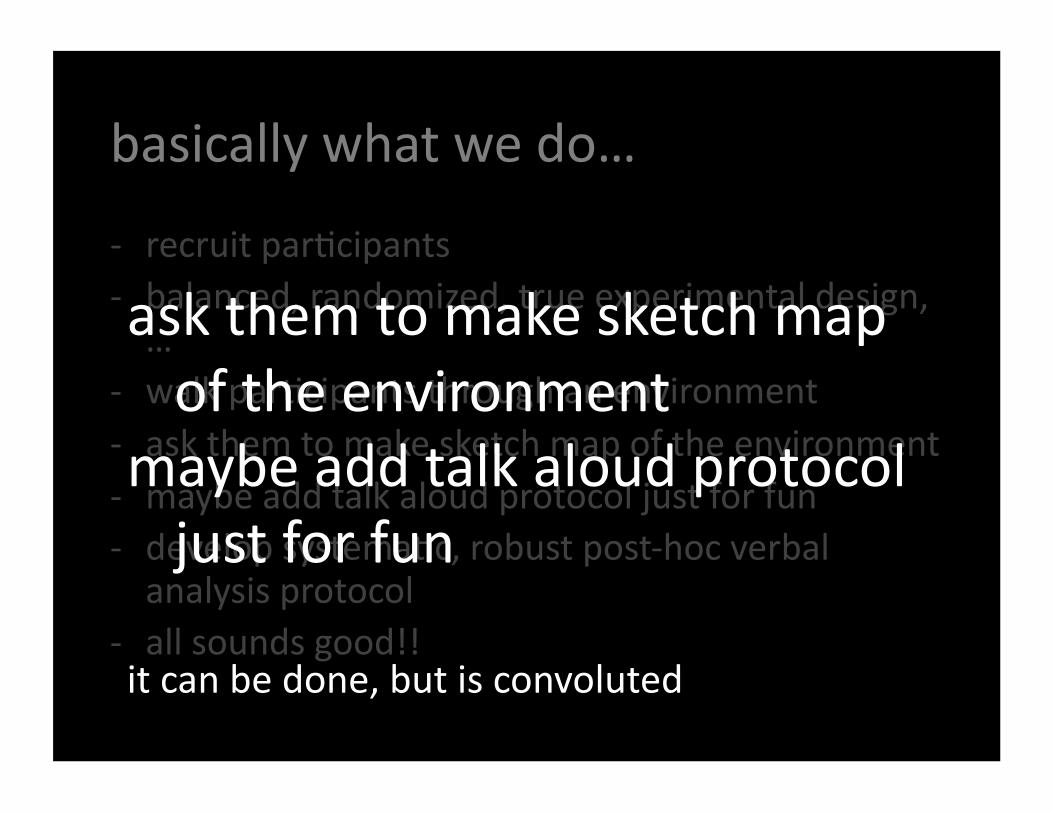
it can be done, but is convoluted
reliability
-‐ which do we choose in our example: -‐ test/retest -‐ alternate form -‐ split half -‐ internal consistency -‐ interrater

reliability
-‐ which do we choose in our example: -‐ test/retest -‐ alternate form -‐ split half -‐ internal consistency -‐ interrater

validity – 1
-‐ the extent to which a test actually measures what it is intended to measure
-‐ as with reliability, validity can be measured and is reported with most available tests
-‐ types of validity: – face validity – content validity – criterion validity – construct validity

validity – 2 face
-‐ test taker’s percep=on of what the test actually measures
-‐ a judgment of the relevancy of the test -‐ example: a test that says it measures map use, but contains no maps may not be perceived as a true measure of map use by the test taker
-‐ face validity can be measured: -‐ focus group -‐ ques=onnaire -‐ interview

validity – 3 face
-‐ in our example: -‐ simple structured or semi-‐structured interview with each par=cipant
-‐ “what do you think we were measuring”
validity – 4 content
-‐ how well a test samples knowledge or behavior its designed to measure
-‐ commonly associated with achievement tests – example 1: course final exam – how well does a cumula=ve exam represent what was actually taught through the term?
– example 2: employment test – considered content valid if the test represents job-‐related skills required for employment

validity – 5 content
-‐ Measuring content validity -‐ common approach: use raters to evaluate each ques=on:
-‐ “is the skill or knowledge measured by this item…” – Essen=al – Useful but not essen=al – Not essen=al
-‐ develop acceptable threshold – example – if more than half of the raters judge the ques=on as essen=al, the ques=on passes the content validity test.

validity – 6 content
-‐ in our example: -‐ ask experts to par=cipate in our experiment
-‐ semi-‐structured interview -‐ focus group -‐ “how well does our experiment capture par=cipants’ mental maps”

validity – 7 criterion
-‐ how well a test score can be used to infer an individual’s standing on some measure of interest (the criterion)
-‐ criterion – standard in which a judgment or decision may be based
-‐ the process of establishing criterion validity involves comparing test results against a known criterion (either field measured behavior/ac=vity/ability) or measured/diagnosed from another source
-‐ validity coefficient – correla=on coefficient that provides measure of the rela=onship between test scores and scores on the criterion measure

validity – 8 criterion
-‐ 2 types of criterion-‐related validity -‐ concurrent validity
– the test and valida=ng the criterion measured (or available) at the same =me
– example 1: test A is explored rela=ve to criterion B, where B is exis=ng measure or some other indicator of criterion
– example 2: field valida=on
-‐ predic=ve validity – test scores taken at one point in =me and criterion measured later – maybe a`er an interven=on
– example: comparison of Freshman admission test to end-‐of-‐year Freshman GPA (where GPA indicates academic success)
validity – 9 criterion
-‐ in our example: -‐ concurrent validity:
-‐ known test of mental mapping? -‐ if looking at performance, maybe correlate with neuroanatomy (i.e. hippocampus tail or similar)
-‐ predic=ve validity: -‐ compare mental maps to following field study in which par=cipants are asked to conduct tasks related to mental map exercise

validity – 10 construct
-‐ a judgment about the appropriateness of inferences drawn from test scores for a variable (the construct)
-‐ construct – scien=fic idea that describes or explains a behavior
-‐ Example: Self-‐Loca=on, intelligence, anxiety,…
-‐ construct is intangible, researchers must formulate hypotheses about high and low scores on a test designed to measure the construct(s)
-‐ Example of contrasted (but somewhat related) constructs and test-‐based hypotheses: survey knowledge, route knowledge
-‐ scien=fic ac=vity and research is about finding evidence to support constructs
validity – 11 construct
-‐ how do you find evidence of construct validity – 1? – depends on the research ques=on and experimental design, but several approaches can be considered:
– evidence of homogeneity -‐ appropriate approach if the assump=on is that the test measures the same construct
-‐ the extent to which test items correlate with each other
validity – 12 construct
-‐ how do you find evidence of construct validity – 2? – evidence of changes with age
-‐ appropriate if the assump=on is that performance on the construct changes with age
-‐ example: increase, then later decrease in spa=al abili=es throughout your life
-‐ can be measured either longitudinally (using same subject group) or by using different age groups then comparing scores; results should follow hypothesized pa]erns
validity – 13 construct
-‐ how do you find evidence of construct validity – 3? – evidence of pretest-‐pos]est changes
-‐ should see measured, significantly different change as a result of an interven=on
-‐ interven=on can include: training, educa=on, therapy, experience, medica=on
-‐ pretest, interven=on, and pos]est must be administered to each subject
-‐ direct comparison of scores
validity – 14 construct
-‐ how do you find evidence of construct validity – 4? – convergent evidence
-‐ evidence that test results correlate with results from other known tests that are theorized to be related
– discriminant evidence -‐ evidence that test results are not sta=s=cally related to construct theorized not to be related
– factor analysis -‐ can be used to conduct an internal test of convergent and discriminant evidence

validity – 15 construct
-‐ in our example: -‐ convergent evidence: sketch maps correlate with field performance and also indicate environmental effects

basically what we do…
-‐ recruit par=cipants -‐ balanced, randomized, true experimental design, …
-‐ walk par=cipants through an environment -‐ ask them to make sketch map of the environment -‐ maybe add talk aloud protocol just for fun -‐ develop systema=c, robust post-‐hoc verbal analysis protocol
-‐ all sounds good!!
ask them to make sketch map of the environment
maybe add talk aloud protocol just for fun
it can be done, but is convoluted
validity
-‐ which do we choose in our example: – face validity – content validity – criterion validity – construct validity

validity
-‐ which do we choose in our example: – face validity – content validity – criterion validity – construct validity
**AND control for confounding variables

Geospa=al framework another example:

S=mulus
Easy
Medium
Hard
Numerosity, number size and polygon size Maps
digit value digit size polygon size building eleva=on map zoom

reliability analysis:
-‐ internal consistency -‐ computer-‐administered behavioral tes=ng
-‐ 5 test sec=ons, 5 measures of internal consistency

• Significant differences in reac=on =me by difficulty level within tasks (all p’s < 0.001)
• Faster response =mes when differences in numeric and cartographic scale & magnitude are larger
• Results are consistent with previous research that iden=fied task and difficulty level differences (Kadosh et al. 2005) • concurrent criterion validity
validity analysis (behavioral):

• A total of 240 images were shown over 5 runs (48 images per run)
– 24 images for each condi=on (12 for each difficulty)
– Eliminated middle difficulty level (focused on easy vs. hard)
• Par=cipants viewed a s=muli pair and reported which of the two images was larger
• Differences in BOLD were used to indicate encoding of scale and magnitude
– Data from numerosity & number size used as localizer for map data – again, looking
for concurrent criterion validity
6000ms 6000ms 6000ms 6000ms 4000ms
validity analysis (neuro):
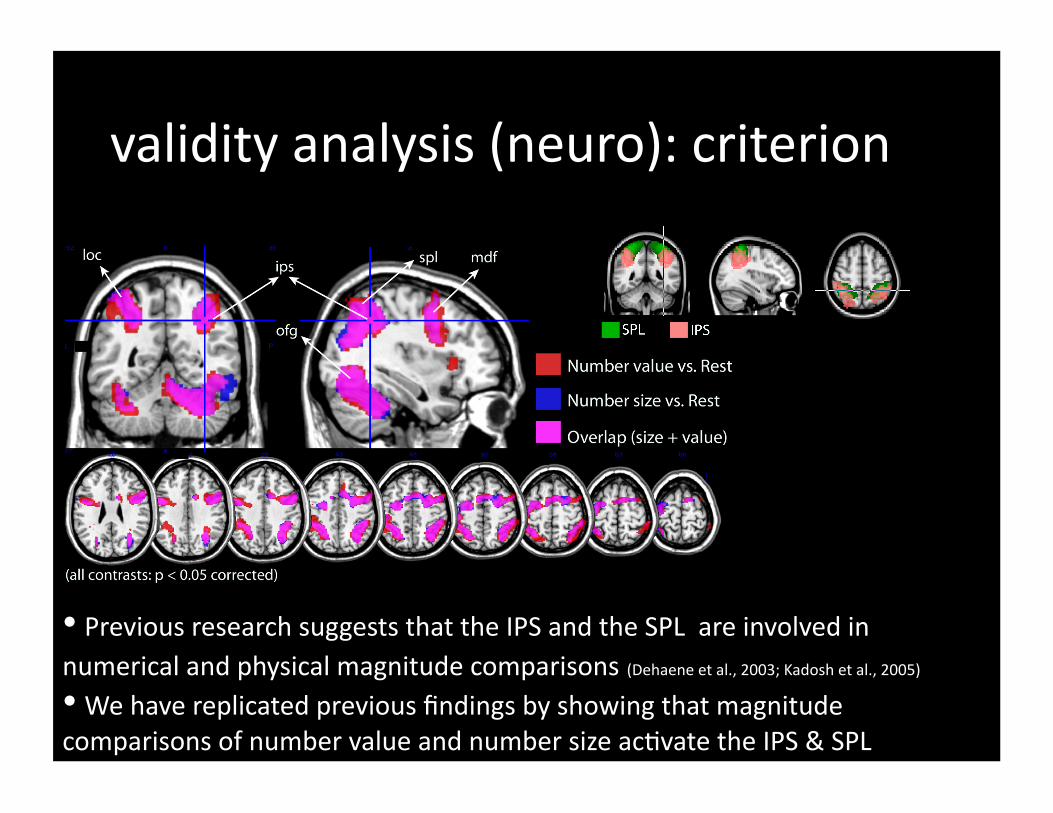
• Previous research suggests that the IPS and the SPL are involved in numerical and physical magnitude comparisons (Dehaene et al., 2003; Kadosh et al., 2005) • We have replicated previous findings by showing that magnitude comparisons of number value and number size ac=vate the IPS & SPL
validity analysis (neuro): criterion

Results: fMRI
• Considerable overlap in the neural substrate between numerical, scale and magnitude comparison tasks Large overlap in the IPS & SPL between the three tasks Scale and magnitude tasks differen=ally ac=vate a region in the LOC and PFC/FP Regions have previously been implicated in object recogni=on cogni=ve branching
validity analysis (neuro): criterion
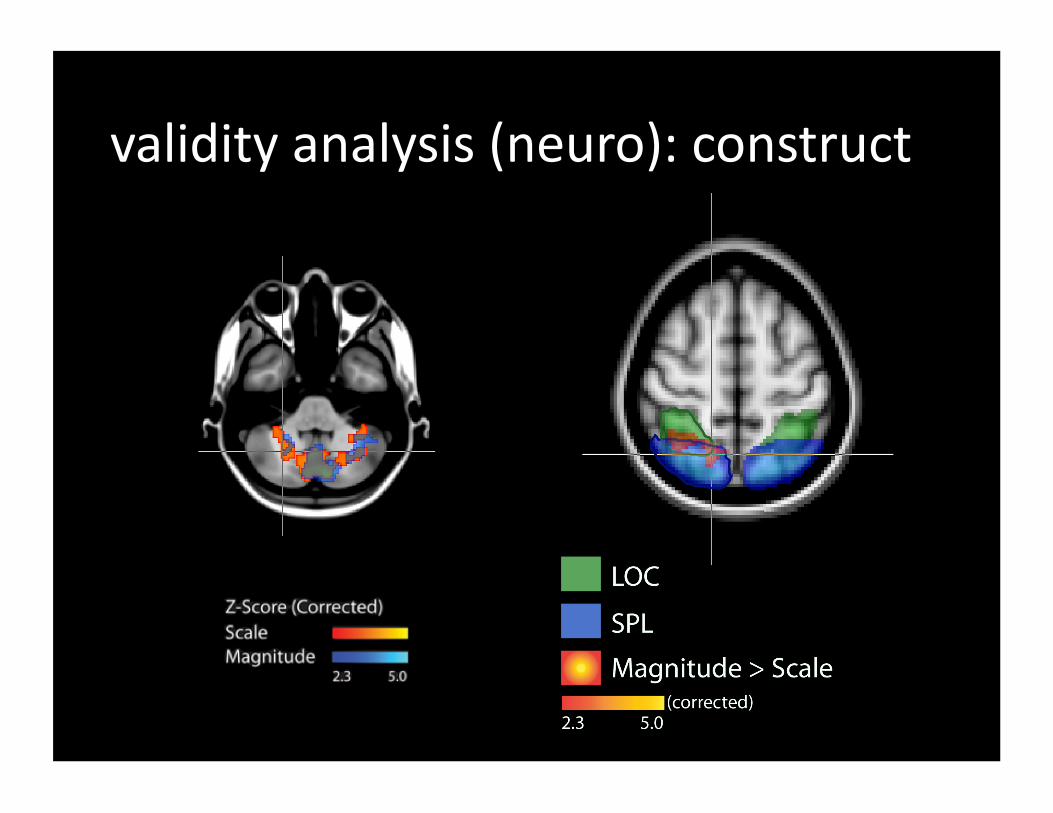
validity analysis (neuro): construct
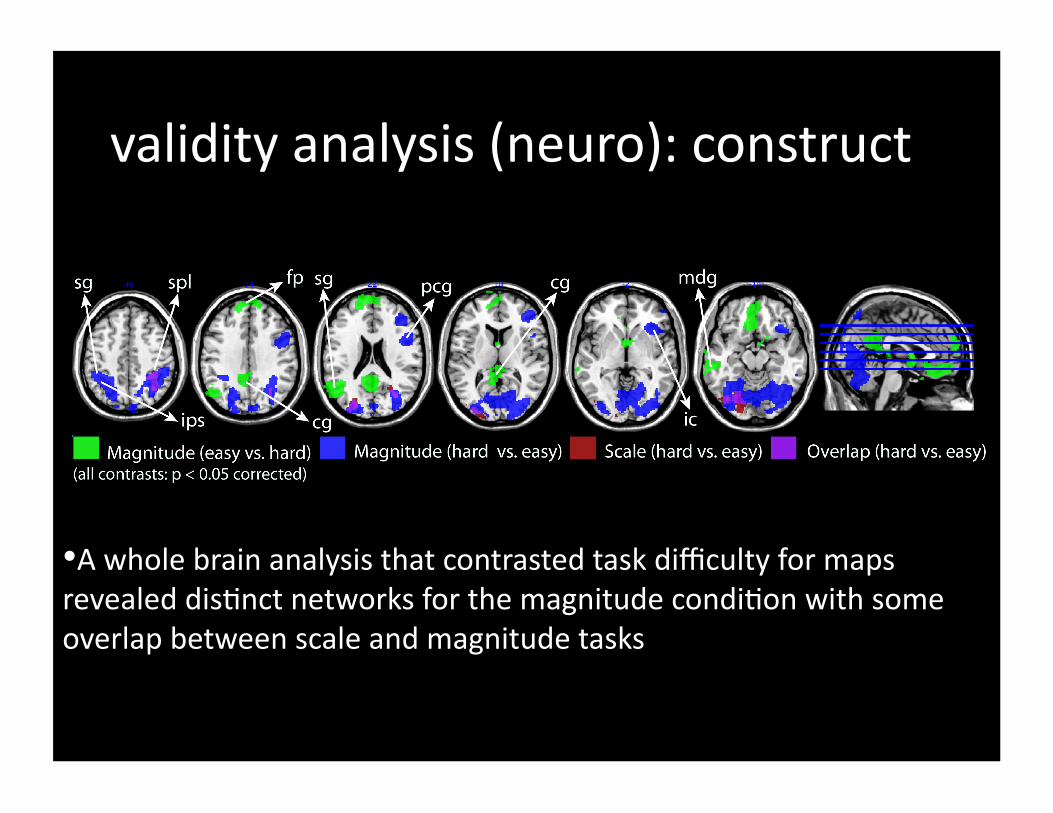
• A whole brain analysis that contrasted task difficulty for maps revealed dis=nct networks for the magnitude condi=on with some overlap between scale and magnitude tasks
validity analysis (neuro): construct

your challenge…
-‐ design a protocol that does the following: -‐ iden=fies the most effec=ve substrate for tac=le map symbols
-‐ 15 map symbols
-‐ 3 substrates -‐ many facilitators