amulti-observatorydatabaseofx …scholar.harvard.edu/files/junyang/files/xmm-an_junyang.pdf · star...
TRANSCRIPT

Astron. Nachr. / AN -, No. -, 1 – 6 (2017) / DOI 10.1002/asna.201713334
A multi-observatory database of X-ray pulsars in the Magellanic Clouds
J. Yang1,2,3,? S. G. T. Laycock1,2, J. J. Drake3, M. J. Coe4, S. Fingerman1,2, J. Hong3, V. Antoniou3,and A. Zezas3
1 Lowell Center for Space Science and Technology, University of Massachusetts, Lowell, MA 01854.2 Department of Physics and Applied Physics, University of Massachusetts, Lowell, MA 01854.3 Harvard-Smithsonian Center for Astrophysics, Cambridge, MA 02138.4 Physics & Astronomy, University of Southampton, SO17 1BJ, UK.
Received 30 September 2016, accepted 27 November 2016Published online 8 March 2017
Key words galaxies: Magellanic Clouds – Pulsars: general – pulsars: individual – stars: neutron – X-rays: binaries
Using hundreds of XMM-Newton and Chandra archival observations and nearly a thousand RXTE observations, we havegenerated a comprehensive library of the known pulsars in the Small and Large Magellanic Clouds (SMC, LMC). Thepulsars are detected multiple times across the full parameter spaces of X-ray luminosity (LX = 1031−38 erg/s) andspin period ( P<1s – P>1000s) and the library enables time-domain studies at a range of energy scales. The high time-resolution and sensitivity of the EPIC cameras are complemented by the angular resolution of Chandra and the regularmonitoring of RXTE. Our processing pipeline uses the latest calibration files and software to generate a suite of usefulproducts for each pulsar detection: event lists, high time-resolution light curves, periodograms, spectra, and completehistories of P , the pulsed fraction, etc., in the broad (0.2-12 keV), soft (0.2-2 keV), and hard (2-12 keV) energy bands.After combining the observations from these telescopes, we found that 28 pulsars show long-term spin up and 25 long-termspin down. We also used the faintest and brightest sources to map out the lower and upper boundaries of accretion-poweredX-ray emission: the propeller line and the Eddington line, respectively. We are in the process of comparing the observedpulse profiles to geometric models of X-ray emission in order to constrain the physical parameters of the pulsars. Finallywe are preparing a public release of the library so that it can be used by others in the astronomical community.
c© 2017 WILEY-VCH Verlag GmbH & Co. KGaA, Weinheim
1 Introduction
The Small Magellanic Cloud (SMC) is a dwarf irregu-lar galaxy near the Milky Way at a distance of about62 kpc (Graczyk et al. 2014; Scowcroft et al. 2016). Itcontains a large and active population of X-ray binaries(e.g., Townsend et al. 2011, Haberl & Sturm 2016). Thegreat majority (98%) of the SMC high-mass X-ray binaries(HMXBs) are of the Be type (Coe et al. 2005). Be/X-raybinaries (Be-XBs) are stellar systems in which a NeutronStar (NS) accretes material from a massive early-type starwith a circumstellar disc resulting in irregular bursts of en-ergy. NSs are stellar remnants that can result from the grav-itational collapse of massive stars after a supernova stage.They showcase extreme conditions, such as deep gravita-tional potential wells and strong magnetic fields, that arebeyond the reach of laboratories here on Earth.
Many more HMXBs are known in the SMC thanthe Large Magellanic Cloud (LMC) or the Milky Way(McBride et al 2008; Yokogawa et al 2003). Based on therelative masses of the Milky Way and the SMC, there isa factor of 50 more HMXBs than one would expect inthe SMC (Walter et al 2006). The SMC has recently ex-perienced an era of star formation, and the number of its
? Corresponding author: e-mail: [email protected]
HMXBs can be compared to the galactic star formation rate(Grimm et al 2003), which can provide us with a uniqueunderstanding of the end products of stellar evolution.
The LMC at a distance of 50 kpc is 10 times more mas-sive than the SMC. A possible explanation of its far fewerconfirmed Be-XBs is the relation between the density of Be-XBs and the recent star formation activity in each galaxy.Antoniou et al. (2010) found that the ages of the stellar pop-ulations in which the Be-HMXBs are embedded are 25-60Myr in the SMC compared to a younger population in theLMC (6-25 Myr old; Antoniou & Zezas 2016). The LMCalso features a wider range of HMXB types.
The low absorption and known distances of the Mag-ellanic Clouds minimize uncertainties in the luminositiesof the pulsars, both within the population and in absoluteterms. This makes the Magellanic Clouds an ideal labora-tory for understanding the process of accretion and X-rayemission in HMXBs during which the rapid rotation of a NScauses its radiating poles to “sweep” over the Earth and re-veal pulsations. The general picture of accretion onto X-raypulsars consists of a flow in a wind or disk to the magneto-sphere and then along the dipole field lines onto the mag-netic poles of the NS. Although the basic picture has beenknown for decades, the details of accretion in places wherethe NS magnetic field dominates the flow is still a complexand challenging problem. As the accretion rate rises and X-
c© 2017 WILEY-VCH Verlag GmbH & Co. KGaA, Weinheim

2 J. Yang et al: A multi-observatory database of X-ray pulsars in the Magellanic Clouds
Fig. 1 A phase-resolved pulsar event list (left: Photon Energy in eV vs. Phase) and folded light curve (right: Photon Count Rate vs. Phase) in thebroad band (0.2 - 12 keV) for the X-ray pulsar SXP 504 from our library. Black dots in the left panel are the energy for each photon detected and thecolor contour shows the photon intensity.
ray luminosity increases, the observed beam pattern is oftenseen to change shape. The pulse profile morphology, energydependence, and variations thereof are widely regarded asholding the key to developing a full physical picture of theaccretion flow. It has been simulated in various theoreti-cal approaches for decades (e.g., Radhakrishnan & Cooke1969, Backer et al. 1976, Pechenick et al. 1983), but simplegeometric models are still unable to fit many of the observedpulse profiles. Thus one of the goals of our project is to cre-ate such data products spanning the full range of behaviorsin order to provide input to future more sophisticated pulse-profile models.
Based on the surveys carried out by Chandra (e.g., An-toniou et al 2009; Laycock et al 2010), XMM-Newton (e.g.,Haberl et al 2008), and RXTE (e.g., Laycock et al 2005,Klus et al 2014), we have generated a comprehensive time-domain library of the known Be-XB pulsars in the Magel-lanic Clouds, which contains all relevant publicly availableobservations performed by these satellites up to 2014. Wehave undertaken the relativistic modeling of the high-energyradiation and pulse profiles of the neutron stars in these sys-tems to constrain the physics and geometry of the accretionflow. The paper is organized as follows: in § 2 we describeand discuss the overall properties of the library and someexamples of extracted pulsar products. The underlying as-sumptions of our model and preliminary results of pulse-profile fitting are presented in § 3. Finally, we outline in § 4the summary and perspectives for future work.
2 Examples of the library products
Between 2000 and 2014, a total of 116 and 42 XMM-Newton observations of the SMC and LMC, respectively,were public. During the same period, Chandra observed thesame targets for 155 and 30 times. We include these ob-servations, as well as all RXTE monitoring of the Magel-lanic Clouds (which were targeted weekly between 1997and 2012), in our analysis.
From the XMM-Newton archive, we have obtained theEuropean Photon Imaging Camera (EPIC) PN data, whichhave a higher time resolution than the Metal Oxide Semi-conductor (MOS) data, covering the energy range 0.1-15keV. The standard procedures of the XMM-Newton ScienceAnalysis Software (SAS, version 1.2)were used for the datareduction. Targets for analysis were from the SMC X-raypulsar (SXP) catalog of Coe and Kirk (2015), which con-tains the spin period P and celestial coordinates of eachknown pulsar. The LMC X-ray pulsar (LXP) list were cho-sen from “Research: Pulsars in the Magellanic Clouds” cat-alog1. The PN data were analyzed using standard com-mands like evselect and epiclccorr in SAS. Light curvesand spectra of the pulsars were extracted from a circularregion of radius 20′′ and an annular background region (be-tween radii of 50′′ and 100′′ from the source center) wasused for background subtraction. Similarly, we used ACISdata from Chandra and the reduction tools of the Chan-dra Interactive Analysis of Observations software package(CIAO, version 4.5; Fruscione et al. 2006). Source fluxes
1 Kept at http://www.southampton.ac.uk/˜mjcoe/
c© 2017 WILEY-VCH Verlag GmbH & Co. KGaA, Weinheim www.an-journal.org

Astron. Nachr. / AN (2017) 3
10-2 10-1 100 101 102
Spin Period (s)
1033
1034
1035
1036
1037
1038
1039
1040
Lum
inos
ity (erg/s
)
LX,min=L0( =2.0 ∗1037 erg/s) ∗(µ
1030Gcm3)2 ∗P(−7/3)
SMC ObsSMC upper limitLMC ObsLMC upper limit
Fig. 2 The Lx vs. P diagram of X-ray pulsars in the SMC and LMCconstructed from observations in the XMM-Newton science archive. Blacksymbols denote the XMM-Newton detections including both pulsed andun-pulsed sources and red symbols denote upper limits. The blue line isthe theoretical P-line from Stella et al. (1986). Pulsations are seen only indetections above the P-line, although in this figure we do not have distin-guished symbols for pulsed and un-pulsed pulsars.
and light curves were extracted using srcflux and dmextract.The search for pulsations employed the Lomb-Scargle peri-odogram method (Press et al. 1992).
Altogether, our data products include single sourceevent lists, pulse profiles, periodograms, spectra, and ob-served parameters such as X-ray flux, P , etc, from eachdetection. The pulse profiles and periodograms were ana-lyzed within the broad (0.2-12 keV), soft (0.2-2 keV) andhard (2-12 keV) energy bands. An example of an event listand folded light curve is shown in Figure 1. The left panelpresents the photon energy as a function of phase from anXMM-Newton observation. Color contours show the pho-ton intensities. We can see the highest photon intensity islocated around 800 eV. The right panel shows the foldedlight curve the shape of which holds information about theemission patterns of the NS hot spots and the geometry ofthe source.
We also used the unique combination of capabilities ofChandra, XMM-Newton, and RXTE in order to obtain in-formation about the long-term variations of the spin periods,X-ray luminosities, period amplitudes, and pulsed fractionsof all sources and to measure their values of P over timesthat span at least 15 years. Some representative examplesare presented below.
2.1 X-ray Luminosity
The accumulated X-ray luminosity (LX ) information of theknown pulsars in the SMC and the LMC allows us to ex-plore the relationships between LX and other parameterssuch as spin period P . For example, Figure 2 shows Lx
vs. P for the XMM-Newton observations of pulsars withP < 100 s. Upper limits to the X-ray luminosities werecalculated from the “Flux Limits from Images from XMM-
Newton” (FLIX)2 server. The blue line is the propeller line(P-line; as presented by the formula in the figure). It isobtained from the equations given in Christodoulou et al(2016) and Stella & White (1986) for a magnetic momentof µ = 3 × 1029 G cm3, M = 1.4 M� and R = 10 km.No pulsations were detected in the few observations thatlanded below the P-line. These extremely faint detectionscould represent weak emission from the magnetospheres ofthe NSs. On the opposite end, some outbursts reach close tothe Eddington limit that is located at 1.8× 1038 erg s−1.
2.2 Time evolution of the physical properties
Figure 3 shows the time evolution of the X-ray luminosity,the pulsed fraction, the pulsed amplitude, P , and the sig-nificance of the Lomb-Scargle periods that we measured.Filled vs. unfilled symbols describe the pulsar’s on/off sta-tus regarding pulsations. Chandra is more sensitive thanXMM-Newton and therefore more appropriate to observethe source when it is in a low state. In the second panel, thereis no pulsed fraction information for the non-imaging detec-tor of RXTE since there were multiple un-resolved sourcesin the field of view (FOV). For epochs above Modified Ju-lian Date (MJD) ∼52500 of Chandra observations, it is toofaint to extract the light curve, so Chandra luminosities areshown in the first panel, but no information is shown in theother panels, as well as the XMM-Newton detection at MJD∼52000. We do not calculate the upper limit of the RXTEsince it is not reliable or useful. In the third panel, unfilledcircles indicate that the transient source is in the FOV, butno significant pulsations are detected to 99% significance,which implies that the pulsar is in the quiescent state. Inthe fourth panel, we measure the period derivative, P , bylinear regression of all observations; for SXP 455, this is−0.0013(9) s/day, so this pulsar is spinning up with thestandard deviation of 4.244 s. Here the standard deviationis a measure of how spread out the spin periods around thebest fitting slope are.
3 Geometric models of pulsar emission
Most of the existing literature assumes that NSs have twoantipodal hot spots located at the magnetic poles and emit-ting isotropically (e.g., Beloborodov 2002). On the otherhand, Backer et al. (1976) suggest an off-center magneticaxis with a displacement of 0.8-3 km from the stellar center.We have extended the model of Beloborodov (2002) to in-clude an offset of the magnetic poles such that the magneticaxis does not have to pass through the center of the NS. Aillustration of this geometry is shown in Figure 4. The reddotted line is the offset magnetic axis and the red ellipsesrepresent the hot spots that can have an arbitrary size. Theblue dot marks the center of the NS. The solid black line isthe photon path including relativistic bending.
2 http://www.ledas.ac.uk/flix/flix3.html
www.an-journal.org c© 2017 WILEY-VCH Verlag GmbH & Co. KGaA, Weinheim

4 J. Yang et al: A multi-observatory database of X-ray pulsars in the Magellanic Clouds
MJD1033
1034
1035
1036
1037Lu
m (
erg
/s)
MJD0.4
0.6
0.8
1.0
1.2
1.4
1.6
Puls
ed f
rac
XMM-Newton Chandra RXTE
0.0
0.1
0.2
0.3
0.4
0.5
Am
p (
cnts
/s)
445
450
455
460
465
Spin
(s)
P dot= -0.0013 +/- 0.0009 s/dayStandard deviation= 4.244 s
51000 52000 53000 54000 55000MJD
0
20
40
60
80
100
Sig
(%
)
Fig. 3 Example of products for the pulsar SXP 455. From top to bottom: luminosity, pulsed fraction, period amplitude, spin period, and significanceof the Lomb-Scargle periods. Similar figures for 57 other pulsars will be presented by J. Yang et al. (2017).
Based on this geometric model, we have created somepulse profiles of emission from an offset magnetic field(Figure 5). The various classes are explained in the caption.The observed flux from one hot spot is F = F1[cosψ(1 −rg/R) + rg/R], where ψ is the angle between the lineof sight and the local radial direction of emission, R/rgis the emission radius in Schwarzschild units, and F1 isthe total flux emitted from this spot. At infinity, the fluxis reduced by the gravitational redshift factor, zg , whichis given by 1 + zg = (1 − rg/R)
−1/2. In classes 2 and4 of the upper panel, and classes 3 and 4 of the middlepanel of Figure 5, when both hot spots are visible, the ob-served pulse shows a plateau Fp = (2rg/R)F1. The up-
per panels correspond to two antipodal hot spots. In thiscase, the maximum pulsed fraction of blackbody emissionis Amax = (R−2rg)/(R+2rg). Values A > Amax can beproduced by pulsars with asymmetric hot spots, as shown inthe middle and bottom panels of Figure 5.
In this model, we can also vary the components of thebeam pattern in order to make the pulse profile sharper orsmoother. This parameterization changes the geometry ofthe intensities emerging from the hot spots which then needsto be propagated through the NS rotation and the light bend-ing. Different model parameter combinations generate verydifferent pulse profiles which can be compared to the ob-served profiles contained in our library. Our model appears
c© 2017 WILEY-VCH Verlag GmbH & Co. KGaA, Weinheim www.an-journal.org

Astron. Nachr. / AN (2017) 5
Photon
Pulsar
Magnetic axis
Hot spot
Rotation axis
Cone of emission
Fig. 4 Illustration of an X-ray pulsar with an offset magnetic dipoleaxis. The accretion hot spots are shown in red, while the blue dot representsthe center of the NS. The black line shows the photon path to the observerincluding relativistic effects.
Class 3
0 π2
π 3π2
Phase
Class 2
0 π2
π 3π2
Phase
0.0
0.5
1.0
1.5
2.0
Fobs/
F1
Class 1
0.0
0.5
1.0
1.5
2.0
Fobs/
F1
0 π2
π 3π2
Phase
0.0
0.5
1.0
1.5
2.0
Fobs/
F1
Class 4
0 π2
π 3π2
2π
Phase
Fig. 5 Model light curves of the emission from the primary hot spot(pink), secondary hot spot (cyan), and both hot spots combined (black).Each class corresponds to a different angle combination between the mag-netic axis, the rotation axis, and the line of sight. Upper panels are for thepulsars with two antipodal hot spots and no offset of the magnetic axis.Middle and bottom panels are for the same pulsars except that the sec-ondary hot spot is shifted in location. (Fobs: observed flux, F1: maximumflux from one hot spot).
to produce a larger spectrum of model profiles than the ob-servations which implies that the observed pulsars may havecertain similar properties that can be described by limitedsets of parameters. These aspects will be investigated in fu-ture work.
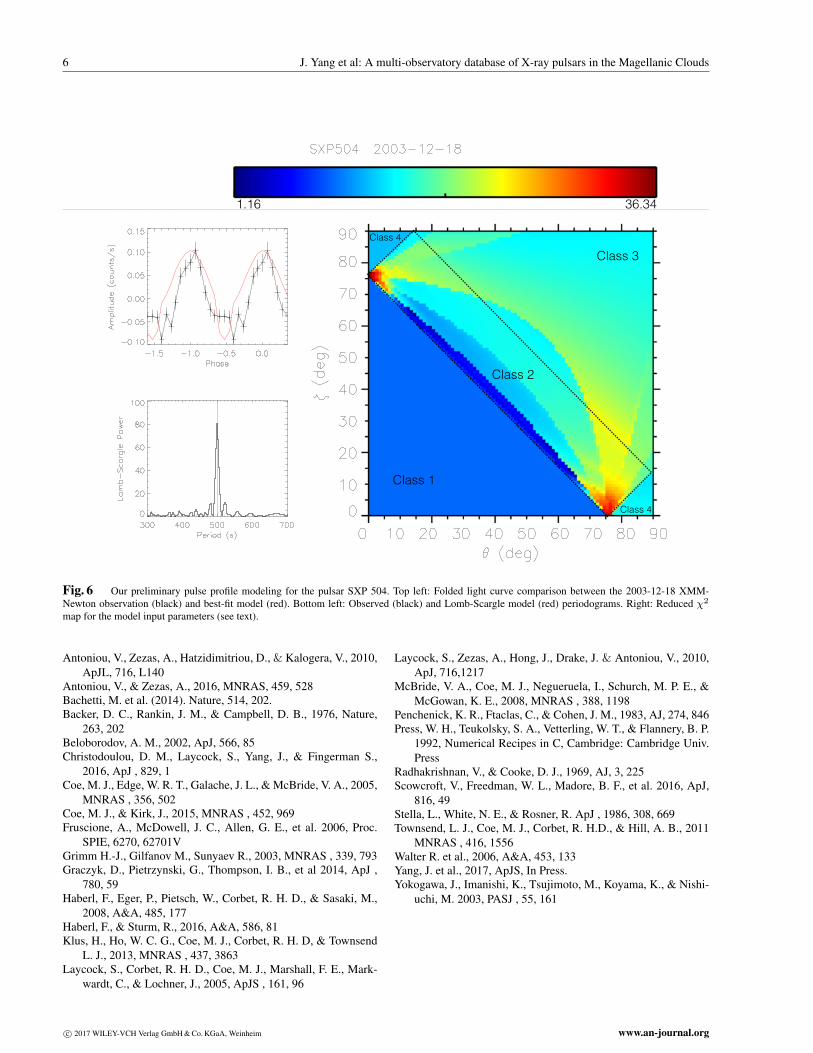
A comparison between the observed pulse profile ofsource SXP 504 in the SMC and our geometric model isshown in Figure 6. The angle between the magnetic axis andthe spin axis is θ, while ζ is the angle between the line ofsight and the spin axis; these are both free parameters. Thecolor map shows the reduced χ2 between a 2003 XMM-Newton observation and the model at many equally-spacedgrid points where it was computed. Although there has been
no previous attempt to model this pulse profile, we obtaineda minimum reduced χ2 of 1.16. The deduced best-fit param-eters are θ = 15o, ζ = 64o, and zg = 0.11.
4 Conclusion
Using archival Chandra, XMM-Newton, and RXTE obser-vations up to 2014, we have generated a comprehensive li-brary of SMC/LMC X-ray pulsar observations which willbe released for public use. Our time-domain library includeshigh time-resolution light curves, periodograms, spectra,event lists, and complete histories of P and P , pulsed frac-tions, and other physical quantities. We are working to-ward extracting more physical properties from our libraryand incorporating more complex phenomena into our pulse-profile model. Pulse profile modeling is a very importanttool in investigations of accretion flows and NS magneto-spheres. The geometric model will be employed in fittingthe known pulsars in the Magellanic Clouds. We anticipatethat the resulting database will be of significant value to fu-ture theoretical research.
As XMM-Newton enters its next decade of operation, itwill play a crucial role in advancing the study of accretion-powered pulsars. The combination of sub-second photon-timing, CCD-grade energy resolution, and sensitivity toLx ∼ 1032 erg/s cannot be replicated by any other X-rayobservatory. We suggest that XMM-Newton’s role shouldbe to expand the parameter space. The study of accretingX-ray pulsars employs the unique capabilities of the obser-vatory and would benefit further from two suggested lines ofaction. Firstly, by providing increased-cadence monitoringof the Magellanic Clouds. We note that the weekly point-ings of RXTE have presently provided most of the orbitalperiods and period derivatives, but RXTE is blind to themost interesting state transitions due to its low sensitivityand poor energy resolution. Secondly, by exploring the Lo-cal Group of galaxies, where ultra-luminous pulsars havebeen found (e.g., Bachetti et al. 2014). By means of longcontiguous integrations (dozens of ksec), the unprecedentedtiming capabilities of XMM-Newton can unveil pulsationseven if the angular resolution is not sufficient to separate in-dividual sources. Other Local Group galaxies would repre-sent new astrophysical laboratories for studying the role ofthe environment on the star formation history and on pulsarproperties.
Acknowledgements. We acknowledge support from NASA-ADAP grant NNX14-AF77G. We thank the anonymous refereefor the very helpful and constructive comments. JY thanks theAmerican Astronomical Society International Travel Grant pro-gram for enabling her participation in the XMM-Newton NextDecade meeting.
References
Antoniou, V., Zezas, A., Hatzidimitriou, D., & McDowell, J. C.,2009, ApJ , 697, 1695
www.an-journal.org c© 2017 WILEY-VCH Verlag GmbH & Co. KGaA, Weinheim
6 J. Yang et al: A multi-observatory database of X-ray pulsars in the Magellanic Clouds
1.16 36.34
Class 1
Class 3
Class 2
Class 4
Class 4
Fig. 6 Our preliminary pulse profile modeling for the pulsar SXP 504. Top left: Folded light curve comparison between the 2003-12-18 XMM-Newton observation (black) and best-fit model (red). Bottom left: Observed (black) and Lomb-Scargle model (red) periodograms. Right: Reduced χ2
map for the model input parameters (see text).
Antoniou, V., Zezas, A., Hatzidimitriou, D., & Kalogera, V., 2010,ApJL, 716, L140
Antoniou, V., & Zezas, A., 2016, MNRAS, 459, 528Bachetti, M. et al. (2014). Nature, 514, 202.Backer, D. C., Rankin, J. M., & Campbell, D. B., 1976, Nature,
263, 202Beloborodov, A. M., 2002, ApJ, 566, 85Christodoulou, D. M., Laycock, S., Yang, J., & Fingerman S.,
2016, ApJ , 829, 1Coe, M. J., Edge, W. R. T., Galache, J. L., & McBride, V. A., 2005,
MNRAS , 356, 502Coe, M. J., & Kirk, J., 2015, MNRAS , 452, 969Fruscione, A., McDowell, J. C., Allen, G. E., et al. 2006, Proc.
SPIE, 6270, 62701VGrimm H.-J., Gilfanov M., Sunyaev R., 2003, MNRAS , 339, 793Graczyk, D., Pietrzynski, G., Thompson, I. B., et al 2014, ApJ ,
780, 59Haberl, F., Eger, P., Pietsch, W., Corbet, R. H. D., & Sasaki, M.,
2008, A&A, 485, 177Haberl, F., & Sturm, R., 2016, A&A, 586, 81Klus, H., Ho, W. C. G., Coe, M. J., Corbet, R. H. D, & Townsend
L. J., 2013, MNRAS , 437, 3863Laycock, S., Corbet, R. H. D., Coe, M. J., Marshall, F. E., Mark-
wardt, C., & Lochner, J., 2005, ApJS , 161, 96
Laycock, S., Zezas, A., Hong, J., Drake, J. & Antoniou, V., 2010,ApJ, 716,1217
McBride, V. A., Coe, M. J., Negueruela, I., Schurch, M. P. E., &McGowan, K. E., 2008, MNRAS , 388, 1198
Penchenick, K. R., Ftaclas, C., & Cohen, J. M., 1983, AJ, 274, 846Press, W. H., Teukolsky, S. A., Vetterling, W. T., & Flannery, B. P.
1992, Numerical Recipes in C, Cambridge: Cambridge Univ.Press
Radhakrishnan, V., & Cooke, D. J., 1969, AJ, 3, 225Scowcroft, V., Freedman, W. L., Madore, B. F., et al. 2016, ApJ,
816, 49Stella, L., White, N. E., & Rosner, R. ApJ , 1986, 308, 669Townsend, L. J., Coe, M. J., Corbet, R. H.D., & Hill, A. B., 2011
MNRAS , 416, 1556Walter R. et al., 2006, A&A, 453, 133Yang, J. et al., 2017, ApJS, In Press.Yokogawa, J., Imanishi, K., Tsujimoto, M., Koyama, K., & Nishi-
uchi, M. 2003, PASJ , 55, 161
c© 2017 WILEY-VCH Verlag GmbH & Co. KGaA, Weinheim www.an-journal.org