ams and lc/ms analyses of soa from the … and lc/ms analyses of soa from the photooxidation of...
TRANSCRIPT

Atmos. Chem. Phys., 12, 4667–4682, 2012www.atmos-chem-phys.net/12/4667/2012/doi:10.5194/acp-12-4667-2012© Author(s) 2012. CC Attribution 3.0 License.
AtmosphericChemistry
and Physics
AMS and LC/MS analyses of SOA from the photooxidation ofbenzene and 1,3,5-trimethylbenzene in the presence of NOx:effects of chemical structure on SOA aging
K. Sato1, A. Takami1, Y. Kato1,*, T. Seta1, Y. Fujitani 1, T. Hikida 2, A. Shimono2, and T. Imamura1
1National Institute for Environmental Studies, 16-2 Onogawa, Tsukuba, Ibaraki 305-8506, Japan2Shoreline Science Research Inc., 3-12-7, Owada-machi, Hachioji, Tokyo 192-0045, Japan* currently at: Nuclear Material Control Center, 1-28-9 Higashi-Ueno, Taito, Tokyo 110-0015, Japan
Correspondence to:K. Sato ([email protected])
Received: 19 December 2011 – Published in Atmos. Chem. Phys. Discuss.: 3 January 2012Revised: 10 May 2012 – Accepted: 10 May 2012 – Published: 25 May 2012
Abstract. Oxygenated organic aerosol (OOA) observed inremote areas is believed to comprise aged secondary organicaerosol (SOA); however, the reaction processes relevant toSOA chemical aging have hitherto been unclear. We recentlymeasured the mass spectra of SOA formed from the pho-tooxidation of aromatic hydrocarbons using an Aerodyneaerosol mass spectrometer (AMS) and reported that SOAaging is slowed with increasing number of alkyl groups inthe precursor molecule. In this study, we selected benzeneand 1,3,5-trimethylbenzene (TMB) as precursors to analyzeSOA formed from the photooxidation of aromatic hydrocar-bons in the presence of NOx using high-resolution time-of-flight AMS (H-ToF-AMS) and liquid chromatography/time-of-flight mass spectrometry (LC/TOF-MS). A van Kreve-len diagram was studied using the O/C and H/C ratios ob-tained by H-ToF-AMS for organics present in SOA. The re-sults showed these organics to be rich in carboxylic acidsor hydroxycarbonyls and the O/C ratio of SOA formed bythe reaction of 1,3,5-TMB to be lower than that for benzene.Analytical results from LC/TOF-MS showed the particulateproducts formed by the reaction of 1,3,5-TMB to be richer inketocarboxylic acids than for benzene. These results indicatethat SOA aging proceeds mainly by formation of carboxylicacids and that the rate of SOA aging in laboratory chambersis limited by the oxidation of ketone groups. SOA formedin laboratory chamber experiments is less oxidized than forambient OOA, not only because the experimental durationis insufficient or the SOA mass loading in the chamber ishigher than that of the atmosphere. The laboratory chamber
experiments under dry conditions are not able to simulateketocarboxylic acid photochemical oxidation in the aqueousphase. The fractions of organic peroxides to the total SOAmass were determined by iodometric spectrophotometry tobe 12± 8 % (1,3,5-TMB) and<39 % (benzene). Further, itwas newly found that, unlike the reaction of benzene, onlyvery small amounts of nitrophenols are produced by the re-action of 1,3,5-TMB.
1 Introduction
Atmospheric organic aerosol is believed to affect humanhealth, climate, and visibility (Kroll and Seinfeld, 2008; Hal-lquist et al., 2009). Field observations using an Aerodyneaerosol mass spectrometer (AMS) have revealed the organicaerosol observed in remote areas to be rich in oxygenated or-ganic aerosol (OOA) (Zhang et al., 2007; Takami et al., 2007;Lun et al., 2009; Takegawa et al., 2009). Since secondary or-ganic aerosol (SOA) formed in laboratory chamber experi-ments is less oxidized than ambient OOA, ambient OOA isassumed to be aged SOA (Bahreini et al., 2005; Alfarra et al.,2006; Chhabra et al., 2010, 2011). To understand the forma-tion process of atmospheric OOA, the aging process of SOAis currently a focus of research interest in the field of atmo-spheric chemistry (Kroll and Seinfeld, 2008; Qi et al., 2010;Chen et al., 2011; Shiraiwa et al., 2011; Lambe et al., 2011;Loza et al., 2012).
Published by Copernicus Publications on behalf of the European Geosciences Union.

4668 K. Sato et al.: AMS and LC/MS analyses of high-NOx aromatic SOA
Table 1.Experimental conditions and SOA yields.
Run Hydrocarbon [HC]0 [NOx]0 [CH3ONO]0 1HC SOA mass conc. SOA Yieldnumber (HC) (ppb) (ppb)a (ppb)b (µg m−3)c (µg m−3)d (%)e,f
Run 1 benzene 1834 102 2 1070 18 1.8± 0.2Run 2 benzene 1466 889 1093 608 49 8.0± 1.4Run 3 benzene 4163 999 1078 635 198 31.2± 10.7Run 4 1,3,5-TMB 1002 200 2 2242 54 2.5± 0.1Run 5 1,3,5-TMB 1455 974 50 4522 160 3.7± 0.2Run 6 1,3,5-TMB 1515 1052 1036 5913 920 15.6± 1.0
a NO2/NO ratio was∼0 (Runs 1 and 4, low mass loading experiments) or∼3 (Runs 2, 3, 5, and 6, high mass loading experiments),b Used as OHradical source,c Hydrocarbon reacted,d SOA mass concentrations were calculated using SMPS volume concentrations and a density of1.4 g cm−3; no correction of SOA wall loss deposition was carried out,e SOA yield was determined dividing the mass concentration of aerosolproduced by the concentration of hydrocarbon reacted (errors are 2σ), f Using the rate of particle wall deposition loss (3× 10⁻⁵ s−1, Sato, 2008),the SOA yields listed are corrected to 2.2 % (Run 1), 8.3 % (Run 2), 32.0 % (Run 3), 2.9 % (Run 4), 4.1 % (Run 5), and 16.5 % (Run 6).
If the chemical composition changes as SOA ages, thephysical and chemical properties of aerosol particles such asthe volatility, hygroscopicity, toxicity, and the optical prop-erties will also change (e.g., Jimenez et al., 2009; Kroll andSeinfeld, 2008; Wang et al., 2012; Zhang et al., 2011). Con-cerning its toxicity and optical properties, specific moleculeswill strongly influence the overall property of OOA parti-cles. For example, quinones and organic peroxides presentin SOA are known to induce oxidative stress (Baltenspergeret al., 2008; Wang et al., 2011); and nitrophenols, which arealso present in SOA, show optical absorption in the visibleregion (Nakayama et al., 2010; Zhang et al., 2011). Under-standing of SOA aging at the molecular level is necessary forbetter understanding of the impact of OOA.
Aromatic hydrocarbons are typical SOA precursors emit-ted into the atmosphere from anthropogenic emission sources(Calvert et al., 2002; Henze et al., 2008; Lane et al., 2008).The SOA yield (Izumi and Fukuyama, 1990; Odum et al,1997; Hurley et al., 2001; Takekawa et al., 2003; Sato et al.,2004; Song et al., 2005; Martin-Reviejo and Wirtz, 2005; Nget al., 2007), the SOA chemical composition (Forstner et al.,1997; Jang and Kamens, 2001; Kalberer et al., 2004; Fissehaet al., 2004; Hamilton et al., 2005; Irei et al., 2006, 2011; Satoet al., 2007, 2010; Huang et al., 2007; Borras and Tortajada-Genaro; 2012), and the reaction mechanism relevant to SOAformation (Stroud et al., 2004; Johnson et al., 2004, 2005;Bloss et al., 2005; Hu et al, 2007; Kelly et al., 2010) havebeen a focus of research into the atmospheric oxidation ofaromatic hydrocarbons.
We recently measured SOA formed from the photooxi-dation of aromatic hydrocarbons using AMS and reportedthat SOA aging is slowed by increasing the number of alkylgroups in the precursor aromatic molecule (Sato et al., 2010).Very recently, a triangle plot technique for analysis of organicaerosol aging (Ng et al., 2010) and new numerical or graph-ical analysis methods using the elemental analysis data ob-tained by high-resolution time-of-flight AMS (H-ToF-AMS)
(Chhabra et al., 2010, 2011; Kroll et al., 2011; Ng et al.,2011) have been developed.
In this study, we selected benzene and 1,3,5-trimethylbenzene (TMB) as SOA precursors for analysisof SOA formed in photooxidation chamber experiments inthe presence of NOx (NO and NO2) using H-ToF-AMSand liquid chromatography/time-of-flight mass spectrometry(LC/TOF-MS). New presentation methods of AMS dataemploying the van Krevelen diagram or triangle plot wereused to obtain a better understanding of the relationship be-tween the chemical structure of the reactant and SOA aging.LC/TOF-MS analysis yielded molecular-level information.The aims of this study were to elucidate the major reactionprocesses relevant to SOA aging and to study possiblefactors that limit the rate of SOA aging.
2 Experimental section
2.1 Experimental procedure
The details of the experimental procedure are explained else-where (Sato et al., 2004, 2007, 2010). All experiments wereconducted using a 6-m3, evacuable, Teflon-coated stainlesssteel chamber (Akimoto et al., 1979). Hydrocarbons, NOx,methyl nitrite, and purified air were mixed in the chamber(Table 1). Methyl nitrite was added as the OH radical source:
CH3ONO+ hν → CH3O+ NO
CH3O+ O2 → CH2O+ HO2
HO2 + NO → OH+ NO2
Methyl nitrite was prepared by dropping 50 % w/w aqueoussulfuric acid onto methanolic sodium nitrite and was usedafter vacuum distillation to remove any methanol and NOximpurities. No NOx impurity was detected by an FT-IR spec-trometer with an optical length of 221.5 m (Thermo-FisherNexus 670, 1 cm−1 resolution, NO detection limit = 7.9 ppb,NO2 detection limit = 0.95 ppb) when 1 ppm methyl nitrite
Atmos. Chem. Phys., 12, 4667–4682, 2012 www.atmos-chem-phys.net/12/4667/2012/

K. Sato et al.: AMS and LC/MS analyses of high-NOx aromatic SOA 4669
was introduced in the chamber. The temperature of thegaseous mixture was maintained at 298± 1 K. The relativehumidity of the purified air was∼0.003 %. No seed par-ticles were added. The gaseous mixture was irradiated bylight from 19 Xe arc lamps (1 kW each) through Pyrex fil-ters for 4–11 h. The rate constant of the NO2 photolysis was0.29 min−1.
Hydrocarbon, methyl nitrite, NO, NO2, and O3 were mon-itored using FT-IR spectrometer. The size distribution of par-ticles was measured using a scanning mobility particle sizer(SMPS, TSI, model 3934) to calculate the volume concen-tration. The chemical composition of the particles was an-alyzed using an AMS (Aerodyne Research, H-ToF-AMS)driven in V mode (Drewnick et al., 2005). Particles collectedthrough an aerodynamic lens were heated at 873 K to evapo-rate particulate compounds; vaporized compounds were thenionized by electron ionization and analyzed using a ToF-MSinstrument with a mass resolution of∼2700 atm/z28. Dataobtained by H-ToF-AMS were numerically analyzed usingToF-AMS Analysis Toolkit Program Version 1.48 combinedwith ToF-AMS HR Analysis Program Version 1.07. Mea-surements of FT-IR, SMPS, and H-ToF-AMS were carriedout every 10 min in Runs 1 and 4 or every 6 min in the otherruns.
Off-line SOA analytical samples were collected on aTeflon membrane filter (Sumitomo Electric, Fluoropore,47 mm diameter, pore size 1 µm). The sampling flow ratewas 16.7 l min−1. The sampling duration was∼1 h per fil-ter. One sample for iodometric spectrophotometry was col-lected in each of Runs 1 and 4, or two samples (i.e., one foriodometric spectrophotometry and the other for LC/TOF-MSanalysis) were collected in each of the other runs.
The time series of the OH concentration was estimated as-suming that aromatic hydrocarbon decreased by the reactionwith OH radicals, where the rate constants used for calcu-lations were taken from Atkinson (1986) and Aschmann etal. (2006). In each experiment, the OH concentration reacheda maximum immediately after the start of irradiation and thendecreased with time, but the OH concentration maintained>5× 10⁵ molecules cm−3 during irradiation. This indicatesthat particles and vapors in the reaction chamber were con-tinuously oxidized during irradiation in each experiment.
2.2 LC/TOF-MS analysis
Each filter sample was sonicated in 5 ml of methanolfor 30 min to extract the collected organic compounds.The extract was concentrated to near dryness and thendissolved in 1 ml of formic acid-methanol-water solution(v/v/v = 1/2000/1999) for use as the analytical sample. Sam-ple vials were stored in a freezer until analysis was per-formed.
Off-line SOA samples were analyzed by LC/TOF-MS(Agilent Technology, 6200 Series Accurate-Mass Time-of-Flight LC/MS). The mobile phases used for LC were
0.05 % v/v formic acid aqueous solution and methanol. Thetotal flow rate of the mobile phases was 0.4 ml min−1. Themethanol concentration was maintained at 50 % v/v duringthe flow injection analysis (in which no column is used). Onthe other hand, for the column injection analysis, the chro-matographic gradient started at 5 % v/v methanol and pro-gressed linearly to 90 % v/v in 30 min. An octadecyl silica gelcolumn (GL Science, ODS-3V, 0.46 mm diameter× 150 mmlong, particle size 0.5 µm) was used to separate the analytes.The temperature of the column was maintained at 298 K.The analytes were ionized by electrospray ionization (ESI)in negative polarity mode and were then analyzed using aToF-MS instrument with a mass accuracy of<3 ppm.
2.3 Iodometric spectrophotometry
The total amount of organic peroxide (ROOR and ROOH)present in SOA was quantified following a method estab-lished by Docherty et al. (2005). Each filter sample wassonicated in 1.5 ml ethyl acetate for 10 min to extract anyorganic peroxides. The extract was mixed with 2.25 ml offormic acid-chloroform-water solution (v/v/v = 53/27/20). A3-ml aliquot of the mixture solution was then placed in a 5-ml glass vial and dry nitrogen was bubbled gently through toremove any dissolved oxygen. The mixture solution was thenadded with 48 mg of potassium iodide.
One hour after the addition of potassium iodide, the ab-sorbance of the mixture solution was measured using anultraviolet-visible spectrophotometer (Shimadzu, BioSpec-mini). The molar concentration of triiodide ions (formedfrom the titration reaction of organic peroxides with excessiodide ions) was determined from the absorbance at 470 nm.The molar absorption coefficient of triiodide ion used for thecalculations was measured by titration with benzoyl peroxidesolution at a known concentration. The molar concentrationwas converted to the mass concentration in a manner similarto that described by Docherty et al. (2005).
3 SOA yield
The SOA yield was determined from the SOA volume con-centration and the concentration of reacted hydrocarbon (Ta-ble 1). Not all hydrocarbons were consumed in the reactionstaking place during photoirradiation (Supplement Fig. S1).The concentration of reacted hydrocarbons was determinedfrom the difference between the initial concentration and theconcentration at a specific time and was then used in calcula-tions of the SOA yield. The SOA yield was calculated whenthe volume concentration reached a maximum. No correc-tions to account for wall deposition loss of particles were per-formed. The volume concentration was converted to the massconcentration, assuming the density of SOA to be 1.4 g cm−3
(Alfarra et al., 2006; Martine-Reviejo and Wirtz, 2005).
www.atmos-chem-phys.net/12/4667/2012/ Atmos. Chem. Phys., 12, 4667–4682, 2012

4670 K. Sato et al.: AMS and LC/MS analyses of high-NOx aromatic SOA
The SOA yield increased with increasing the SOA massloading, primarily because the gas/particle absorption ofsemivolatile compounds (SVOCs) increases as a result(Odum et al., 1997). The SOA mass loading increased withincreasing the initial hydrocarbon or methyl nitrite concen-tration. Under high-concentration conditions, the yield ofSVOCs will increase, because the total concentration of per-oxy radicals (RO2 and HO2) increases (Kroll and Seinfeld,2008). The increase in the peroxy radical concentration willalso affect the increase in the SOA yield.
Martin-Reviejo and Wirtz (2005) reported the SOA yieldfrom benzene to be 11–14 % at an SOA mass concentrationof 56–94 µg m−3 (Fig. S2). The SOA yield reported by Nget al. (2007) is 28 % at a mass concentration of 35 µg m−3.The SOA yield of Run 2 (8.0 % at 49 µg m−3) was lowerthan the previous results in the region (35–56 µg m−3); thisis primarily because the initial NOx concentration of Run 2(889 ppb) was much higher than those of the previous stud-ies (50–169 ppb). The SOA yields from 1,3,5-TMB were re-ported to be 3.1 % at 31 µg m−3 (Odum et al., 1997) and3.6 % at 18 µg m−3 (Kleindienst et al., 1999). The mass load-ings of the experiment by Odum et al. (1997) and Run 4 wereclose to each other. The SOA yield measured by Odum etal. (1997) (3.6 %) was slightly higher than the yield mea-sured in Run 4 (2.5 %), although the NOx level of this previ-ous study (385 ppb) was higher than that of Run 4 (200 ppb).The yields obtained in the present study will be slightly un-derestimated by influence from wall deposition loss of parti-cles and semivolatile compounds. The present and previousresults showed the SOA yield from benzene to be higher thanthat from 1,3,5-TMB.
4 The formation and aging of organics
4.1 Van Krevelen diagram
Particulate organics and nitrates were detected when SOAwas observed by H-ToF-AMS. The O/C ratio of organics in-creased with time, whereas the H/C ratio decreased with time(Fig. S1). Here, HR-AMS NO+ and NO+
2 ions were not in-cluded in O/C and H/C calculations, since these ions weretreated as being formed from nitrates. In this study, benzeneor 1,3,5-TMB does not react away completely during irradi-ation, which means that SOA formation and particle growthare ongoing throughout the experiments; however, the in-crease in the O/C ratio of particulate organics measured byH-ToF-AMS shows SOA aging occurs continuously duringexperiments.
A van Krevelen diagram was studied using the measuredO/C and H/C ratios (Fig. 1). The oxidation state of carbon(OSc = 2 O/C− H/C, Kroll et al., 2011) evaluated for SOAfrom benzene increased from−0.13 to 0.60 as SOA aged.The oxidation state of SOA from 1,3,5-TMB was−1.22 to−0.53. SOA from 1,3,5-TMB was less oxidized than with
Fig. 1. Van Krevelen diagram of SOA formed from the photooxi-dation of aromatic hydrocarbons in the presence of NOx; data ofbenzene and 1,3,5-trimethylbenzene shown with a run number arepresent results; data of other hydrocarbons are taken from Sato etal. (2010); data from ambient organic aerosol measurements appearin a region surrounded by gray curves (Ng et al., 2011).
benzene. The maximum oxidation state of ambient OOA ispredicted to be 1.3 (Ng et al., 2011). This value was higherthan the maximum of the oxidation state of SOA from ben-zene (0.60). The O/C ratios of start points are 0.62 (Run 1),0.64 (Run 2), and 0.70 (Run 3) for experiments with ben-zene and 0.25 (Run 4), 0.27 (Run 5), and 0.31 (Run 6) forexperiments with 1,3,5-TMB. It appears that increased NOxand increased mass loading go with increasing the start pointO/C ratio. The O/C ratio of SOA from aromatic hydrocar-bons was shown to be independent of the NOx level (Chhabraet al., 2011). The present results indicate that the O/C ratioof start point increases with increasing the mass loading.
In Fig. 1, the black dotted straight line with a slope of 0represents the evolution of the H/C and O/C ratios if only al-cohols or peroxides would be formed in the SOA; the blackdotted straight line with a slope of−0.5, the evolution of theH/C and O/C ratios if only carboxylic acids would be pro-duced in the SOA by fragmentation; that with a slope of−1,the evolution of the H/C and O/C ratios if only carboxylicacids or hydroxycarbonyls would be formed in the SOA; andthat with a slope of−2, the evolution of the H/C and O/Cratios if only ketones or aldehydes would be formed in theSOA (Ng et al., 2011). The present data were clustered nearthe straight line with a slope of−1. As SOA ages, the datapoints migrate along this straight line, suggesting that organ-ics present in SOA are rich in carboxylic acids or hydroxy-carbonyls, and the functionalization with a carboxylic groupor that with hydroxy + carbonyl groups on different carbons
Atmos. Chem. Phys., 12, 4667–4682, 2012 www.atmos-chem-phys.net/12/4667/2012/
K. Sato et al.: AMS and LC/MS analyses of high-NOx aromatic SOA 4671
proceeds during SOA aging. In the experiments with 1,3,5-TMB under high mass loading conditions (Runs 5 and 6), thedata appeared in the region between the straight line with aslope of−1 and that with a slope of−0.5, showing that in-creased contributions from alcohols, peroxides, and/or car-boxylic acids formed as a result of fragmentation. Such amass loading dependence is not seen for benzene data, in-dicating that carboxylic acid or hydroxycarbonyl formationis limited, not only due to an increase in mass loading, butalso due to the reactant chemical structure.
The van Krevelen diagram of SOA from various aromatichydrocarbons was studied using the data of Sato et al. (2010).All the data were clustered close to the straight line with aslope of –1 (Fig. 1). Chhabra et al. (2011) reported similarresults for SOA from toluene andm-xylene. These previousresults also suggest that SOA from aromatic hydrocarbons isrich in carboxylic acids or hydroxycarbonyls.
The H/C ratio of SOA from benzene (1.35–1.42) waslower than for 1,3,5-TMB (1.68–1.72); this is because theH/C ratio of precursor benzene is lower than that of 1,3,5-TMB. The H/C ratio of SOA was higher than that of itsprecursor. However, the H/C ratios of dicarbonyl and di-carboxylic acid formed by the ring-opening reaction of anaromatic hydrocarbon are the same as that of the precur-sor (e.g., muconaldehyde (C6H6O2), Calvert et al., 2002,and muconic acid (C6H6O4), Borras and Tortajada-Genaro,2012, from benzene (C6H6)). In SOA particles, not onlyring-opened carboxylic acids but also ring-opened carbonylhydrates (e.g., muconaldehyde hydrate (C6H10O4)) or ring-opened alcohols (e.g., 2,4-hexadiene-1,6-diol (C6H10O2),Borras and Tortajada-Genaro, 2012) will be present. Further,the H/C ratio will also increase if the double bond of ring-opened products is converted to a saturated structure (e.g.,succinic anhydride from toluene, Forstner et al., 1997).
The O/C ratio of SOA from benzene (0.62–0.71) washigher than that of 1,3,5-TMB (0.25–0.47). This is becausevery few of the methyl groups of 1,3,5-TMB are oxidized.In other words, the reactions relevant to SOA formation andaging proceed through the reactions of the aromatic ring.
4.2 LC/TOF-MS analysis
The results of LC/TOF-MS analysis of SOA collected in theexperiment with benzene are shown in Table 2. To determinethe ion formula, the error between the predictedm/zand themeasuredm/zwas evaluated for probable candidates. The ionformula was identified to be the candidate with the mini-mum error. High-polarity products from aromatic hydrocar-bons such as carboxylic acids and phenols are only detectedby LC/MS in negative polarity mode (Sato et al., 2007). Thechemical structure was estimated by assuming that measuredions are deprotonated ring-opened carboxylic acids or depro-tonated phenolic compounds.
The ions ofm/z138 and 154 were identified, using stan-dard reagents, as 4-nitrophenol and 4-nitrocatechol. Other
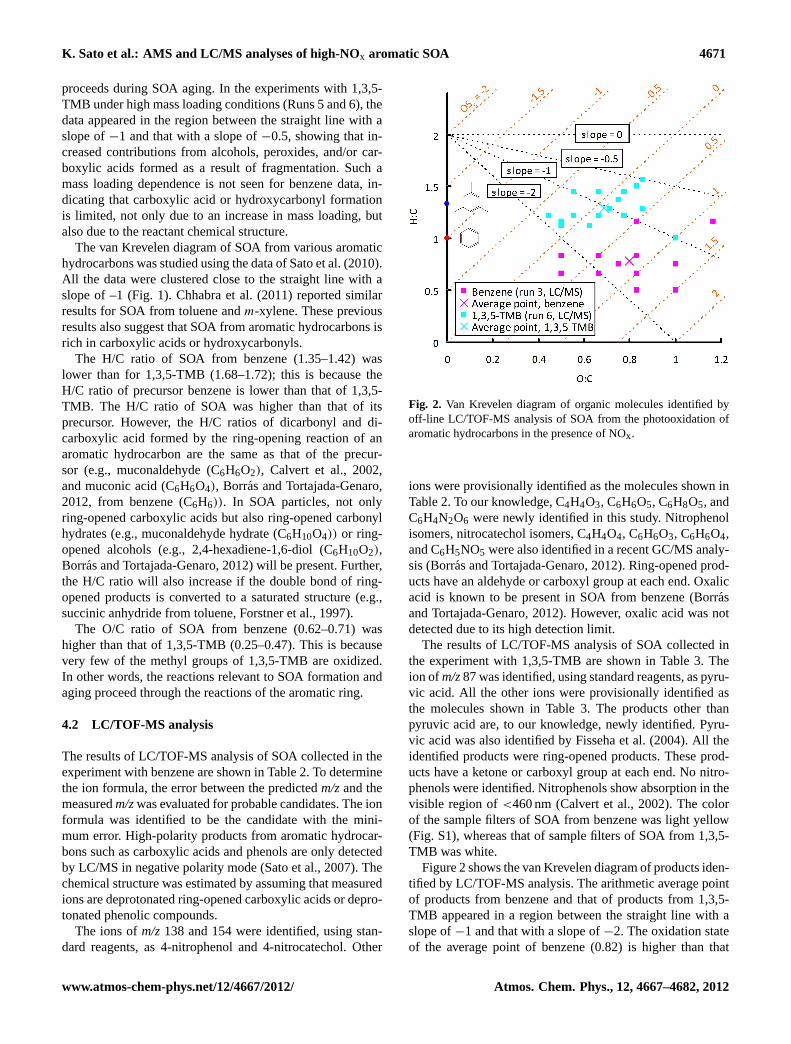
Fig. 2. Van Krevelen diagram of organic molecules identified byoff-line LC/TOF-MS analysis of SOA from the photooxidation ofaromatic hydrocarbons in the presence of NOx.
ions were provisionally identified as the molecules shown inTable 2. To our knowledge, C4H4O3, C6H6O5, C6H8O5, andC6H4N2O6 were newly identified in this study. Nitrophenolisomers, nitrocatechol isomers, C4H4O4, C6H6O3, C6H6O4,and C6H5NO5 were also identified in a recent GC/MS analy-sis (Borras and Tortajada-Genaro, 2012). Ring-opened prod-ucts have an aldehyde or carboxyl group at each end. Oxalicacid is known to be present in SOA from benzene (Borrasand Tortajada-Genaro, 2012). However, oxalic acid was notdetected due to its high detection limit.
The results of LC/TOF-MS analysis of SOA collected inthe experiment with 1,3,5-TMB are shown in Table 3. Theion of m/z87 was identified, using standard reagents, as pyru-vic acid. All the other ions were provisionally identified asthe molecules shown in Table 3. The products other thanpyruvic acid are, to our knowledge, newly identified. Pyru-vic acid was also identified by Fisseha et al. (2004). All theidentified products were ring-opened products. These prod-ucts have a ketone or carboxyl group at each end. No nitro-phenols were identified. Nitrophenols show absorption in thevisible region of<460 nm (Calvert et al., 2002). The colorof the sample filters of SOA from benzene was light yellow(Fig. S1), whereas that of sample filters of SOA from 1,3,5-TMB was white.
Figure 2 shows the van Krevelen diagram of products iden-tified by LC/TOF-MS analysis. The arithmetic average pointof products from benzene and that of products from 1,3,5-TMB appeared in a region between the straight line with aslope of−1 and that with a slope of−2. The oxidation stateof the average point of benzene (0.82) is higher than that
www.atmos-chem-phys.net/12/4667/2012/ Atmos. Chem. Phys., 12, 4667–4682, 2012

4672 K. Sato et al.: AMS and LC/MS analyses of high-NOx aromatic SOA
Table 2.LC/TOFMS measured particulate products from benzene oxidation (Run 3).
Measured ion (m/z) Retention time (min) Suggested ion formula Error (ppm) Proposed structurea Note
99.0080 2.2 C4H3O−
3 8.1
27
Table 2: LC/TOFMS measured particulate products from benzene oxidation (run 3). 1
2
Measured
Ion (m/z)
Retention Time
(min)
Suggested
Ion Formula
Error
(ppm)
Proposed Structure a Note
99.0080 2.2 C4H3O3– 8.1 HOOC
CHO b
115.0022 2.0, 4.3 C4H3O4– 12.9 HOOC
COOH c
125.0239 5.6, 7.5, 23.1 C6H5O3– 4.9 HOOC
CHO d, c
138.0192 21.7, 22.3 C6H4NO3– 3.5
HO NO2
e, c
141.0186 2.0, 7.0, 8.8 C6H5O4– 5.2 HOOC
COOH f, c
154.0145 18.7, 20.0, 22.8 C6H4NO4– 0.4
HO
HO
NO2
g, c
157.0138 1.9, 3.0, 4.1 C6H5O5– 2.7 HOOC
COOH
O b
159.0282 2.1 C6H7O5– 10.7
HOOCCHO
OH
OH
b
170.0093 15.2, 17.8, 19.0 C6H4NO5– 1.2
HO
HO
NO2
OH
c
183.0041 26.6, 27.5 C6H3N2O6– 3.6 HO
NO2
O2N
b
191.0197 3.3 C6H7O7– 0.0
HOOCCOOH
OH
OH
O
b
b
115.0022 2.0, 4.3 C4H3O−
4 12.9
27
Table 2: LC/TOFMS measured particulate products from benzene oxidation (run 3). 1
2
Measured
Ion (m/z)
Retention Time
(min)
Suggested
Ion Formula
Error
(ppm)
Proposed Structure a Note
99.0080 2.2 C4H3O3– 8.1 HOOC
CHO b
115.0022 2.0, 4.3 C4H3O4– 12.9 HOOC
COOH c
125.0239 5.6, 7.5, 23.1 C6H5O3– 4.9 HOOC
CHO d, c
138.0192 21.7, 22.3 C6H4NO3– 3.5
HO NO2
e, c
141.0186 2.0, 7.0, 8.8 C6H5O4– 5.2 HOOC
COOH f, c
154.0145 18.7, 20.0, 22.8 C6H4NO4– 0.4
HO
HO
NO2
g, c
157.0138 1.9, 3.0, 4.1 C6H5O5– 2.7 HOOC
COOH
O b
159.0282 2.1 C6H7O5– 10.7
HOOCCHO
OH
OH
b
170.0093 15.2, 17.8, 19.0 C6H4NO5– 1.2
HO
HO
NO2
OH
c
183.0041 26.6, 27.5 C6H3N2O6– 3.6 HO
NO2
O2N
b
191.0197 3.3 C6H7O7– 0.0
HOOCCOOH
OH
OH
O
b
c
125.0239 5.6, 7.5, 23.1 C6H5O−
3 4.9
27
Table 2: LC/TOFMS measured particulate products from benzene oxidation (run 3). 1
2
Measured
Ion (m/z)
Retention Time
(min)
Suggested
Ion Formula
Error
(ppm)
Proposed Structure a Note
99.0080 2.2 C4H3O3– 8.1 HOOC
CHO b
115.0022 2.0, 4.3 C4H3O4– 12.9 HOOC
COOH c
125.0239 5.6, 7.5, 23.1 C6H5O3– 4.9 HOOC
CHO d, c
138.0192 21.7, 22.3 C6H4NO3– 3.5
HO NO2
e, c
141.0186 2.0, 7.0, 8.8 C6H5O4– 5.2 HOOC
COOH f, c
154.0145 18.7, 20.0, 22.8 C6H4NO4– 0.4
HO
HO
NO2
g, c
157.0138 1.9, 3.0, 4.1 C6H5O5– 2.7 HOOC
COOH
O b
159.0282 2.1 C6H7O5– 10.7
HOOCCHO
OH
OH
b
170.0093 15.2, 17.8, 19.0 C6H4NO5– 1.2
HO
HO
NO2
OH
c
183.0041 26.6, 27.5 C6H3N2O6– 3.6 HO
NO2
O2N
b
191.0197 3.3 C6H7O7– 0.0
HOOCCOOH
OH
OH
O
b
d, c
138.0192 21.7, 22.3 C6H4NO−
3 3.5
27
Table 2: LC/TOFMS measured particulate products from benzene oxidation (run 3). 1
2
Measured
Ion (m/z)
Retention Time
(min)
Suggested
Ion Formula
Error
(ppm)
Proposed Structure a Note
99.0080 2.2 C4H3O3– 8.1 HOOC
CHO b
115.0022 2.0, 4.3 C4H3O4– 12.9 HOOC
COOH c
125.0239 5.6, 7.5, 23.1 C6H5O3– 4.9 HOOC
CHO d, c
138.0192 21.7, 22.3 C6H4NO3– 3.5
HO NO2
e, c
141.0186 2.0, 7.0, 8.8 C6H5O4– 5.2 HOOC
COOH f, c
154.0145 18.7, 20.0, 22.8 C6H4NO4– 0.4
HO
HO
NO2
g, c
157.0138 1.9, 3.0, 4.1 C6H5O5– 2.7 HOOC
COOH
O b
159.0282 2.1 C6H7O5– 10.7
HOOCCHO
OH
OH
b
170.0093 15.2, 17.8, 19.0 C6H4NO5– 1.2
HO
HO
NO2
OH
c
183.0041 26.6, 27.5 C6H3N2O6– 3.6 HO
NO2
O2N
b
191.0197 3.3 C6H7O7– 0.0
HOOCCOOH
OH
OH
O
b
e, c
141.0186 2.0, 7.0, 8.8 C6H5O−
4 5.2
27
Table 2: LC/TOFMS measured particulate products from benzene oxidation (run 3). 1
2
Measured
Ion (m/z)
Retention Time
(min)
Suggested
Ion Formula
Error
(ppm)
Proposed Structure a Note
99.0080 2.2 C4H3O3– 8.1 HOOC
CHO b
115.0022 2.0, 4.3 C4H3O4– 12.9 HOOC
COOH c
125.0239 5.6, 7.5, 23.1 C6H5O3– 4.9 HOOC
CHO d, c
138.0192 21.7, 22.3 C6H4NO3– 3.5
HO NO2
e, c
141.0186 2.0, 7.0, 8.8 C6H5O4– 5.2 HOOC
COOH f, c
154.0145 18.7, 20.0, 22.8 C6H4NO4– 0.4
HO
HO
NO2
g, c
157.0138 1.9, 3.0, 4.1 C6H5O5– 2.7 HOOC
COOH
O b
159.0282 2.1 C6H7O5– 10.7
HOOCCHO
OH
OH
b
170.0093 15.2, 17.8, 19.0 C6H4NO5– 1.2
HO
HO
NO2
OH
c
183.0041 26.6, 27.5 C6H3N2O6– 3.6 HO
NO2
O2N
b
191.0197 3.3 C6H7O7– 0.0
HOOCCOOH
OH
OH
O
b
f, c
154.0145 18.7, 20.0, 22.8 C6H4NO−
4 0.4
27
Table 2: LC/TOFMS measured particulate products from benzene oxidation (run 3). 1
2
Measured
Ion (m/z)
Retention Time
(min)
Suggested
Ion Formula
Error
(ppm)
Proposed Structure a Note
99.0080 2.2 C4H3O3– 8.1 HOOC
CHO b
115.0022 2.0, 4.3 C4H3O4– 12.9 HOOC
COOH c
125.0239 5.6, 7.5, 23.1 C6H5O3– 4.9 HOOC
CHO d, c
138.0192 21.7, 22.3 C6H4NO3– 3.5
HO NO2
e, c
141.0186 2.0, 7.0, 8.8 C6H5O4– 5.2 HOOC
COOH f, c
154.0145 18.7, 20.0, 22.8 C6H4NO4– 0.4
HO
HO
NO2
g, c
157.0138 1.9, 3.0, 4.1 C6H5O5– 2.7 HOOC
COOH
O b
159.0282 2.1 C6H7O5– 10.7
HOOCCHO
OH
OH
b
170.0093 15.2, 17.8, 19.0 C6H4NO5– 1.2
HO
HO
NO2
OH
c
183.0041 26.6, 27.5 C6H3N2O6– 3.6 HO
NO2
O2N
b
191.0197 3.3 C6H7O7– 0.0
HOOCCOOH
OH
OH
O
b
g, c
157.0138 1.9, 3.0, 4.1 C6H5O−
5 2.7
27
Table 2: LC/TOFMS measured particulate products from benzene oxidation (run 3). 1
2
Measured
Ion (m/z)
Retention Time
(min)
Suggested
Ion Formula
Error
(ppm)
Proposed Structure a Note
99.0080 2.2 C4H3O3– 8.1 HOOC
CHO b
115.0022 2.0, 4.3 C4H3O4– 12.9 HOOC
COOH c
125.0239 5.6, 7.5, 23.1 C6H5O3– 4.9 HOOC
CHO d, c
138.0192 21.7, 22.3 C6H4NO3– 3.5
HO NO2
e, c
141.0186 2.0, 7.0, 8.8 C6H5O4– 5.2 HOOC
COOH f, c
154.0145 18.7, 20.0, 22.8 C6H4NO4– 0.4
HO
HO
NO2
g, c
157.0138 1.9, 3.0, 4.1 C6H5O5– 2.7 HOOC
COOH
O b
159.0282 2.1 C6H7O5– 10.7
HOOCCHO
OH
OH
b
170.0093 15.2, 17.8, 19.0 C6H4NO5– 1.2
HO
HO
NO2
OH
c
183.0041 26.6, 27.5 C6H3N2O6– 3.6 HO
NO2
O2N
b
191.0197 3.3 C6H7O7– 0.0
HOOCCOOH
OH
OH
O
b
b
159.0282 2.1 C6H7O−
5 10.7
27
Table 2: LC/TOFMS measured particulate products from benzene oxidation (run 3). 1
2
Measured
Ion (m/z)
Retention Time
(min)
Suggested
Ion Formula
Error
(ppm)
Proposed Structure a Note
99.0080 2.2 C4H3O3– 8.1 HOOC
CHO b
115.0022 2.0, 4.3 C4H3O4– 12.9 HOOC
COOH c
125.0239 5.6, 7.5, 23.1 C6H5O3– 4.9 HOOC
CHO d, c
138.0192 21.7, 22.3 C6H4NO3– 3.5
HO NO2
e, c
141.0186 2.0, 7.0, 8.8 C6H5O4– 5.2 HOOC
COOH f, c
154.0145 18.7, 20.0, 22.8 C6H4NO4– 0.4
HO
HO
NO2
g, c
157.0138 1.9, 3.0, 4.1 C6H5O5– 2.7 HOOC
COOH
O b
159.0282 2.1 C6H7O5– 10.7
HOOCCHO
OH
OH
b
170.0093 15.2, 17.8, 19.0 C6H4NO5– 1.2
HO
HO
NO2
OH
c
183.0041 26.6, 27.5 C6H3N2O6– 3.6 HO
NO2
O2N
b
191.0197 3.3 C6H7O7– 0.0
HOOCCOOH
OH
OH
O
b
b
170.0093 15.2, 17.8, 19.0 C6H4NO−
5 1.2
27
Table 2: LC/TOFMS measured particulate products from benzene oxidation (run 3). 1
2
Measured
Ion (m/z)
Retention Time
(min)
Suggested
Ion Formula
Error
(ppm)
Proposed Structure a Note
99.0080 2.2 C4H3O3– 8.1 HOOC
CHO b
115.0022 2.0, 4.3 C4H3O4– 12.9 HOOC
COOH c
125.0239 5.6, 7.5, 23.1 C6H5O3– 4.9 HOOC
CHO d, c
138.0192 21.7, 22.3 C6H4NO3– 3.5
HO NO2
e, c
141.0186 2.0, 7.0, 8.8 C6H5O4– 5.2 HOOC
COOH f, c
154.0145 18.7, 20.0, 22.8 C6H4NO4– 0.4
HO
HO
NO2
g, c
157.0138 1.9, 3.0, 4.1 C6H5O5– 2.7 HOOC
COOH
O b
159.0282 2.1 C6H7O5– 10.7
HOOCCHO
OH
OH
b
170.0093 15.2, 17.8, 19.0 C6H4NO5– 1.2
HO
HO
NO2
OH
c
183.0041 26.6, 27.5 C6H3N2O6– 3.6 HO
NO2
O2N
b
191.0197 3.3 C6H7O7– 0.0
HOOCCOOH
OH
OH
O
b
c
183.0041 26.6, 27.5 C6H3N2O−
6 3.6
27
Table 2: LC/TOFMS measured particulate products from benzene oxidation (run 3). 1
2
Measured
Ion (m/z)
Retention Time
(min)
Suggested
Ion Formula
Error
(ppm)
Proposed Structure a Note
99.0080 2.2 C4H3O3– 8.1 HOOC
CHO b
115.0022 2.0, 4.3 C4H3O4– 12.9 HOOC
COOH c
125.0239 5.6, 7.5, 23.1 C6H5O3– 4.9 HOOC
CHO d, c
138.0192 21.7, 22.3 C6H4NO3– 3.5
HO NO2
e, c
141.0186 2.0, 7.0, 8.8 C6H5O4– 5.2 HOOC
COOH f, c
154.0145 18.7, 20.0, 22.8 C6H4NO4– 0.4
HO
HO
NO2
g, c
157.0138 1.9, 3.0, 4.1 C6H5O5– 2.7 HOOC
COOH
O b
159.0282 2.1 C6H7O5– 10.7
HOOCCHO
OH
OH
b
170.0093 15.2, 17.8, 19.0 C6H4NO5– 1.2
HO
HO
NO2
OH
c
183.0041 26.6, 27.5 C6H3N2O6– 3.6 HO
NO2
O2N
b
191.0197 3.3 C6H7O7– 0.0
HOOCCOOH
OH
OH
O
b
b
191.0197 3.3 C6H7O−
7 0.0
27
Table 2: LC/TOFMS measured particulate products from benzene oxidation (run 3). 1
2
Measured
Ion (m/z)
Retention Time
(min)
Suggested
Ion Formula
Error
(ppm)
Proposed Structure a Note
99.0080 2.2 C4H3O3– 8.1 HOOC
CHO b
115.0022 2.0, 4.3 C4H3O4– 12.9 HOOC
COOH c
125.0239 5.6, 7.5, 23.1 C6H5O3– 4.9 HOOC
CHO d, c
138.0192 21.7, 22.3 C6H4NO3– 3.5
HO NO2
e, c
141.0186 2.0, 7.0, 8.8 C6H5O4– 5.2 HOOC
COOH f, c
154.0145 18.7, 20.0, 22.8 C6H4NO4– 0.4
HO
HO
NO2
g, c
157.0138 1.9, 3.0, 4.1 C6H5O5– 2.7 HOOC
COOH
O b
159.0282 2.1 C6H7O5– 10.7
HOOCCHO
OH
OH
b
170.0093 15.2, 17.8, 19.0 C6H4NO5– 1.2
HO
HO
NO2
OH
c
183.0041 26.6, 27.5 C6H3N2O6– 3.6 HO
NO2
O2N
b
191.0197 3.3 C6H7O7– 0.0
HOOCCOOH
OH
OH
O
b
b
198.9993 21.9 C6H3N2O−
6 1.7
28
Table 2. Continued. 1
a Structural and stereo isomers are likely; for simplicity only one isomer is shown. 2
b Newly identified. 3
c Found very recently by GC/MS analysis (Borrás et al., 2011). 4
d Latest-eluting compound will have cyclic structure. 5
e Two peaks were identified to be 2-nitrophenol and 4-nitrophenol; the signal of 4-nitrophenol 6
was stronger than the other. 7
f No strong signal of trans,trans-muconic acid was found; detected peaks will be attributed to 8
other structural isomers. 9
g Strongest peak was identified to be 4-nitrocatecol. 10
Measured
Ion (m/z)
Retention Time
(min)
Suggested
Ion Formula
Error
(ppm)
Proposed Structure a Note
198.9993 21.9 C6H3N2O6– 1.7
HO
HO
NO2
O2N
b
b
a Structural and stereo isomers are likely; for simplicity only one isomer is shown,b newly identified,c found very recently by GC/MS analysis (Borras et al., 2012),d latest-eluting compound will have cyclic structure,e two peaks were identified to be 2-nitrophenol and 4-nitrophenol; the signal of 4-nitrophenol (21.7 min) wasstronger than the other,f no strong signal of trans,trans-muconic acid was found; detected peaks will be attributed to other structural isomers. The peak at 8.8 min wasthe highest,g strongest peak was identified to be 4-nitrocatechol.
determined by H-ToF-AMS for benzene SOA (0.55), wherethe H-ToF-AMS data were averaged during the filter sam-pling period only. A similar result was obtained for 1,3,5-TMB, indicating that products undetectable by the LC/TOF-MS instrument have lower oxidation states than detectableones. On the other hand, the oxidation state of the prod-ucts from benzene was higher than that of the products from
1,3,5-TMB. The results of LC/TOF-MS analysis also show atendency for products from benzene to be more highly oxi-dized than those from 1,3,5-TMB.
Signals for oligomers were detected in the regionm/z250–600 (benzene sample) and in the regionm/z250–1000 (1,3,5-TMB sample) by flow injection analysis (Fig. S3). The dif-ference in oligomer distribution is likely to result from the
Atmos. Chem. Phys., 12, 4667–4682, 2012 www.atmos-chem-phys.net/12/4667/2012/

K. Sato et al.: AMS and LC/MS analyses of high-NOx aromatic SOA 4673
Table 3.LC/TOFMS measured particulate products from 1,3,5-TMB oxidation (Run 6).
Measured ion (m/z) Retention time (min) Suggested ion formula Error (ppm) Proposed structurea Note
87.0080 6.2 C3H3O−
3 9.0
29
Table 3: LC/TOFMS measured particulate products from 1,3,5-TMB oxidation (run 6). 1
Measured
Ion (m/z)
Retention Time
(min)
Suggested
Ion Formula
Error
(ppm)
Proposed Structure a Note
87.0080 6.2 C3H3O3– 9.0
HOOC O b, c
127.0393 11.6, 12.1, 13.8 C6H7O3– 6.0
HOOC O d
161.0456 4.6, 6.1 C6H9O5– -0.1
HOOC OOH
OH
d
169.0494 13.2, 14.7 C8H9O4– 7.0
HOOCCOOH
d
173.0444 8.0, 11.6 C7H9O5– 6.3
HOOC COOHO
d
183.0650 15.0, 17.3 C9H11O4– 6.8
HOOCO
O
d
185.0444 8.2, 11.4 C8H9O5– 6.0
HOOCCOOH
O
d
189.0405 7.3 C7H9O6– 0.1
HOOC COOH
OOH
d
191.0562 3.1 C7H11O6– -0.3
HOOC COOH
OHOH
d
199.0597 14.7 C9H11O5– 7.6
HOOCO
O
O
d
201.0747 11.6, 12.1 C9H13O5– 10.4
HOOCOH
O
OH
d
203.0548 12.0, 12.9 C8H11O6– 6.6
HOOCCOOH
OHO OH
d
b, c
127.0393 11.6, 12.1, 13.8 C6H7O−
3 6.0
29
Table 3: LC/TOFMS measured particulate products from 1,3,5-TMB oxidation (run 6). 1
Measured
Ion (m/z)
Retention Time
(min)
Suggested
Ion Formula
Error
(ppm)
Proposed Structure a Note
87.0080 6.2 C3H3O3– 9.0
HOOC O b, c
127.0393 11.6, 12.1, 13.8 C6H7O3– 6.0
HOOC O d
161.0456 4.6, 6.1 C6H9O5– -0.1
HOOC OOH
OH
d
169.0494 13.2, 14.7 C8H9O4– 7.0
HOOCCOOH
d
173.0444 8.0, 11.6 C7H9O5– 6.3
HOOC COOHO
d
183.0650 15.0, 17.3 C9H11O4– 6.8
HOOCO
O
d
185.0444 8.2, 11.4 C8H9O5– 6.0
HOOCCOOH
O
d
189.0405 7.3 C7H9O6– 0.1
HOOC COOH
OOH
d
191.0562 3.1 C7H11O6– -0.3
HOOC COOH
OHOH
d
199.0597 14.7 C9H11O5– 7.6
HOOCO
O
O
d
201.0747 11.6, 12.1 C9H13O5– 10.4
HOOCOH
O
OH
d
203.0548 12.0, 12.9 C8H11O6– 6.6
HOOCCOOH
OHO OH
d
d
161.0456 4.6, 6.1 C6H9O−
5 –0.1
29
Table 3: LC/TOFMS measured particulate products from 1,3,5-TMB oxidation (run 6). 1
Measured
Ion (m/z)
Retention Time
(min)
Suggested
Ion Formula
Error
(ppm)
Proposed Structure a Note
87.0080 6.2 C3H3O3– 9.0
HOOC O b, c
127.0393 11.6, 12.1, 13.8 C6H7O3– 6.0
HOOC O d
161.0456 4.6, 6.1 C6H9O5– -0.1
HOOC OOH
OH
d
169.0494 13.2, 14.7 C8H9O4– 7.0
HOOCCOOH
d
173.0444 8.0, 11.6 C7H9O5– 6.3
HOOC COOHO
d
183.0650 15.0, 17.3 C9H11O4– 6.8
HOOCO
O
d
185.0444 8.2, 11.4 C8H9O5– 6.0
HOOCCOOH
O
d
189.0405 7.3 C7H9O6– 0.1
HOOC COOH
OOH
d
191.0562 3.1 C7H11O6– -0.3
HOOC COOH
OHOH
d
199.0597 14.7 C9H11O5– 7.6
HOOCO
O
O
d
201.0747 11.6, 12.1 C9H13O5– 10.4
HOOCOH
O
OH
d
203.0548 12.0, 12.9 C8H11O6– 6.6
HOOCCOOH
OHO OH
d
d
169.0494 13.2, 14.7 C8H9O−
4 7.0
29
Table 3: LC/TOFMS measured particulate products from 1,3,5-TMB oxidation (run 6). 1
Measured
Ion (m/z)
Retention Time
(min)
Suggested
Ion Formula
Error
(ppm)
Proposed Structure a Note
87.0080 6.2 C3H3O3– 9.0
HOOC O b, c
127.0393 11.6, 12.1, 13.8 C6H7O3– 6.0
HOOC O d
161.0456 4.6, 6.1 C6H9O5– -0.1
HOOC OOH
OH
d
169.0494 13.2, 14.7 C8H9O4– 7.0
HOOCCOOH
d
173.0444 8.0, 11.6 C7H9O5– 6.3
HOOC COOHO
d
183.0650 15.0, 17.3 C9H11O4– 6.8
HOOCO
O
d
185.0444 8.2, 11.4 C8H9O5– 6.0
HOOCCOOH
O
d
189.0405 7.3 C7H9O6– 0.1
HOOC COOH
OOH
d
191.0562 3.1 C7H11O6– -0.3
HOOC COOH
OHOH
d
199.0597 14.7 C9H11O5– 7.6
HOOCO
O
O
d
201.0747 11.6, 12.1 C9H13O5– 10.4
HOOCOH
O
OH
d
203.0548 12.0, 12.9 C8H11O6– 6.6
HOOCCOOH
OHO OH
d
d
173.0444 8.0, 11.6 C7H9O−
5 6.3
29
Table 3: LC/TOFMS measured particulate products from 1,3,5-TMB oxidation (run 6). 1
Measured
Ion (m/z)
Retention Time
(min)
Suggested
Ion Formula
Error
(ppm)
Proposed Structure a Note
87.0080 6.2 C3H3O3– 9.0
HOOC O b, c
127.0393 11.6, 12.1, 13.8 C6H7O3– 6.0
HOOC O d
161.0456 4.6, 6.1 C6H9O5– -0.1
HOOC OOH
OH
d
169.0494 13.2, 14.7 C8H9O4– 7.0
HOOCCOOH
d
173.0444 8.0, 11.6 C7H9O5– 6.3
HOOC COOHO
d
183.0650 15.0, 17.3 C9H11O4– 6.8
HOOCO
O
d
185.0444 8.2, 11.4 C8H9O5– 6.0
HOOCCOOH
O
d
189.0405 7.3 C7H9O6– 0.1
HOOC COOH
OOH
d
191.0562 3.1 C7H11O6– -0.3
HOOC COOH
OHOH
d
199.0597 14.7 C9H11O5– 7.6
HOOCO
O
O
d
201.0747 11.6, 12.1 C9H13O5– 10.4
HOOCOH
O
OH
d
203.0548 12.0, 12.9 C8H11O6– 6.6
HOOCCOOH
OHO OH
d
d
183.0650 15.0, 17.3 C9H11O−
4 6.8
29
Table 3: LC/TOFMS measured particulate products from 1,3,5-TMB oxidation (run 6). 1
Measured
Ion (m/z)
Retention Time
(min)
Suggested
Ion Formula
Error
(ppm)
Proposed Structure a Note
87.0080 6.2 C3H3O3– 9.0
HOOC O b, c
127.0393 11.6, 12.1, 13.8 C6H7O3– 6.0
HOOC O d
161.0456 4.6, 6.1 C6H9O5– -0.1
HOOC OOH
OH
d
169.0494 13.2, 14.7 C8H9O4– 7.0
HOOCCOOH
d
173.0444 8.0, 11.6 C7H9O5– 6.3
HOOC COOHO
d
183.0650 15.0, 17.3 C9H11O4– 6.8
HOOCO
O
d
185.0444 8.2, 11.4 C8H9O5– 6.0
HOOCCOOH
O
d
189.0405 7.3 C7H9O6– 0.1
HOOC COOH
OOH
d
191.0562 3.1 C7H11O6– -0.3
HOOC COOH
OHOH
d
199.0597 14.7 C9H11O5– 7.6
HOOCO
O
O
d
201.0747 11.6, 12.1 C9H13O5– 10.4
HOOCOH
O
OH
d
203.0548 12.0, 12.9 C8H11O6– 6.6
HOOCCOOH
OHO OH
d
d
185.0444 8.2, 11.4 C8H9O−
5 6.0
29
Table 3: LC/TOFMS measured particulate products from 1,3,5-TMB oxidation (run 6). 1
Measured
Ion (m/z)
Retention Time
(min)
Suggested
Ion Formula
Error
(ppm)
Proposed Structure a Note
87.0080 6.2 C3H3O3– 9.0
HOOC O b, c
127.0393 11.6, 12.1, 13.8 C6H7O3– 6.0
HOOC O d
161.0456 4.6, 6.1 C6H9O5– -0.1
HOOC OOH
OH
d
169.0494 13.2, 14.7 C8H9O4– 7.0
HOOCCOOH
d
173.0444 8.0, 11.6 C7H9O5– 6.3
HOOC COOHO
d
183.0650 15.0, 17.3 C9H11O4– 6.8
HOOCO
O
d
185.0444 8.2, 11.4 C8H9O5– 6.0
HOOCCOOH
O
d
189.0405 7.3 C7H9O6– 0.1
HOOC COOH
OOH
d
191.0562 3.1 C7H11O6– -0.3
HOOC COOH
OHOH
d
199.0597 14.7 C9H11O5– 7.6
HOOCO
O
O
d
201.0747 11.6, 12.1 C9H13O5– 10.4
HOOCOH
O
OH
d
203.0548 12.0, 12.9 C8H11O6– 6.6
HOOCCOOH
OHO OH
d
d
189.0405 7.3 C7H9O−
6 0.1
29
Table 3: LC/TOFMS measured particulate products from 1,3,5-TMB oxidation (run 6). 1
Measured
Ion (m/z)
Retention Time
(min)
Suggested
Ion Formula
Error
(ppm)
Proposed Structure a Note
87.0080 6.2 C3H3O3– 9.0
HOOC O b, c
127.0393 11.6, 12.1, 13.8 C6H7O3– 6.0
HOOC O d
161.0456 4.6, 6.1 C6H9O5– -0.1
HOOC OOH
OH
d
169.0494 13.2, 14.7 C8H9O4– 7.0
HOOCCOOH
d
173.0444 8.0, 11.6 C7H9O5– 6.3
HOOC COOHO
d
183.0650 15.0, 17.3 C9H11O4– 6.8
HOOCO
O
d
185.0444 8.2, 11.4 C8H9O5– 6.0
HOOCCOOH
O
d
189.0405 7.3 C7H9O6– 0.1
HOOC COOH
OOH
d
191.0562 3.1 C7H11O6– -0.3
HOOC COOH
OHOH
d
199.0597 14.7 C9H11O5– 7.6
HOOCO
O
O
d
201.0747 11.6, 12.1 C9H13O5– 10.4
HOOCOH
O
OH
d
203.0548 12.0, 12.9 C8H11O6– 6.6
HOOCCOOH
OHO OH
d
d
191.0562 3.1 C7H11O−
6 –0.3
29
Table 3: LC/TOFMS measured particulate products from 1,3,5-TMB oxidation (run 6). 1
Measured
Ion (m/z)
Retention Time
(min)
Suggested
Ion Formula
Error
(ppm)
Proposed Structure a Note
87.0080 6.2 C3H3O3– 9.0
HOOC O b, c
127.0393 11.6, 12.1, 13.8 C6H7O3– 6.0
HOOC O d
161.0456 4.6, 6.1 C6H9O5– -0.1
HOOC OOH
OH
d
169.0494 13.2, 14.7 C8H9O4– 7.0
HOOCCOOH
d
173.0444 8.0, 11.6 C7H9O5– 6.3
HOOC COOHO
d
183.0650 15.0, 17.3 C9H11O4– 6.8
HOOCO
O
d
185.0444 8.2, 11.4 C8H9O5– 6.0
HOOCCOOH
O
d
189.0405 7.3 C7H9O6– 0.1
HOOC COOH
OOH
d
191.0562 3.1 C7H11O6– -0.3
HOOC COOH
OHOH
d
199.0597 14.7 C9H11O5– 7.6
HOOCO
O
O
d
201.0747 11.6, 12.1 C9H13O5– 10.4
HOOCOH
O
OH
d
203.0548 12.0, 12.9 C8H11O6– 6.6
HOOCCOOH
OHO OH
d
d
199.0597 14.7 C9H11O−
5 7.6
29
Table 3: LC/TOFMS measured particulate products from 1,3,5-TMB oxidation (run 6). 1
Measured
Ion (m/z)
Retention Time
(min)
Suggested
Ion Formula
Error
(ppm)
Proposed Structure a Note
87.0080 6.2 C3H3O3– 9.0
HOOC O b, c
127.0393 11.6, 12.1, 13.8 C6H7O3– 6.0
HOOC O d
161.0456 4.6, 6.1 C6H9O5– -0.1
HOOC OOH
OH
d
169.0494 13.2, 14.7 C8H9O4– 7.0
HOOCCOOH
d
173.0444 8.0, 11.6 C7H9O5– 6.3
HOOC COOHO
d
183.0650 15.0, 17.3 C9H11O4– 6.8
HOOCO
O
d
185.0444 8.2, 11.4 C8H9O5– 6.0
HOOCCOOH
O
d
189.0405 7.3 C7H9O6– 0.1
HOOC COOH
OOH
d
191.0562 3.1 C7H11O6– -0.3
HOOC COOH
OHOH
d
199.0597 14.7 C9H11O5– 7.6
HOOCO
O
O
d
201.0747 11.6, 12.1 C9H13O5– 10.4
HOOCOH
O
OH
d
203.0548 12.0, 12.9 C8H11O6– 6.6
HOOCCOOH
OHO OH
d
d
201.0747 11.6, 12.1 C9H13O−
5 10.4
29
Table 3: LC/TOFMS measured particulate products from 1,3,5-TMB oxidation (run 6). 1
Measured
Ion (m/z)
Retention Time
(min)
Suggested
Ion Formula
Error
(ppm)
Proposed Structure a Note
87.0080 6.2 C3H3O3– 9.0
HOOC O b, c
127.0393 11.6, 12.1, 13.8 C6H7O3– 6.0
HOOC O d
161.0456 4.6, 6.1 C6H9O5– -0.1
HOOC OOH
OH
d
169.0494 13.2, 14.7 C8H9O4– 7.0
HOOCCOOH
d
173.0444 8.0, 11.6 C7H9O5– 6.3
HOOC COOHO
d
183.0650 15.0, 17.3 C9H11O4– 6.8
HOOCO
O
d
185.0444 8.2, 11.4 C8H9O5– 6.0
HOOCCOOH
O
d
189.0405 7.3 C7H9O6– 0.1
HOOC COOH
OOH
d
191.0562 3.1 C7H11O6– -0.3
HOOC COOH
OHOH
d
199.0597 14.7 C9H11O5– 7.6
HOOCO
O
O
d
201.0747 11.6, 12.1 C9H13O5– 10.4
HOOCOH
O
OH
d
203.0548 12.0, 12.9 C8H11O6– 6.6
HOOCCOOH
OHO OH
d
d
203.0548 12.0, 12.9 C8H11O−
6 6.6
29
Table 3: LC/TOFMS measured particulate products from 1,3,5-TMB oxidation (run 6). 1
Measured
Ion (m/z)
Retention Time
(min)
Suggested
Ion Formula
Error
(ppm)
Proposed Structure a Note
87.0080 6.2 C3H3O3– 9.0
HOOC O b, c
127.0393 11.6, 12.1, 13.8 C6H7O3– 6.0
HOOC O d
161.0456 4.6, 6.1 C6H9O5– -0.1
HOOC OOH
OH
d
169.0494 13.2, 14.7 C8H9O4– 7.0
HOOCCOOH
d
173.0444 8.0, 11.6 C7H9O5– 6.3
HOOC COOHO
d
183.0650 15.0, 17.3 C9H11O4– 6.8
HOOCO
O
d
185.0444 8.2, 11.4 C8H9O5– 6.0
HOOCCOOH
O
d
189.0405 7.3 C7H9O6– 0.1
HOOC COOH
OOH
d
191.0562 3.1 C7H11O6– -0.3
HOOC COOH
OHOH
d
199.0597 14.7 C9H11O5– 7.6
HOOCO
O
O
d
201.0747 11.6, 12.1 C9H13O5– 10.4
HOOCOH
O
OH
d
203.0548 12.0, 12.9 C8H11O6– 6.6
HOOCCOOH
OHO OH
d
d
215.0547 10.2, 15.9 C9H11O−
6 6.8
30
Table 3. Continued. 1
a Structural and stereo isomers are likely; for simplicity only one isomer is shown. 2
b Identified to be pyruvic acid. 3
c Found by ion chromatograph-mass spectrometry by Fisseha et al. (2004). 4
d Newly identified. 5
Measured
Ion (m/z)
Retention Time
(min)
Suggested
Ion Formula
Error
(ppm)
Proposed Structure a Note
215.0547 10.2, 15.9 C9H11O6– 6.8
HOOC O
OO OH
d
217.0708 8.4 C9H13O6– 4.4
HOOCO
O
OHOH
d
231.0507 13.0, 16.9, 20.8 C9H11O7– 1.4
HOOC
O
O
OOH OH
d
233.0652 8.7, 16.3, 17.0 C9H13O7– 6.3
HOOC
OH
O
OOH OH
d
d
217.0708 8.4 C9H13O−
6 4.4
30
Table 3. Continued. 1
a Structural and stereo isomers are likely; for simplicity only one isomer is shown. 2
b Identified to be pyruvic acid. 3
c Found by ion chromatograph-mass spectrometry by Fisseha et al. (2004). 4
d Newly identified. 5
Measured
Ion (m/z)
Retention Time
(min)
Suggested
Ion Formula
Error
(ppm)
Proposed Structure a Note
215.0547 10.2, 15.9 C9H11O6– 6.8
HOOC O
OO OH
d
217.0708 8.4 C9H13O6– 4.4
HOOCO
O
OHOH
d
231.0507 13.0, 16.9, 20.8 C9H11O7– 1.4
HOOC
O
O
OOH OH
d
233.0652 8.7, 16.3, 17.0 C9H13O7– 6.3
HOOC
OH
O
OOH OH
d
d
231.0507 13.0, 16.9, 20.8 C9H11O−
7 1.4
30
Table 3. Continued. 1
a Structural and stereo isomers are likely; for simplicity only one isomer is shown. 2
b Identified to be pyruvic acid. 3
c Found by ion chromatograph-mass spectrometry by Fisseha et al. (2004). 4
d Newly identified. 5
Measured
Ion (m/z)
Retention Time
(min)
Suggested
Ion Formula
Error
(ppm)
Proposed Structure a Note
215.0547 10.2, 15.9 C9H11O6– 6.8
HOOC O
OO OH
d
217.0708 8.4 C9H13O6– 4.4
HOOCO
O
OHOH
d
231.0507 13.0, 16.9, 20.8 C9H11O7– 1.4
HOOC
O
O
OOH OH
d
233.0652 8.7, 16.3, 17.0 C9H13O7– 6.3
HOOC
OH
O
OOH OH
d
d
233.0652 8.7, 16.3, 17.0 C9H13O−
7 6.3
30
Table 3. Continued. 1
a Structural and stereo isomers are likely; for simplicity only one isomer is shown. 2
b Identified to be pyruvic acid. 3
c Found by ion chromatograph-mass spectrometry by Fisseha et al. (2004). 4
d Newly identified. 5
Measured
Ion (m/z)
Retention Time
(min)
Suggested
Ion Formula
Error
(ppm)
Proposed Structure a Note
215.0547 10.2, 15.9 C9H11O6– 6.8
HOOC O
OO OH
d
217.0708 8.4 C9H13O6– 4.4
HOOCO
O
OHOH
d
231.0507 13.0, 16.9, 20.8 C9H11O7– 1.4
HOOC
O
O
OOH OH
d
233.0652 8.7, 16.3, 17.0 C9H13O7– 6.3
HOOC
OH
O
OOH OH
d
d
a Structural and stereo isomers are likely; for simplicity only one isomer is shown,b identified to be pyruvic acid,c found by ion chromatograph-mass spectrometryby Fisseha et al. (2004),d newly identified.
www.atmos-chem-phys.net/12/4667/2012/ Atmos. Chem. Phys., 12, 4667–4682, 2012

4674 K. Sato et al.: AMS and LC/MS analyses of high-NOx aromatic SOA
Fig. 3. Reaction schemes of(a) SOA formation from benzene photooxidation,(b) SOA formation from 1,3,5-trimethylbenzene photooxi-dation, and(c) SOA aging. A probable pathway to form each depicted product is only shown for simplicity; caroboxylic acid can also beproduced by the heterogeneous decomposition of peroxyacyl nitrates (PANs) from the acyl peroxy radical + NO2 reaction (Surratt et al.,2010); hydroxycarbonyl produced by functionalization can also be formed by the reaction of hydroxy peroxy radical with R′′O2; hydroxyperoxy radical of the intermediate of fragmentation/functionalization can also react with HO2; and acylperoxy radical of the intermediate ofcarbonyl oxidation can also react with NO or RO2.
differences in the SOA mass loading and the chemical struc-ture of the precursor. The signal intensities of these oligomerswere lower than those of low-MW products by a factor of ap-proximately 102. No oligomers were detected in the columninjection analysis. By using H-ToF-AMS, the signals in the200–600 region were detected in both experiments with ben-zene and 1,3,5-TMB (Fig. S4). These results strongly suggestthat oligomers are present in SOA particles. Since carbonylsand alcohols are present in SOA particles formed from aro-matic hydrocarbons, oligomers are formed from the particlephase reactions such as carbonyl hydration, acetal condensa-tion, carbonyl polymerization, and aldol condensation (Jangand Kamens, 2001; Jang et al., 2002; Kalberer et al., 2004).
4.3 Reaction schemes for SOA formation and aging
To interpret the present results, a reaction mechanism rele-vant to SOA formation and aging is now discussed (Fig. 3).The major fraction of total SOA mass is believed to comprisering-opened products from aromatic hydrocarbons (Jang andKamens, 2001; Fisseha et al., 2004). As shown in Fig. 3a,
dialdehydes are produced as ring-opened products fromthe reaction of benzene with OH radicals (Calvert et al.,2002). These products, as well as second-generation prod-ucts formed from subsequent oxidation, are absorbed ontoexisting particles. Some second-generation products haveboth carbonyl and hydroxy groups. In the particle phase,oligomers are formed from carbonyl hydration, acetal con-densation, carbonyl polymerization, and aldol condensation(Jang and Kamens, 2001; Jang et al., 2002; Kalberer et al.,2004). The photooxidation process of 1,3,5-TMB is basicallythe same as for benzene (Fig. 3b). Ketoaldehydes are likelyto be produced as gas-phase oxidation products.
Nakao et al. (2011) and Borras and Tortajada-Genaro (2012) have recently reported that a substantialamount of SOA is also formed through the oxidation ofphenolic products from aromatic hydrocarbons. As oxida-tion products from phenols, ring-opened molecules such asglyoxal + butenedial and hydroxylated compounds of theseare formed (Bloss et al., 2005). Ring-opened products fromphenolic compounds will also contribute to SOA formation.
Atmos. Chem. Phys., 12, 4667–4682, 2012 www.atmos-chem-phys.net/12/4667/2012/

K. Sato et al.: AMS and LC/MS analyses of high-NOx aromatic SOA 4675
The present results indicate that SOA aging proceedsthrough the oxidation of the internal double bond of ring-opened products and carboxylic acid formation resultingfrom the oxidation of the carbonyl group (Fig. 3c). Lozaet al. (2012) suggested that SOA aging in laboratory cham-ber experiments proceeds through the gas-phase oxidationof SVOCs, although oxidation on particle surfaces cannotbe excluded. The gas-phase oxidation of the internal doublebond results in fragmentation or functionalization. As a resultof fragmentation, a carbonyl pair is formed. These carbonylsthen undergo the following oxidation. The functionalizationof the internal carbons of ring-opened products produces hy-droxycarbonyls or diols; these reactions affect the increase inthe O/C ratio (van Krevelen diagram), but will not affect theincrease in them/z44 signal (triangle plot).
Gas-phase carboxylic acid formation from carbonyls isinitiated by reactions with OH radicals. Generally, the re-actions of ketones with OH radicals are slower than the re-actions of aldehydes. For example, the lifetime of acetalde-hyde is 20 h at an OH concentration of 106 molecules cm−3,whereas that of acetone is 53 days (DeMore et al., 1997).Ketoaldehydes are produced by the reaction of 1,3,5-TMB.Since the oxidation of ketone groups is slow, formation of di-carboxylic acids from ketoaldehyde products is much slowerthan from dialdehyde products of benzene. Therefore, AMSmeasurements of SOA from benzene give strongerm/z 44signals than those of SOA from 1,3,5-TMB (Sato et al.,2010). The ketone groups of the products from 1,3,5-TMBresist oxidation. AMS measurements of SOA from 1,3,5-TMB give strongerm/z43 signals than those of SOA frombenzene.
If carbonyl products of benzene and 1,3,5-trimethylbenzene oxidation must undergo subsequentgas-phase oxidation to carboxylic acids to decrease theirvapor pressures and allow them to condense and form SOA,then this oxidation to form carboxylic acids should beclassified as a SOA formation mechanism. Oxocarboxylicacids react with alcoholic products in the particle phase toform hemiacetal dimers. The reverse reactions of hemiacetalformation can occur to form oxocarboxylic acids and alco-holic products again. Particulate oxocarboxylic acids canproceed to the vaporization followed by the oxidation in thegas phase to form dicarboxylic acids, which can be absorbedon particles again, or particulate oxocarboxylic acids can beoxidized in the particle phase to form dicarboxylic acids.This oxidation to form carboxylic acids results in an increasein the O/C ratio of organics and should be classified as aSOA aging mechanism.
The SOA yield from benzene was higher than that fromhighly methylated 1,3,5-TMB. Sato et al. (2011) reportedthat the SOA yield from a highly methylated conjugateddiene is much lower than that from non-methylated 1,3-butadiene. This previous result mirrors the present results foraromatic hydrocarbons. Oligoesters contribute to SOA for-mation during the reactions of conjugated dienes (Surratt et
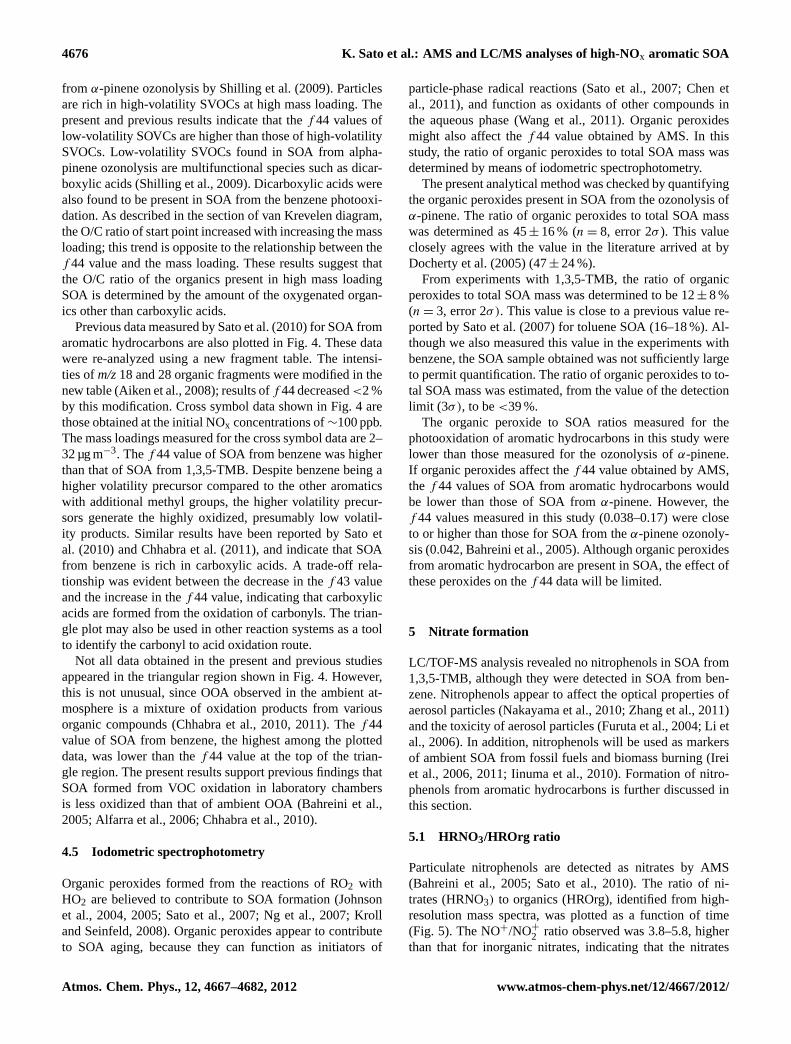
Fig. 4. Triangle plot of SOA formed from the photooxidation ofaromatic hydrocarbons in the presence of NOx; data of benzene and1,3,5-TMB shown with a run number are present results; other dataof six aromatic hydrocarbons are taken from Sato et al. (2010); crosssymbol data (+) are obtained at the initial NOx concentrations of∼100 ppb.
al., 2006). Ester-type oligomers will also be produced by thereactions of carboxylic acids with alcohols in the particlephase during the oxidation of aromatic hydrocarbons.
4.4 Triangle plot
The ion signals ofm/z43 and 44 originate chiefly from car-bonyls and carboxylic acids, respectively (Ng et al., 2010,2011). Strong ion signals appeared atm/z43 and 44 in themass spectra measured by H-TOF-AMS for SOA. The ionsignal of m/z 44 was higher thanm/z 43 when SOA frombenzene was measured, whereas the ion signal ofm/z43 washigher thanm/z 44 when SOA from 1,3,5-TMB was mea-sured (Fig. S5). These results confirm the findings previouslyreported by Sato et al. (2010).
The ratio ofm/z44 to total organic aerosol (f 44) was plot-ted as a function off 43 to study the triangle plot proposedby Ng et al. (2010) (Fig. 4). According to Ng et al. (2010),the data for ambient organic aerosol appear in the triangle re-gion shown in the Figure. Thef 44 value increases as agingproceeds, and peaks at 0.3. The data obtained for SOA in thisstudy also migrated over time, toward the top of the triangle.
In the experiments with benzene, the value off 44 was0.16–0.17 (Run 1) and 0.07–0.13 (Runs 2 and 3). In theexperiments with 1,3,5-TMB, the value off 44 was 0.06–0.09 (Run 4) and 0.03–0.06 (Runs 5 and 6). Thef 44 valuewas constant or increased with decreasing the SOA massloading. This tendency parallels a previous result for SOA
www.atmos-chem-phys.net/12/4667/2012/ Atmos. Chem. Phys., 12, 4667–4682, 2012
4676 K. Sato et al.: AMS and LC/MS analyses of high-NOx aromatic SOA
from α-pinene ozonolysis by Shilling et al. (2009). Particlesare rich in high-volatility SVOCs at high mass loading. Thepresent and previous results indicate that thef 44 values oflow-volatility SOVCs are higher than those of high-volatilitySVOCs. Low-volatility SVOCs found in SOA from alpha-pinene ozonolysis are multifunctional species such as dicar-boxylic acids (Shilling et al., 2009). Dicarboxylic acids werealso found to be present in SOA from the benzene photooxi-dation. As described in the section of van Krevelen diagram,the O/C ratio of start point increased with increasing the massloading; this trend is opposite to the relationship between thef 44 value and the mass loading. These results suggest thatthe O/C ratio of the organics present in high mass loadingSOA is determined by the amount of the oxygenated organ-ics other than carboxylic acids.
Previous data measured by Sato et al. (2010) for SOA fromaromatic hydrocarbons are also plotted in Fig. 4. These datawere re-analyzed using a new fragment table. The intensi-ties ofm/z18 and 28 organic fragments were modified in thenew table (Aiken et al., 2008); results off 44 decreased<2 %by this modification. Cross symbol data shown in Fig. 4 arethose obtained at the initial NOx concentrations of∼100 ppb.The mass loadings measured for the cross symbol data are 2–32 µg m−3. Thef 44 value of SOA from benzene was higherthan that of SOA from 1,3,5-TMB. Despite benzene being ahigher volatility precursor compared to the other aromaticswith additional methyl groups, the higher volatility precur-sors generate the highly oxidized, presumably low volatil-ity products. Similar results have been reported by Sato etal. (2010) and Chhabra et al. (2011), and indicate that SOAfrom benzene is rich in carboxylic acids. A trade-off rela-tionship was evident between the decrease in thef 43 valueand the increase in thef 44 value, indicating that carboxylicacids are formed from the oxidation of carbonyls. The trian-gle plot may also be used in other reaction systems as a toolto identify the carbonyl to acid oxidation route.
Not all data obtained in the present and previous studiesappeared in the triangular region shown in Fig. 4. However,this is not unusual, since OOA observed in the ambient at-mosphere is a mixture of oxidation products from variousorganic compounds (Chhabra et al., 2010, 2011). Thef 44value of SOA from benzene, the highest among the plotteddata, was lower than thef 44 value at the top of the trian-gle region. The present results support previous findings thatSOA formed from VOC oxidation in laboratory chambersis less oxidized than that of ambient OOA (Bahreini et al.,2005; Alfarra et al., 2006; Chhabra et al., 2010).
4.5 Iodometric spectrophotometry
Organic peroxides formed from the reactions of RO2 withHO2 are believed to contribute to SOA formation (Johnsonet al., 2004, 2005; Sato et al., 2007; Ng et al., 2007; Krolland Seinfeld, 2008). Organic peroxides appear to contributeto SOA aging, because they can function as initiators of
particle-phase radical reactions (Sato et al., 2007; Chen etal., 2011), and function as oxidants of other compounds inthe aqueous phase (Wang et al., 2011). Organic peroxidesmight also affect thef 44 value obtained by AMS. In thisstudy, the ratio of organic peroxides to total SOA mass wasdetermined by means of iodometric spectrophotometry.
The present analytical method was checked by quantifyingthe organic peroxides present in SOA from the ozonolysis ofα-pinene. The ratio of organic peroxides to total SOA masswas determined as 45± 16 % (n = 8, error 2σ ). This valueclosely agrees with the value in the literature arrived at byDocherty et al. (2005) (47± 24 %).
From experiments with 1,3,5-TMB, the ratio of organicperoxides to total SOA mass was determined to be 12± 8 %(n = 3, error 2σ). This value is close to a previous value re-ported by Sato et al. (2007) for toluene SOA (16–18 %). Al-though we also measured this value in the experiments withbenzene, the SOA sample obtained was not sufficiently largeto permit quantification. The ratio of organic peroxides to to-tal SOA mass was estimated, from the value of the detectionlimit (3σ), to be<39 %.
The organic peroxide to SOA ratios measured for thephotooxidation of aromatic hydrocarbons in this study werelower than those measured for the ozonolysis ofα-pinene.If organic peroxides affect thef 44 value obtained by AMS,thef 44 values of SOA from aromatic hydrocarbons wouldbe lower than those of SOA fromα-pinene. However, thef 44 values measured in this study (0.038–0.17) were closeto or higher than those for SOA from theα-pinene ozonoly-sis (0.042, Bahreini et al., 2005). Although organic peroxidesfrom aromatic hydrocarbon are present in SOA, the effect ofthese peroxides on thef 44 data will be limited.
5 Nitrate formation
LC/TOF-MS analysis revealed no nitrophenols in SOA from1,3,5-TMB, although they were detected in SOA from ben-zene. Nitrophenols appear to affect the optical properties ofaerosol particles (Nakayama et al., 2010; Zhang et al., 2011)and the toxicity of aerosol particles (Furuta et al., 2004; Li etal., 2006). In addition, nitrophenols will be used as markersof ambient SOA from fossil fuels and biomass burning (Ireiet al., 2006, 2011; Iinuma et al., 2010). Formation of nitro-phenols from aromatic hydrocarbons is further discussed inthis section.
5.1 HRNO3/HROrg ratio
Particulate nitrophenols are detected as nitrates by AMS(Bahreini et al., 2005; Sato et al., 2010). The ratio of ni-trates (HRNO3) to organics (HROrg), identified from high-resolution mass spectra, was plotted as a function of time(Fig. 5). The NO+/NO+
2 ratio observed was 3.8–5.8, higherthan that for inorganic nitrates, indicating that the nitrates
Atmos. Chem. Phys., 12, 4667–4682, 2012 www.atmos-chem-phys.net/12/4667/2012/

K. Sato et al.: AMS and LC/MS analyses of high-NOx aromatic SOA 4677
Fig. 5. Time profiles of HRNO3/HROrg ratio measured during thephotooxidation of benzene and 1,3,5-trimethylbenzene in the pres-ence of NOx. The background of HRNO3 is very small as shownin Fig. S1a, so the start value of the HRNO3/HROrg ratio is notinfluenced by any background signal.
observed are rich in organic nitrates or nitro organics.Since the absolute concentration of HRNO3 determined fororganonitrates is incorrect (Farmer et al., 2010), only relativecomparisons are made here. The HRNO3/HROrg ratio de-creased with time. This shows that nitrophenols and organicnitrates decrease as a result of chemical reactions. The de-cay rate of the HRNO3/HROrg ratio was also influenced bythe faster increase in HROrg than HRNO3 in the 0–60 minregion. The average decay rate, determined from data in theregion of>60 min, was 0.059 h−1. If we ignore reactions inthe aqueous phase, a major sink of nitrophenols and organicnitrates is photolysis in the gas phase (Calvert et al., 2002;Finlayson-Pitts and Pitts, 2000). If gaseous nitrophenols de-crease by the photolysis, particulate nitrophenols are vapor-ized to maintain the equilibrium of gas/particle partitioning.The photolysis of gaseous nitrophenols result in a decreasein the concentration of particulate nitrophenols.
The HRNO3/HROrg ratio measured in the experimentwith benzene (Run 2) was higher than that measured in theother experiment (Run 1) in the region of>60 min; this isbecause the initial NOx concentration in Run 2 (889 ppb)is higher than that for Run 1 (102 ppb). Since nitrophe-nols and organic nitrates are semivolatile compounds, theHRNO3/HROrg ratio would also depend on the SOA massloading. However, the HRNO3/HROrg ratio measured inRun 3 ([SOA] = 198 µg m−3) was close to or slightly be-low that measured in Run 2 ([SOA] = 49 µg m−3). Underthe present experimental conditions, the HRNO3/HROrg ra-tio was closely dependent on the initial NOx concentra-tion. Very recently, we measured the HRNO3/HROrg ratioof SOA from the toluene photooxidation as a function of ini-tial NOx concentration and found that the HRNO3/HROrg
ratio increased with increasing the initial NOx level in therange 100–600 ppb (Nakayama et al., 2012). This supportsthe present conclusion.
The HRNO3/HROrg ratio also decreased in experimentswith 1,3,5-TMB. The HRNO3/HROrg ratio measured in theregion>60 min (0.03–0.06) was almost independent of theinitial NOx concentration or the SOA mass loading. The NOxconcentration and the SOA mass loading in the experimentwith benzene (Run 3) were close to those in the experimentwith 1,3,5-TMB (Run 5). In a comparison between these ex-periments, the HRNO3/HROrg ratio measured in the experi-ment with benzene was higher than that measured in the ex-periment with 1,3,5-TMB.
5.2 Reaction schemes for nitrophenol formation
To be able to interpret the relationship between the struc-ture of aromatic hydrocarbons and the yield of nitrophenols,the reaction mechanisms relevant to formation of nitrophe-nols from benzene and 1,3,5-TMB were investigated (Fig. 6).These mechanisms are based on an already known reactionmechanism (Forstner et al., 1997). Phenol is produced bythe reaction of benzene with OH radicals (Fig. 6a). Phe-noxy radicals formed from the following oxidation processof phenol have two other resonance structures: 2-oxo-3,5-cyclohexadienyl and 4-oxo-2,5-cyclohexadienyl. The addi-tion of NO2 to 2-oxo-3,5-cyclohexadienyl radicals followedby isomerization results in the formation of 2-nitrophenol.Similarly, 4-nitrophenol is formed from the reaction of 4-oxo-2,5-cyclohexadienyl with NO2.
As shown in Fig. 6b, 2,4,6-trimethylphenol is formed fromthe reaction of 1,3,5-TMB with OH radicals (Calvert et al.,2002; Kleindienst et al., 1999). The resonance structures ofphenoxy-type radicals from this phenolic product are 1,3,5-trimethyl-2-oxo-3,5-cyclohexadienyl and 1,3,5-trimethyl-4-oxo-2,5-cyclohexadienyl. In both these structures, the carbonatom at the radical’s center is bonded with a methyl group.Even if NO2 is added to these radicals, these adducts arelikely to dissociate to reactants again since subsequent iso-merization involving the methyl group migration cannot takeplace.
Noda et al. (2009) recently reported a phenol forma-tion pathway from alkylbenzene via dealkylation. Their re-sults indicate that 3,5-dimethylphenol is also produced bythe reaction of 1,3,5-TMB with OH radicals. The oxida-tion of this phenolic compound would appear to lead to theformation of 3,5-dimethyl-2-nitrophenol and 2,5-dimethyl-4-nitrophenol; however, no nitrophenols were detected inSOA from 1,3,5-TMB. The present results suggest that theyield of 3,5-dimethylphenol is lower than that of 2,4,6-trimethylphenol, or that NO2 addition to the phenoxy from3,5-dimethylphenol is blocked by steric hindrance.
www.atmos-chem-phys.net/12/4667/2012/ Atmos. Chem. Phys., 12, 4667–4682, 2012

4678 K. Sato et al.: AMS and LC/MS analyses of high-NOx aromatic SOA
Fig. 6. Reaction schemes of(a) nitrophenol formation from the photooxidation of benzene and(b) corresponding routes from the photooxi-dation of 1,3,5-trimethylbenzene.
6 Comparison between chamber and ambientconditions
The present results show that laboratory SOA is less oxi-dized than ambient OOA, and that the rate of SOA agingin laboratory chambers is limited by the oxidation of ketonegroups. Ketocarboxylic acids are also detected in ambientorganic aerosol. The ratio of ketocarboxylic acids to dicar-boxylic acids is known to decrease as an aerosol ages (Hoet al., 2005, 2007; He et al., 2010). These field results showthat the oxidation of ketocarboxylic acids is competitive withthe deposition of particles (the lifetime due to deposition isabout 14 days). The rate of the oxidation of ketocarboxylicacids in the ambient atmosphere cannot be fully explained byoxidation in the gas phase.
Recently, Loza et al. (2012) carried out long-photoirradiation (>12 h) laboratory chamber experiments toinvestigate the photooxidation ofm-xylene. They reportedthe rate of increase of the O/C ratio to be 0.0012 h−1 duringSOA aging. The time needed for the O/C ratio to increasefrom the initial SOA value (0.6) to the ambient maximum(1.2) is estimated to be 20 days. In their experiments, thechamber was continuously irradiated, suggesting that it takesa much longer time for the O/C ratio to increase to 1.2 underambient-like intermittent irradiation conditions.
As another oxidation process of ketocarboxylic acids, ox-idation in the particle phase is also possible. However, drySOA particles are suggested to be in the amorphous solidstate (Virtanen et al., 2010) or in the semi-solid phase (Shi-raiwa et al., 2011). If these claims are correct, particle-phasereactions can only occur near the surface. The major fractionof total SOA mass comprises the molecules present in the in-
ternal region of particles, which remain unoxidized. On theother hand, under highly humid conditions, cloud processingsuch as acid-catalyzed reactions in the aqueous phase (Bogeet al., 2006) and OH radical reactions in the aqueous phase(Lim et al., 2005; Carlton et al., 2006, 2007; Myriokefali-takis et al., 2011) can occur. Due to OH radical reactionsin the aqueous phase, ketocarboxylic acids such as pyruvicacid can be oxidized to form dicarboxylic acids such as ox-alic acid. SOA produced in laboratory chamber experimentsis less oxidized than for ambient OOA, not only because theexperimental duration is insufficient or the SOA mass load-ing in the chamber is higher than that of the atmosphere: thelaboratory chamber experiments under dry conditions cannotsimulate the reactions of organics in the aqueous phase thattake place in cloud processing.
7 Conclusions
In this study, SOA formed from the photooxidation of ben-zene and 1,3,5-TMB in the presence of NOx was measuredby SMPS, H-ToF-AMS, and LC/TOF-MS. The SOA yieldfrom benzene was higher than that from 1,3,5-TMB. A tri-angle plot of SOA from aromatic hydrocarbons was studiedusing thef 43 andf 44 data obtained by H-ToF-AMS mea-surements made in the present and previous studies. Thef 44value of SOA from benzene was higher than that of SOAfrom 1,3,5-TMB. The triangle plot also revealed a trade-offrelationship between decreasedf 44 value and increasedf 43value. All f 44 values obtained for SOA from aromatic hy-drocarbons were lower than those of highly oxidized ambientOOA. The van Krevelen diagram plotted using AMS data for
Atmos. Chem. Phys., 12, 4667–4682, 2012 www.atmos-chem-phys.net/12/4667/2012/

K. Sato et al.: AMS and LC/MS analyses of high-NOx aromatic SOA 4679
SOA from benzene and 1,3,5-TMB showed the organic com-pounds present in SOA to be rich in carboxylic acids or hy-droxycarbonyls. Ring-opened carboxylic acids and nitrophe-nols were identified as products present in SOA by LC/TOF-MS analysis of SOA from benzene. The ring-opened car-boxylic acids from benzene had an aldehyde or carboxylgroup at each end. On the other hand, the ring-opened car-boxylic acids from 1,3,5-TMB had a ketone and carboxylgroup at each end. The present results of the triangle plot, vanKrevelen diagram, and composition analysis at the molecu-lar level together indicate that SOA aging proceeds chieflythrough carboxylic acid formation via the oxidation of car-bonyls, and that the rate of SOA aging in laboratory chamberexperiments is limited by the rate of oxidation of ketones.SOA produced in laboratory chamber experiments is less ox-idized than with ambient OOA, not only because the experi-mental duration is insufficient or the SOA mass loading in thechamber is higher than that of the atmosphere, but becausethe laboratory chamber experiments under dry conditions areunable to simulate ketocarboxylic acid photochemical oxi-dation in the aqueous phase. In the future, understanding ofaqueous-phase SOA chemistry is necessary.
The HRNO3/HROrg ratio (representing the relative massfraction of organonitrates or nitro organics) measured by H-ToF-AMS for SOA from benzene was confirmed to be higherthan that measured for SOA from 1,3,5-TMB. The suppres-sion of nitrophenol formation from 1,3,5-TMB is explainedby the already-known reaction mechanism in relation to ni-trophenol formation.
Supplementary material related to this article isavailable online at:http://www.atmos-chem-phys.net/12/4667/2012/acp-12-4667-2012-supplement.pdf.
Acknowledgements.This work was supported by a Grant-in-Aidfor Scientific Research from the Japan Society for the Promotionof Science (No. 21510023, FY2009–2011). K. S. thanks K. Tanabeand Y. Takazawa at the National Institute for EnvironmentalStudies for their assistance with LC/TOF-MS analysis. K. S. thanksT. Nakayama of Nagoya University for useful discussion on thereaction mechanism of nitrophenol formation.
Edited by: J. H. Seinfeld
References
Aiken, A. C., DeCarlo, P. F., Kroll, J. H., Worsnop, D. R., Huff-man, J. A., Docherty, K. S., Ulbrich, I. M., Mohr, C., Kimmel,J. R., Sueper, D., Sun, Y., Zhang, Q., Trimborn, A., Northway,M., Ziemann, P. J., Ganagaratna, M. R., Onasch, T. B., Alfarra,M. R., Prevot, A. S. H., Dommen, J., Duplissy, J., Metzger,A., Baltensperger, U., and Jimenez, J. L.: O/C and OM/OC ra-tios of primary, secondary, and ambient organic aerosols with
high-resolution time-of-flight aerosol mass spectrometry, Envi-ron. Sci. Tehcnol., 42, 4478–4485, 2008.
Akimoto, H., Hoshino, M., Inoue, G., Sakamaki, F., Washida, N.,and Okuda, M.: Design and characterization of the evacuable andbakable photochemical smog chamber, Environ. Sci. Technol.,13, 471–475, 1979.
Alfarra, M. R., Paulsen, D., Gysel, M., Garforth, A. A., Dommen,J., Prevot, A. S. H., Worsnop, D. R., Baltensperger, U., and Coe,H.: A mass spectrometric study of secondary organic aerosolsformed from the photooxidation of anthropogenic and biogenicprecursors in a reaction chamber, Atmos. Chem. Phys., 6, 5279–5293,doi:10.5194/acp-6-5279-2006, 2006.
Aschmann, S. M., Long, W. D., and Atkinson, R.: Temperature-dependent rate constants for the gas-phase reactions of OH radi-cals with 1,3,5-trimethylbenzene, triethyl phosphate, and a seriesof alkylphosphonates, J. Phys. Chem. A, 110, 7393–7400, 2006.
Atkinson, R.: Kinetics and mechanisms of the gas-phase reactionsof the hydroxyl radical with organic compounds under atmo-spheric conditions, Chem. Rev., 86, 69–201, 1986.
Bahreini, R., Keywood, M. D., Ng, N. L., Varutbangkul, V., Gao,S., Flagan, R. C., Seinfeld, J. H., Worsnop, D. R., and Jimenez,J. L.: Measurements of secondary organic aerosol from oxida-tion of cycloalkenes, terpenes, and m-xylene using an AerodyneAerosol Mass Spectrometer, Environ. Sci. Technol., 39, 5674–5688, 2005.
Baltensperger, U., Dommen, J., Alfarra, M. R., Duplissy, J.,Gaeggeler, K., Metzger, A., Facchini, M. C., Decesari, S., Fi-nessi, E., Reinnig, C., Schott, M., Warnke, J., Hoffmann, T.,Klatzer, B., Puxbaum, H., Geiser, M., Savi, M., Lang, D.,Kalberer, M., and Geiser, T.: Combined determination of thechemical composition and of health effects of secondary organicaerosols: the POLYSOA project, J. Aerosol Med. Pulm. D., 21,145–154, 2008.
Bloss, C., Wagner, V., Jenkin, M. E., Volkamer, R., Bloss, W. J.,Lee, J. D., Heard, D. E., Wirtz, K., Martin-Reviejo, M., Rea,G., Wenger, J. C., and Pilling, M. J.: Development of a detailedchemical mechanism (MCMv3.1) for the atmospheric oxidationof aromatic hydrocarbons, Atmos. Chem. Phys., 5, 641–664,doi:10.5194/acp-5-641-2005, 2005.
Boge, O, Miao, Y., Plewka, A., and Herrmann, H.: Formation ofsecondary organic particle phase compounds from isoprene gas-phase oxidation products: an aerosol chamber and field study,Atmos. Environ., 40, 2501–2509, 2006.
Borras, E. and Tortajada-Genaro, L. A.: Secondary organic aerosolformation from the photo-oxidation of benzene, Atmos. Environ,47, 154–163, 2012.
Calvert, J. G., Atkinson, R., Becker, K. H., Kamens, R. M., Sein-feld, J. H., Wallington, T. J., and Yarwood, G.: The Mechanismsof Atmospheric Oxidation of Aromatic Hydrocarbons, OxfordUniversity Press, New York, USA, 2002.
Carlton, A. G., Turpin, B. J., Lim, H.-J., Altieri, K. E., andSeitzinger, S.: Link between isoprene and secondary organicaerosol (SOA): Pyruvic acid oxidation yields low volatilityorganic acids in clouds, Geophys. Res. Lett., 33, L06822,doi:10.1029/2005GL025374, 2006.
Carlton, A. G., Turpin, B. J., Altieri, K. E., Seitzinger, S., Reff, A.,Lim, H.-J., and Ervens, B.: Atmospheric oxalic acid and SOAproduction from glyoxal: Results of aqueous photooxidation ex-periments, Atmos. Environ., 41, 7588–7602, 2007.
www.atmos-chem-phys.net/12/4667/2012/ Atmos. Chem. Phys., 12, 4667–4682, 2012

4680 K. Sato et al.: AMS and LC/MS analyses of high-NOx aromatic SOA
Chen, Q., Liu, Y., Donahue, N. M., Shilling, J. E., and Martin, S.T.: Particle-phase chemistry of secondary organic material: mod-eled compared to measured O:C and H:C elemental ratios pro-vide constraints, Environ. Sci. Technol., 45, 4763–4770, 2011.
Chhabra, P. S., Flagan, R. C., and Seinfeld, J. H.: Elemental analysisof chamber organic aerosol using an aerodyne high-resolutionaerosol mass spectrometer, Atmos. Chem. Phys., 10, 4111–4131,doi:10.5194/acp-10-4111-2010, 2010.
Chhabra, P. S., Ng, N. L., Canagaratna, M. R., Corrigan, A. L., Rus-sell, L. M., Worsnop, D. R., Flagan, R. C., and Seinfeld, J. H.: El-emental composition and oxidation of chamber organic aerosol,Atmos. Chem. Phys., 11, 8827–8845,doi:10.5194/acp-11-8827-2011, 2011.
DeMore, W. B., Sander, S. P., Golden, D. M., Hampson, R. F.,Kurylo, M. J., Howard, C. J., Ravishankara, A. R., Kolb, C. E.,and Molina, M. J.: Chemical knetics and photochemical data foruse in stratospheric modeling, Evaluation number 12, JPL Publi-cation, 97-4, 1–266, 1997.
Docherty, K. S., Wu, W., Lim, Y. B., and Ziemann, P. J.: Contri-butions of organic peroxides to secondary aerosol formed fromreactions of monoterpenes with O3, Environ. Sci. Technol., 29,4049–4059, 2005.
Drewnick, F., Hings, S. S., DeCarlo, P. F., Jayne, J. T., Gonin, M.,Fuhrer, K., Weimer, S., Jiminez, J. L., Demerjian, K. L., Bor-rmann, S., and Worsnop, D. R.: A new time-of-flight aersol massspectrometer (ToF-AMS) – instrument description and first fielddeployment, Aerosol Sci. Tech., 39, 637–658, 2005.
Farmer, D. K., Matsunaga, A., Docherty, K. S., Surratt, J. D., Se-infeld, J. H., Ziemann, P. J., and Jimenez, J. L.: Response of anaerosol mass spectrometer to organonitrates and organosulfatesand implications for atmospheric chemistry, P. Natl. Acad. Sci.USA, 107, 6670–6675, 2010.
Finlayson-Pitts, B. J. and Pitts, J. N.: Chemistry of the Upper andLower Atmosphere – Theory, Experiments, and Applications,Academic Press, San Diego, California, USA, 2000.
Fisseha, R. Dommen, J., Sax, M., Paulsen, D., Kalberer, M., Mau-rer, R., Hofler, F., Weingartner, E., and Baltensperger, U.: Identi-fication of organic acids in secondary organic aerosol and the cor-responding gas phase from chamber experiments, Anal. Chem.,76, 6535–6540, 2004.
Forstner, H. J. L, Flagan, R. C., and Seinfeld, J. H.: Secondary or-ganic aerosol from the photooxidation of aromatic hydrocarbons:Molecular composition, Environ. Sci. Technol., 31, 1345–1358,1997.
Furuta, C., Suzuki, A. K., Taneda, S., Kamata, K., Hayashi, H.,Mori, Y., Li, C., Watanabe, G., and Taya, K.: Estrogenicactivi-ties of nitrophenols in diesel exhaust particles, Biol. Reprod., 70,1527–1533, 2004.
Hallquist, M., Wenger, J. C., Baltensperger, U., Rudich, Y., Simp-son, D., Claeys, M., Dommen, J., Donahue, N. M., George,C., Goldstein, A. H., Hamilton, J. F., Herrmann, H., Hoff-mann, T., Iinuma, Y., Jang, M., Jenkin, M. E., Jimenez, J. L.,Kiendler-Scharr, A., Maenhaut, W., McFiggans, G., Mentel, Th.F., Monod, A., Prevot, A. S. H., Seinfeld, J. H., Surratt, J. D.,Szmigielski, R., and Wildt, J.: The formation, properties and im-pact of secondary organic aerosol: current and emerging issues,Atmos. Chem. Phys., 9, 5155–5236,doi:10.5194/acp-9-5155-2009, 2009.
Hamilton, J. F., Webb, P. J., Lewis, A. C., and Reviejo, M.M.: Quantifying small molecules in secondary organic aerosolformed during the photo-oxidation of toluene with hydroxyl rad-icals, Atmos. Environ., 39, 7263–7275, 2005.
He, N. and Kawamura, K.: Distributions and diurnal changes of lowmolecular weight organic acids and alpha-dicarbonyls in subur-ban aerosols collected at Mangshan, North China, Geochem. J.,44, E17–E22, 2010.
Henze, D. K., Seinfeld, J. H., Ng, N. L., Kroll, J. H., Fu, T.-M.,Jacob, D. J., and Heald, C. L.: Global modeling of secondaryorganic aerosol formation from aromatic hydrocarbons: high-vs. low-yield pathways, Atmos. Chem. Phys., 8, 2405–2420,doi:10.5194/acp-8-2405-2008, 2008.
Ho, K. F., Lee, S. C., Cao, J. J., Kawamura, K., Watanabe, T.,Cheng, Y., and Chow, J. C.: Dicarboxylic acids, ketocarboxylicacids and dicarbonyls in the urban roadside area of Hong Kong,Atmos. Environ., 40, 3030–3040, 2005.
Ho, K. F., Cao, J. J., Lee, S. C., Kawamura, K., Zhang, R. J., Chow,J. C., and Watson, J. G.: Dicarboxylic acids, ketocarboxylicacids, and dicarbonyls in the urban atmosphere of China, J. Geo-phys. Res., 112, D22S27,doi:10.1029/2006JD008011, 2007.
Hu, D., Tolocka, M., Li, Q., and Kamens, R. M.: A kinetic mech-anism for predicting secondary organic aerosol formation fromtoluene oxidation in the presence of NOx and natural sunlight,Atmos. Environ., 41, 6478–6496, 2007.
Huang, M., Zhang, W., Hao, L., Wang, Z., Zhao, W., Gu, X., Guo,X., Liu, X., Long, B., and Fang, L.: Laser desorption/ionizationmass spectrometric study of secondary organic aerosol formedfrom the photooxidation of aromatics, J. Atmos. Chem., 58, 237–252, 2007.
Hurley, M. D., Sokolov, O., Wallington, T. J., Takekawa, H., Kara-sawa, M., Klotz, B., Barnes, I., and Becker, K. H.: Organicaerosol formation during the atmospheric degradation of toluene,Environ. Sci. Technol., 35, 1358–1366, 2001.
Iinuma, Y., Boge, O., Grafe, R., and Herrmann, H.: Methyl-nitrocatechols: atmospheric tracer compounds for biomass burn-ing secondary organic aerosols, Environ. Sci. Technol., 44,8453–8459, 2010.
Irei, S., Huang, L., Collin, F., Zhang, W., Hastie, D., and Rudolph,J.: Flow reactor studies of the stable carbon isotope compositionof secondary particulate organic matter generated by OH-radical-induced reactions of toluene, Atmos. Environ., 40, 5858–5867,2006.
Irei, S., Rudolph, J., Huang, L., Auld, J., and Hastie, D.: Stable car-bon isotope ratio of secondary particulate organic matter formedby photooxidation of toluene in indoor smog chamber, Atmos.Environ., 45, 856–862, 2011.
Izumi, K. and Fukuyama, T.: Photochemical aerosol formation fromaromatic hydrocarbons in the presence of NOx, Atmos. Environ.,24A, 1433–1441, 1990.
Jang, M. and Kamens, R. M.: Characterization of secondary aerosolfrom the photooxidation of toluene in the presence of NOx and1-propene, Environ. Sci. Tehcnol., 35, 3626–3639, 2001.
Jang, M., Czoschke, N. M., Lee, S., and Kamens, R. M.: Heteroge-neous atmospheric aerosol production by acid-catalyzed particle-phase reactions, Science, 298, 814–817, 2002.
Jimenez, J. L., Ganagaratna, M. R., Donahue, N. M., Prevot, A. S.H., Zhang, Q., Kroll, J. H., DeCarlo, P. F., Allan, J. D., Coe,H., Ng, N. L., Aiken, A. C., Docherty, K. S., Ulbrich, I. M.,
Atmos. Chem. Phys., 12, 4667–4682, 2012 www.atmos-chem-phys.net/12/4667/2012/

K. Sato et al.: AMS and LC/MS analyses of high-NOx aromatic SOA 4681
Grieshop, A. P., Robinson, A. L., Duplissy, J., Smith, J. D., Wil-son, K. R., Lanz, V. A., Hueglin, C., Sun, Y. L., Tian, J., Laak-sonen, A., Raatikainen, T., Rautiainen, J., Vaattovaara, P., Ehn,M., Kulmala, M., Tomlinson, J. M., Collins, D. R., Cubison, M.J., Dunlea, E. J., Huffman, J. A., Onasch, T. B., Alfarra, M. R.,Williams, P. I., Bower, K., Kondo, Y., Schneider, J., Drewnick,F., Borrmann, S., Weimer, S., Demerjian, K., Salcedo, D., Cot-trell, L., Griffin, R., Takami, A., Miyoshi, T., Hatakeyama, S.,Shimono, A., Sun, J. Y., Zhang, Y. M., Dzepina, K., Kimmenl,R., Sueper, D., Jayne, J. T., Herndon, S. C., Trimborn, A. M.,Williams, L. R., Wood, E. C., Middlebrook, A. M., Kolb, C.E., Baltensperger, U., and Worsnop, D. R.: Evolution of organicaerosols in the atmosphere, Science, 326, 1525–1529, 2009.
Johnson, D., Jenkin, M. E., Wirtz, K., and Martin-Reviejo, M.: Sim-ulating the formation of secondary organic aerosol from the pho-tooxidation of toluene, Environ. Chem., 1, 150–165, 2004.
Johnson, D., Jenkin, M. E., Wirtz, K., and Martin-Reviejo, M.: Sim-ulating the formation of secondary organic aerosol from the pho-tooxidation of aromatic hydrocarbons, Environ. Chem., 2, 35–48,2005.
Kalberer, M., Paulsen, D., Sax, M., Steinbacher, M., Dommen, J.,Prevot, A. S. H., Fisseha, R., Weingartner, E., Frankevich, V.,Zenobi, R., and Baltensperger, U.: Identification of polymersas major components of atmospheric organic aerosols, Science,303, 1659–1662, 2004.
Kelly, J. L., Michelangeli, D. V., Makar, P. A., Hastie, D. R.,Mozurkewich, M., and Auld, J.: Aerosol speciation and massprediction from toluene oxidation under high NOx conditions,Atmos. Environ., 44, 361–369, 2010.
Kleindienst, T. E., Smith, D. F., Li, W., Edney, E. O., Driscoll, D. J.,Speer, R. E., Weathers, W. S.: Secondary organic aerosol forma-tion from the oxidation of aromatic hydrocarbons in the presenceof dry submicron ammonium sulfate aerosol, Atmos. Environ.,33, 3669–3681, 1999.
Kroll, J. H. and Seinfeld, J. H.: Chemistry of secondary organicaerosol: Formation and evolution of low-volatility organics in theatmosphere, Atmos. Environ., 42, 3593–3624, 2008.
Kroll, J. H., Donahue, N. M., Jimenez, J. L., Kessler, S. H., Cana-garatna, M. R., Wilson, K. R., Altieri, K. E., Mazzoleni, L. R.,Wozniak, A. S., Bluhm, H., Mysak, E. R., Smith, J. D., Kolb, C.E., and Worsnop, D. R.: Carbon oxidation state as a metric fordescribing the chemistry of atmospheric organic aerosol, NatureChemistry, 3, 133–139, 2011.
Lambe, A. T., Onasch, T. B., Massoli, P., Croasdale, D. R., Wright,J. P., Ahern, A. T., Williams, L. R., Worsnop, D. R., Brune, W. H.,and Davidovits, P.: Laboratory studies of the chemical composi-tion and cloud condensation nuclei (CCN) activity of secondaryorganic aerosol (SOA) and oxidized primary organic aerosol(OPOA), Atmos. Chem. Phys., 11, 8913–8928,doi:10.5194/acp-11-8913-2011, 2011.
Lane, T. E., Donahue, N. M., and Pandis, S. N.: Simulating sec-ondary organic aerosol formation using the volatility basis-setapproach in a chemical transport model, Atmos. Environ., 42,7439–7451, 2008.
Li, C.-M., Taneda, S., Suzuki, A., Furuta, C., Watanabe, G., andTaya, K.: Anti-androgenic activity of 3-methyl-4-nitrophenol indiesel exhaust particles, Eur. J. Pharmacol., 543, 194–199, 2006.
Lim, H. J., Carlton, A. G., and Turpin, B. J.: Isoprene forms sec-ondary organic aerosol through cloud processing: Model simula-
tions, Environ. Sci. Technol., 39, 4441–4446, 2005.Loza, C. L., Chhabra, P. S., Yee, L. D., Craven, J. S., Flagan, R.
C., and Seinfeld, J. H.: Chemical aging ofm-xylene secondaryorganic aerosol: laboratory chamber study, Atmos. Chem. Phys.,12, 151–167,doi:10.5194/acp-12-151-2012, 2012.
Lun, X., Takami, A., Miyoshi, T., and Hatakeyama, S.: Character-istic of organic aerosol in a remote area of Okinawa Island, J.Environ. Sci., 21, 1371–1377, 2009.
Martin-Reviejo, M. and Wirtz, K.: Is benzene a precursor for sec-ondary organic aerosol?, Environ. Sci. Technol., 39, 1045–1054,2005.
Myriokefalitakis, S., Tsigaridis, K., Mihalopoulos, N., Sciare,J., Nenes, A., Kawamura, K., Segers, A., and Kanakidou,M.: In-cloud oxalate formation in the global troposphere: a3-D modeling study, Atmos. Chem. Phys., 11, 5761–5782,doi:10.5194/acp-11-5761-2011, 2011.
Nakao, S., Clark, C., Tang, P., Sato, K., and Cocker III, D.: Sec-ondary organic aerosol formation from phenolic compounds inthe absence of NOx, Atmos. Chem. Phys., 11, 10649–10660,doi:10.5194/acp-11-10649-2011, 2011.
Nakayama, T., Matsumi, Y., Sato, K., Imamura, T., Yamazaki, A.,and Uchiyama, A.: Laboratory studies on optical properties ofsecondary organic aerosols generated during the photooxidationof toluene and the ozonolysis ofα-pinene, J. Geophys. Res., 115,D24204,doi:10.1029/2010JD014387, 2010.
Nakayama, T., Sato, K., Matsumi, Y., Imamura, T., Yamazaki, A.,and Uchiyama, A.: Wavelength and NOx dependent complex re-fractive index of SOAs generated from the photooxidation oftoluene, Atmos. Chem. Phys. Discuss., accepted, 2012.
Ng, N. L., Kroll, J. H., Chan, A. W. H., Chhabra, P. S., Flagan,R. C., and Seinfeld, J. H.: Secondary organic aerosol formationfrom m-xylene, toluene, and benzene, Atmos. Chem. Phys., 7,3909–3922,doi:10.5194/acp-7-3909-2007, 2007.
Ng, N. L., Canagaratna, M. R., Zhang, Q., Jimenez, J. L., Tian,J., Ulbrich, I. M., Kroll, J. H., Docherty, K. S., Chhabra, P.S., Bahreini, R., Murphy, S. M., Seinfeld, J. H., Hildebrandt,L., Donahue, N. M., DeCarlo, P. F., Lanz, V. A., Prevot, A. S.H., Dinar, E., Rudich, Y., and Worsnop, D. R.: Organic aerosolcomponents observed in Northern Hemispheric datasets fromAerosol Mass Spectrometry, Atmos. Chem. Phys., 10, 4625–4641,doi:10.5194/acp-10-4625-2010, 2010.
Ng, N. L., Canagaratna, M. R., Jimenez, J. L., Chhabra, P. S., Se-infeld, J. H., and Worsnop, D. R.: Changes in organic aerosolcomposition with aging inferred from aerosol mass spectra, At-mos. Chem. Phys., 11, 6465–6474,doi:10.5194/acp-11-6465-2011, 2011
Noda, J., Volukamer, R., and Molina, M. J.: Dealkylation of alkyl-benzenes: A significant pathway in the toluene, o-, m-, p-xylene+ OH reaction, J. Phys. Chem. A, 113, 9658–9666, 2009.
Odum, J. R., Jungkamp, T. P. W., Griffin, R. J., Forstner, H. J. L.,Flagan, R. C., and Seinfeld, J. H.: Aromatics, reformulated gaso-line, and atmospheric organic aerosol formation, Enviorn. Sci.Technol., 31, 1890–1897, 1997.
Qi, L., Nakao, S., Malloy, Q., Warren, B., and Cocker III, D. R.:Can secondary organic aerosol formed in an atmospheric simu-lation chamber continuously age?, Atmos. Environ., 44, 2990–2995, 2010.
Sato, K.: Detection of nitrooxypolyols in secondary organic aerosolformed from the photooxidation of conjugated dienes under
www.atmos-chem-phys.net/12/4667/2012/ Atmos. Chem. Phys., 12, 4667–4682, 2012

4682 K. Sato et al.: AMS and LC/MS analyses of high-NOx aromatic SOA
high-NOx conditions, Atmos. Environ., 42, 6851–6861, 2008.Sato, K., Klotz, B., Hatakeyama, S., Imamura, T., Washizu, Y., Mat-
sumi, Y., and Washida, N.: Secondary organic aerosol formationduring the photo-oxidation of toluene: Dependence on initial hy-drocarbon concentration, Bull. Chem. Soc. Jpn., 77, 667–671,2004.
Sato, K., Hatakeyama, S., and Imamura, T.: Secondary organicaerosol formation during the photooxidation of toluene: NOxdependence of chemical composition, J. Phys. Chem. A, 111,9796–9808, 2007.
Sato, K., Takami, A., Isozaki, T., Hikida, T., Shimono, A., and Ima-mura, T.: Mass spectrometric study of secondary organic aerosolformed from the photo-oxidation of aromatic hydrocarbons, At-mos. Environ., 44, 1080–1087, 2010.
Sato, K., Nakao, S., Clark, C. H., Qi, L., and Cocker III, D. R.:Secondary organic aerosol formation from the photooxidationof isoprene, 1,3-butadiene, and 2,3-dimethyl-1,3-butadiene un-der high NOx conditions, Atmos. Chem. Phys., 11, 7301–7317,doi:10.5194/acp-11-7301-2011, 2011.
Shilling, J. E., Chen, Q., King, S. M., Rosenoern, T., Kroll, J.H., Worsnop, D. R., DeCarlo, P. F., Aiken, A. C., Sueper, D.,Jimenez, J. L., and Martin, S. T.: Loading-dependent elementalcomposition ofα-pinene SOA particles, Atmos. Chem. Phys., 9,771–782,doi:10.5194/acp-9-771-2009, 2009.
Shiraiwa, M., Ammann, M., Koop, T., and Poschl, U.: Gas up-take and chemical aging of semisolid organic aerosol particles,P. Natl. Acad. Sci. USA, 108, 11003–11008, 2011.
Song, C., Na, K., and Cocker III, D. R.: Impact of the hydrocarbonsto NOx ratio on secondary organic aerosol formation, Environ.Sci. Technol., 39, 3143–3149, 2005.
Stroud, C. A., Makar, P. A., Michelangeli, D. V., Mozurkewich, M.,Hastie, D. R., Barbu, A., and Humble, J.: Simulating organicaerosol formation during the photooxidation of toluene/NOxmixtures: comparing the equilibrium and kinetic assumption, En-viron. Sci. Technol., 38, 1471–1479, 2004.
Surratt, J. D., Murphy, S. M., Kroll, J. H., Ng, N. L., Hildebrandt, L.,Sorooshian, A., Szmigielski, R., Vermeylen, R., Mauenhaut, W.,Claeys, M., Flagan, R. C., and Seinfeld, J. H.: Chemical compo-sition of secondary organic aerosol formation from the photoox-idation of isoprene, J. Phys. Chem. A, 110, 9665–9690, 2006.
Surratt, J. D., Chan, A. W. H., Eddingsaas, N. C., Chan, M. N.,Loza, C. L., Kwan, A. J., Hersey, S. P., Flagan, R. C., Wennberg,P. O., and Seinfeld, J. H.: Reactive intermediates revealed in sec-ondary organic aerosol formation from isoprene, P. Natl. Acad.Sci. USA, 1007, 6640–6645, 2010.
Takami, A., Miyoshi, T., Shimono, A., Kaneyasu, N., Kato, S., Ka-jii, Y., and Hatakeyama, S.: Transport of antropogenic aerosolsfrom Asia and subsequent chemical transformation, J. Geophys.Res., 112, D22S31,doi:10.1029/2006JD008120, 2007.
Takegawa, N., Miyakawa, T., Watanabe, M., Kondo, Y., Miyazaki,Y., Han, S., Zhao, Y., van Pinxteren, D., Bruggemann, E., Gnauk,T., Herrmann, H., Xiao, R., Deng, Z., Hu, M., Zhu, T., and Zhang,Y.: Performance of an Aerodyne Aerosol Mass Spectrometer(AMS) during intensive campaigns in China in the summer of2006, Aerosol Sci. Tech., 43, 189–204, 2009.
Takekawa, H., Minoura, H., and Yamazaki, S.: Temperature depen-dence of secondary organic aerosol formation by photo-oxidationof hydrocarbons, Atmos. Environ., 37, 3413–3424, 2003.
Virtanen, A., Joutsensaari, J., Koop, T., Kannosto, J., Yli-Pirila, P.,Leskinen, J., Makela, J. M., Holopainen, J. K., Poschl, U., Kul-mala, M., Worsnop, D. R., and Laaksonen, A.: An amorphoussolid state of biogenic secondary organic aerosol particles, Na-ture, 467, 824–825, 2010.
Wang, Y., Kim, H., and Paulson, S. E.: Hydrogen peroxide gen-eration fromα- and β-pinene and toluene secondary organicaerosols, Atmos. Environ., 45, 3149–3156, 2011.
Wang, Y., Arellanes, C., and Paulson, S. E.: Hydrogen peroxide as-sociated with ambient fine-mode, diesel, and biodiesel aerosolparticles in Southern California, Aerosol Sci. Tech., 46, 394–402,2012.
Zhang, Q., Jimenez, J. L., Canagaratna, M. R., Allan, J. D., Coe,H., Ulbrich, I., Alfarrra, M. R., Takami, A., Middlebrook, A.M., Sun, Y. L., Dzepina, K., Dunlea, E., Docherty, K., DeCarlo,P. F., Salcedo, D., Onasch, T., Jayne, J. T., Miyoshi, T., Shi-mono, A., Hatakeyama, S., Takegawa, N., Kondo, Y., Schnei-der, J., Drewnick, F., Borrmann, S., Weimer, S., Demerjian,K., Williams, P., Bower, K., Bahreini, R., Cottrell, L., Grif-fin, R. J., Rautiainen, J., Sun, J. Y., Zhang, Y. M., and D.R. Worsnop: Ubiquity and dominance of oxygenated speciesin organic aerosols in anthroponenically-influenced NorthernHemisphere midlatitudes, Geophys. Res. Lett., 34, L13801,doi:10.1029/2007GL029979, 2007.
Zhang, X., Lin, Y.-H., Surratt, J. D., Zotter, P., Prevot, A. S. H.,and Weber, R. J.: Light-absorbing soluble organic aerosol in LosAngeles and Atlanta: A contrast in secondary organic aerosol,Geophys. Res. Lett., 38, L21810,doi:10.1029/2011GL049385,2011.
Atmos. Chem. Phys., 12, 4667–4682, 2012 www.atmos-chem-phys.net/12/4667/2012/