amps 2018 7th annual mineral planning survey report · strategy/local plan, with 22 out of 25 (88%)...
TRANSCRIPT

Mineral Products Association
AMPS 2018 7th Annual Mineral Planning
Survey Report

2
EXECUTIVE SUMMARY
THE KEY FINDINGS OF THE REPORT ARE:
Over this period, crushed rock sales still represented more than twice those for sand and gravel across Great Britain. Demand for land-won sand and gravel continues to outstrip the amount of new reserves being permitted, with the 10-year average replenishment rate decreasing to 53%. During 2017, newly consented sand and gravel reserves represented just 24% of annual sales. In the case of crushed rock, the 10-year average replenishment rate has reduced significantly to 69%, with new reserves permitted in 2017 representing just 3% of 2017 sales.
As with previous AMPS reports, the latest data signals that the long-term reserve base upon which the aggregates sector is so dependant remains under pressure. The number of applications for new mineral resources submitted by the industry continues to be low, reflecting the cumulative costs of obtaining access to land and the necessary permissions
and permits, together with the underlying political and economic uncertainty.
The 10-year average time taken to determine a mineral planning application, excluding pre-application discussion, is 16 months for both sand and for crushed rock. Once the pre-application discussions are included, this period extends to around 29 months. However, the overall time taken from application preparation through to implementing a consent can be significantly longer. Typically, it can take between 5 to 15 years to convert a new site from exploration into an active, operational concern. The absence of a strategic approach to forecasting need and providing for future demand results in inconsistencies and tensions between mineral planning authorities and the Aggregate Working Parties, which in turn creates uncertainty for industry in committing to long term developments.
The sustainable future supply of essential minerals cannot be assumed, it requires effective planning, management and monitoring. There is a continued and clear desire from both local authorities and from industry for the National and Sub-national Guidelines for aggregates provision to be updated to support the Managed Aggregate Supply System (MASS).
The MPA’s ‘Long term aggregates demand & supply scenarios, 2016-2030’ indicates that a cumulative total of between 3.2 to 3.8 billion tonnes of construction aggregates are likely to be required by 2030 to support economic growth and development across Great Britain. To secure the supply of these materials will require active management, supported by data to monitor performance, to ensure the right resources are made available in the right place and at the right time.
If there is no reversal in the reported trend of diminishing reserves, it is inevitable that increasing tensions in maintaining future supply will emerge.
n Sales – Total sales of land-won sand and gravel decreased by 1.4% in 2017 while sales of crushed rock increased by 0.5%. On balance demand for land-won aggregates was broadly flat during 2017.
n Replenishment of sand and gravel reserves – Only 24% of sales were replenished through new permissions in 2017. The rolling 10-year average for the replenishment of land-won sand and gravel reserves further decreased to 53% (from 62% in 2016), indicating that sales continue to outstrip the amount of new reserves permitted.
n Replenishment of crushed rock reserves – The 10-year average for the replenishment of crushed rock reserves was 69% in 2017, a reduction from 116% in 2016. Only 3.2% of 2017 sales were replaced by newly permitted crushed rock reserves. This significant reduction in replenishment was anticipated with the significant influence of Scottish reserves consented in 2007 dropping out of the 10-year average.
n Number of planning applications – There has been a slight increase in submissions for sand and gravel in 2017 (15 sites) compared to 2016 (13 sites), the majority being for extensions at existing operations. The number of crushed rock applications decreased (4 compared to 5 in 2016). A further 19 applications (23 in 2016) were made for time extensions, S73 applications and similar matters to maintain existing operations.
n Appeals – For the first time in several years MPA members recorded 2 appeals in 2017.
n Number of planning decisions – The number of determinations for mineral applications continues to be relatively low (a total of 10 approvals and 5 refusals, across both sand and gravel and crushed rock sites) compared to the heights of 2008/09 (30+ sites). 2017 saw the highest number of refusals since 2003.
n Time taken to obtain permission – It takes 29.4 and 29.9 months respectively to secure permission for both sand and gravel and crushed rock reserves,
based on a 10-year average. The data for 2017 suggests that sand and gravel determinations took 4 months less than for those determined in 2016. The sand and gravel data also show that the time to issue consents post-committee determination has increased, perhaps a partial reflection of decreasing local planning authority resources and increasing complexity and information requirements.
n Numbers of Core Strategies/Development Plans adopted – The 2004 Planning and Compulsory Purchase Act required that full plan coverage be in place within three years. However, as of August 2018, 90 out of 118 (80%) English Local Planning Authorities had an adopted Core Strategy/Local Plan, with 22 out of 25 (88%) Welsh Local Authorities having an adopted Local Development Plan.
n Plan Allocations – Over the past 10 years to 2017, 44% of all new permissions issued were for sites that had not been allocated in mineral plans. In 2016, the figure was 48%.
The 7th Annual Mineral Planning Survey, AMPS 2018, has been produced in the context of a revised National Planning Policy Framework (NPPF) and a broadly flat demand for aggregates during 2017.

3
INTRODUCTION
AMPS 2018 is the latest in a series of annual reports produced by the Mineral Products Association (MPA), informed by a survey of the planning activities of the membership across Great Britain in 2017. MPA members are responsible for 100% of UK cement production, 90% of GB aggregates production, 95% of asphalt and over 70% of ready-mixed concrete and precast concrete production. It also represents other essential primary materials such as industrial sand, lime, and dimension stone.
The objective of the AMPS survey is to update and report annual statistics that are relevant to the mineral planning processes within Great Britain. These processes support
the delivery of the permitted reserves which ultimately sustain the minerals industry and those activities that rely on it, primarily construction and manufacturing. Attention is drawn to other reports produced by the MPA which evidence the Sustainable Development performance of the industry, the contribution it makes to the UK Economy, and other industry achievements in relation to quarry restoration and biodiversity.
Some of the data relate only to construction aggregates, which represent by far the largest element of mineral extraction activity in Great Britain. The planning application statistics relate to all planning applications submitted by MPA members and include
data for aggregates and other minerals (soft sand, high PSV and industrial materials such as cement, clay, dimension stone and silica sand).
Each figure sets out the scope of the information that is presented and the variations between the topics reflect the historical data that can be drawn upon. This is principally because the AMPS report is continually evolving in response to comments received. Consequently, some data has only been collected relatively recently, whilst other data goes back to the 1990s. The overall objective is to produce a document that is useful to all those involved in planning for minerals, primarily aggregates.
“…the sustainable future supply of essential minerals cannot be assumed, it requires effective
planning, monitoring and management…”

4
The need to ensure a steady and adequate supply of aggregates and industrial minerals has arguably never been stronger, particularly considering the Government’s priorities for housing and infrastructure. The importance of a resilient supply chain of raw materials including minerals over the medium and long term, which was identified in the recently published Industrial Strategy Construction Sector Deal and the industry-produced UK Minerals Strategy, has now been further reinforced by the policies contained in the revised version of the National Planning Policy Framework (NPPF) published in July 2018. While this understandably focuses on Government’s priorities around housing, in doing so it is telling that the NPPF also recognises that the sufficient supply of minerals to provide the infrastructure, buildings, energy and goods that the country needs is essential. The continuing need for mineral planning authorities to plan for a steady and adequate supply of aggregates and industrial minerals reinforces the fact that supply cannot be assumed, but needs to be planned, monitored and managed to ensure that the right minerals are made available in the right place and at the right time to support Government’s priorities around housing and infrastructure. This was reflected in statements made by the Government in response to consultation responses namely;
n The Government acknowledges the support for an effective planning policy for minerals and the need to facilitate security of supplies, and the final Framework recognises that a sufficient supply of minerals is essential.
n The Government recognises that planning for minerals is essential to increasing the supply of housing and other development, and that without updated guidelines, there is a real risk of under-provision and possible sterilisation of mineral resources… the case that has been made for revitalising the MASS… The Government intends to explore these issues after the publication of the Framework.
It is becoming increasingly clear that the MASS system is struggling to perform in the continued absence of updated National and Sub-national Guidelines that provide a clear and strategic statement of future demand and needs for construction aggregates. Without this, there is greater risk of under-provision resulting from local subjectivity and interpretation around what constitutes ‘need’. Furthermore, there have also been cases where draft mineral plans have been withdrawn just prior to Examination after several years of effort for similar reasons. These issues arise because the current
backwards-looking LAA system which attempts to ‘forecast’ future mineral needs based on past, and recessionary, sales figures, is unable to properly consider future mineral demand. Consequently, the absence of a strategic approach results in inconsistencies and tensions between mineral planning authorities and AWPs, which in turn creates uncertainty for industry in committing to long term developments. Supply of minerals cannot be assumed and there is an urgent need to produce revised National and Sub-national Guidelines for aggregates provision, effectively providing a clear national ‘statement of need’ for England and Wales.
The MPA’s ‘Long term aggregates demand & supply scenarios, 2016-2030’ indicates that a cumulative total of between 3.2 to 3.8 billion tonnes of construction aggregates are likely to be required by 2030 to support economic growth and development across Great Britain. To secure the supply of these materials will require active management, supported by data to monitor performance, to ensure the right resources are made available in the right place and at the right time.
Alongside previous AMPS reports, the latest survey confirms the continued under replenishment of reserves in 2017 for both land-won sand and gravel and for crushed rock. The latest data presented in
8000
7000
6000
5000
4000
3000
2000
1000
0
England Sand & Gravel Wales Sand & GravelEngland Crushed Rock
Source: BGS, 2016. Aggregates Minerals Survey 2014
Wales Crushed Rock
1985 1989 1993 1997 2001 2005 2009 2014
Figure 1: Primary aggregate permitted reserves in England & Wales during 1985-2014
Mill
ion
tonn
es
THE REVISED NPPF AND THE FUTURE OF MINERAL PLANNING

5
the Aggregates Monitoring Survey 2014 (AM14), undertaken by the British Geological Survey on behalf of (then) DCLG and Welsh Government, suggest that this forms part of a longer-term decline, with a 44% reduction in all aggregate reserves in England and
Wales over the period 2001 to 2014 and a 20% reduction since 2005 (see Figure 1). Total permitted reserves are now less than 4 billion tonnes for the first time in over 30 years of reported data. The trend in under-replenishment reported through the AMPS
process suggests that these figures will continue to fall, and unless reversed has the potential to result in serious implications for the ability of the mineral products sector to maintain essential supplies.
Aggregates have long been recognised as essential materials for our way of life and shortages in the 1970’s resulted in the 1976 Royal Commission ‘Aggregates – The Way Ahead’ (The Verney Report). The report’s findings created the foundation of a mineral planning system that has endured effectively for the last 40 years. The
underlying principle of an ‘adequate and steady supply’ of aggregates for construction and the economy has underpinned the mineral planning system ever since through the development of MASS which historically has been a top down ‘predict and provide’ system, apportioning future supply requirements identified by National and Sub-
national Guidelines. However, the continued under replenishment of reserves reported in AMPS reports indicates that this system continues to be subject to pressure from a range of factors, some being internal to mineral operators and others external.
PHASE1
PHASE2
PHASE3
PHASE4
Putting forward the site for inclusion in a Local Mineral Plan (3-5 years);
Implementation of a planning permission (pre-commencement conditions) and securing necessary environmental permits from regulators (EA, NE, HE, etc.) to allow extraction to commence ( 1 - 2 years).
Identification, proving and securing a potential aggregate site (3-5 years);
Application within the development management system to the point of planning permission being issued (the subject of AMPS) (3 to 5 years);
Figure 2: Site Development Process
n There is a reducing profile of mineral planning in central government (capacity & expertise), which coincides with a 44% reduction in all aggregate reserves in the period 2001 to 2014.
n MASS recognises the need for aggregates provision to be planned, monitored and managed. This historically has been a top down ‘predict and provide’ system, apportioning supply through National and Sub-national Guidelines. Aggregates Working Parties (AWPs) have historically ensured, through the application of the Guidelines, that inter-regional flows maintain a key role in ensuring a steady
and adequate supply around the country. However, with the Guidelines out of date the original top down approach has been eroded, requiring a more ‘bottom up’ approach that employs ‘Local Aggregate Assessments (LAAs)’ informed by historic sales.
n Evidence and data are required to inform the preparation of sound plans which allocate sites for future extraction. Monitoring data have historically been derived from the AMRI surveys, recently discontinued by ONS, and the AWPs who are now wholly dependent upon information presented in LAAs. The
LAAs are backward looking as mineral planning authorities and AWPs are not equipped to adequately or robustly quantify future demand and coordinate supply between areas, and so rely almost exclusively on historic sales as a guide to future demand.
n AWPs provide a critical role in coordinating the delivery of MASS but have no long-term certainty which reduces their effectiveness. Funding is uncertain, as is the 4 yearly ‘Aggregate Minerals Survey for England & Wales’ undertaken by the British Geological Survey.
EXTERNAL FACTORS

6
WHAT IS NEEDED
POTENTIAL OUTCOME
The basic approach of ‘plan, monitor and manage’ remains valid and is best overseen and coordinated by the Ministry of Housing, Communities and Local Government, supported by a National Aggregates Coordinating Group, given the characteristics of both the minerals that are produced and the construction sector that is being supplied. Reliance on a backward looking, local approach, particularly given the regional imbalances between mineral supply and demand and local political priorities, risks
under-provision and the cost-effective delivery of housing and infrastructure. To ensure a steady and adequate supply of minerals, there remains an urgent requirement to revitalise MASS by providing:
n Leadership in central Government to provide statements of need, and coordination of monitoring;
n Increased mineral planning capacity with MHCLG;
n Long-term funding providing certainty to the AWPs;
n Long-term commitment to data collection (AMRI/AM);
n Long-term forecasts of future needs, that consider future demand – both baseline growth and to support priority policy areas (housing & infrastructure).
Constraints on future supply have already emerged locally, with construction aggregates having to travel further to meet demand, and these constraints are likely to increase especially with current ambitions for housing and infrastructure. There is a clear desire from local authorities and from industry for the National and Sub-national Guidelines that provide the strategic context and statement of need for aggregates to be urgently updated.
The absence of a strategic approach results in inconsistencies and, in turn, tensions between mineral planning authorities and AWPs, hence the importance of centrally derived demand estimates defined through National Guidelines. The declining influence
of Central Government in mineral planning also creates uncertainty for industry in committing to long term developments. It is notable that recent Government proposals resulting from the Housing White Paper have acknowledged the need for a sound and consistent evidence base alongside mechanisms to quantify future housing needs to support the timely and effective delivery of local planning processes for housing. The same requirements equally apply to the minerals that are needed to realise the ambitions around housing delivery.
These developing tensions are evidenced by the delay and even withdrawal of some local mineral plans after several years of
development. In one case, this occurred just prior to the draft plan going through Examination due to political concerns around the potential for overprovision, compounded by a reliance on backward looking data presented in the LAA. These delays are costly to both the local tax payer and to industry, and create further doubt and uncertainty around the effectiveness of the Plan led system. With up to date National and Sub-national Guidelines there would be clear and consistent starting point from which to deliver the steady and adequate supply of aggregates that are required to support long term economic growth and development, as recognised by the National Planning Policy Framework.
6
Anecdotally, it is suggested by MPA members that:
n In general, identifying and securing access to workable sand and gravel resources is becoming more difficult.
n The absence of full Mineral Local Plan (MLP) coverage, particularly allocation of sites, means increased business risk and a lack of confidence to invest, particularly given the underlying economic uncertainties that exist.
n The absence of adopted MLPs delays dates in option contracts for applications to be submitted by operators.
n Regulatory complexity means that lead-in times for and cost of preparing applications are growing.
n On land tenure, there is a continuing shift away from freehold towards leasehold. Consequently, getting landlord consent to a scheme can often be more difficult than getting the planning permission itself.
n On land use aspirations, land owners are increasingly looking for higher value development rather than minerals. Consequently, there is a reluctance to put land forward to MLPs.
n Economically, landowner revenue from mineral working is not deemed attractive.
n Changing corporate behaviours, influenced by the underlying economic climate, have resulted in a shift towards shorter term planning horizons.
INTERNAL FACTORS

77

8
n Figure 3 has been derived from sales data provided by MPA members, which typically represents 90% of the total GB primary aggregates market. It shows that primary aggregates sales continue to increase towards 2007, pre-recession, levels with crushed rock aggregates recovering more rapidly than sand and gravel. However, during 2017, land-won sand and gravel sales (40.5 Mt) were 1.4% lower than the previous year, while crushed rock sales (99.6 Mt) were 0.5% higher.
n During 2017, only 24% of the land-won sand and gravel tonnage sold was replaced by new permitted reserves (see Figure 4).
n Long-term replenishment rates for land-won sand and gravel continue to be of concern, with the 10-year average remaining depressed at only 53% (see figure 5).
SECTION ONE – AGGREGATE SALES AND REPLENISHMENT
1.1 SALES
Year2006 2007 2008 2009 2010 2011 2012 2013 2014 2015 20172016
200
180
160
140
120
100
80
60
40
20
0
Mill
ion
tonn
es
Figure 3. Total MPA land-won aggregates sales volumes in GB
Land-won sand and gravel Crushed rock
2008 2009 2010 2011 2012 2013 2014 201720162015
60
50
40
30
20
10
0
Mill
ion
tonn
es
Figure 4. Tonnages of new land-won sand and gravel permissions issued in GB
Year of issue

9
2008 2009 2010 2011 2012 2013 2014 201720162015
120%
100%
80%
60%
40%
20%
0%
Figure 5. Land-won sand and gravel replenishment rates in GB
Year of issue
Sand and gravel replenishment rate 2008-17 average 53%
n For crushed rock, new reserves equivalent to 3.2 million tonnes were permitted in 2017, equivalent to just 3.2% of total annual sales (see Figure 6).
n Survey results show that for the fifth year running, annual sales have continued to exceed the replenishment rates for crushed rock reserves. As a consequence, the 10-year average replenishment rate for crushed rock stands at 69% (see figure 7), down from 116% in 2016. This reflects the significant contribution of Glensanda permitted in 2007 falling out of the 10-year average.
2008 2009 2010 2011 2012 2013 2014 201720162015
300
250
200
150
100
50
0
Figure 6. Tonnages of new crushed rock permissions issued in GB
Year of issue
Mill
ion
tonn
es

10
2008 2009 2010 2011 2012 2013 2014 2015 20172016
350%
300%
250%
200%
150%
100%
50%
0%
Figure 7. Crushed rock replenishment rates in GB
Year of issue
Crushed rock replenishment rate 2008-17 average 69%
Torr Works issued, 115Mt
Bardon Hill issued, 132Mt
SECTION ONE – CONTINUED
10

1111

12
n A total of six applications for new sand and gravel sites were submitted in 2017, and nine applications were made for extensions to existing quarries unchanged from 2016. By contrast, 2014 saw only one application for a new site and five extensions being submitted, representing an all-time low in industry submissions.
n There were four crushed rock extension applications submitted in 2017 compared to seven in 2016. There were no applications for new sites.
SECTION TWO – PLANNING ACTIVITY
2.1 NUMBER OF APPLICATIONS
25
20
15
10
5
0
Figure 8. Number of land-won sand and gravel applications submitted in GB by type
New Extension
2008 2009 2010 2011 2012 2013 2014 2015 20172016
Year of submission
12
10
8
6
4
2
0
Figure 9. Number of crushed-rock applications in GB
2008 2009 2010 2011 2012 2013 2014 2015 20172016
Year of submission

13
n Two appeal decisions were identified by MPA members in 2017. It would still appear to be the case that where a refusal recommendation seems inevitable, the most likely outcome would be the withdrawal of the application.
2.2 NUMBER OF APPEALS
n Figure 10 shows the number of Review of Old Mineral Permissions (ROMP) submissions and Section 73 (Section 42 in Scotland) applications that have been made each year. Five ROMP submissions were made during 2017 (four in 2016) and 14 Section 73/42 (26 in 2016). Of the Section 73/42 applications seven (17 in 2016) were for extension of permission term. These figures probably reflect the continuing impact of the recession, where sites have been operating at reduced levels of output and /or mothballing.
Figure 10. Number of ROMP and Section 73/42 (incl. time extensions) applications submitted in GB by type
ROMP Section 73/42 (incl. time extensions)
60
50
40
30
20
10
02010 2011 2012 2013 2014 2015 20172016
Year of submission
13

14
12
10
8
6
4
2
0
Figure 12. Number of Crushed Rock applications in GB
Approved Withdrawn
Year of determination
2008
1
9
2009
8
2010
3
2011
11
2012
8
2013
6
2014
5
1
2015
6
1
2017
1
2016
3
1
30
25
20
15
10
5
0
Figure 11. Number of Land-won sand and gravel applications in GB
Approved Refused Withdrawn
Year of determination
2008
1
23
2010
15
2011
3
14
2013
10
2015
1
15
2014
1
19
2009
1
20
3
2017
9
5
2016
7
12
2012
10
3
SECTION THREE – PLANNING AUTHORITY PROCESSES
n Approvals for sand and gravel increased to nine during 2017 compared to seven during 2016. However, there were five refusals in 2017, following on from two in 2016 which represented the first refusals since 2012. This is the highest number of refusals since 2003 (five). This will need to be monitored closely to see if this is a trend. For crushed rock there was a single approval (three in 2016).
n Figures 11 and 12 indicate that the number of sand and gravel applications being determined continue to remain below pre-2009 levels. With five applications refused in 2017, the average approval rate for sand gravel applications over the period 1999 to 2017 stands at 90%, while for crushed rock it is 96%. However, these figures should not mask the fact that of those sand and gravel applications determined in 2017, 36% were refused, compared to 20% in 2016. This will continue be monitored to see if this represents an emerging trend.
n During 2017 there were no applications for sand and gravel or crushed rock were withdrawn.
3.1 NUMBER OF DETERMINATIONS

15
n A regional analysis of approval rates since 1999 is shown in Figure 13.
50
45
40
35
30
25
20
15
10
5
0
Figure 14. Average time to obtain a sand and gravel permission in GB
Pre-application duration Determination duration Time to issue
7
12
Year of issue
7
15
2008 2009 2010 2011 2012 2013 2014 2015 2017
1
5
20
1
4
16 12
21
20
6
8
8
4
2016
5
12
6
9
23
2
2
14
9
6
23
13
Mon
ths
n Figures 14 and 15 show the time taken to complete each stage of the overall planning process required to secure a mineral planning permission. It is encouraging that the time required to get sand and gravel applications to determination once submitted has reduced further to eight months in 2017 (compared to 12 months in 2016). However, of continuing concern is the extended period it is taking to issue planning consents post determination, with sand and gravel consents taking eight months (five in 2016) and crushed rock consents taking 16 months. Anecdotal evidence continues to suggest that a contributory factor to these extended periods can be local authority planning and legal staff resources and experience.
n The 10-year average time for a permission to be issued is 29.4 months for sand and gravel and 29.9 months for crushed rock. It is important to note though, that the permission phase represents just one part of a wider site development process that can take 10 to 15 years to complete (see figure 1).
3.2 TIME TAKEN TO OBTAIN PERMISSION
NE NW YH EM WM EE LN SE SW WA SC GB
Figure 13. Approval rates by region during 1999-2017 for applications to extract minerals (all mineral-bearing applications)
100%
90%
80%
70%
60%
50%
40%
30%
20%
10%
0%

16
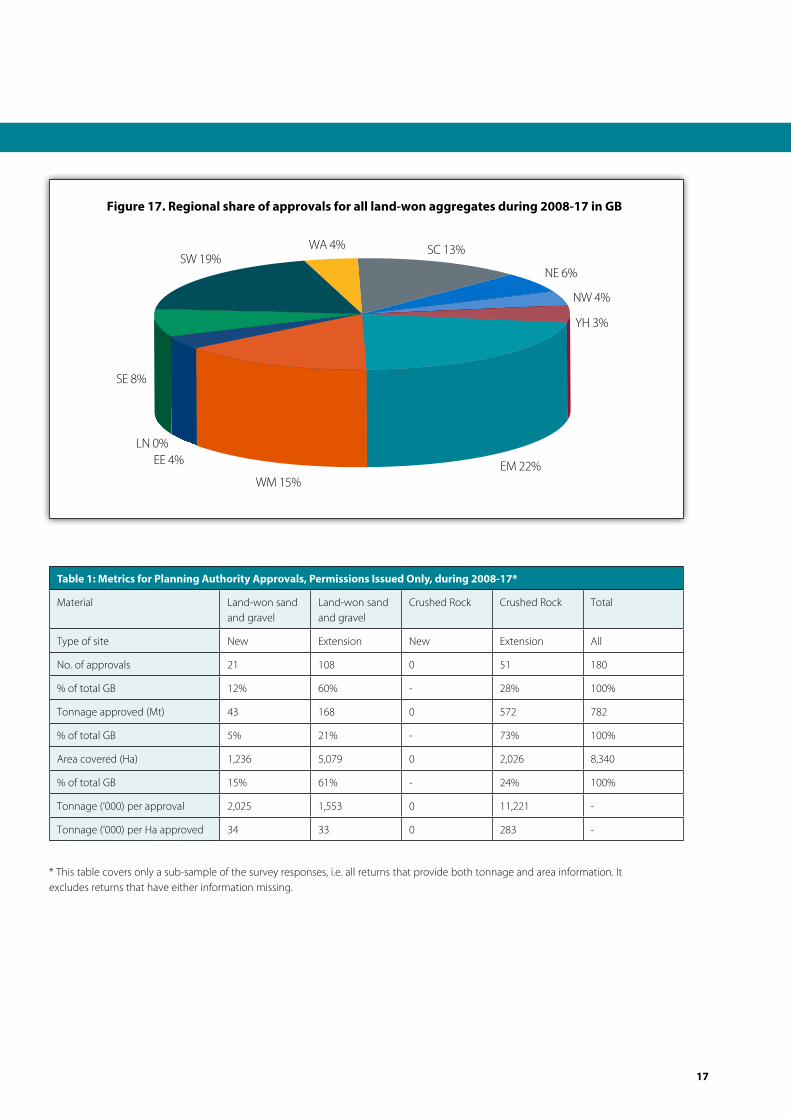
n Figure 16 and 17 show that with Glensanda reserves falling out of the 10-year average, there is a shift in the regional reserves towards the Midlands and the South West away from Scotland.
3.3 SHARES OF NATIONAL PROVISION
Figure 16. Regional tonnage (million tonnes) approved for all land-won aggregates during 2008-17 in GB
SC 102mtWA 31mtSW 156mt
SE 66mt
EE 35mt
LN 0mt
WM 126mt EM 180mt
NE 47mt
NW 30mt
YH 42mt
50
45
40
35
30
25
20
15
10
5
0
Figure 15. Average time to obtain a crushed rock permission in GB
Pre-application duration Determination duration Time to issue
Year of issue
1
20
2008 2009 2010 2011 2012 2013 2014 2015
24
10
14
8
18
12
2
28
12
16
12
64
2017
10
10
2
16
16
3
2016
1
9
12
14
15
0
Mon
ths
12
SECTION THREE - CONTINUED
17
Table 1: Metrics for Planning Authority Approvals, Permissions Issued Only, during 2008-17*
Material Land-won sand and gravel
Land-won sand and gravel
Crushed Rock Crushed Rock Total
Type of site New Extension New Extension All
No. of approvals 21 108 0 51 180
% of total GB 12% 60% - 28% 100%
Tonnage approved (Mt) 43 168 0 572 782
% of total GB 5% 21% - 73% 100%
Area covered (Ha) 1,236 5,079 0 2,026 8,340
% of total GB 15% 61% - 24% 100%
Tonnage (‘000) per approval 2,025 1,553 0 11,221 -
Tonnage (‘000) per Ha approved 34 33 0 283 -
* This table covers only a sub-sample of the survey responses, i.e. all returns that provide both tonnage and area information. It excludes returns that have either information missing.
Figure 17. Regional share of approvals for all land-won aggregates during 2008-17 in GB
SC 13%WA 4%SW 19%
SE 8%
EE 4%LN 0%
NW 4%
EM 22%WM 15%
NE 6%
YH 3%

18
No 44%Not stated13%
Yes 43%
Figure 18. Local plan status of approvals for all aggregate applications in GB, 2008-17
SECTION FOUR – DEVELOPMENT PLANS
n The most recent data (mid-August 2018) shows that 90 out of 118 (80%) local planning authorities monitored in England had adopted their Core Strategies/Local Plan, with a further six having had or undergoing an Examination in Public. In Wales, 22 out of 25 (88%) Local Development Plans have been adopted. The 2004 Planning and Compulsory Purchase Act required that full plan coverage be in place within three years, and it is clear this has not been achieved.
n Since 2012, the 46 Core Strategy/Local Plans adopted in England have taken an average of 80 months to progress from the first consultation to adoption.
4.1 NUMBER OF CORE STRATEGIES ADOPTED EACH YEAR SINCE 2007
n Figure 18 shows that for the period 2008 to 2017, 44% of the permissions granted for extraction of minerals were not identified/allocated in an adopted Mineral Plan.
4.2 ALLOCATED V UNALLOCATED SITES

19
Approved 84%
Not stated or Not applicable 16%
Figure 19. Local plan status of approvals for all land-won aggregates in GB during 2008-17
For further information, please contact Mark North, Director of Planning at [email protected] or Aurelie Delannoy, Director Economic Affairs at [email protected] or telephone 0207 963 8000.
n For permissions issued over the period 2008 to 2017, 84% were issued following an officer’s recommendation for approval. It seems likely that a high proportion of the remaining balance may also have had officer support.
4.3 PLANNING OFFICER RECOMMENDATIONS
19

20
The Mineral Products Association is the trade association for the aggregates, asphalt, cement, concrete, dimension stone, lime, mortar and silica sand industries.
For further MPA information visit www.mineralproducts.org
© Mineral Products Association 2018
Mineral Products Association 38-44 Gillingham Street London SW1V 1HU
Tel 020 7963 8000 Fax 020 7963 8001 [email protected] www.mineralproducts.org