amphisbaenia
TRANSCRIPT
7/27/2019 amphisbaenia
http://slidepdf.com/reader/full/amphisbaenia 1/18
The Ear and Hearing in Amphisbaenia (Reptilia)
CARL GANS2
AND
ERNEST GLEN WEVER
D e p a r t m e n t of B i o l o g y , S t a t e U n i v e r s i t y
of
N e w Yorh a t Buf fa lo , a n d
A u d i t o r y R e s e a r c h Laboratories P r i n c e t o n U n i u e r s i t y ,
P r i n c et o n , N e w J e r s ey
ABSTRACT The burrowing squamates of the order Amphisbaenia lack
external ears. The middle ear involves an extremely large stapes with the head
of
its shaft (columellar portion) projecting
jus t
posterior
to
and as far laterally
as the quadrate.
In
most species a cartilaginous extracolumella articulates with
the distal tip
of
the shaft and then stretches along the lower jaw and is attached
to the skin in the region of the second infralabial.
Records
of
the electrical
potentials of the cochlea in some nine species show sensitivity curves whose
maxima are approximately -20dB for a standard output
of
0.1
pv.
The zone
of greatest sensitivity lies in the low frequencies, usually between
300
and
700 Hz. The sensitivity of amphisbaenians differs from that
of
snakes in being
fairly good above levels of 700 Hz, where the latter drops off sharply. Inter-
ruption of the extracolumella causes a 20 to 30 dB loss in sensitivity. Sound
waves applied asymmetrically produce different electrical responses in the two
ears, suggesting an explanation for behavioral observations on the utilization
of
the system.
The form and function of the ear in
amphisbaenians are hardly known. Since
an external opening is lacking, the group
has been characterized as ear-less, and
only the structure of the middle ear has
had brief mention in treatments of the
anatomy of the skull. Some speculations
have been offered about auditory function
in general discussions of the life and hab-
its of these reptiles (Gans, '60, '68). That
hearing may play a n important role in
such activities as the finding of food and
mates and predator avoidance seems a
reasonable assumption for these curious
animals whose life is mainly, sometimes
exclusively, subterranean and whose vi-
sion is apparently reduced to simple light
perception (Gans and Bonin, '63).
The present report presents evidence
on the functional characteristics of the
peripheral auditory mechanism in nine
species of amphisbaenians. It includes ob-
servations on the anatomy of the ear in
two species as well as preliminary data
on three others. For the functional studies
we recorded the electrical potentials of
the cochlea (Wever,
'39, '66).
These po-
tentials represent the activity of the audi-
tory hair cells and reflect the properties
of the receptive and conductive systems
J. EXP. ZOOL.,179 17-34
and of the mechanoelectric processes in
the cochlea.
The species studied (table 1) were:
A m -
phisbaena alba 3 specimens), A m p h i s -
bae na darwin i t rac hura (1
specimen),
A m p h i s b a e n a
manni
(7 specimens), Chir-
india langi 2 specimens), Cynisca leu-
cura
3
specimens), Zygaspis v io lacea
3 specimens),
Monope l t i s c . capens is
2 specimens), T r o g o n o p h i s w i e g m a n n i
(2 specimens), and
Bipes b iporus (4
spe-
cimens).
METHOD
The an imals were anesthetized with
20%
solution
of
ethyl carbamate in phys-
iological saline, in dosages near 0.01 ml
per gram
of
body weight. The sensitivity
of the ear in terms of its cochlear poten-
tials was determined by recording from a n
electrode in contact with the perilymph
of the saccule, which is readily accessible
through the dorsolateral surface of the
posterior region of the head. The skull
The exper iments were carr ied out
in
the Auditory
Research Laboratories of Princeton University with
facilities provided by grants from the National Insti-
tu te of Neurological Diseases and Stroke. The speci-
men s were obta ined with funds f rom NSF GB-6521X .
2 Present address: Department of
Zoology,
The Uni-
versity of Michigan, A nn Arbor, Mich igan 48104.
17
7/27/2019 amphisbaenia
http://slidepdf.com/reader/full/amphisbaenia 2/18
18
CARL GANS AND ERNEST GLEN WEVER
TABLE
The specim ens used are deposited i n the Carl Gans (CG) collection. T he species used, the
catalogue numbers, the localities and the collectors are as follows: Amphisbnenn a l b a :
(no No.), Brazil, (dealer); same species (CG
371
71, Venezuela, Edo. Carabobo, Valencia
(S. M. McCown); same species (CG
3718),
Brazil,
S.
P. Jundiai, Sitio Bandeirante (W. C. A.
Bokermann).
Ampkisbaenn darwini trachurn:
(CG
3752),
Brazil, RGS, Tramandai, Emboaba
(C. P. Jaeger and
S.
Correa). Amphisbnena
manni:
(CG 3822, 3823, 3844, 3845, 3846, 3852,
3853, 3859, 3860, 3861, 3862, 3863) Hispaniola, Ile de la Tortue, Palmistes (C. R. Warren).
Bipes
b i p o ~ z t s : CG 3804, 3805, 3806, 3808) Mexico, Baja California, Sul de la Paz (L. W.
Robbins). Chirindin
langi:
(CG 4033, 4035), Mozambique, 15 miles southeast of Vila de
Manica
D .
G. Broadley, C. Gans and J. Visser). C y n i s c a leucura: (CG 4126), Ghana, Legon
(B. Hughes); same species: (CG 4151, 4152), Ghana, Legon, hill behind 2001. Dept. (B.
Hughes). Monopeltis c n p e n s i s : (CG 4456, 4457), South Africa, O.F.S. othaville (J. Visser).
Twgonopkis wiegmanni:
(2
specimens, no No.), Maroc (Dealer).
Zygnspis
violacea: CG
4546,
4558,4559),
Zulu land, N dum u Gam e Reserve (A. C. Pooley).
was exposed and a small hole was drilled
of a size that was tightly filled by the ta-
pered end of a fine steel needle that was
insulated except at the tip. Two other
electrodes, one of which was grounded,
were located on inactive tissues of the
region. The electrodes led to a differen-
tial preamplifier that provided an 80-db
rejection of stray potentials picked up
between two of the electrodes and the
grounded lead.
The animal was stimulated with a
series
of
tones that ordinarily covered the
range from
100
to 10,000 Hz, but in some
instances included lower frequencies. For
aerial stimulation the tones were produced
by a loudspeaker outside the shielded
chamber in which the animal was kept
and were conducted through the wall by
a tube. This tube terminated in a sound
cannula whose tip was located over the
facial region close to the skin surface.
To
avoid any possibility of mechanical con-
duction to the animal, this tube was held
out of direct contact and the narrow gap
between its rim and the skin was filled
with petroleum jelly to make a tight
acoustic seal.
A
probe tube leading to a
condenser microphone ran concentrically
within the sound tube and ended near its
tip, and the system was calibrated to pro-
vide readings of sound pressure. The
physiological state of the animal was gen-
erally monitored by display of a n elec-
trocardiogram.
Vibratory stimulation for other experi-
ments was produced by a crystal vibrator
that actuated a steel needle, the blunted
end of which could be applied to the body
surface. The vibrator was fitted with an
accelerometer and was calibrated by
means of a Fotonic sensor, a device
utilizing fiber optics for the precise mea-
surement of vibratory amplitudes.
The stimuli were presented at the in-
tensities necessary
to
produce some small
but reliably observable level of potential,
which, because of the physiological noise
present, was set between 0.05 and 0.2 pv.
In the curves the results are reported for
a standard output of
0.1
pv; when the
measured values differed from this level
the sound required was calculated, since
our tests had shown that the response at
low levels is a linear function of sound
pressure. The earliest measurements were
always repeated to check that the animal
had not deteriorated during the test
sequence.
Most of the measurements were made
at room temperature, which was about
2 3 C ,
since at higher temperatures the
animals seemed to desiccate rapidly, mu-
cous production increased, and we en-
countered very significant mortality. Only
in one instance
C h i r i n d i a l a n g i )
were we
able to obtain readings at higher temper-
atures. These readings support the results
of Werner ('68) that the general curve
shape remains similar but shifts to a
higher frequency range, while the sensi-
tivity increases slightly. Unfortunately
there are no published data for the pre-
ferred body temperatures of any amphis-
baenean. For this reason and because of
the relatively minor changes in absolute
values we deferred collection of temper-
ature data until after behavioral observa-
tions have been completed, when addi-
tional specimens may be available.

7/27/2019 amphisbaenia
http://slidepdf.com/reader/full/amphisbaenia 3/18
EAR AND HEARING IN AMPHISBAENIA (REPTILIA)
19
In many of the experiments, special
procedures were carried out to study the
processes of sound perception and the
transmission of vibrations to the cochlea.
The effect of severing the extracolumella,
singly or multiply, was studied in several
animals. In such operations the extra-
columella was first exposed by dissecting
away the overlying skin and muscle. The
effect of this procedure on sensitivity was
then checked prior to cutting the extra-
columella itself. Systematic exploration
of
the lateral surface
of
the head with
the mechanical vibrator was intended to
locate the sensitive zones. The direction-
ality of sound reception was tested by re-
cording from both ears while stimulating
with asymmetrically placed aerial sounds.
After the electrical tests had been com-
pleted, each anesthetized animal was per-
fused through the circulatory system by
means of a cannula inserted through the
ventricle into the ascending aortic ves-
sels. Perfusion with physiological saline
to flush out the blood was followed by a
fixative containing mercuric chloride,
potassium dichromate, sodium sulfate,
and formaldehyde. The fixation was con-
tinued for 40 to 60 minutes. The head
was then removed and the tissues trimmed
to a block containing both ears. This block
was replaced in fixative, decalcified
in
0.5%
nitric acid, dehydrated in an as-
cending series of alcohol from
10
to
100%
by
10%
steps, and embedded in celloidin.
The hardened celloidin block was sec-
tioned (horizontally, at an angle of about
15 toward the transverse) at 20
p
inter-
vals perpendicular to the long axis of the
basilar membrane. Every section in the
region of the ear was mounted separately
and stained with hematoxylin, azocarmine,
and orange G , a combination giving good
differentiation of the auditory hair cells.
While the procedure yields excellent pres-
ervation, it requires 10-12 months.
At the time of this report the histolog-
ical treatment is complete
on 14
animals
belonging to five species: three specimens
of Amphisbaena alba, one of A. darwini
trachura,
five of
A. manni ,
one of
Trogo-
nophis wiegmanni, and four of Bipes bi-
porus.
Several other specimens are still
in preparation, and detailed morpholog-
ical description is deferred until the his-
tological study is completed.
RESULTS
Anatomical observations
Earlier studies, especially those
of
Ver-
sluys
(1898)
on the ear region and of
Gans
('60)
on the Trogonophidae, have
included observations on the ear's struc-
ture and some descriptions of the auditory
mechanism. While none of the
140
species
of the order (Gans,
'67)
has an external
ear (fig.
l ) ,
all have middle and inner ear
structures, concealed below the uninter-
rupted dermal segments covering the
head.
Fig.
1
Dorsal, lateral and ventral views of the
head of Amphisbaenn
mnnni
(American Museum
no.
49726 ,
to show the pattern of dermal seg-
mentation. The second left infralabial is shaded.
The line equals 1 m m to scale.
7/27/2019 amphisbaenia
http://slidepdf.com/reader/full/amphisbaenia 4/18
20
CARL GANS AND ERNEST GLEN WEVER
Extracolurnel a'
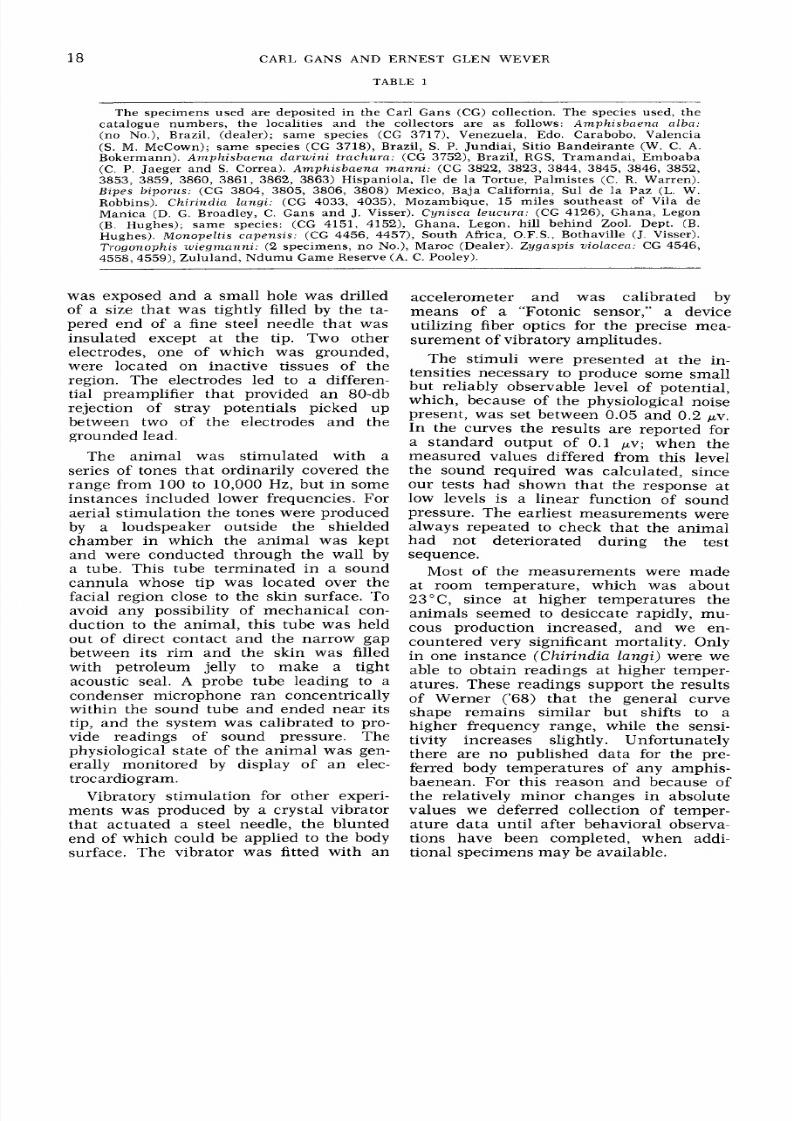
Fig. 2
Lateral
view of the skull
of
Anzpk i sb t re7zn t ~ e n(Carnegie Museum no.
37636)
showing the stapes an d extracolumella.
A s
in all other reptiles, the middle ear
mechanism consists of columellar and ex-
tracolumellar elements, but their form is
quite distinct (Baird, '70).
There is always an osseous coluniella,
also called a stapes. This element has a
broad footplate resting in the oval window
and a relatively short shaft (columellar
portion) the distal head
of
which connects
with a generally cartilaginous extracol-
umella tha t, except in Bipes, ultiniately
attaches to the skin anterior to the an-
gulus oris.
In the genus
Anzphisbaenn
the extra-
columella is a long, slender rod that ex-
tends from the stapes anterolaterally and
then anteriorly as shown in the drawing
(fig. 2) and the photomicrograph (fig. 3) .
Near its columellar articulation the extra-
columella runs through dense connective
and muscular tissues along the lateral
side
of
the quadrate bone on the medial
side of a muscle layer. More anteriorly
beyond the ar ticulation of the lower jaw
it emerges
as a structure lying freely in
the subcutaneous space.
Its anterior por-
tion enters the dermal layer
of
the skin
within which it shows broad connective
tissue attachment;
after a forward course
as far as the two posterior teeth, it tapers
Fig.
3
Photomicrograph
of
a section through
to a slender thread and ends.
the head
of
a specimen
of A?np / ? i s b~ i e? ru
nnni
depicts further details
of
the
showing the cochlear capsules and middle ear
structures. The posterior portion of the extra-
stapes and its connections in
Amphis-
columella on the left side had been interrupted
bne nn mnnni. The footplate is broad,
surgically; the system on the r ight is intact.
equalling the diameter of the otic capsule,
Figure
Scale
X 12.

7/27/2019 amphisbaenia
http://slidepdf.com/reader/full/amphisbaenia 5/18
EAR AND
H E A R I N G IN AMPHISBAENIA REPTILIA)
21
Fig. 4 Photomicrograph at a higher power of the right inner ear region
of
the same spe-
c imen as in the previous figure. e, extracolumella;
f,
footplate of stapes;
s,
shaft of stapes.
Scale
X
60
of which it forms the anterolateral wall.
The anterior portion of this ossicle makes
a wide articulation with the prootic bone,
while the smaller posterior portion is held
to the lateral wall of the capsule by a
wider ligament. The neck and headpiece
extend farthest laterally. The articular
surface is clearly indicated, while the con-
nection to the expanded end of the extra-
columella lacks an articular cleft and
seems relatively rigid.
In Trogonophis the stapes has much the
same form as in Amphisbaena, but the
extracolumella is a short, plate-shaped
cartilage expanding ventrally. Its forward
extension passes only a short distance an-
terior to the mandibular joint, and then
connects to a broad band of dense connec-
tive tissue that continues anterolaterally
to fuse with the deep layer of the skin.
In Bipes biporus the extracolumella
takes still a different form. From the col-
umellar articulation it extends laterally
and somewhat posteriorly for a compara-
tively short distance after which it ter-
minates in a flat headpiece that lies just
posterior to the quadrate bone. Its precise
relations to the enveloping soft tissues
need further study.
The inner ea r exhibits considerable uni-
formity in the species examined so far.
The basilar membrane has a distorted
oval form, is nearly as wide as it is long,
and bears an auditory papilla as shown
in cross section
of
Amphisbaena alba in
figure 5. In this section, which
is
from
the midregion of the basilar membrane,
there are 12 rows of hair cells whose cili-
ary tufts are embedded in a thick tec-
torial plate. These tufts extend into pits
in the lower surface of the plate. The tec-
torial membrane is attached to the plate
near its middle as shown. This arrange-
ment closely resembles that found in tur-
tles (Wever, unpublished).
Counts of the cochlear hair cells were
made in the specimens for which serial
sections were available and the preserva-
tion and staining were suitable. The re-
sults are given in table 2. The size of the
7/27/2019 amphisbaenia
http://slidepdf.com/reader/full/amphisbaenia 6/18
CARL GANS AND ERNEST GLEN WEVER
Tectorial membrane
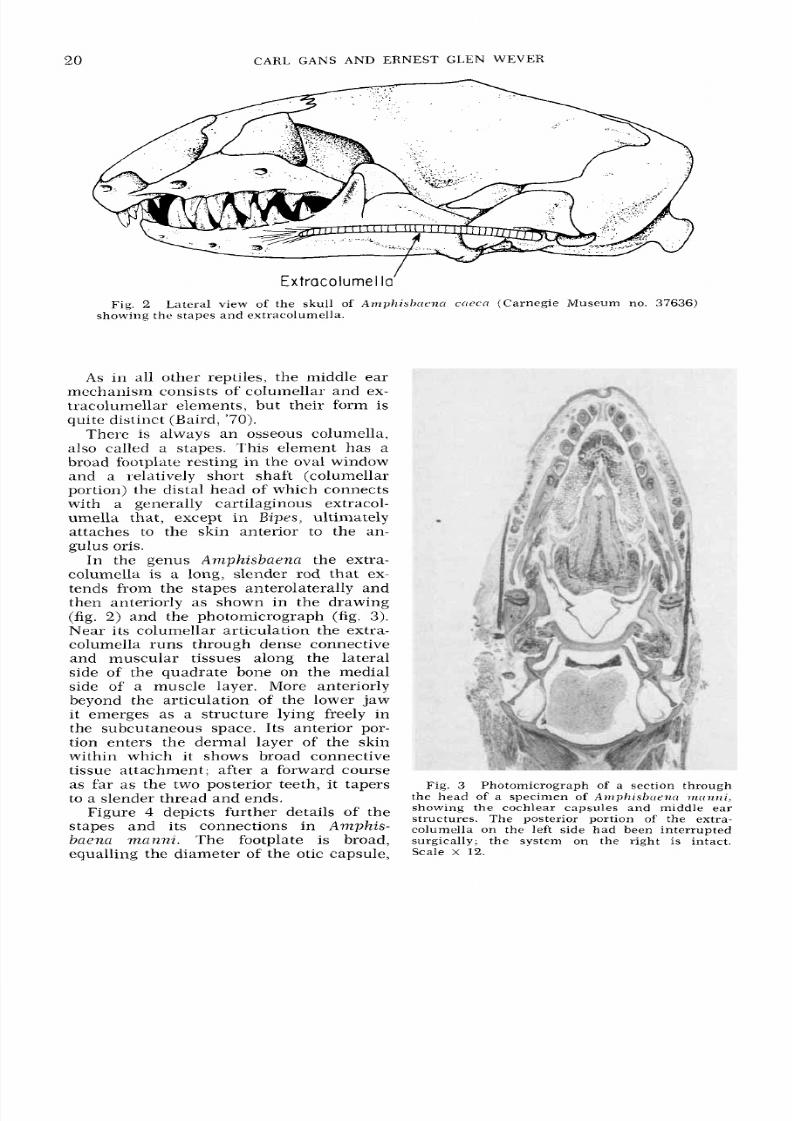
Fig,
5
Drawing
of
the auditory papilla
of A m p k i s b a e n a a l b a ,
from a section transverse
to the basilar membran e.
TABLE 2
N u m b e r of h a i r c e l l s
Species
Number of
cells
Animal
number Left ear Right ear
A m p i sb a e n a a l b n
1500
1667
1668
A m p h i s b a e n a d t rr w in i t i n c h ti r a
1525
A m p h i s b n e n t r m u n n i
1520
1524
1547
1548
T r o g o n op h i s w i e g m a n n i
1736
B ip e s b iporz r s
1522
1553
1554
1555
148
150
159 168
143
99 105
109
107 138
99 78
81 82
94 106
56
45 53
47 67
56 55
hair cell population varies with species.
Am phi sbae na a lba has the largest num-
ber, averaging
154 N = 3) .
For A . dar-
wini
t rachura (N
= 1),
A . m a n n i N
=
5 ) , and T r o g o n o p h i s w i e g m a n n i N =
1)
the numbers are hardly distinguishable,
approximately 100. For Bipes b iporus the
number is smaller, mean
54
N = 4).
Cochlear potent ia l s tudies
1.
A m p h i s b a e n a a l b a .
The solid-lined
curve in figure
6
gives measurements of
auditory sensitivity in terms of cochlear
potentials for
a
specimen of
A m p h i s b a e n a
alba,
under the usual conditions. This
curve reaches its lowest level, represent-
ing the greatest sensitivity, in the region
of
200
to 600 Hz, and then, as the fre-
quency increases, it rises, at first slowly
and then more rapidly, up to
5000
Hz.
Here a n inversion appears, after which
the upward rise continues.
After these tests had been concluded,
the extracolumella was cut anteriorly,
leaving only its posterior two-thirds con-
nected to the stapes. The results are
shown by the broken curve of this figure.
The sensitivity suffered a considerable
loss,
extending over the frequencies up

7/27/2019 amphisbaenia
http://slidepdf.com/reader/full/amphisbaenia 7/18
EAR AND HEARING
I N
AMPHISBAENIA (REPTILIA)
3 4 5
6 7 8 9 1 2
3 4
5
6 7 8 9 1
2 3
Frequency
Fig. 6 Auditory sensitivity to aerial sounds in a specimen of Amphisbaena alba under
normal conditions (solid line)
and after interrupting the extracolumella (broken line). The
curves represent for various frequencies the sound pressure, in decibels relative to
1 dyne
per sq cm, required to produce a cochlear potential of 0.1
pv. In this and the following
figures, frequency is in cycles per second
Hz) .
100 1000
Frequency
10,000
Fig.
7
Sensitivity curves in a second specimen of Amphisbaena alba under norm al condi-
tions (solid line) and after two successive interruptions
of
the extracolumella, one in the
anterior portion
of
this rod (long-dashed curve) and the other more posteriorly (short-dashed
curve).
to
2000
Hz
and averaging
33
dB. For tones
In
a second specimen (solid-lined curve
above this point at which observations of figure
7),
the sensitivity was greatest
could be made, there were no significant in the range from
100
to
290
H z and fell
changes.
off fairly regularly for higher tones. When

7/27/2019 amphisbaenia
http://slidepdf.com/reader/full/amphisbaenia 8/18
24
C A R L GANS A N D ERNEST GLEN WEVER
the extracolumella was first cut at an an-
terior position (long-dashed curve), and
then at a more posterior site (short-
dashed curve) the sensitivity fell progres-
sively. Apart from one inversion, the sec-
ond of these impairment curves lies above
the first, showing that sensitivity is re-
lated to the intact length
of
the extra-
columella.
2. A m p h i s b a e n a d a r w i n i t rachura . The
sensitivity
of
a specimen of
A m p h i s b a e n a
d a r w i n i t r a c h u r a with the sound source
placed forward on the lower jaw is rea-
sonably uniform up to 600
Hz,
after which
the curve rises sharply showing a loss
of
sensitivity, and then falls rapidly to the
point of best response at 1000 Hz
fig.
8).
The sensitivity decreases for the upper
frequencies. Even in the low-tone region
the sensitivity
is
slight. A second sound
probe position near the center of the sec-
ond infralabial gave somewhat greater
sensitivity (fig.
9).
The form
of
the curve
is similar except that the sharp rise at
100
1000
Frequency
10,000
Fig.
8 A
normal sensitivity function in a specimen of
Anzphisbflena dwwin i
tmchzim
(left ear).
60
-
0
Frequency
Fig.
9
Sensitivity functions for the right ear of the same specimen as in th e preceding
figure, under normal conditions (solid line) and after cutting the extracolumella (broken line).
7/27/2019 amphisbaenia
http://slidepdf.com/reader/full/amphisbaenia 9/18
E A R A N D H E A R I N G I N A M P H I S B A E N I A R E P T I L I A )
5
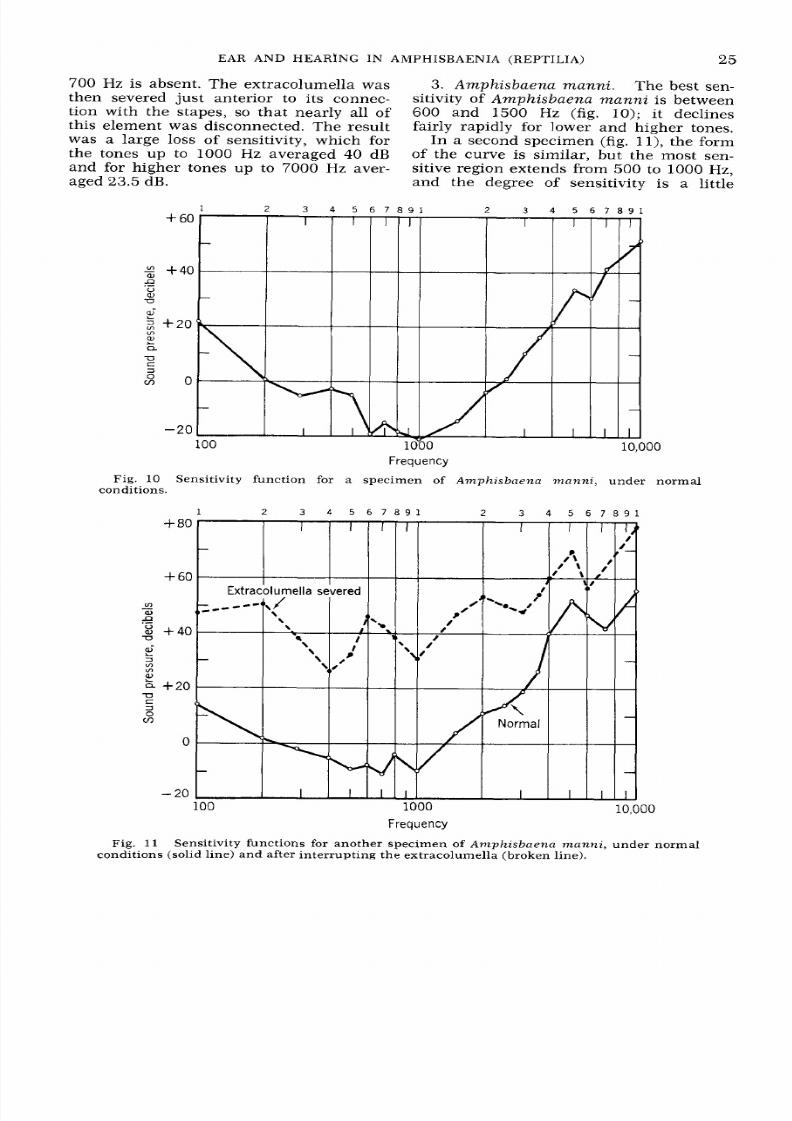
700 Hz
is absent. The extracolumella was
then severed just anterior to its connec-
tion with the stapes, so that nearly all of
this element was disconnected. The result
was a large
loss
of sensitivity, which for
the tones up to 1000 H z averaged 40 dB
and for higher tones up to
7000 Hz
aver-
aged
23.5
dB.
3.
A mph i s baena ma nn i . The best sen-
sitivity of A m p h is b ae n a m a n n i is between
600 and
1500
Hz (fig. 10); i t declines
fairly rapidly for lower and higher tones.
In a second specimen (fig. l l ) , the form
of the curve is similar, but the most sen-
sitive region extends from
500
to 1000
Hz,
and the degree of sensitivity is a little
r e q u e n c y
Fig.
10
Sensitivity function for a specimen
of Amphisbtrena manni,
under normal
conditions.
1
2 3 4
5
6 7 8 9 1 2 3 4
5
6 7 8 9 1
r e q u e n c y
Fig.
1 1
Sensitivity functions for another specimen of
Amphisbnena manni ,
under normal
conditions (solid line) an d after interrupt ing the extracolumella (broken line).
7/27/2019 amphisbaenia
http://slidepdf.com/reader/full/amphisbaenia 10/18
26
C A R L
GANS
AND
ERNEST GLEN WEVER
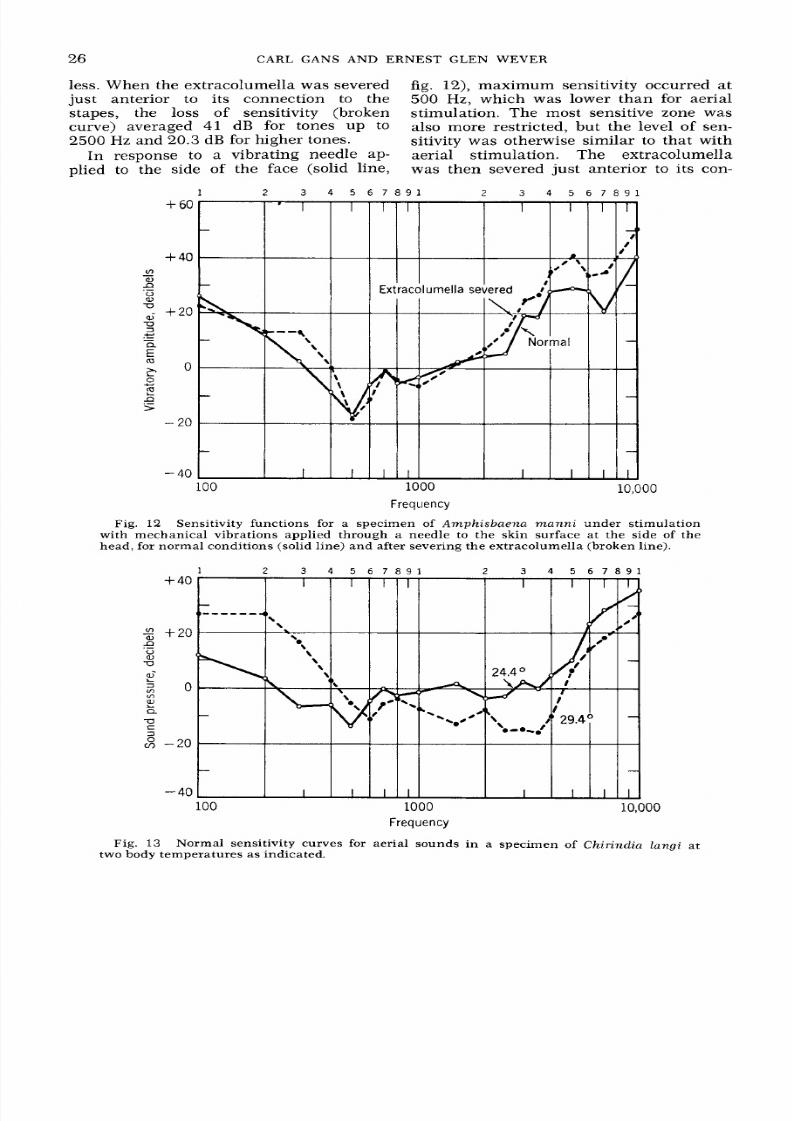
less. When the extracolumella was severed
fig. 12), maximum sensitivity occurred at
just anterior to its connection to the 500 Hz, which was lower than for aerial
stapes, the
loss
of sensitivity (broken stimulation. The most sensitive zone was
curve) averaged 41 dB for tones up to also more restricted, but the level of sen-
2500 Hz and 20.3 dB for higher tones. sitivity was otherwise similar to that with
In response to a vibrating needle ap- aeria l stimulation. The extracolumella
plied to the side of the face (solid line, was the n severed jus t anterior to its con-
1
2 3
4
5 6 7 8 9 1
2
3 4 5
6 7 8 9 1
Frequency
Fig.
12
Sensitivity functions for a specimen of Amphisbaena
manni
under stimulation
with mechanical vibrations applied through a needle to the skin surface at the side
of
the
hea d, for norma l conditions (solid line) an d after severing the extracolum ella (broken line).
40
- 0
Fig.
13
Normal sensitivity curves for aerial sounds in a specimen of C h i r i n d i a langi at
two body tem perat ures as indicated.
7/27/2019 amphisbaenia
http://slidepdf.com/reader/full/amphisbaenia 11/18
EAR AND HEARING IN AMPHISBAENIA (REPTILIA)
7
nection to the stapes, and the measure-
ments repeated (dashed line) with only
slight effect on sensitivity.
4. Chirindia langi. Two curves for a
specimen of Chirindia langi, taken respec-
tively at 24.4 C and 29.4 C, are shown in
figure
13
At the lower temperature the
curve reaches its lowest point (greatest
sensitivity) at
500
Hz, whereas at the
higher temperature this point
is
in the
higher frequencies, around 3000 Hz.
There is also a shift in the two ends of
the curve; at the higher temperature the
low end is raised and the high end is
lowered. This type of modification of audi-
tory sensitivity was shown to be a regular
occurrence in extensive experiments on
lizards by Werner ('68).
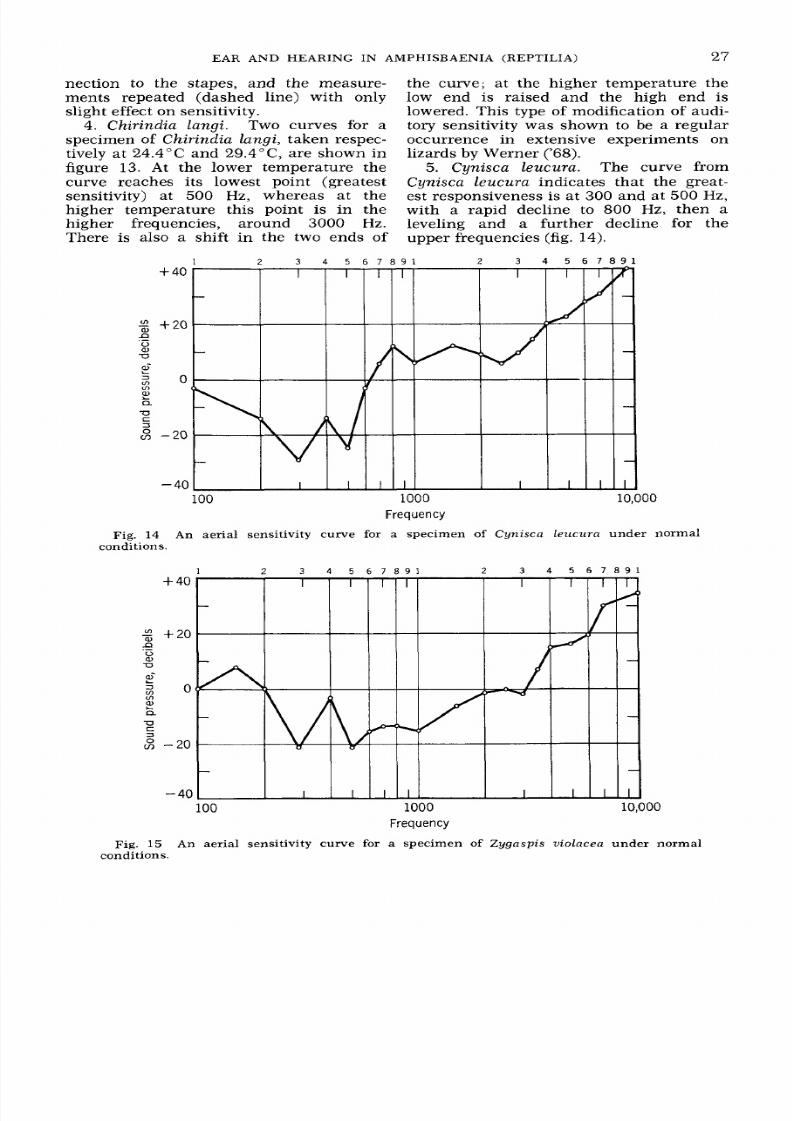
5.
Cynisca leucura. The curve from
Cynisca leucura indicates that the great-
est responsiveness is a t
300
and at 500
Hz,
with
a rapid decline to 800 Hz, then a
leveling and
a
further decline for the
upper frequencies (fig. 14).
Fig.
14
conditions.
An aerial sensitivity curve for a specimen of Cynisca leucura under normal
Frequency
Fig.
15
conditions.
An aerial sensitivity curve for a specimen
of Zygaspis violacea
under normal
7/27/2019 amphisbaenia
http://slidepdf.com/reader/full/amphisbaenia 12/18
28 CARL GANS AND ERNEST GLEN WEVER
6 .
Z y gasp i s u io lac e a . The greatest
sensitivity of a specimen of
Z y gasp i s
vi-
olacea occurred at 300 and at 500
H z
with a sharp loss in the intermediate zone
as in C y ni sc a (fig. 15). The sensitivity
decline at higher frequencies is typical
of Phese animals.
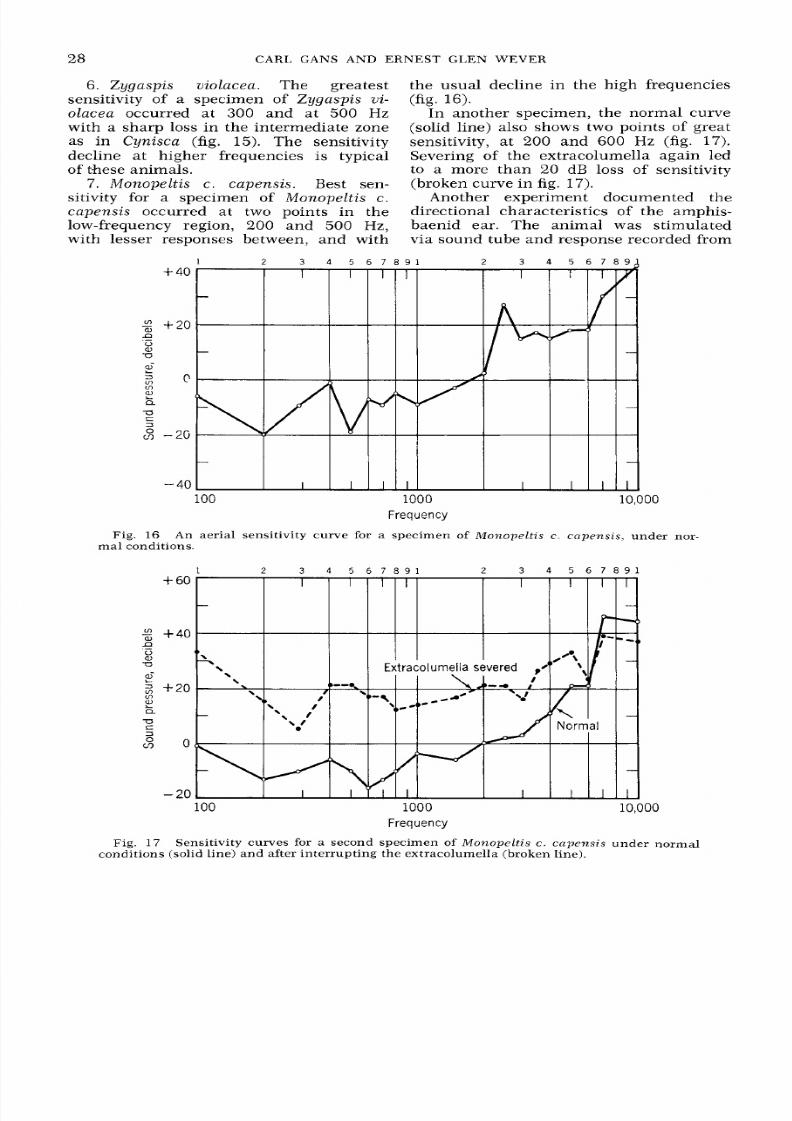
7.
Monope l t i s c c ape ns i s . Best sen-
sitivity for a specimen of Monope l t i s c.
c ape ns i s
occurred at two points in the
low-frequency region, 200 and
500
H z,
with lesser responses between, and with
40
the usual decline in the high frequencies
(fig. 16).
In another specimen, the normal curve
(solid line) also shows two points of great
sensitivity, at
200
and 600
H z
(fig. 17).
Severing of the extracolumella again led
to a more than 20 dB loss of sensitivity
(broken curve i n fig.
17).
Another experiment documented the
directional characteristics of the amphis-
baenid ear. The animal was stimulated
via sound tube and response recorded from
-
40
100
1000
Frequency
10,000
Fig. 16 An aerial sensitivity curve for a specimen of M o n o p e l t i s c. c a p e n s i s , under nor-
ma l conditions.
100
1000
Frequency
10,000
Fig. 17
Sensitivity curves for
a
second specimen of
M o n o p e l t i s
c. c a p e n s i s
under normal
conditions (solid line) a nd after inter rupt ing the extracolumella (broken line).

7/27/2019 amphisbaenia
http://slidepdf.com/reader/full/amphisbaenia 13/18
EAR AND HEARING IN AMPHISBAENIA (REPTILIA)
29
both saccules. The results obtained from
the right ear are shown by the solid line
of figure
18
and those from the left ear
by the broken line. In general (all except
2
points), there is a clear difference in
favor of the ipsilateral ear.
A
greater dif-
ferential response occurred when stimula-
tion was carried out by placing the sound
tube at a distance of
5
cm from the right
side of the face.
100
8. Trogonophis wiegmanni. A speci-
men of Trogonophis wiegmanni showed
excellent sensitivity with the maximum
falling between 300 and 500
Hz
(fig.
19),
in an experiment extended down to 40
Hz.
Figure 20 compares results for aerial and
vibratory stimulation in a second speci-
men. The aerial curve is much like the
previous one, though the region of good
sensitivity is broader. The curve for vibra-
2 3 4 5 6 7 8 9
1
1000
10,000
Frequency
Fig.
18
Aerial sensitivity curves obtained in a specimen of Monopeltis c. capensis with
an electrode applied
to
the left saccule (solid line) a nd a n electrode applied to the right sac-
Cole (broken line). For both sets of observations the sound tube was close to the surface of
the face on t he left side.
40
3
+20
2-
2 0
P
u
T2
m
a
0
-u
S
; 20
-
40
100 1000
Frequency
Fig. 19
A
sensitivity cu rve for a spe cim en of Trogonophis wiegmnnni.
100
7/27/2019 amphisbaenia
http://slidepdf.com/reader/full/amphisbaenia 14/18
30
C A R L G A N S A N D E R N E S T G L E N W E V E R
2 3 4 5 6 7 8 9 1 2 3 4 5 6 7 8 9 1
5 6
7 8 9
Frequency
1000 10,000
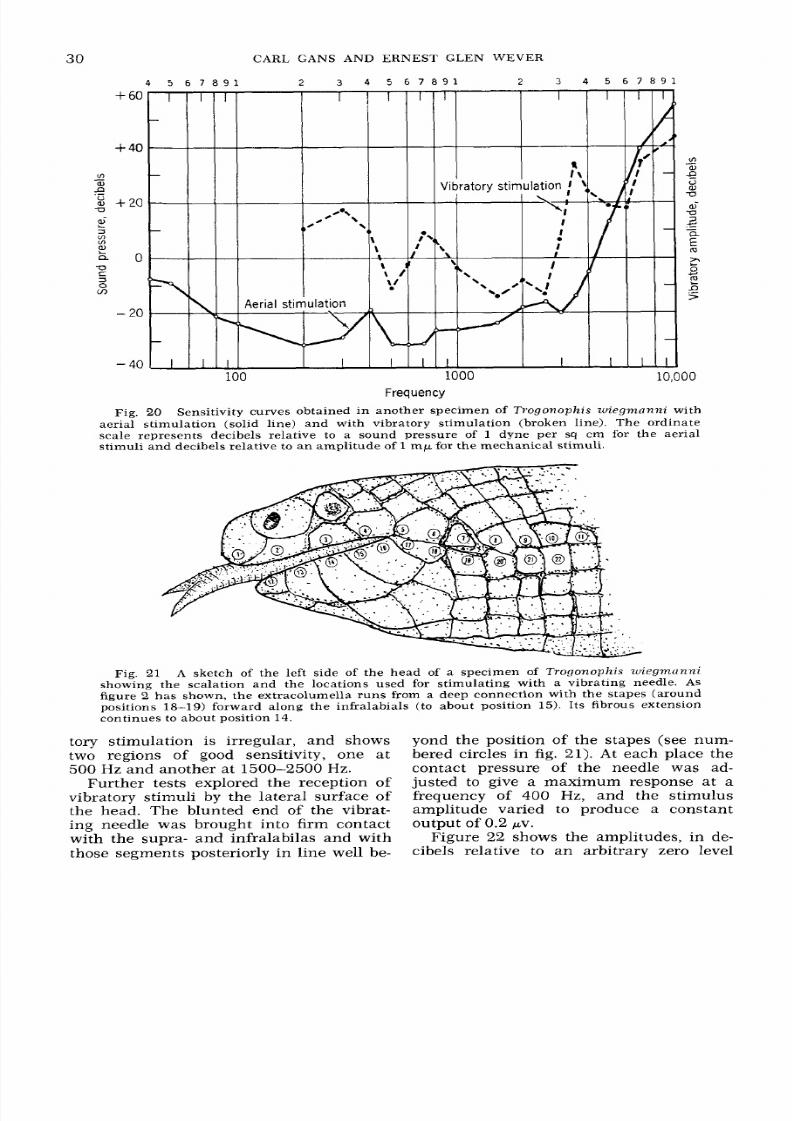
Fig.
20
Sensitivity curves obtained in another specimen of Trogonophis wiegmnnni with
aerial stimulation (solid line) and with vibratory stimulation (broken line). The ordinate
scale represents decibels relative to a sound pressure
of 1
dyne per
sq
cm for the aerial
stimuli a nd decibels relative to a n amplitu de of
1
m p for the me chanic al stimuli.
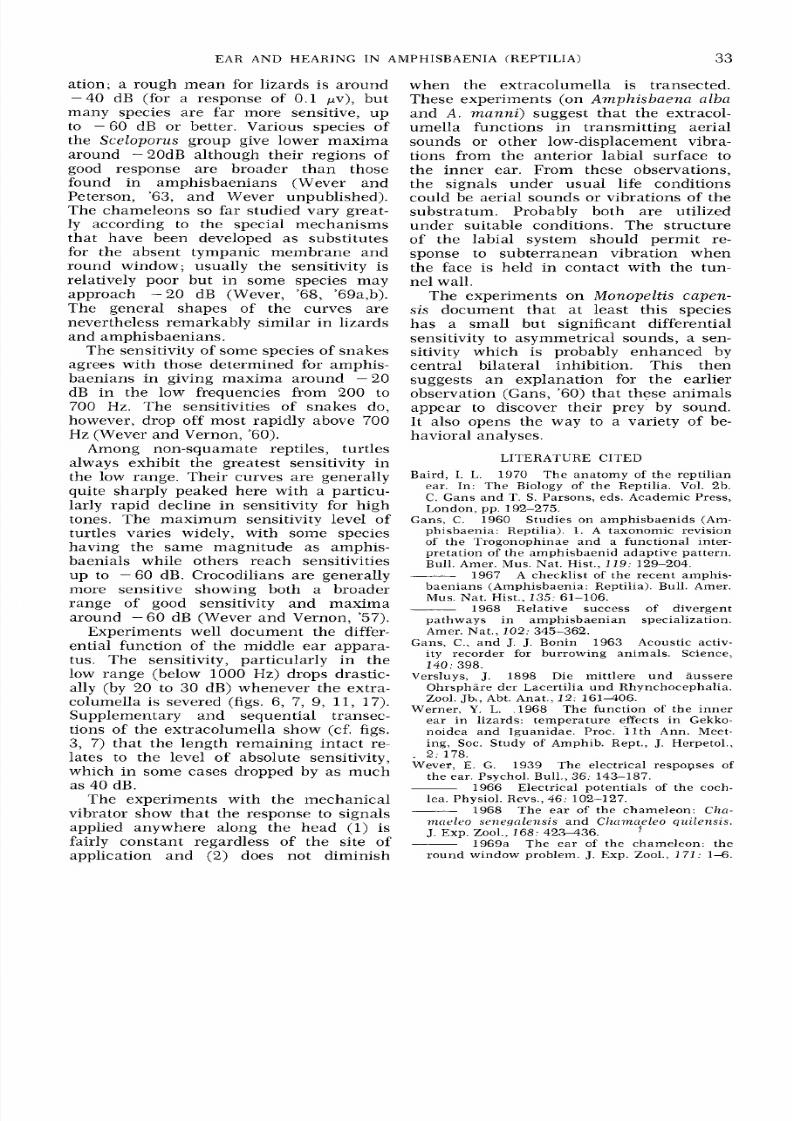
Fig.
21
A sketch of the left side of the head of a specimen of Trogonophis wiegmcinni
showing the scalation a nd the locations used for stimulat ing with a vibrating needle. As
figure 2 has shown, the extracolumella runs from a deep connection with the stapes (around
positions
18-19)
forward along the infralabials (to about position 15 . Its fibrous extension
continues to about position 14.
tory stimulation is irregular, and shows
two regions
of
good sensitivity, one at
500 Hz and another at 1500-2500 Hz.
Further tests explored the reception of
vibratory stimuli by the lateral surface of
the head. The blunted end of the vibrat-
ing needle was brought into firm contact
with the supra- and infralabilas and with
those segments posteriorly in line well be-
yond the position of the stapes (see num-
bered circles in
fig.
21). A t each place the
contact pressure
of the needle was ad-
justed to give a maximum response at a
frequency
of 400
Hz, and the stimulus
ampli tude varied to produce a constant
Figure 22 shows the amplitudes, in de-
cibels relative to an arbitrary zero level
output
of
0.2 pv.

7/27/2019 amphisbaenia
http://slidepdf.com/reader/full/amphisbaenia 15/18
EAR AND HEARING I N AMPHISBAENIA (REPTILIA)
31
10
P
11
0
-L
>
0 .
required for the standard response, as a
function of distance from the tip of the
jaw for both the lower jaw (solid line) and
the upper jaw (broken line). In this
graph, unlike the others, the lower the
curve the less the sensitivity. It is seen
that along both upper and lower jaws
there is
no
significant variation of sensi-
tivity with position until the vibrator
reaches the zone where the extracolum-
ella lies deep to the jaw muscles; sensi-
tivity then sinks sharply to a new and
much lower level.
9. Bipes b iporus .
Our resul ts for
B i p es
b i p o r u s
are to be regarded as preliminary,
-
I I I
because at the time of these tests we were
unaware that the extracolumella termi-
nated posterior to the quadrate. Presum-
ably, the sound tube for aerial stimula-
tion should not have been located adjacent
to the anterior portion of the head. Four
animals tested with aerial sounds showed
a range of sensitivity represented by the
two curves of figure
23.
The solid-lined
curve indicates a level of best sensitivity
that is about the same as observed in
other amphisbaenians, but differs in that
this falls
in
the high tones, around
3000
Hz. The dashed curve shows rather little
sensitivity, with irregularities, and does
40
+ 2 0
P
l
D
0
al
U
S
6 -20
- 0
100 1000 10,000
Frequency
Fig. 23
Aerial sensitivity curves in two specimens of Bipes biporus chosen to show the
range obtained.

7/27/2019 amphisbaenia
http://slidepdf.com/reader/full/amphisbaenia 16/18
3
CARL GANS AND ERNEST GLEN WEVER
v
-
3 + 2 0
1 0
Q
E
20
7
+-
.
>
1 40E
0
100
2 3
4
5 6
7 8 9 1 2
3
4 5 6 7
1000
Frequency
10,000
Fig. 24 Sensitivity curves obtained for vibratory stimulation in a specimen of B i p e s
biporiis with the needle applied to the side of the face nea r t he stapes ((solid line) an d to th e
front region of th e lower j a w (broken line).
not agree in form with the other curve.
Whether these differences are due to the
manner of presentation of the sounds or
to other conditions of the tests, or repre-
sent actual individual variations, is dif-
ficult to say.
Figure
24
shows two curves obtained by
vibratory stimulat ion , one (solid line) by
placing the vibrating needle on the side
of the face in the region of the stapes and
the other (broken line) by placing it on
the front edge
of
the lower jaw. The two
functions have much the same form, but,
in general, stimulation near the stapes
shows the greater sensitivity. The level of
sensitivity is similar to that found by this
method in other species.
DISCUSSION
The observations clearly show that am-
phisbaenians are sensitive to aerial
sounds, and that these sounds are con-
ducted to the inner ear by way of the skin
along the lower jaw, the extracolumella,
and the stapes. In amphisbaenians gener-
ally the extracolumella projects anteriorly
to provide a dermal connection lateral to
the mandible.
B i p e s b i p o r u s
represents an
exception since its extracolumella is short
and attaches to the skin in the immediate
vicinity of the quadrate.
In the members of the family Amphis-
baenidae (genera A m p h i s b a e n a , C h i r in d i a ,
C y n i s c a , M o n o p e l t i s , and Z y g a s p i s ) , the
extracolumellar rod extends far forward
into the skin layer, lateral to the lower
jaw. In T r o g o n o p h i s , the extracolumella
does not itself run as far forward as a
cartilaginous structure but is extended
by a strong band of connective tissue that
evidently serves the same purpose. Gans
('60) showed that this connective tissue
apparently serves as the starting point for
the ossification of the extracolumella seen
in the trogonophid genera D i p l o m e t o p o n
and A g a m o d o n . Here the tissue has be-
come ossified, and many of the connec-
tions run to the upper rather than the
lower lip.
Most amphisbaenian ears have a region
of greatest sensitivity in the low frequen-
cies, usually between 300 and 700 Hz.
This zone often contains two points of
high sensitivity separated by a less sensi-
tive zone. In A m p h i s b a e n a manni the best
region seems to be slightly higher (be-
tween 700 and 1000 Hz) , and it may be
still higher in B i p e s b i p o r u s . Most of the
amphisbaenian species yielded sensitivity
curves whose maximum was approximate-
ly
-20
dB though there was considerable
variation and T r o g o n o p h i s repeatedly
reached
-
40
dB.
The levels of cochlear potentials may
be compared with similar results on other
squamates, which also showed large vari-
7/27/2019 amphisbaenia
http://slidepdf.com/reader/full/amphisbaenia 17/18
EAR AND HEARING IN AMPHISBAENIA (REPTILIA) 33
ation; a rough mean for lizards is around
- 4 0
dB (for a response of
0 .1
~ v ) , ut
many species are far more sensitive, up
to -60 dB or better. Various species of
the
Sceloporus
group give lower maxima
around -20dB although their regions of
good response are broader than those
found in amphisbaenians (Wever and
Peterson, '63, and Wever unpublished).
The chameleons
so
far studied vary great-
ly
according to the special mechanisms
that have been developed as substitutes
for the absent tympanic membrane and
round window; usually the sensitivity is
relatively poor but in some species may
approach - 20 dB (Wever, '68, '69a,b).
The general shapes of the curves are
nevertheless remarkably simi lar in lizards
and amphisbaenians.
The sensitivity of some species of snakes
agrees with those determined for amphis-
baenians in giving maxima around -20
dB in the low frequencies from 200 to
700 Hz. The sensitivities of snakes do,
however, drop off most rapidly above 700
Hz (Wever and Vernon, '60).
Among non-squamate reptiles, turtles
always exhibit the greatest sensitivity in
the low range. Their curves are generally
quite sharply peaked here with a particu-
larly rapid decline in sensitivity for high
tones. The maximum sensitivity level of
turtles varies widely, with some species
having the same magnitude as amphis-
baenials while others reach sensitivities
up to -6 0 dB. Crocodilians are generally
more sensitive showing both a broader
range of good sensitivity and maxima
around -60 dB (Wever and Vernon,
'57).
Experiments well document the differ-
ential function of the middle ear appara-
tus. The sensitivity, particularly in the
low range (below
1000
Hz) drops drastic-
ally (by 20 to 30 dB) whenever the extra-
columella is severed (figs. 6,
7,
9, 11,
17).
Supplementary and sequential transec-
tions of the extracolumella show (cf. figs.
3,
7)
that the length remaining intact re-
lates to the level of absolute sensitivity,
which in some cases dropped by as much
as 40 dB.
The experiments with the mechanical
vibrator show that the response to signals
applied anywhere along the head 1) is
fairly constant regardless of the site of
application and (2) does not diminish
when the extracolumella is transected.
These experiments (on A m p h i s b a e n a a lb a
and A . m a n n i ) suggest that the extracol-
umella functions in transmitting aerial
sounds or other low-displacement vibra-
tions from the anterior labial surface to
the inner ear. From these observations,
the signals under usual life conditions
could be aerial sounds or vibrations of the
substratum. Probably both are utilized
under suitable conditions. The structure
of the labial system should permit re-
sponse to subte rranean vibration when
the face is held in contact with the tun-
nel wall.
The experiments on Monope l t i s capen-
s i s document that at least this species
has a small but significant differential
sensitivity to asymmetrical sounds, a sen-
sitivity which is probably enhanced by
central bilateral inhibition. This then
suggests an explanation for the earlier
observation (Gans, '60) that these animals
appear to discover their prey by sound.
It also opens the way to a variety of be-
havioral analyses.
LITERATURE CITED
Baird, I. L. 1970 The anatomy of the reptilian
ear. In: The Biology of the Reptilia. Vol.
2b.
C . Gans and T. S. Parsons, eds. Academic Press,
London, p p. 192-275.
Gans,
C .
1960 Studies on amph isbaen ids (Am-
phisbaenia: Reptilia). 1. A taxonomic revision
of the Trogonophinae and
a
functional inter-
pretation of the amphis baenid ad aptive patt ern.
Bull. Amer. Mus. Nat. Hist., 119: 129-204.
A
checklist of the recent amphis-
bae nian s (A mphis baenia: Reptilia). Bull. Amer.
Mus. Nat. Hist., 135: 61-106.
1968 Relative success of divergent
pathways in amphisbaenian specialization.
Amer.
Nat. ,
10 2: 345-362.
Gans, C., and J. J. Bonin 196 3 Acoustic activ-
ity recorder for burrowing animals. Science,
140: 398.
Versluys,
J.
1898 Die mittlere und aussere
Ohrsphare der Lacertilia und Rhynchocephalia.
Zool. Jb', Abt. Anat. , 12: 16 1 4 0 6 .
Werner, Y. L. ,1968 The function
of
the inner
ear in lizards: temperature effects in Gekko-
noidea and Iguanidae. Proc. 11th Ann. Meet-
ing, SOC.Study of Amphib. Rept., J. Herpetol.,
. 2: 178.
Wever,
E .
G. 193 9 The electrical respogses of
the ear. Psychol. Bull., 36: 143-187.
1966 Electrical pot enti als of the coch-
lea. Physiol. Revs., 46: 102-127.
1968 The ear
of
the chameleon:
C h n -
miicleo s e n e g a l e m i s and Chiimcleleo
qziilensis.
J. Exp. Zool., 168: 42 34 3 6.
1969a The ear of the chameleon : the
round window problem.
J.
Exp. Zool., 171: 1-6.
1967

7/27/2019 amphisbaenia
http://slidepdf.com/reader/full/amphisbaenia 18/18
34 CARL GANS AND ERNEST GLEN WEVER
1969b The ear
of
the chameleon: Clzn Wever, E. G., and J. A . Vernon 1957 Auditory
mneleo koknelii
a n d
C k a m c t e l e o jnchsoni.
J. responses in the spectacled caiman. J. Cell. and
Exp. Zool., 171: 3 0 5 3 1 2 .
Wever, E. G., and E.
A.
Peterson 1963 Audi- ___ 1960 'The problem of hearing in snakes.
tory sensitivity in three iguanid lizards.
J.
Audi-
tory Res., 3 : 205-212.
Comp.
Physiol., 50: 33-340.
J. Auditory Res.,
1 ;
77-83.