amn healthcare investor presentation - amazon s32016+ir+deck_2+26+16+final+3… · amn healthcare...
TRANSCRIPT

The Innovator in Healthcare Workforce Solutions and Staffing Services
AMN Healthcare Investor Presentation
February 2016

Forward-Looking Statements
Confidential Intellectual Property of AMN Healthcare 2
This investor presentation contains “forward-
looking statements” within the meaning of
Section 27A of the Securities Act of 1933, as
amended, and Section 21E of the Securities
Exchange Act of 1934, as amended. The
Company bases these forward-looking
statements on its current beliefs, expectations,
estimates, forecasts and projections about
future events and the industry in which it
operates. Forward-looking statements are
identified by words such as “believe,”
“anticipate,” “expect,” “intend,” “plan,” “will,”
“should,” “would,” “project,” “may,” variations
of such words and other similar expressions.
In addition, statements that refer to
performance; plans, objectives and strategies
for future operations; and other
characterizations of future events or
circumstances, are forward-looking
statements.
The Company’s actual results could differ
materially from those discussed in, or
implied by, these forward-looking
statements. Factors that could cause actual
results to differ from those discussed in or
implied by the forward-looking statements
contained in this presentation are set forth
in the Company's Annual Report on Form
10-K for the year ended December 31,
2015 and its other periodic reports, its
current reports and its other filings with the
SEC. Developments subsequent to this
presentation are likely to cause these
statements to become outdated with the
passage of time. This presentation was first
made publicly available at
www.amnhealthcare.com on February 29,
2016.

Our Mission
3
Every day, we . . .
Deliver the best talent and insights
to help healthcare organization
optimize their workforce
Give healthcare professionals
opportunities to do their best work
towards quality patient care
Create a values-based culture of
innovation where our team
members can achieve their goals

A Trusted Partner
4
2014
20152015
2015
Governance, Risk, &
Compliance Leadership
Award Winner
Most TrustworthySelected from 8,000
publicly traded companies
Corporate Governance
Team of the Year
Best Compliance &
Ethics Program

5
Key Investor Highlights
Market leader in healthcare workforce solutions – staffing,
physician and executive search, interim leadership
Innovator in healthcare workforce solutions: MSP, VMS,
RPO, Consulting Recent acquisitions: B.E. Smith, The First String, MillicanSolutions, Healthsource Global
Strong demand environment; double-digit organic
revenue growth
Long-term growth supported by aging population,
clinical labor shortage
Scalable, efficient operating model
Stable with strong cash flow & balance sheet

AMN Strategic Growth
Travel NurseAmerican Mobile Nurses: A founding company
1980s
1990s
Nurse and Allied ExpansionAmerican Mobile Healthcare, MedicalExpress
2009 -
2013
2014 -
2015
2000-
2008
Workforce Solutions: MSP, RPO and VMSMedFinders, ShiftWise
Nurse, Physician, VMS, Nurse, Physician Leadership, Predictive Modeling Onward Healthcare, Locum Leaders, Medefis, The First String, MillicanSolutions, Avantas
Physician, Allied, Nurse and Search ExpansionMerritt Hawkins, StaffCare, MedTravelers, O’Grady Peyton
2016
Interim Leadership and Executive search, Crisis/Labor Disruption StaffingB.E. Smith, Healthsource Global
8

Bolstering Staffing Capabilities
Expanding Workforce Solutions
Recent Acquisitions
Premier national travel nurse and
allied staffing company
Leading provider of workforce consulting, labor optimization,
predictive data analytics, scheduling technology
Leading provider of vendor
management system technology
Well-respected national locum
tenens staffing company
7
Healthcare Leadership
Leading provider of interim healthcare leadership, executive search
and advisory services
Nurse leader recruitment,
training & development
Physician
executive recruitment
Leading national provider of crisis &
labor disruption staffing & consulting

B.E. Smith Acquisition
8
Top-ranked healthcare executive search firm
placing candidates on an interim and permanent
basis in mid-level and senior executive positions
Solutions and Services
Interim Leadership . Executive Search
Advisory Services
• 2015 annualized rev: $100 million;
adj. EBITDA margin: 15%
• Purchase price: $160 million
-$25 million tax benefit
• Immediately accretive to EPS
8
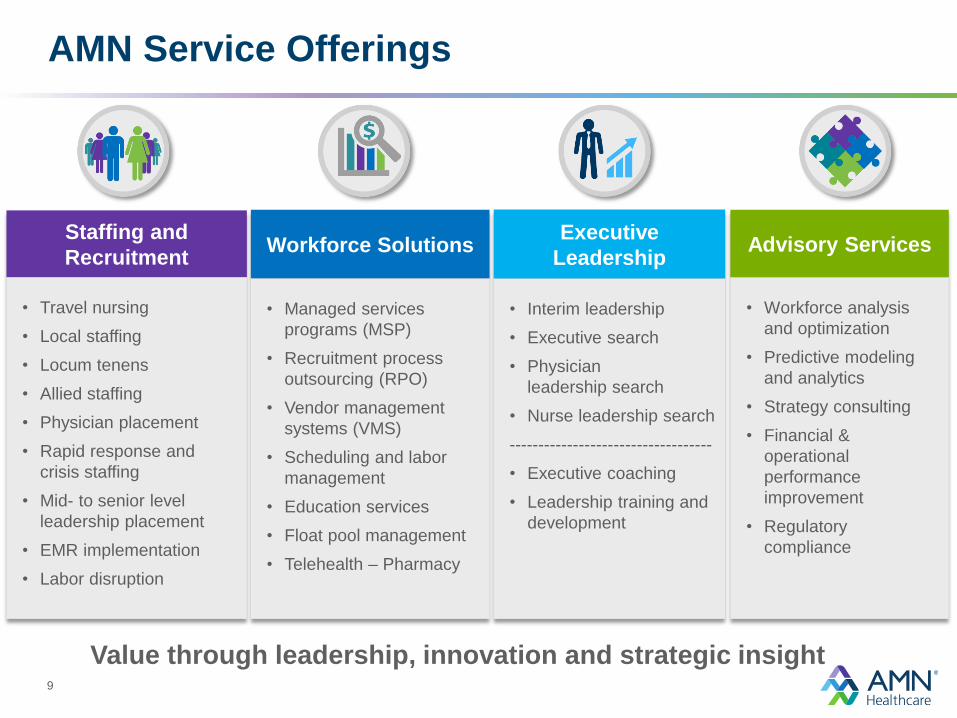
9
Staffing and
Recruitment
• Travel nursing
• Local staffing
• Locum tenens
• Allied staffing
• Physician placement
• Rapid response and
crisis staffing
• Mid- to senior level
leadership placement
• EMR implementation
• Labor disruption
Workforce Solutions
• Managed services
programs (MSP)
• Recruitment process
outsourcing (RPO)
• Vendor management
systems (VMS)
• Scheduling and labor
management
• Education services
• Float pool management
• Telehealth – Pharmacy
Advisory Services
• Workforce analysis
and optimization
• Predictive modeling
and analytics
• Strategy consulting
• Financial &
operational
performance
improvement
• Regulatory
compliance
AMN Service Offerings
Value through leadership, innovation and strategic insight
Executive
Leadership
• Interim leadership
• Executive search
• Physician
leadership search
• Nurse leadership search
-----------------------------------
• Executive coaching
• Leadership training and
development

Reportable Segments
• All nursing specialties
• Physical therapists,
respiratory, imaging, lab
technologists
• Pharmacists and techs
• Temporary physician
staffing
• MSP, Locums Billing
• Interim leadership
• Executive search
• Physician search
• Recruitment process
outsourcing
• VMS
• Consulting & predictive
analytics
• Scheduling
• Education
Nurse and Allied Solutions Locum Tenens Solutions Other Workforce Solutions
Source: Revenue mix is Q1 2016 approximate mix per data provided on Q4 2015 earnings call
of revenues of revenues of revenues
• Travel nurse
• Allied staffing
• Local staffing
• MSP
• EMR staffing
• Crisis/Labor disruption • All physician specialties
• Advanced practice
specialties
• Dentistry staffing
10
22% 15%63%
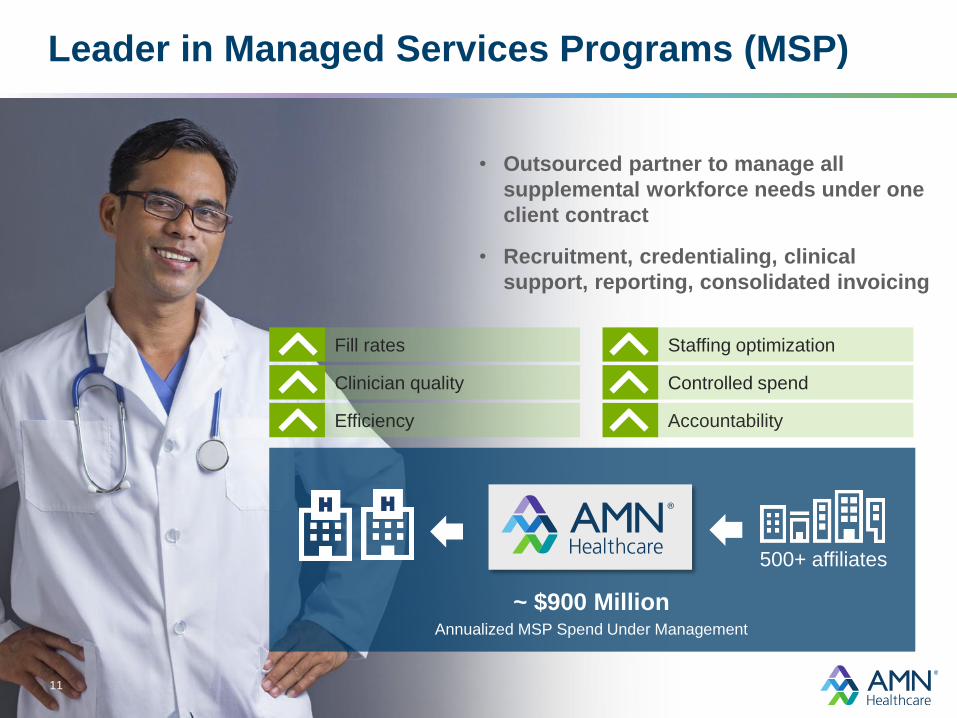
Leader in Managed Services Programs (MSP)
• Outsourced partner to manage all
supplemental workforce needs under one
client contract
• Recruitment, credentialing, clinical
support, reporting, consolidated invoicing
~ $900 Million Annualized MSP Spend Under Management
11
500+ affiliates
Fill rates
Clinician quality
Efficiency
Staffing optimization
Controlled spend
Accountability
11
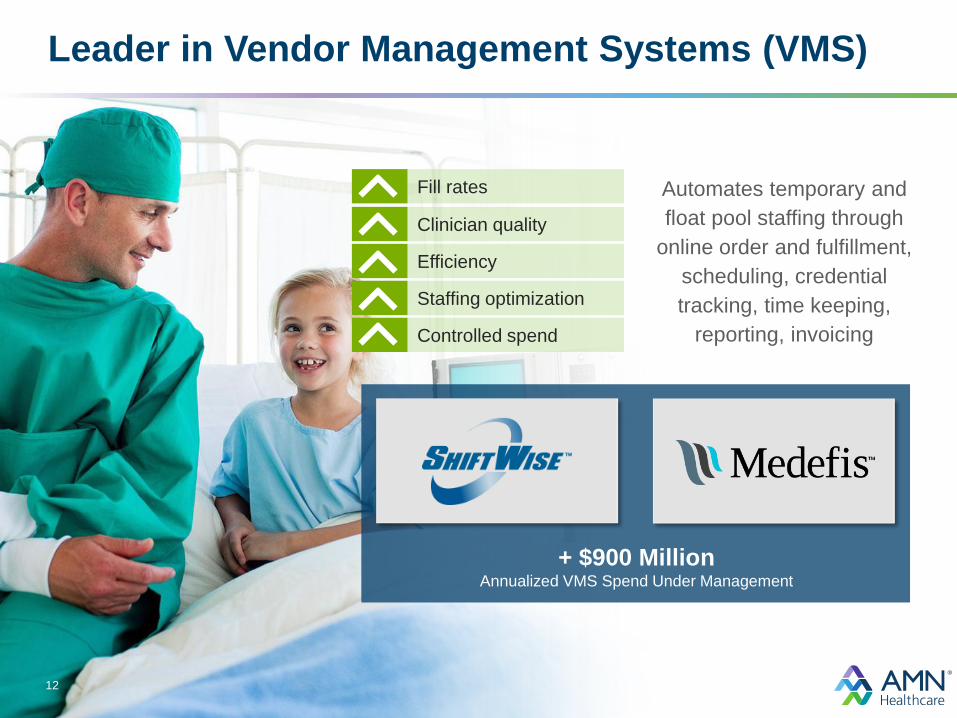
Leader in Vendor Management Systems (VMS)
Automates temporary and
float pool staffing through
online order and fulfillment,
scheduling, credential
tracking, time keeping,
reporting, invoicing
12
Fill rates
Clinician quality
Efficiency
Staffing optimization
Controlled spend
+ $900 Million Annualized VMS Spend Under Management

Leader in Recruitment Process Outsourcing (RPO)
13
Outsourced partner to manage all
recruitment, hiring, and on-boarding
processes for clinician permanent positions
Recruitment savings & productivity
Variable cost, flexible delivery model
State-of-the-art sourcing
Better decision making through data
& insights
Fewer bad hires & lost candidates
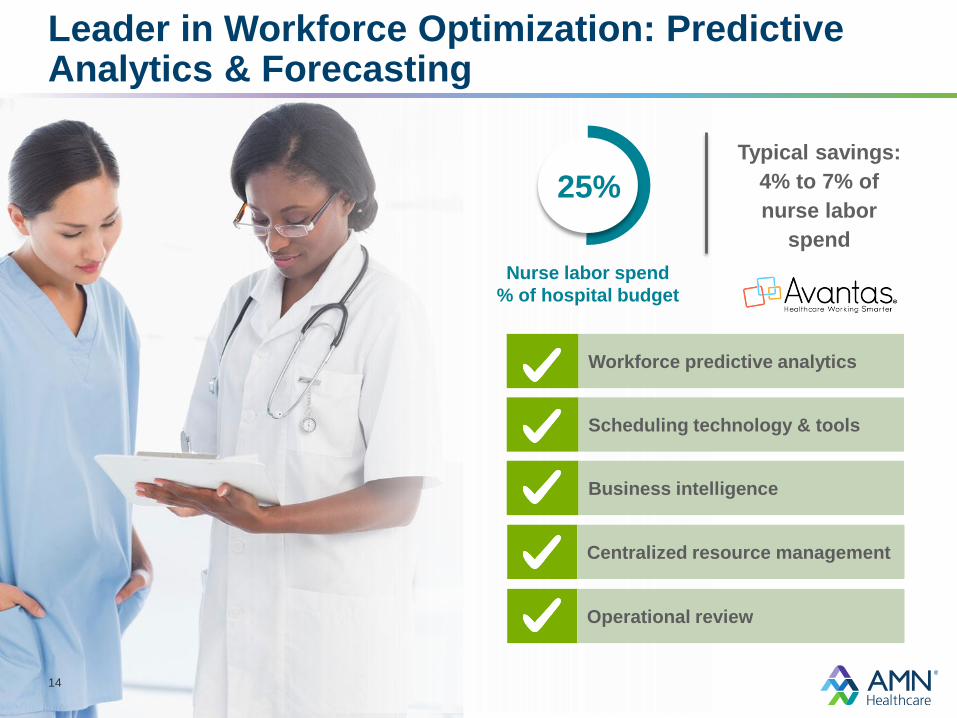
Leader in Workforce Optimization: Predictive Analytics & Forecasting
Typical savings:
4% to 7% of
nurse labor
spend
Nurse labor spend
% of hospital budget
14
25%
Workforce predictive analytics
Centralized resource management
Scheduling technology & tools
Operational review
Business intelligence

Diverse Client Base
15
“AMN knows the national landscape. They know what’s out
there and what the trends are. They bring that valuable
information to us so that we can better plan as partners.”
- Chief Nursing Officer,
Large Integrated Health System & AMN MSP Client

Market Overview
Source: US Healthcare Staffing Growth Assessment, Staffing Industry Analysts, October 28, 2015. Internal estimates
U.S. Temporary Healthcare Staffing
2016P
$14billion
16
~$2billion
Other Addressable Markets: (Perm Placement, RPO,
Workforce Consulting, VMS)
Demand Drivers
• Stable or improving economy
• Low unemployment
• Increased healthcare utilization
• Shortage of clinician & physicians
• Adoption of outsourced solutions
• Aging population & medical advances
• New emerging clinical roles

5 Million More
Healthcare Jobs
Fast Growing
Healthcare Jobs
Growth in Healthcare Employment
Source: Bureau of Labor Statistics, December 2013; BLS Occupational Outlook Handbook January 2014; Job growth is projected from 2012 to 2022.
Nurse
Practitioners
Registered
Nurses
Physician
Assistants
Physical
TherapistsPhysicians
2012: 17 million
2022: 22 million
38% 36% 34% 18%19%
17
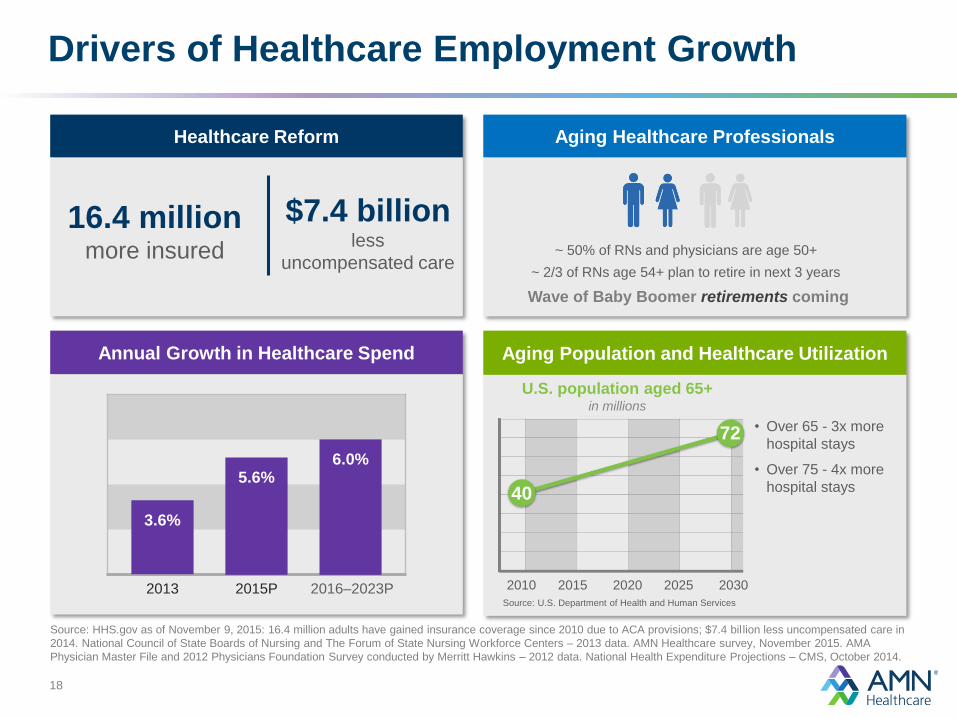
Healthcare Reform
$7.4 billion less
uncompensated care
16.4 millionmore insured
Aging Healthcare Professionals
Wave of Baby Boomer retirements coming
~ 50% of RNs and physicians are age 50+
Annual Growth in Healthcare Spend Aging Population and Healthcare Utilization
Drivers of Healthcare Employment Growth
Source: HHS.gov as of November 9, 2015: 16.4 million adults have gained insurance coverage since 2010 due to ACA provisions; $7.4 bil lion less uncompensated care in
2014. National Council of State Boards of Nursing and The Forum of State Nursing Workforce Centers – 2013 data. AMN Healthcare survey, November 2015. AMA
Physician Master File and 2012 Physicians Foundation Survey conducted by Merritt Hawkins – 2012 data. National Health Expenditure Projections – CMS, October 2014.
• Over 65 - 3x more
hospital stays
• Over 75 - 4x more
hospital stays
2016–2023P
3.6%
5.6%6.0%
2013 2010 2015 2020 2025 2030
Source: U.S. Department of Health and Human Services
2015P
6.0%5.6%
3.6%
40
72
U.S. population aged 65+in millions
18
~ 2/3 of RNs age 54+ plan to retire in next 3 years
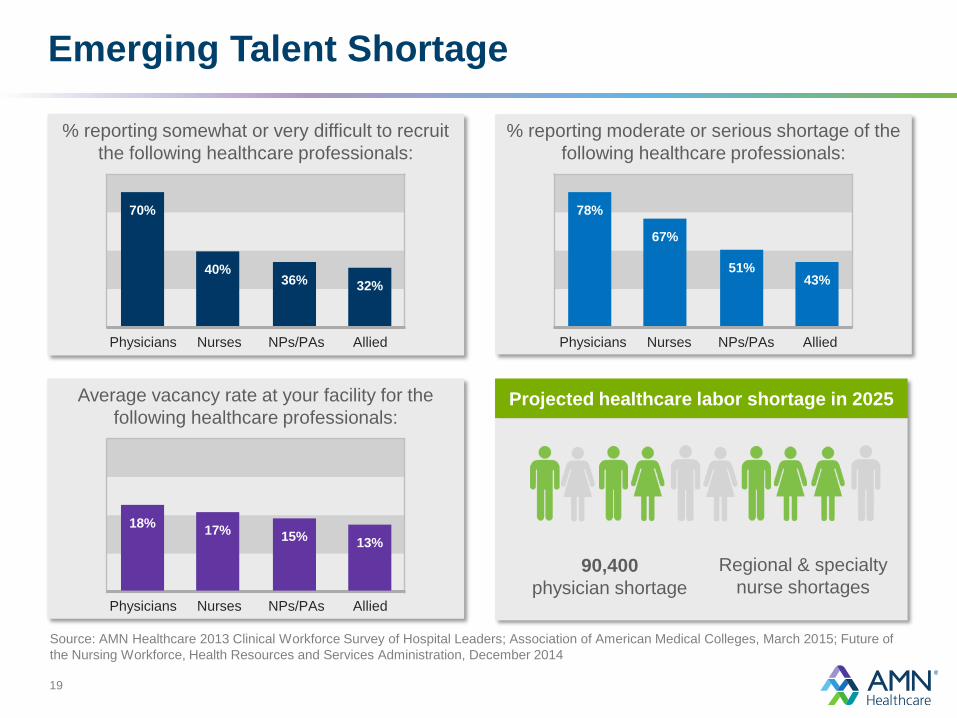
% reporting moderate or serious shortage of the
following healthcare professionals:
Projected healthcare labor shortage in 2025
% reporting somewhat or very difficult to recruit
the following healthcare professionals:
Average vacancy rate at your facility for the
following healthcare professionals:
Emerging Talent Shortage
Source: AMN Healthcare 2013 Clinical Workforce Survey of Hospital Leaders; Association of American Medical Colleges, March 2015; Future of
the Nursing Workforce, Health Resources and Services Administration, December 2014
Physicians Nurses AlliedNPs/PAs Physicians Nurses AlliedNPs/PAs
Physicians Nurses AlliedNPs/PAs
90,400
physician shortage
18%17% 15%
13%
78%
67%
51%43%
70%
40%36% 32%
Regional & specialty
nurse shortages
19

Retirement Upsurge?
20
Question: “Are you planning to retire in:”
(For nurses planning to retire: In how many years?)
Answer: “Three years or less”
All nurses
d38%
Nurses
over 54
62%
Source: AMN Healthcare 2015 Registered Nurses Survey - ~9,000 responses
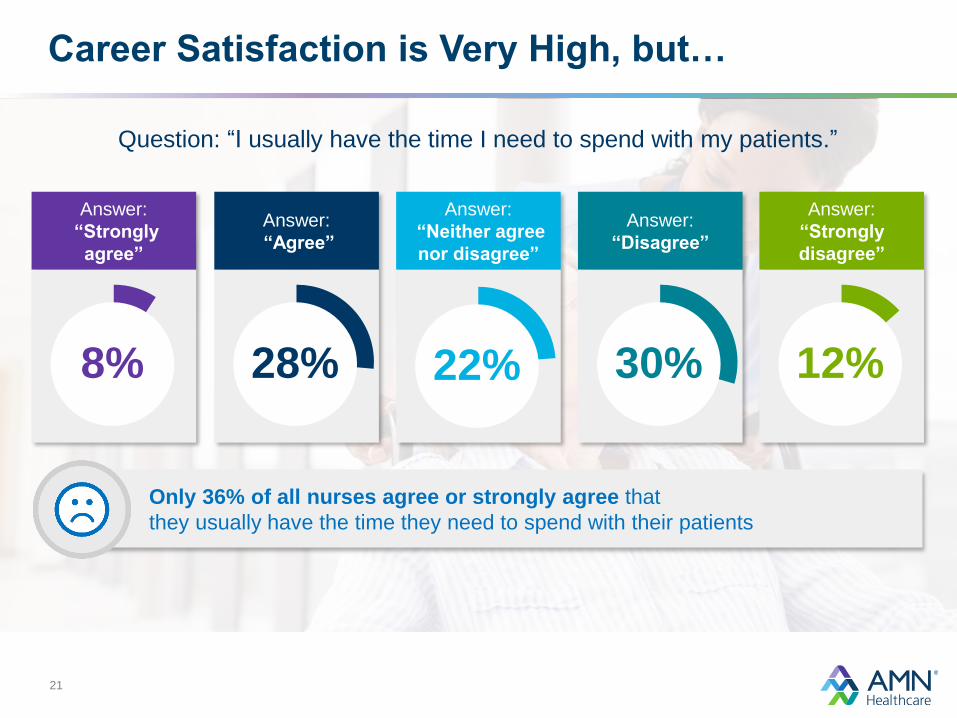
Career Satisfaction is Very High, but…
21
Question: “I usually have the time I need to spend with my patients.”
Answer:
“Strongly
agree”
Answer:
“Agree”
Answer:
“Neither agree
nor disagree”
Answer:
“Disagree”
Answer:
“Strongly
disagree”
12%30%8% 28%
Only 36% of all nurses agree or strongly agree that
they usually have the time they need to spend with their patients
22%

Long-term Adjusted EBITDA Margin Target
Note: The information set forth herein are based on our current belief of how we may be able to achieve our long term goal. Please refer to page 2 of
this presentation titled “Forward Looking Statements”.
22
2015Operating
Leverage
SG&A
Efficiency
WFS
Growth
Gross Margin
ImprovementBy 20202011
11.3%AEBITDA
Margin
14%AEBITDA
Margin
30-70 bps40-80 bps
40-100 bps
60-120 bps
7.2%AEBITDA
Margin
$1.5 B
Revenue
$2.2-2.5B
Revenue
$0.9 B
Revenue

23
Financial Highlights
$ in millions, except per share amounts
Source: Earnings release. Please also refer to Financial Reconciliation of non-GAAP metrics at
http://amnhealthcare.investorroom.com/financialreports.
Financial Metric Q4 2015Variance to
Q4 2014
Variance to
Q3 2015
Revenue 402.6$ 44% 5%
Gross margin 32.7% 240 bps -20 bps
Selling, general and administrative 90.2$ 46% 8%
Adj. EBITDA 46.9$ 85% 3%
Adj. EBITDA margin 11.6% 260 bps -30 bps
Diluted EPS 0.41$ 105% -41%
Adj. Diluted EPS 0.47$ 104% -2%

Cash Flow Metrics Q4 2015
Operating cash flow $1
Capex $6
Balance Sheet Items 12/31/2015
Cash and cash equivalents $10
Accounts receivable, net $278
Working capital $125
Total assets $880
Total debt outstanding $219
Stockholders’ equity $348
Balance Sheet Metrics 12/31/2015
Day sales outstanding 64
Working capital ratio 1.5
Leverage ratio 1.4
Financial Highlights
Source: Earnings release, earnings call
$ in millions
24
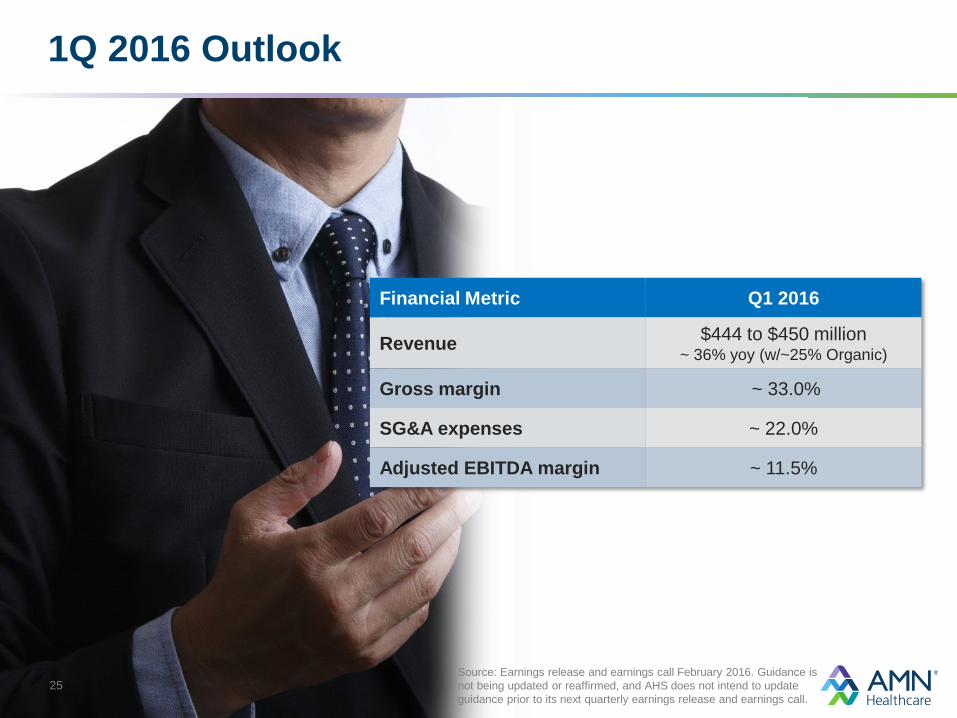
1Q 2016 Outlook
25Source: Earnings release and earnings call February 2016. Guidance is
not being updated or reaffirmed, and AHS does not intend to update
guidance prior to its next quarterly earnings release and earnings call.
Financial Metric Q1 2016
Revenue$444 to $450 million
~ 36% yoy (w/~25% Organic)
Gross margin ~ 33.0%
SG&A expenses ~ 22.0%
Adjusted EBITDA margin ~ 11.5%

The Innovator in Healthcare Workforce Solutions and Staffing Services
Thank You