amity management analyst
TRANSCRIPT

Amity Management Analyst
Copyright © 2019 All Rights Reserved
Amity Business School holds the copyright to all articles contributed to its publications.
All rights reserved; no part of this publication may be reproduced, storedin a retrieval system, transmitted in any form, or by any means,
electronic, mechanical, photocopying, recording, or otherwise,without the prior permission of
Amity Business School, Gurugram (Manesar)
The views expressed in the articles are the personal views of the individualauthors and do not represent those of the
Amity Business School, Gurugram (Manesar)
Publisher, Printer and Editor Prof (Dr) R C Sharma on behalf of Amity Business School, Amity Education Valley, Panchgaon, Manesar (Gurgaon). Printed at Rakmo Press Pvt Ltd, C-59, Okhla Industrial Area, Phase – I, New Delhi-110 020 and published from Amity Education Valley Panchgaon, Manesar (Gurugram)

Amity Management Analyst
Vol. IX No. I Jan-June, 2019
(Bi-annual Refereed Journal of the Amity Business School, Amity University Gurugram)
Editor-in-ChiefProf (Dr) R C Sharma
Amity Business School, Gurugram (Manesar)
Executive EditorProf (Dr) Padmakali Banerjee
Amity Business School, Gurugram (Manesar)
Managing EditorProf (Dr) Vikas Madhukar
Amity Business School, Gurugram (Manesar)
Associate EditorProf (Dr) Deependra Sharma
Amity Business School, Gurugram (Manesar)
Editorial SupportDr Saba Jafri
Assistant Professor, ABSDr Ranjana Kothari
Associate Professor, ABS
Editorial Board
Dr Roopak Vasishtha CEO and Director General of Apparel Made-ups & Home Furnishing Sector Sill Council, Delhi
Dr Piyush K Sinha Former-Professor, IIM-Ahmedabad
Director, CRI Advisory and Research, Ahmedabad, India
Dr Santosh Rangnekar Professor, Department of Management Studies, Indian Institute of Technology-Roorkee, India
Dr M K Jain Professor, Department of Business Administration, Kenyatta University, Nairobi, Kenya
Dr Jitendra Bhargava Former-Director, Motilal Nehru Institute of Research and Business Administration, University Of Allahabad, India

From the Desk of Editor-in-Chief
Dreaming big is good but converting dreams into reality needs a lot of prudence, sincere endeavors, effective management of resources, overcoming obstacles and keeping patience. An example of ensuring that their dreams come true is that of China and Korea - the only two countries in the world who could double their per capita income in just five years. Despite a deceleration in economic growth for two consecutive years i.e. from 8.2% in 2016-17 to 7.2% in 2017-18 and 6.8% in 2018-19, coupled with rising unemployment at a time when global economy is already mired in which is perhaps a nascent trade war, Modi government is likely to see Indian economy to be in the top most economies across the globe in its second term of rule. In order to realize this dream, the country needs a growth model built around investment and export, creating an environment that is conducive to attract both private and foreign investment. Domestic savings too are also vital for achieving a high rate of growth. Political stability, efficient judiciary and favorable demographic phase are some other vital pre-requisites. Post general elections, ruling party with a comfortable majority, the political stability can be well assumed. So far as efficient judiciary is concerned, the same is already there. Some of the rulings and judgments delivered in the recent past speak for the fact. The country has already entered a reasonably high share of working age population and is likely to have this privilege during the next two to three decades. It is basically the problem of attracting investments that needs to be addressed appropriately. Reviving investment cycle is therefore, a must for achieving a high rate of economic growth. The government should therefore, ensure availability of easy and cheap credit, lower corporate tax, labor reforms, rationalization of duties and tax structures, regular availability of power and energy at lower rates, protective and promotion of startups and looking into and solving their problems, skill promotion, and the like.
So far as public investment for reviving investment cycle is concerned, though it is easier but certain limitations are there. It is therefore, very important to draw foreign investment to Indian large markets, which needs policies and rules conducive to tempt foreign investment.
Another important step to be taken into this direction is encouraging domestic savings which have been consistently showing a decreasing trend in the last few years. For investment to be financed, domestic savings must rise in tandem because it is savings that lead to capital formation, increasing of production, generation of employment, and rise in income resulting into greater demand of goods and services and subsequent increase in prices and additional profits to entrepreneurs as a result of which further investment keeps on taking place. The cycle goes on in this fashion. The multiplier effect of Keynesian theory comes into motion. The government should therefore, formulate such policies as may encourage spurt into propensity to save.
Coming to exports which, in addition to savings, are the other driver of demand, should grow in double digits. Since supply chains are moving out of China in anticipation of a protracted trade war and are looking for alternative destinations, India should take advantage of it.
It is expected that the government will take the economy to greater heights and take the aforesaid steps to realize its dreams.
Prof (Dr) R C Sharma
Editor-in-ChiefAmity Management Analyst
Contents
Exclusive Interview
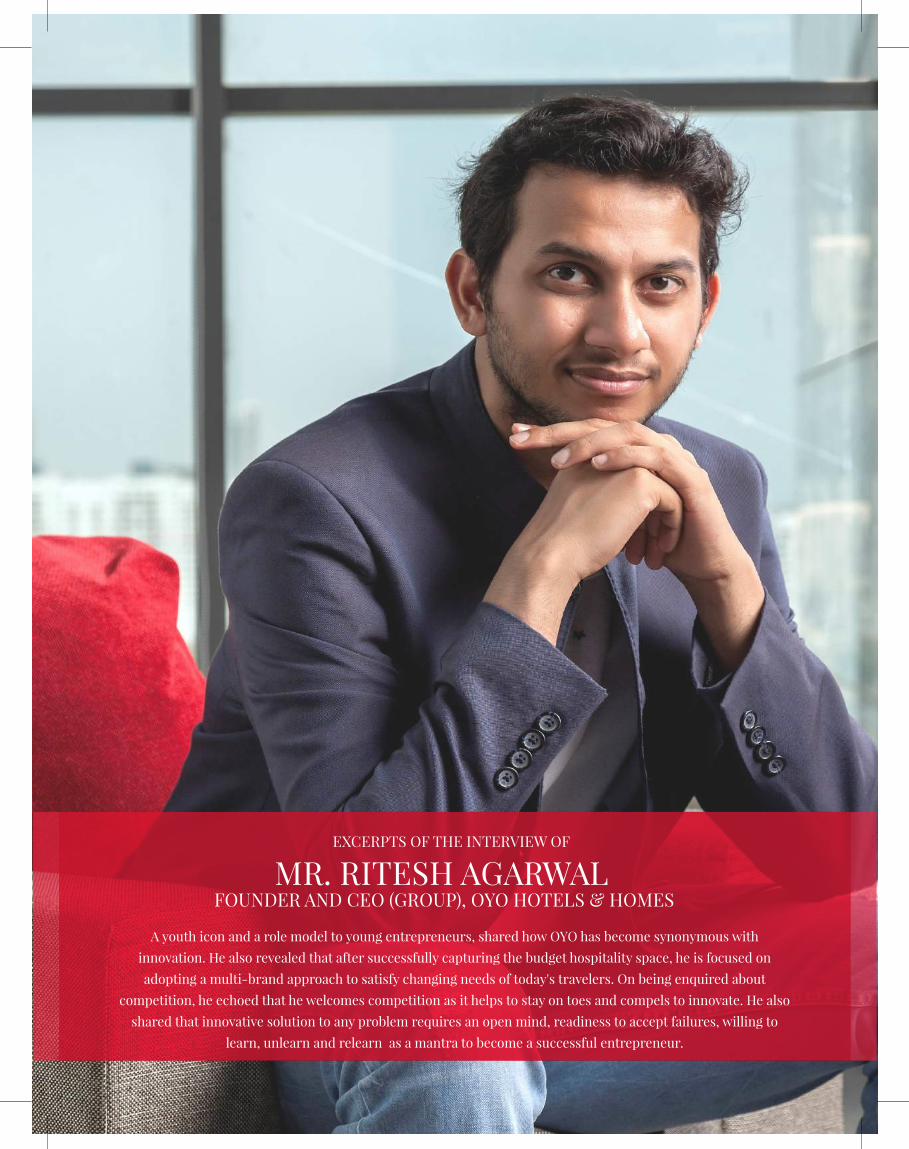
05 Excerpts of the Inverview of Mr. Ritesh Agarwal Founder and CEO (GROUP), OYO Hotels & Homes
Research Papers
10 AStudyonDemographic InfluenceonE-BankingUsageAmongSemiUrbanConsumers inGwalior Chambal Region
Pankaj Mishra, Asstant Professor, Amity Business School, Amity University, Gwalior, Madhya Pradesh Anil Vashisht, Director, Amity Business School, Amity University, Gwalior, Madhya Pradesh
16 Measuring Patients’ Satisfaction towards Inpatient Departments (IPDs) of Government Hospitals: A Study of NCR
Jitender Kumar, Assistant Professor, Department of Management Studies, Deenbandhu Chhotu Ram University of Science & Technology, Murthal, Haryana
Neha, Assistant Professor, Department of Commerce, Government College for Women, Gohana, Haryana Jigyasa, Junior Quality Executive, the Department of Quality and Safety, Hero DMC Heart Institute,
New Delhi
25 Selection of Online Coaching Instiute: A Study Among IAS Aspirants in Ludhiana and Chandigarh
Rajpreet Singh Chhatwal, Professor cum Head, Faculty of International Business, Punjab College of Technical Education, Ludhiana, Punjab
30 What Drives Consumers’ to Pay High Premium Price for Luxury Brand While Rejecting High-Quality Non Luxury Brands
Etinder Pal Singh, Professor, Appejay School of Management Dwarka, New Delhi Jyoti Doval, Co-Founder, Planet Excellence, Dwarka, New Delhi
Case Study45 Dangee Dums Anupam Shukla, Professor, Institute of Computer Science & Technology, Varanasi, Uttar Pradesh Arunkumar Dubey, Assistant Professor, S K Somaiya College of Arts, Science and Commerce, Mumbai,
Maharastra Bhabani Shankar Gupta, Faculty of BOI - RSETI, Dhanbad, Bihar Bhavesh Prakash Joshi, Associate Professor, Manav Rachna International Institute Of Research And
Studies, Faridabad, Haryana
Books Review49 Electionomics Vivek Narayan Sharma, Advocate-on-Record, Supreme Court of India & Ex- Standing Counsel for
State of UK, New Delhi


10 Amity Management Analyst Jan - June, 2019
© Amity Management Analyst2019 Vol IX, No I
A Study on Demographic Influence on E-Banking Usage Among Semi Urban Consumers in Gwalior Chambal
Region
*Pankaj Mishra **Anil Vashisht
*Asstant Professor, Amity Business School, Amity University, Gwalior, email:[email protected] **Director, Amity Business School, Amity University, Gwalior.
Introduction:
In the past decade, the banking sector in India has embraced exceptional advancements in ICT (Information and Communication Technology) based services. Be it a public sector or a private sector bank, majority of these banks have made an overhaul with the help of computers and information technology. With increasing focus of government on efficiency and transparency of financial sector, the banks have specially been put through the transformation process by adopting latest means of information and communication technologies. Different banking services like account opening, customer account mandate, transaction processing have been revolutionized by the application of ICT based services.
This revolution has changed the way customers used to do banking in the past. Spending hours in a bank queue to withdraw money, pay a cheque, make a demand draft, or requesting an employee to transfer funds to other account at the earliest have now become outdated.
The ICT application in banking has now provided consumers with user friendly and comfortable
methods of conducting banking transactions and activities from their own home or anywhere. Consumers may now avail the facilities to execute all types of financial transactions from anywhere that were traditionally confined within a bank branch. Also, all this is possible to do at any moment of time throughout the working hours and beyond.
However, these changes have not been fully realized by majority of Indian population, as yet. People residing in semi urban areas form a majority proportion of country’s population and many of such people have been out of the main stream banking system. In order to bring such a huge population into the mainstream banking system, the Government of India recently embarked upon an ambitious project, called Pradhan Mantri Jan Dhan Yojna (PMJDY) with the aim of providing basic banking facilities to the unbanked population. The project made use of ICT based e-banking services to extend the outreach of banking services to the people residing in far flung semi urban areas. Thus, the usage of these e-banking services by the local populace is worth to be researched and investigated in order to identify factors which influence its usage among people.
An increased usage of ICT (Information and Communication Technology) based services is having a significant impact on banking practices adopted among common people. While such a phenomenon is exhibiting at global level, the adoption and usage of electronic banking in developing economies like India seems to be far behind than that of the developed economies. Especially, in the far flung semi urban areas, the e-banking services, despite its availability, are quite under usage by bank customers. Though technology based modern age banking services have been able to make an impact on the usage behaviour of metro and urban customers, its adoption by semi- urban population is still a matter of curiosity and interest among the researchers. This research paper is an endeavor to investigate the demographic factors that may have an influence on usage of e-banking services among semi urban consumers of Gwalior Chambal region in the state of Madhya Pradesh.

Jan - June, 2019 11
Objective of the Study:
This research paper attempts to investigate the influence of various demographic factors, like Gender, Age Group, Education, Occupation and Experience of e-banking usage on actual use of e-banking services among semi urban people in Gwalior Chambal region of state of Madhya Pradesh.
Literature Review:
Paul (2013) worked on determining the impact of emerging technologies, like electronic banking services on customer satisfaction and retention in the state of Orissa. He examined the factors that made an impact on customers’ satisfaction with regards to the use of new digital technology in improving the overall service quality. The researcher also investigated the reasons or barriers in the way of successful implementation of electronic banking services in the state of Orissa.
Vijaykumar & Jaychitra, (2013) in their study stressed upon various issues and challenges in the way of customization of mobile banking services in India with all the concerned stake holders. They suggested to replicate the incidents of NGOs making less educated people mobile savvy in some states to other parts of the country.
Nayak, Nath & Goel (2014) stressed upon the need of banks and mobile service providers coming together in order to fulfil rising expectations of the consumers and help bring the revolution in the domain of mobile banking. They were also of the view that those customers who are currently using mobile banking services are highly satisfied.
Chauhan and Choudhary (2015) observed that the emergence of electronic banking has modified the way in which banks used to operate earlier. They concluded that the implementation of internet banking services has helped in transformation of banking system into their modern version. As per the researcher, although the electronic banking
is quite new to the Indian banking customers in comparison with the developed countries, it has to offers numerous benefits to them, given the issues and challenges coming in the way are addressed and dealt with properly by the government and other stake holders.
Dhananjay (2015) worked upon the usage and progress of electronic payment systems in India. He observed that the Reserve Bank of India(RBI), an apex body of banking in India has set an objective of emphatically promoting the use of electronic payments in country, which will reduce the age old cash based transaction practices. His work concluded that there has been significant difference in the use of different modes of electronic payment systems prior and after the establishment of formal facilitating and controlling body on electronic payment systems in India.
Kaur, Pathak and Kaur, (2015) studied the beneficial features of online banking and suggested that the prospects of electronic banking are high and bright in the developing countries, given the proper redressal of issues like telecommunication infrastructure, power supplies and high cost of internet access.
Clonia and Asht, (2016) suggested that in the current modern environment the demand for financial products/services is increasing rapidly and in order to meet the ever increasing demand, the financial institutions, especially banking organizations, need to look at alternative channels of services delivery and electronic banking channels are best suited for it. The electronic banking channels are also needed to retain the existing banking customers as well as to attract the new ones as against the competitors. The transcending process from traditional banking to the new age electronic banking is phenomenal and will provide elevating experience to the customers during banking transactions. Their research work also analyzed the growth taken place in adoption and use of electronic banking services in India and concluded that a lot more work is needed to be done
*Pankaj Mishra **Anil Vashisht

12 Amity Management Analyst Jan - June, 2019
in order to make the electronic banking transactions safer, more secure and faster for providing a valuable experience to the customers.
Sethuraman et al., (2016) while working in similar area, concluded that awareness among semi urban people towards electronic banking channels do not readily translate into usage of those channels and there exists a significant gap between awareness and actual usage of those channels.
Research Methodology:
The current research work is based on Descriptive research methodology. The respondents are chosen from semi urban areas of Gwalior Chambal region with the help of Multi stage sampling and Simple
random sampling technique. The total sample size taken is 500. The data analysis is performed with the help of independent sample t-test and Analysis of Variance (ANOVA).
Results and Discussion:Analysis of Gender towards usage of e-banking services:
Table 1: Group Statistics
gender N Mean Std. Deviation
Std. Error Mean
actual use
male 347 4.17 1.623 .087
female 153 3.71 1.546 .125
Table 2: Independent Samples Test
Levene’s Test for Equality of
Variances
t-test for Equality of Means
F Sig. t df Sig. (2-tailed)
Mean Difference
Std. Error Difference
95% Confidence Interval of the
Difference
Lower Upper
actual use
Equal variances assumed
.415 .520 2.948 498 .003 .458 .155 .153 .763
Equal variances not assumed
3.004 303.987 .003 .458 .152 .158 .757
Analysis through t-test shows:
Mean value for Male respondents: 4.17
Mean value for Female respondents: 3.71
T-test significance value is 0.003 (Equal variances assumed with Levene’s value: 0.520)
The result shows that actual usage of electronic banking services is much more frequent among male consumers as compared to the female consumers. It means that the female consumers are not as frequent in using the electronic banking services as are the male consumers.
Jan - June, 2019 13
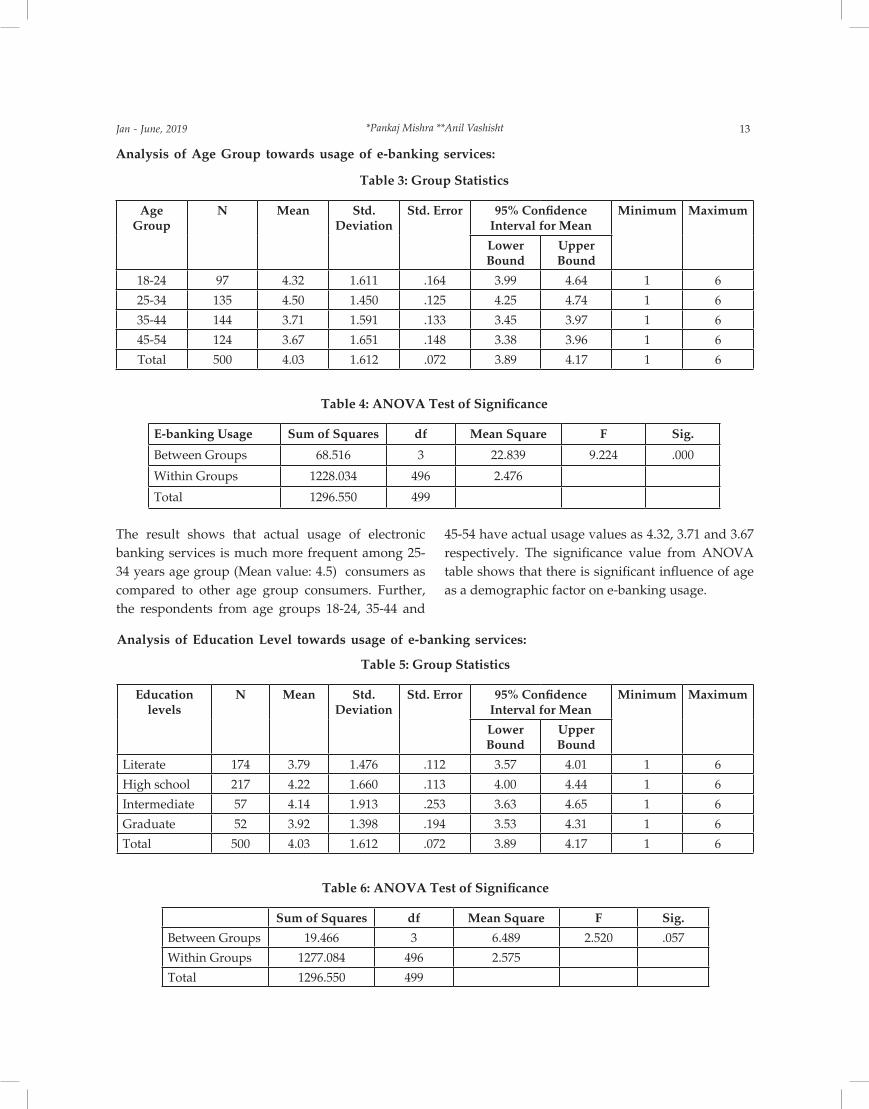
Analysis of Age Group towards usage of e-banking services:
Table 3: Group Statistics
Age Group
N Mean Std. Deviation
Std. Error 95% Confidence Interval for Mean
Minimum Maximum
Lower Bound
Upper Bound
18-24 97 4.32 1.611 .164 3.99 4.64 1 6
25-34 135 4.50 1.450 .125 4.25 4.74 1 6
35-44 144 3.71 1.591 .133 3.45 3.97 1 6
45-54 124 3.67 1.651 .148 3.38 3.96 1 6
Total 500 4.03 1.612 .072 3.89 4.17 1 6
Table 4: ANOVA Test of Significance
E-banking Usage Sum of Squares df Mean Square F Sig.
Between Groups 68.516 3 22.839 9.224 .000
Within Groups 1228.034 496 2.476
Total 1296.550 499
The result shows that actual usage of electronic banking services is much more frequent among 25-34 years age group (Mean value: 4.5) consumers as compared to other age group consumers. Further, the respondents from age groups 18-24, 35-44 and
45-54 have actual usage values as 4.32, 3.71 and 3.67 respectively. The significance value from ANOVA table shows that there is significant influence of age as a demographic factor on e-banking usage.
Analysis of Education Level towards usage of e-banking services:
Table 5: Group Statistics
Education levels
N Mean Std. Deviation
Std. Error 95% Confidence Interval for Mean
Minimum Maximum
Lower Bound
Upper Bound
Literate 174 3.79 1.476 .112 3.57 4.01 1 6
High school 217 4.22 1.660 .113 4.00 4.44 1 6
Intermediate 57 4.14 1.913 .253 3.63 4.65 1 6
Graduate 52 3.92 1.398 .194 3.53 4.31 1 6
Total 500 4.03 1.612 .072 3.89 4.17 1 6
Table 6: ANOVA Test of Significance
Sum of Squares df Mean Square F Sig.
Between Groups 19.466 3 6.489 2.520 .057
Within Groups 1277.084 496 2.575
Total 1296.550 499
*Pankaj Mishra **Anil Vashisht
14 Amity Management Analyst Jan - June, 2019
The ANOVA result shows that usage of electronic banking services is equally availed among consumers from all across education level groups.
It means that the consumers are equally frequent in using the electronic banking services irrespective of their educational background.
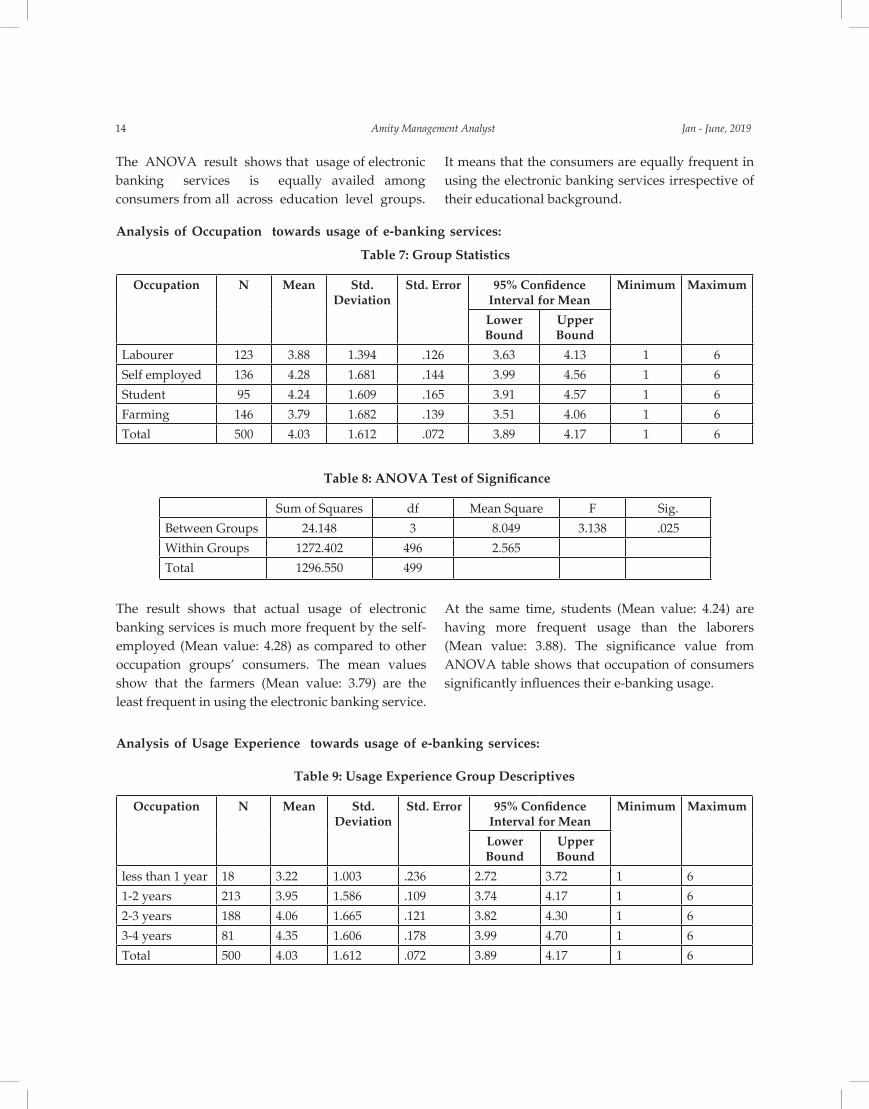
Analysis of Occupation towards usage of e-banking services:
Table 7: Group Statistics
Occupation N Mean Std. Deviation
Std. Error 95% Confidence Interval for Mean
Minimum Maximum
Lower Bound
Upper Bound
Labourer 123 3.88 1.394 .126 3.63 4.13 1 6
Self employed 136 4.28 1.681 .144 3.99 4.56 1 6
Student 95 4.24 1.609 .165 3.91 4.57 1 6
Farming 146 3.79 1.682 .139 3.51 4.06 1 6
Total 500 4.03 1.612 .072 3.89 4.17 1 6
Table 8: ANOVA Test of Significance
Sum of Squares df Mean Square F Sig.
Between Groups 24.148 3 8.049 3.138 .025
Within Groups 1272.402 496 2.565
Total 1296.550 499
The result shows that actual usage of electronic banking services is much more frequent by the self- employed (Mean value: 4.28) as compared to other occupation groups’ consumers. The mean values show that the farmers (Mean value: 3.79) are the least frequent in using the electronic banking service.
At the same time, students (Mean value: 4.24) are having more frequent usage than the laborers (Mean value: 3.88). The significance value from ANOVA table shows that occupation of consumers significantly influences their e-banking usage.
Analysis of Usage Experience towards usage of e-banking services:
Table 9: Usage Experience Group Descriptives
Occupation N Mean Std. Deviation
Std. Error 95% Confidence Interval for Mean
Minimum Maximum
Lower Bound
Upper Bound
less than 1 year 18 3.22 1.003 .236 2.72 3.72 1 6
1-2 years 213 3.95 1.586 .109 3.74 4.17 1 6
2-3 years 188 4.06 1.665 .121 3.82 4.30 1 6
3-4 years 81 4.35 1.606 .178 3.99 4.70 1 6
Total 500 4.03 1.612 .072 3.89 4.17 1 6
Jan - June, 2019 15
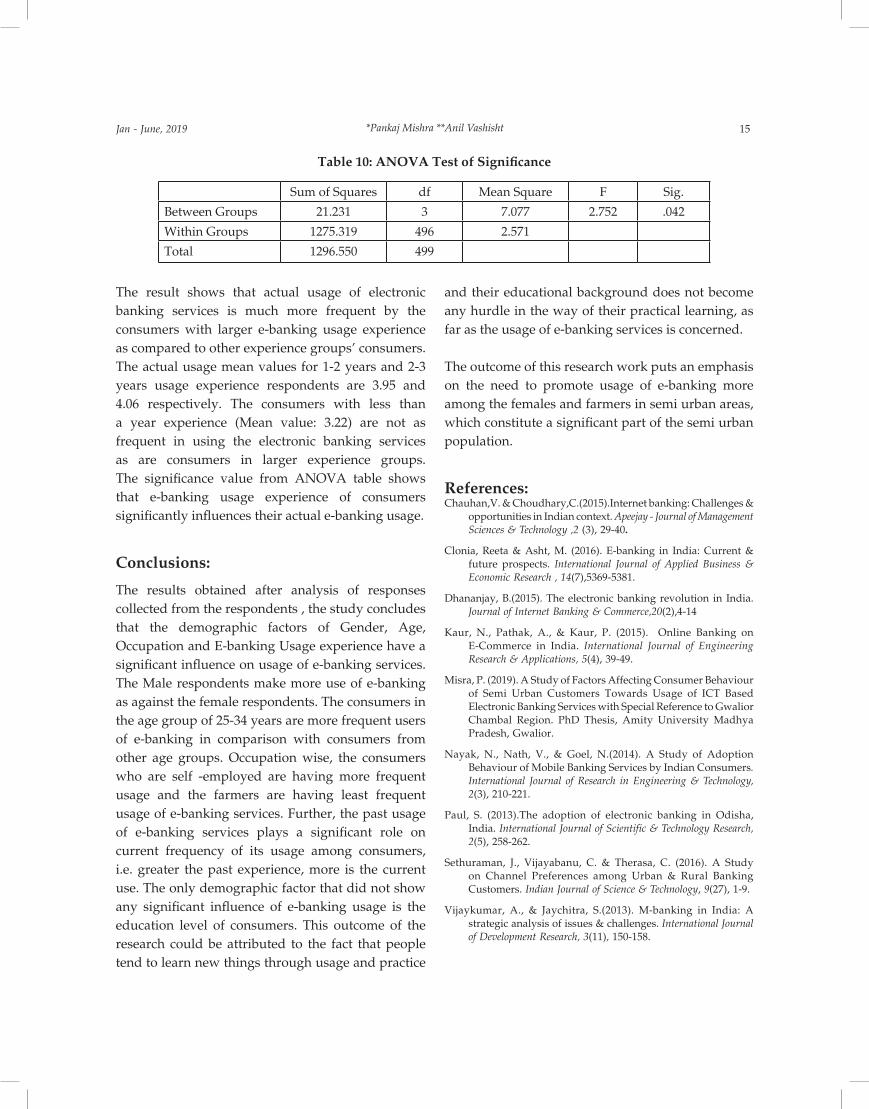
The result shows that actual usage of electronic banking services is much more frequent by the consumers with larger e-banking usage experience as compared to other experience groups’ consumers. The actual usage mean values for 1-2 years and 2-3 years usage experience respondents are 3.95 and 4.06 respectively. The consumers with less than a year experience (Mean value: 3.22) are not as frequent in using the electronic banking services as are consumers in larger experience groups. The significance value from ANOVA table shows that e-banking usage experience of consumers significantly influences their actual e-banking usage.
Conclusions:
The results obtained after analysis of responses collected from the respondents , the study concludes that the demographic factors of Gender, Age, Occupation and E-banking Usage experience have a significant influence on usage of e-banking services. The Male respondents make more use of e-banking as against the female respondents. The consumers in the age group of 25-34 years are more frequent users of e-banking in comparison with consumers from other age groups. Occupation wise, the consumers who are self -employed are having more frequent usage and the farmers are having least frequent usage of e-banking services. Further, the past usage of e-banking services plays a significant role on current frequency of its usage among consumers, i.e. greater the past experience, more is the current use. The only demographic factor that did not show any significant influence of e-banking usage is the education level of consumers. This outcome of the research could be attributed to the fact that people tend to learn new things through usage and practice
and their educational background does not become any hurdle in the way of their practical learning, as far as the usage of e-banking services is concerned.
The outcome of this research work puts an emphasis on the need to promote usage of e-banking more among the females and farmers in semi urban areas, which constitute a significant part of the semi urban population.
References:Chauhan,V. & Choudhary,C.(2015).Internet banking: Challenges &
opportunities in Indian context. Apeejay - Journal of Management Sciences & Technology ,2 (3), 29-40.
Clonia, Reeta & Asht, M. (2016). E-banking in India: Current & future prospects. International Journal of Applied Business & Economic Research , 14(7),5369-5381.
Dhananjay, B.(2015). The electronic banking revolution in India. Journal of Internet Banking & Commerce,20(2),4-14
Kaur, N., Pathak, A., & Kaur, P. (2015). Online Banking on E-Commerce in India. International Journal of Engineering Research & Applications, 5(4), 39-49.
Misra, P. (2019). A Study of Factors Affecting Consumer Behaviour of Semi Urban Customers Towards Usage of ICT Based Electronic Banking Services with Special Reference to Gwalior Chambal Region. PhD Thesis, Amity University Madhya Pradesh, Gwalior.
Nayak, N., Nath, V., & Goel, N.(2014). A Study of Adoption Behaviour of Mobile Banking Services by Indian Consumers. International Journal of Research in Engineering & Technology, 2(3), 210-221.
Paul, S. (2013).The adoption of electronic banking in Odisha, India. International Journal of Scientific & Technology Research, 2(5), 258-262.
Sethuraman, J., Vijayabanu, C. & Therasa, C. (2016). A Study on Channel Preferences among Urban & Rural Banking Customers. Indian Journal of Science & Technology, 9(27), 1-9.
Vijaykumar, A., & Jaychitra, S.(2013). M-banking in India: A strategic analysis of issues & challenges. International Journal of Development Research, 3(11), 150-158.
Table 10: ANOVA Test of Significance
Sum of Squares df Mean Square F Sig.
Between Groups 21.231 3 7.077 2.752 .042
Within Groups 1275.319 496 2.571
Total 1296.550 499
*Pankaj Mishra **Anil Vashisht

16 Amity Management Analyst Jan - June, 2019
© Amity Management Analyst2019 Vol IX, No I
Measuring Patients’ Satisfaction towards Inpatient Departments (IPDs) of Government Hospitals: A Study
of NCR
*Jitender Kumar **Neha ***Jigyasa
*Assistant Professorr, Department of Management Studies, Deenbandhu Chhotu Ram University of Science & Technology, Murthal, email:[email protected]
**Assistant Professor, Department of Commerce, Government College for Women, Gohana. ***Junior Quality Executive, Department of Quality and Safety, Hero DMC Heart Institute, New Delhi.
Introduction:India ranks second in the world in terms of population. As the population increases, the need of medical services also increases. Rising income levels, increasing age and escalating literacy level have also resulted in increased per capita health expenditure (IBEF, 2018). Healthcare industry is growing at a fast pace and private sector is a major player. More than 75% medical needs of nation are catered by private sector (IBEF, 2018).
There is a large chunk of population which depends on government hospitals for its healthcare needs. The basic objective of government hospitals is to provide quality services to the citizen at affordable prices. However, like many other government hospitals around the world, quality of Indian government hospitals is also negatively influenced by growing population, political interruption, shortage of funds, etc. But, for the betterment of countrymen, it is essential to timely check the quality of healthcare facilities provided in government
hospitals. Various ways to ensure the quality include skilled doctors, efficient staff, good equipments, medicines etc. Another way to assess the quality is patient satisfaction level as higher level of patient satisfaction indicates towards higher efficiency (Kumar & Neha, 2016). One single measure cannot be a true representative of quality; but if patient satisfaction level is high, the quality of healthcare can be stated as good and vice-versa. In-patient’s satisfaction refers to satisfaction among those patients who stay in hospital overtime or for more time. With this background, this study is designed to assess the level of in-patient’s satisfaction towards government hospitals of NCR of India.
Review of Relevant Literature:
Vandamme and Leunis (1993) reported important findings with reference to the application of SERVQUAL (a multiple item scale for measuring consumer perceptions of service quality) to the healthcare sector. They found that the uniqueness
Quality in healthcare services is the major determinant of patients’ satisfaction in government and private hospitals. In general, it is understood that the quality of treatment, medicines and medical equipments affect the level of patient satisfaction. No doubt, it is true; but apart from these determinants there are many factors which determine the patient’s satisfaction towards In-patient Departments (IPDs). Further, patients who are admitted in hospitals are more comfortable to assess the services provided by those hospitals than the patients who have visited Outpatient Departments (OPDs). The paper aims at measuring the determinants of patient satisfaction towards Inpatient Departments (IPDs) of government hospitals of National Capital Region (NCR) of India. The statistical tools and techniques used are frequency analysis, factor analysis and multiple regression. The results of factor analysis reported that clinical care, personal attention, physical structure and technical capabilities are the main determinants of patient satisfaction towards government hospitals of NCR. The results of regression analysis reported personal attention to have maximum effect on patient satisfaction and technical capabilities the least.
Jan - June, 2019 17
of services offered by a hospital does not seem to validate the use of scales developed for other service categories.
Aagza & Garg (2010) identified five dimensions of hospital service to be included in a scale called Public Hospital Service Quality (PubHosQual): admission, medical service, overall service, discharge and social responsibility. This scale can be used as a tool to identify areas where special improvement is required.
Manaf (2012), after studying hospital clients of Malaysian hospitals, reported three factors which affected the choice of patients while selecting a hospital which are clinical service, physical service and additional facilities for patients & family members. Authors reported higher level of inpatient satisfaction regarding clinical service than physical service.
Chattopadhyay et al. (2013), after studying CGHS dispensaries in Kolkata, reported most of the patients to be very unsatisfied or moderately unsatisfied. Satisfaction was recorded on the points: general medical services, adequate medical supply; dissatisfaction was recorded on the points: number of doctors, medical facilities, overcrowding, punctuality of outdoor activities, distance of dispensary from home and inadequate facilities like toilet, drinking water and sitting arrangements.
Merkouris et al. (2013) showed that patients were satisfied from nursing care and technical aspect of care. Less satisfaction came from hotel services and information. Authors suggested a regular survey of patient satisfaction to keep a track record of improvement.
Yildiz & Demirors (2013) developed Healthcare Process Quality Measurement Model (HPQMM) for a comprehensive evaluation of healthcare quality. HPQMM was based on four areas: functionality, reliability, usability and efficiency which were measured through eighteen measures. Authors also
applied HPQMM in three hospitals; the results were not only comprehensive but comparable also.
Garg et al. (2014) reported overall high patient satisfaction level. Low satisfaction level was reported regarding cleanliness in toilets and quality of meals served. Highest satisfactory was clinical care but development of soft skills in paramedics and doctors was recommended.
Ghosha (2014) using survey data from inpatient department reported that clinical care, internal environment, administrative support and communication were the four primary factors which affected the satisfaction level of patients.
Ghoshb (2014) explored patient satisfaction level in Dhubri Civil Hospital (Assam) through respondents’ schedule and group discussions. Results reported dissatisfaction regarding entrance assistance, signboards, time devoted by doctors, medicine availability, drinking water facility, toilets, fans & lights and cleanliness. Satisfaction was recorded for the aspects: efficiency of doctors, behavior of nurses, parking, ATM, efficiency of doctors and timely availability of investigation results.
Mahapatra et al., (2014) surveyed patients in 25 district/area hospitals which were managed by Andhra Pradesh Vaidya Vidhana Parishad (APVVP) using a structured questionnaire. Overall a good score of patient satisfaction was recorded. Areas of concern reported by survey include corruption by hospital staff, utilities (water supply, fans, lights etc.), toilet & cleanliness, communication & interpersonal skills, supply of drugs, food availability, linen & cleanliness, staff shortage and diagnostic & general facilities.
Sharma et al. (2014) reported toilet facility and drinking water facility to be the reason of maximum dissatisfaction. High level of satisfaction was reported regarding seating arrangement, cleanliness, convenience in reaching OPD, consultants’ findings, time taken for OPD slip. Moderate level of
*Jitender Kumar **Neha ***Jigyasa

18 Amity Management Analyst Jan - June, 2019
satisfaction was recorded regarding convenience to reach pharmacist, convenience to reach investigation site, signboards, examination by doctors’, doctor’s explanation and time taken in taking medicine.
Mogha et al. (2015) reported that out of thirty six public hospitals, only 10 were overall technically efficient, 18 were pure technical efficient and 8 hospitals were inefficient and could reduce their inputs. Authors reported it by using the data collected from Directorate of Medical Health and Family Welfare, Government of Uttarakhand, Dehradun using Data Envelopment Analysis.
Kumar & Neha (2016) concluded that patients are not satisfied from the OPDs facilities of government hospitals including civil hospitals, community health centres, primary health centres, primary health sub centres etc. of Bhiwani district of Haryana state. In this study six determinants of patient’s dissatisfaction towards OPDs of government hospitals were identified like cleanliness & behaviour, medical care, physical facilities, first impression, ward & room facility and admission procedure.
Naik & Byram (2016) by studying two corporate super specialty hospitals of South India reported that tangibility, responsiveness, assurance and empathy had a significant relationship with patient satisfaction and patient satisfaction; responsiveness, assurance and empathy had a significant relationship with behavioral intention (the intention of customer to visit same hospital again). Out of these factors, empathy was reported as a most influencing factor for a patient to visit the same hospital again.
Swain & Kar (2017) developed a conceptual model of hospital service quality by critically reviewing twenty literature studies. Author identified 15 dimensions of hospital service quality namely infrastructure, resource availability, food, religious needs, patient safety & privacy, quality of outcomes, clinical procedures, administrative procedures, waiting time for services, price, personalised attention, staff attitude, trustworthiness, information availability
and continuity. These 15 dimensions were covered under 3 broad categories: infrastructure dimension, procedural dimension and interactive dimension.
Research Gap:
Literature review reveals that most of the studies are related with multi-specialty hospitals at big cities. While a large section of population which is poor, depends on government healthcare facilities for sound health. Therefore, this study is an attempt to understand the patient satisfaction level towards IPDs of government hospitals including medical colleges, civil hospitals, community health centres, primary health centres, primary health sub centres, etc. of National Capital Region (NCR) of India.
Research Methodology:
To fulfill the research objectives and to examine the level of patient satisfaction, it was proposed to use descriptive- cum -exploratory research design on the basis of initial literature review on patient satisfaction and previous research findings on similar kind of study done elsewhere. A mix of these designs provides enough protection against biasness, maximises dependability and provides opportunity for considering diverse facets of the research problem
Data Collection:Questionnaire Design:
Data was collected using a structured questionnaire with three sections, first section collected socio-demographic details of respondents, second section collected information about thirty nine elements which affected the level of patient satisfaction; these questions were asked on a five point likert scale, third section collected the information about level of patient satisfaction through three statements asked on a five point Likert scale.
Sample Design:
The population for current study is all the patients

Jan - June, 2019 19
who were admitted in between June 2017 to December 2017 in the government hospitals of National Capital Region of India. Further, patients who are admitted in the hospitals are more comfortable to assess the services provided by the said hospital than the patients who have visited Outpatient Departments (OPDs). But, it is not practical to study whole population, so a small part of population, known as sample is extracted from population so that inferences can be drawn about parameters from statistics. A total of 480 questionnaires were floated to the admitted patients using convenience sampling, out of which responses were received from 342 respondents. 42 responses were rejected in the process of data cleaning, leaving the effective sample size of 300 respondents. Secondary data was gathered from various websites, journals, magazines and newspapers etc.
Statistical Tool for Data Analysis:
Data collected through questionnaires has been analysed using Statistical Package for Social Sciences (SPSS) version 21. Statistical tools frequency analysis, descriptive statistics, factor analysis and regression analysis are used for the purpose of analysis. MS Excel has also been used for preparing charts.
Data Analysis:
In the process of data analysis, first of all, there were few missing values which were imputed using serial mean.
Socio-demographic Profile of Respondents:
Table 1: Socio demographic profile of respondents (N=300)
Characteristics N Percentage
Gender Male 190 63.3%
Female 110 36.7%
Marital Status Married 191 63.7%
Single 104 34.7%
Divorcee 3 1.0%
Widow 2 0.7%
Age <25 years 75 25%
25-40 146 48.7%
40-55 64 21.3%
55-70 12 4.0%
70+ 03 1.0%
Occupation Govt. Employee
127 42.3%
Self employed 53 17.6%
Student 65 21.6%
Housewife 23 7.6%
Retired persons
7 2.3%
Others 25 8.3
Source: Primary data.
Above picture depicts about demographic details of 300 respondents. Out of 300 respondents i.e. admitted patients, 63.3 % (190) were male and 36.7 % (110) female. 63.7 % (191) of the respondents were married, 34.7% (104) single, 1 % (3) divorcee and 0.7 % (2) were widowed. 25 % (75) respondents were aged less than 25, 48.7 % (146) aged between 25 and 40, 21.3 % (64) aged between 40 and 55, 4 % (12) aged between 55 and 70 and 1 % (3) of respondents aged more than 70. Out of 300 admitted patients, 42.3 % (127) were government employees, 17.6 % (53) were self employed, 21.6 % (65) were students, 7.6 % (23) were housewives, 2.3 % (7) were retired persons and 8.3 % (25) of them were engaged in other occupation.
Reliability Analysis:
The scale was subjected to Cronbach Alpha test for testing reliability. The Cronbach Alpha for 38 items was found to be 0.954, which indicated a good internal consistency among the items.
Factor Analysis:
38 items were subjected to factor analysis using principal component analysis because this research is mostly exploratory in nature. First, factor analysis was performed for factor extraction with eigen value more than 1. Second, varimax rotation was used to ascertain the factor loading of each variable on one factor. Factor loadings>0.5 were accepted as suggested by Hair et al. (2006). Variables which had a factor loading less than 0.5 were dropped. Items
*Jitender Kumar **Neha ***Jigyasa

20 Amity Management Analyst Jan - June, 2019
with factor loading more than 0.5 on one factor and more than 0.4 on another factor were also dropped to make sure that the items selected have a high factor loading on one factor and low on others. 18 items were dropped out of 38 items in this process. Three items (B1, B2, B36) got loaded on unrelated dimension, so they had to be removed. Twelve items (B3,B4,B8,B11,B14,B16,B17,B18,B21,B24,B29,B32) were dropped as their factor loading was less than 0.5. Three items (B5, B35, B39) were dropped for their factor loading value lied between 0.4 and 0.5. 20 items were taken to next stage. Cronbach Alpha value of these 20 items came to be 0.922.
Before doing factor analysis at each stage, Barletts test of sphericity and Kaiser-Meyer-Olkin tests were
performed. The output of factor analysis at various stages showed that Barletts test and KMO measure indicated sampling adequacy for factor analysis.
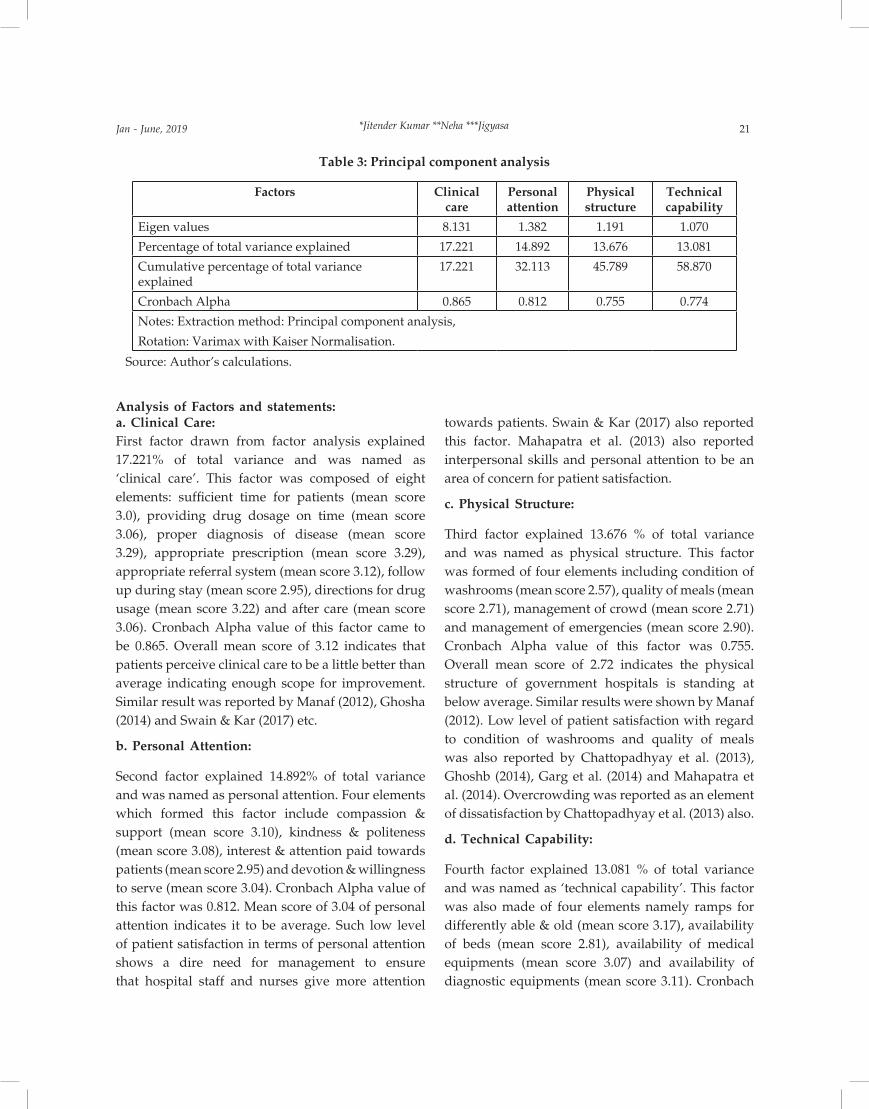
Factor analysis with 20 items was able to extract four primary factors: Clinical care, personal attention, physical structure and technical capability. Clinical care, personal attention, physical structure and technical capability accounted for 17.22 percent, 14.89 percent, 13.68 percent and 13.08 percent of total variance respectively. Altogether these four factors explained 58.87 percent of total variance. Clinical care, personal attention, physical structure and technical capability had Cronbach Alpha values 0.865, 0.812, 0.755 and 0.774 respectively.
Table 2: Scale dimensions and factor loadings
Factor Variable Factor loadings
F1 F2 F3 F4
Clinical care Sufficient time for patients 0.548
Providing drug dosage on time 0.561
Proper diagnosis of disease 0.607
Appropriate prescription 0.678
Appropriate referral system 0.610
Follow up during stay 0.606
Directions of drug dosage 0.674
After care 0.503
Personal attention Compassion and support 0.716
Kindness and politeness 0.751
Interest and attention towards patients
0.664
Devotion and willingness to serve 0.672
Physical structure Condition of washrooms 0.740
Quality of meals 0.664
Management of crowd 0.733
Management of emergencies 0.589
Technical capability
Ramps for differently able and old 0.742
Availability of beds 0.682
Availability of medical equipments 0.552
Availability of diagnostic equipments 0.543
Source: Author’s calculations.
Jan - June, 2019 21
Analysis of Factors and statements:a. Clinical Care:First factor drawn from factor analysis explained 17.221% of total variance and was named as ‘clinical care’. This factor was composed of eight elements: sufficient time for patients (mean score 3.0), providing drug dosage on time (mean score 3.06), proper diagnosis of disease (mean score 3.29), appropriate prescription (mean score 3.29), appropriate referral system (mean score 3.12), follow up during stay (mean score 2.95), directions for drug usage (mean score 3.22) and after care (mean score 3.06). Cronbach Alpha value of this factor came to be 0.865. Overall mean score of 3.12 indicates that patients perceive clinical care to be a little better than average indicating enough scope for improvement. Similar result was reported by Manaf (2012), Ghosha (2014) and Swain & Kar (2017) etc.
b. Personal Attention:
Second factor explained 14.892% of total variance and was named as personal attention. Four elements which formed this factor include compassion & support (mean score 3.10), kindness & politeness (mean score 3.08), interest & attention paid towards patients (mean score 2.95) and devotion & willingness to serve (mean score 3.04). Cronbach Alpha value of this factor was 0.812. Mean score of 3.04 of personal attention indicates it to be average. Such low level of patient satisfaction in terms of personal attention shows a dire need for management to ensure that hospital staff and nurses give more attention
towards patients. Swain & Kar (2017) also reported this factor. Mahapatra et al. (2013) also reported interpersonal skills and personal attention to be an area of concern for patient satisfaction.
c. Physical Structure:
Third factor explained 13.676 % of total variance and was named as physical structure. This factor was formed of four elements including condition of washrooms (mean score 2.57), quality of meals (mean score 2.71), management of crowd (mean score 2.71) and management of emergencies (mean score 2.90). Cronbach Alpha value of this factor was 0.755. Overall mean score of 2.72 indicates the physical structure of government hospitals is standing at below average. Similar results were shown by Manaf (2012). Low level of patient satisfaction with regard to condition of washrooms and quality of meals was also reported by Chattopadhyay et al. (2013), Ghoshb (2014), Garg et al. (2014) and Mahapatra et al. (2014). Overcrowding was reported as an element of dissatisfaction by Chattopadhyay et al. (2013) also.
d. Technical Capability:
Fourth factor explained 13.081 % of total variance and was named as ‘technical capability’. This factor was also made of four elements namely ramps for differently able & old (mean score 3.17), availability of beds (mean score 2.81), availability of medical equipments (mean score 3.07) and availability of diagnostic equipments (mean score 3.11). Cronbach
Table 3: Principal component analysis
Factors Clinical care
Personal attention
Physical structure
Technical capability
Eigen values 8.131 1.382 1.191 1.070
Percentage of total variance explained 17.221 14.892 13.676 13.081
Cumulative percentage of total variance explained
17.221 32.113 45.789 58.870
Cronbach Alpha 0.865 0.812 0.755 0.774
Notes: Extraction method: Principal component analysis,
Rotation: Varimax with Kaiser Normalisation.
Source: Author’s calculations.
*Jitender Kumar **Neha ***Jigyasa

22 Amity Management Analyst Jan - June, 2019
Alpha value of this factor was 0.774. Mean score of 3.04 indicates an average quality of technical capabilities of government hospitals showing the need to improve the capabilities. Merkouris (2013) also reported this factor.
Regression Analysis:
Regression analysis was performed taking clinical care, personal attention, physical structure and technical capability as independent variables and patient satisfaction as dependent variable. Patient satisfaction variable was created by taking an average of variables: satisfaction from recovery rate, satisfaction from speed of recovery and status of improved health. Step by step regression was carried out by taking ‘personal attention’ as explanatory variable first. Then ‘personal attention’ & ‘clinical care’, then ‘personal attention’, ‘clinical care’ & ‘physical structure’ and finally ‘personal attention’, ‘clinical care’, ‘physical structure’ & ‘technical capability’ were taken as explanatory variables. Hence four regression models were created.
All the assumptions of multiple regression including: no autocorrelation, no multicollinearity, homoskedasticity, normality of residuals, significance of predicting variables and model fit were met.
Coefficients of four models are presented in Table 4. Summary of all four models is presented in Table 5. The first model assumed patient satisfaction as dependent variable and personal attention as independent variable. Standardised β = 0.473, ρ < 0.001 indicates it to be significant predictor. F = 85.86, ρ < 0.001 points that model is significant. This
model explained about 22.4 percent of variance in patient satisfaction. In second model, personal attention and clinical care were taken as explanatory variables and patient satisfaction as explained variable. Both personal attention (β = 0.473, ρ < 0.001) and clinical care (β = 0.445, ρ < 0.001) were found to be significant predictors. The model was also found to be significant (F = 108.45, ρ < 0.001) and explained 42.2 percent of variance in explained variable. The inclusion of clinical care resulted in a significant change in R2 of 0.198. In the third step, physical structure was added in the model along with personal attention and clinical care. Personal attention (β = 0.473, ρ < 0.001), clinical care (β = 0.445, ρ < 0.001) and physical structure (β = 0.150, ρ < 0.001) were found be significant. Overall model was significant (F = 78.99, ρ = 0.001) and explained 44.5 percent variance in patient satisfaction. Inclusion of physical structure in the model resulted in a significant change in R2 of 0.023. In the final stage, technical capability was added to the predictors along with personal attention, clinical care and physical structure. All four factors, personal attention (β = 0.473, p < 0.001), clinical care (β = 0.445, ρ < 0.001), physical structure (β = 0.150, ρ < 0.001) and technical capability (β = 0.147, ρ = 0.001) had a significant effect on explained variable patient satisfaction. Overall model explained 46.6 percent of variance and was significant (F = 64.42, ρ = 0.001). Inclusion of technical capability in the model resulted in a change in R2 of 0.022.
Out of four predictors, technical capability came out to be a week predictor and personal attention the strongest, indicating the need of personal care, kindness and empathy towards patients for their satisfaction.

Jan - June, 2019 23
Discussion:
The need of patient satisfaction from hospital is imperative as it is the place where he comes for a solution to his health problems. Continuous efforts should be made to assess the patient satisfaction level of any hospital. The results of factor analysis
conclude ‘personal attention’, ‘clinical care’, ‘physical structure’ and ‘technical capability’ to be the four primary factors which affect the level of satisfaction a patient receives from a hospital. Average or below average scores for all four factors are worrying. Similar results have been reported by Chattopadhyay et al. (2014) and Ghoshb (2014).
Table 4: Results from step by step regression analysis
Unstandardized coefficients Standardized coefficients
t Sig.
β Standard error Β
Model 1
Constant 3.251 0.042 78.676 0.000
Personal attention .384 0.042 0.473 9.266 0.000
Model 2
Constant 3.251 0.36 91.033 0.000
Personal attention .384 0.36 0.473 10.721 0.000
Clinical care 0.361 0.36 0.445 10.097 0.000
Model 3
Constant 3.251 0.035 92.707 0.000
Personal attention .384 0.035 0.473 10.918 0.000
Clinical care 0.361 0.035 0.445 10.283 0.000
Physical structure 0.122 0.035 .150 3.468 0.001
Model 4
Constant 3.251 0.034 94.407 0.000
Personal attention .384 0.034 0.473 11.119 0.000
Clinical care 0.361 0.034 0.445 10.472 0.000
Physical structure 0.122 0.034 0.150 3.531 0.000
Technical capability 0.119 0.034 0.147 3.458 0.001
Source: Author’s calculations.
Table 5: Regression model summary
Model 1 Model 2 Model 3 Model 4
R 0.473 0.650 0.667 0.683
R2 0.224 0.422 0.445 0.466
Adjusted R2 0.221 0.418 0.439 0.459
Change in R2 0.224 0.198 0.023 0.022
F 85.857 108.451 78.993 64.427
Change in F 85.857 101.959 12.024 11.958
Significance 0.000 0.000 0.001 0.001
Durbin watson 1.868
Source: Author’s calculations.
*Jitender Kumar **Neha ***Jigyasa

24 Amity Management Analyst Jan - June, 2019
Results of regression analysis claimed personal attention towards patients to be the most determining factor of patient satisfaction, implying the personal and social needs of patients. It is not only the medicines and treatment which cures the patients but the kindness, politeness, respect and compassion with which they are treated also matters a lot.
Implications for Management:
The study revealed the factors which primarily affect the level of patient satisfaction and can be used to assess the quality of hospitals. Average or below average mean scores of four factors for government hospitals indicate an average or below average condition of hospitals in terms of personal attention, clinical care, physical structure and technical capabilities. Management of government hospitals needs to work not only on the quantity of hospitals but also the quality provided therein.
Personal attention came out to be the most predicting factor towards patient satisfaction. In order to increase the level of patient satisfaction, management needs to pay attention that patients are well treated and are provided home like environment. This can be done by treating them with respect, kindness and love.
Limitations of Study:
This study has been performed in NCR of India only due to time and resource constraints so that results cannot be generalised to the whole nation. Therefore, results need to be interpreted with caution.
References:Aagza, J. P. & Garg, R. (2010). Measuring Perceived Service
Quality for Public Hospitals (PubHosQual) in the Indian Context. International Journal of Pharmaceutical and Healthcare Marketing, 4(1), 60-83.
Chattopadhyay, A., Saha, T. K., Karmakar, P. R., Sengupta, P., Boral, K. & Yasmin, S. (2013). Patient Satisfaction Evaluation in CGHS Dispensaries in Kolkata, India. IOSR Journal of Dental and Medical Sciences, 6(4), 13-19.
Garg, N., Gupta, S. K. & Mahesh, R. (2014). Patient Satisfaction Survey at a Tertiary Care Specialty Hospital. International Journal of Research Foundation of Hospital & Healthcare Administration, 2(2), 79-83.
Ghosha, M. (2014). Measuring Patient Satisfaction: An Empirical Study in India. Leadership in Health Services, 27(3), 240-254.
Ghoshb, S. (2014). An Analytical Study on Patients’ Satisfaction and Medical Facilities Provided by Public Hospital: With Special Reference to Dhubri Civil Hospital, Jhagrarpur. International Journal of Healthcare Sciences, 2(1), 107-115.
Hair, J.F., Black, W.C., Babin, B.J., Anderson, R.F. and Tatham, R.L. (2006). Multivariate Data Analysis, Pearson Education, New Delhi.
India Population (2018). Population of India (2018 and historical). Retrieved from www.worldometers.info/world-populaion/india-populaion/ on 30th Jan 2018.
Kumar, J. & Neha (2016). Patient Satisfaction in Outpatient Departments (OPDs): An Investigative Study in Government Hospitals of Haryana. AAYAM, 6(2),1-7.
Mahapatra, P., Srilatha, S. & Sridhar, P. (2001). A Patient Satisfaction Survey in Public Hospitals. Journal of Academy of Hospital Administration, 13(2), 11-15.
Manaf, N. H. A. (2012). Inpatient Satisfaction: An Analysis of Malaysian Public Hospitals. International Journal of Public Sector Management, 25(1), 6-16.
Merkouris, A., Andreadou, A., Athini, E., Hatzimbalasi, M., Rovithis, M. & Papastavrou, E. (2013). Assessment of Patient Satisfaction in Public Hospitals in Cyprus: A Descriptive Study. Health Sciences Journal, 7(1), 28-40.
Mogha, S. K., Yadav, S. P. & Singh, S. P. (2015). Slack Based Measure of Efficiencies of Public Sector Hospitals in Uttarakhand (India). Benchmarking: An International Journal. 22 (7), 1229-1246.
Naik, R. & Byram, J. A. (2016). Healthcare Service Quality Effect on Patient Satisfaction and Behavioural Intentions in Corporate Hospitals in India. International Journal of Pharmaceutical and Healthcare Marketing, 10(1).
Sharma, A., Kasar, P. K. & Sharma, R. (2014). Patient Satisfaction about Hospital Services: A Study from the Outpatient Department of Tertiary Care Hospital, Jabalpur, Madhya Pradesh, India. National Journal of Community Medicine, 2(2), 199-203.
Swain, S. & Kar, N. C. (2017). A Holistic Framework for Conceptualizing Hospital Service Quality. Journal of Health Management, 19(1), 1-13.
Vandamme, R. & Leunis, J. (1993). Development of A Multiple-Item Scale for Measuring Hospital Service Quality. International Journal of Service Industry Management, 4(3), 30-49.
Yildez, O. & Demirors, O. (2013). Measuring Healthcare Process Quality: Applications in Public Hospitals in Turkey. Informatics for Health & Social Care, 38(2), 132-149.
http://www.cbhidghs.nic.in/E-Book%20HTML-2017%20PART-I/index.html#14 retrieved on 19th Feb 2018.
https://www.ibef.org/download/Healthcare-January-2018.pdf retrieved on 19th Feb 2018.

Jan - June, 2019 25© Amity Management Analyst
2019 Vol IX, No I
Selection of Online Coaching Instiute: A Study Among IAS Aspirants in Ludhiana and Chandigarh
Rajpreet Singh Chhatwal
Professor cum Head, Faculty of International Business, Punjab College of Technical Education, Ludhiana, email: [email protected]
Introduction:
Online coaching is the means of teaching people within a virtual environment online and separates the student and teacher. This kind of approach to teaching is done using many different methodologies, ways and means and allows a tutor to teach a subject without any face-to-face interaction. It is the process of tutoring in an online, virtual environment or networked environment in which teachers and learners are separated by time and space. Definitions associated with online tutoring vary widely, reflecting the ongoing evolution of the technology, the refinement and variation in online learning methodology, and the interactions of the organizations that deliver online tutoring services with the institutions, individuals, and learners that employ the services.
Students have also shown willingness to embrace Digital Learning Technologies (DLT) and practices. About 92 percent of students worldwide are interested in personalized support and
information on degree progress. They also showed interest in other academic performance analytics.
Students are also interested in the use of different devices in the learning process. Students worldwide wanted their instructors to enable them to use their laptop more in a learning context and are already using this type of the device for school related activities. In the United States, about 56 percent of students have been using a laptop or desktop computer in the classroom on a weekly basis. In the last few years, the approach of the parents, teachers, and student fraternity in India has been veering towards the online world, especially in urban and semi-urban India. A handful of startups rode high on this behavioral change and succeeded in the online tutoring domain. Online videos of a tutor teaching either live or as a pre-recorded package, and online marketplace for tutors collectively form the online tutoring market. Live online tutoring constitutes less than one percent of this market but is expected to grow significantly with the increased intervention of technology.
Review of Literature:
The literature review involves previous research, publications and documentation. The existing
This study is basically done to help the company Neostencil to know about whether its target audience, IAS aspirants, is aware about its websites or any other online coaching option and what are the most important factors when it comes to their coaching. The study highlighted ‘concentration’ was also an issue with the students if they study online as there will be distractions. The study further provided insights into how online coaching can be made better, quality of video can be improved and ensure lesser buffering of the videos. Quick response to the doubts of the students when they are studying online is critical. The routine and strict schedule should be there so that the students do not fall back. The study concluded that social media can also play an important role in spreading the awareness regarding the websites because it is a digital age and almost every human being is on social media, so people can know about the online coachings if the agencies concerned present them on social media in an effective manner.

26 Amity Management Analyst Jan - June, 2019
knowledge or literature on online coaching has been reviewed and the gaps left by past research and publications have been identified as under:-
Schermuly and Grabmann (2019) highlighted that coaching can have tremendous positive effects, but to date, there has been little attention to the possibility that coaching can also exhibit negative effects. Nine different studies with a qualitative, cross-sectional, time-lagged, or experimental research orientation were identified and used for this review. Throughout the diverse studies, negative effects occurred frequently, but only a few of them were severe and most of them were low in intensity. Concerning their antecedents, higher relationship quality between clients and coaches was related to fewer negative effects. The findings also indicated a beneficial influence of supervision. Moreover, negative effects for clients and negative effects for coaches were interrelated. These findings contribute to the professionalization of coaching and put coaching in line with other helping relationships, where negative effects have been acknowledged as natural occurrences without being taboo.
Olson et al., (2011) studied the benefits of the adoption of e-learning in developing countries. The study concluded that students, teachers, and both the economies and societies in such areas would be greatly improved with the implementation of e-learning.
Park and Choi (2009) sought to find the factors that encourage students to remain in online courses. They focused on internal factors (i.e., satisfaction and motivation), external factors (i.e., organizational and family support), and online learners’ demographic characteristics (i.e., ethnicity, gender, age). Although no significant differences in demographic characteristics between remaining and dropout students were found, significant differences were found regarding internal and external factors. The researchers concluded that internal and external factors have a significant impact in online student retention.
Appana (2008) found out that distance education is a formal learning activity, which occurs when students and instructors are separated by geographic distance or by time. Learning is supported by communications technology such as television, videotape, computers, e-mail, and mail. Online learning is any learning experience or environment that relies upon the Internet/World Wide Web as the primary delivery mode of communication and presentation. There are potential benefits of investing in online learning for example, increased access, improved quality of learning, better preparation of students for a knowledge-based society, “lifelong” learning opportunity, profit making, and many more.
Pardo and Peñalvo (2008) found out that the world of learning experienced a real revolution with the globalization of the Internet and the spreading of net-based learning tools. E-learning, however, did not come with the better results, and this is not (at least not completely) because of “technological” factors. In fact, most of the responsibility of failure in E-learning initiatives is due to the absence of “teaching roles”, in part due to its substitution for learning objects, in part because of a wrong conception of interaction, knowledge building and communication flows on an E-learning environment. In spite of learning tools and advantages inherent to computer and net-based learning, learning activity (electronic or not) is a human and communicative act that requires monitoring, evaluation, motivation. There are many ways to measure quality on e-learning activities, but counting on the presence of an efficient staff of tutors on-line will ensure the presence and coherence of an actor in any part of the learning process. This key figure, the online tutor, must own an outstanding role to ensure the achievement of goals, competences and skills planned for every course by students. Therefore, it is fundamental to develop a training method for tutors in order to alleviate eventual faults or negative conditions inherent to eLearning: loneliness, distance, and shortage of infrastructures or technological knowledge.

Jan - June, 2019 27
Bhattacharya and Sharma (2007) studied that in a country like India and economic development can only be reached through better utilization of e-learning. Accelerated telecommunication growth, better internet penetration with wider bandwidth and more software applications for e-education are needed for overcoming the digital divide to achieve growth, in coordination with grass-roots developmental work in schools. Traditional institutions should put their energies into information and communication technologies for providing E-learning. There are certain areas which need to be worked upon for the successful implementation of E-learning and traditional institutions offering higher education in India should give it a thought. They need to become more customer centric and take lessons from businesses which regard customer as utmost important stakeholder. Focusing on blended learning, rather than insisting on teaching students ‘at my place at my pace’ using an industrial model that is now becoming obsolete is what they need to look at. Universities need to leverage their competitive advantage in terms of the ICT (Information and communication technologies) revolution and the new model of e-learning must be relied upon in the future.
Eom et al., (2006) found that a student’s perception of interaction with instructors and other students is important in his/her level of satisfaction with the overall online learning experience. However, when the purpose of online interaction is to create a sense of personalization and customization of learning and help students overcome feelings of remoteness, it may have little effect on perceived learning outcomes. Furthermore, a well-designed online course delivery system is likely to reduce the need of interactions between instructors and students.
With this background, the researcher’s objective is to highlight the factors considered important by IAS aspirants while selecting a coaching centre.
Research Methodology:
Research methodology includes the research tools and techniques used by researcher while conducting research. The research design used is descriptive. Both the primary and secondary sources of data have been used. The primary data was collected through structured questionnaire. The questionnaire was pre-tested through a pilot study and suitable changes were made in it based on feedback given by respondents and experts involved in online training. The research was conducted at Ludhiana and Chandigarh in Punjab state and the data collected was used for the purpose of analysis and interpretation. Apart from basic tools like descriptive analysis, advanced tools like Factor analysis was applied with the help of SPSS software. The secondary data was collected from the Newspapers, Magazines, Websites, Journals, etc. A total of 100 respondents were approached, Convenience sampling technique was used to approach the respondents. In this research the target population included the IAS aspirants who would be appearing for the IAS exam in future.
Analysis and Interpretation:
The data has been analyzed and interpreted as follows:-
This section deals with the factors considered important by IAS aspirant while selecting a coaching centre. In this, the factors considered important by IAS aspirant while selecting a coaching centre were divided into 2 interpretable factors. These 2 factors have 9 statements.
Table 1: Depicting KMO and Bartlett’s Test
Kaiser-Meyer-Olkin Measure of Sampling Adequacy.
.815
Bartlett’s Test of Sphericity
Approx. Chi-Square 304.056
Df 36
Sig. .000
Rajpreet Singh Chhatwal

28 Amity Management Analyst Jan - June, 2019
The Kaiser-Meyer-Olkin is the measure of sampling adequacy, which varies between 0 and 1. The values closer to 1 are better and the value of 0.6 is the suggested minimum. The Bartlett’s Test of Sphericity is the test for null hypothesis that the correlation matrix has an identify matrix. Taking this into consideration, these tests provide the minimum standard to proceed for Factor Analysis. Normally, 0 < KMO < 1, If KMO > 0.5, the sample is adequate. Here, in table 4.1, KMO = 0.815 which indicates that the sample is adequate and we may proceed with the Factor Analysis. Bartlett’s Test of Sphericity at 95% level of significant = 0.05. The p-value (Sig) of .000 < 0.05, therefore the factor analysis is valid.
Table 2: Communality Values
Variables Initial Extraction
Reputation 1.000 .494
Batch_Timings 1.000 .700
Rescheduling 1.000 .579
Finish_Time 1.000 .732
Staff 1.000 .662
Mock_Test 1.000 .590
Ratio 1.000 .507
Infrastructure 1.000 .369
Fee_discounts 1.000 .522
Extraction Method: Principal Component Analysis.
The table shows the communality values.
Table 3: Depicting Rotated Component Matrixa
Component
1 2
Finish_Time .842
Batch_Timings .837
Reputation .624 .324
Rescheduling .567 .507
Infrastructure .545
Mock_Test .768
Staff .395 .711
Fee_discounts .701
Ratio .321 .636
Extraction Method: Principal Component Analysis.
Rotation Method: Varimax with Kaiser Normalization.
a. Rotation converged in 3 iterations.
The table shows how we can extract two factors out of the given variables.
Table 4: Depicting Total Variance
Component Initial Eigenvalues Extraction Sums of Squared Loadings
Rotation Sums of Squared Loadings
Total % of Variance
Cumulative %
Total % of Variance
Cumulative %
Total % of Variance
Cumulative %
1 3.932 43.694 43.694 3.932 43.694 43.694 2.705 30.061 30.061
2 1.222 13.580 57.274 1.222 13.580 57.274 2.449 27.214 57.274
3 .942 10.466 67.740
4 .845 9.394 77.134
5 .520 5.779 82.912
6 .470 5.222 88.134
7 .416 4.625 92.759
8 .357 3.965 96.724
9 .295 3.276 100.000
Extraction Method: Principal component Analysis.
Jan - June, 2019 29
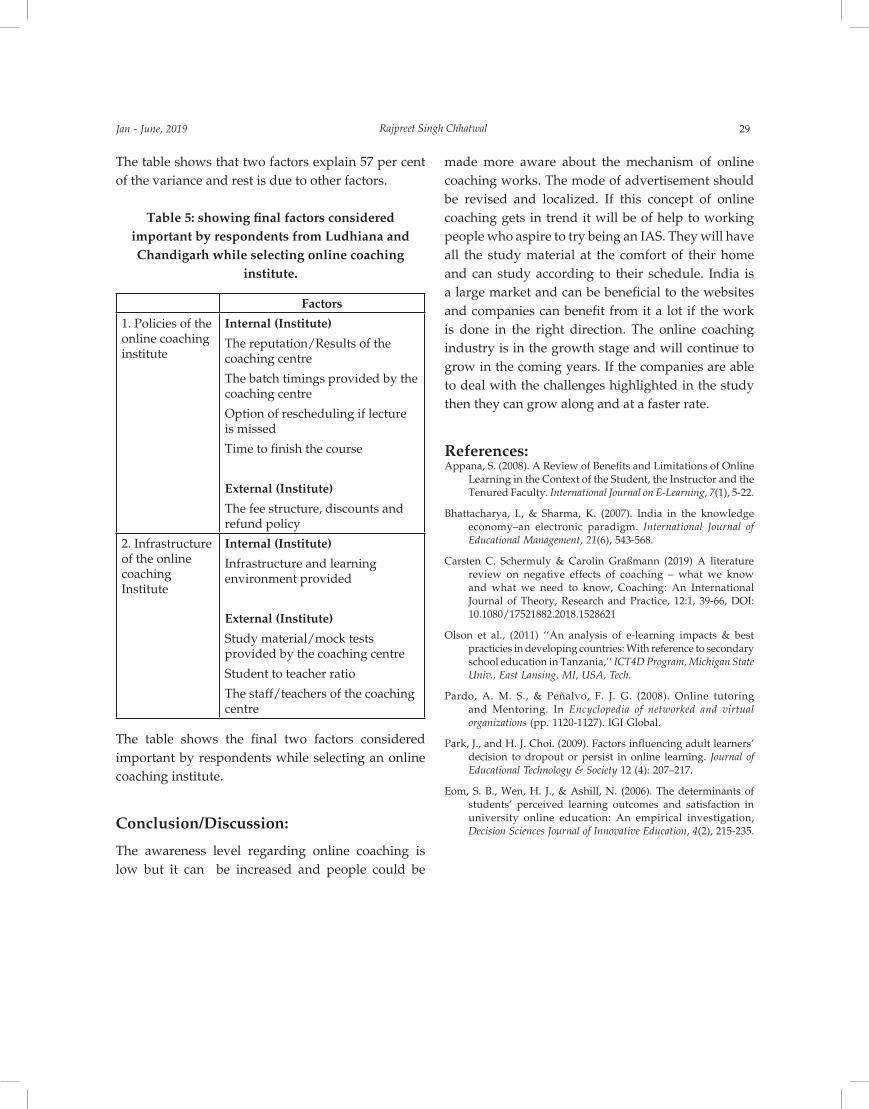
The table shows that two factors explain 57 per cent of the variance and rest is due to other factors.
Table 5: showing final factors considered important by respondents from Ludhiana and Chandigarh while selecting online coaching
institute.
Factors
1. Policies of the online coaching institute
Internal (Institute)
The reputation/Results of the coaching centre
The batch timings provided by the coaching centre
Option of rescheduling if lecture is missed
Time to finish the course
External (Institute)
The fee structure, discounts and refund policy
2. Infrastructure of the online coaching Institute
Internal (Institute)
Infrastructure and learning environment provided
External (Institute)
Study material/mock tests provided by the coaching centre
Student to teacher ratio
The staff/teachers of the coaching centre
The table shows the final two factors considered important by respondents while selecting an online coaching institute.
Conclusion/Discussion:
The awareness level regarding online coaching is low but it can be increased and people could be
made more aware about the mechanism of online coaching works. The mode of advertisement should be revised and localized. If this concept of online coaching gets in trend it will be of help to working people who aspire to try being an IAS. They will have all the study material at the comfort of their home and can study according to their schedule. India is a large market and can be beneficial to the websites and companies can benefit from it a lot if the work is done in the right direction. The online coaching industry is in the growth stage and will continue to grow in the coming years. If the companies are able to deal with the challenges highlighted in the study then they can grow along and at a faster rate.
References:Appana, S. (2008). A Review of Benefits and Limitations of Online
Learning in the Context of the Student, the Instructor and the Tenured Faculty. International Journal on E-Learning, 7(1), 5-22.
Bhattacharya, I., & Sharma, K. (2007). India in the knowledge economy–an electronic paradigm. International Journal of Educational Management, 21(6), 543-568.
Carsten C. Schermuly & Carolin Graßmann (2019) A literature review on negative effects of coaching – what we know and what we need to know, Coaching: An International Journal of Theory, Research and Practice, 12:1, 39-66, DOI: 10.1080/17521882.2018.1528621
Olson et al., (2011) ‘‘An analysis of e-learning impacts & best practicies in developing countries: With reference to secondary school education in Tanzania,’’ ICT4D Program, Michigan State Univ., East Lansing, MI, USA, Tech.
Pardo, A. M. S., & Peñalvo, F. J. G. (2008). Online tutoring and Mentoring. In Encyclopedia of networked and virtual organizations (pp. 1120-1127). IGI Global.
Park, J., and H. J. Choi. (2009). Factors influencing adult learners’ decision to dropout or persist in online learning. Journal of Educational Technology & Society 12 (4): 207–217.
Eom, S. B., Wen, H. J., & Ashill, N. (2006). The determinants of students’ perceived learning outcomes and satisfaction in university online education: An empirical investigation, Decision Sciences Journal of Innovative Education, 4(2), 215-235.
Rajpreet Singh Chhatwal
30 Amity Management Analyst Jan - June, 2019
© Amity Management Analyst2019 Vol IX, No I
What Drives Consumers’ to Pay High Premium Price for Luxury Brand While Rejecting High-Quality Non
Luxury Brands
*Etinder Pal Singh **Jyoti Doval
*Professor, Appejay School of Management Dwarka, New Delhi., email:[email protected] **Co-Founder, Planet Excellence, Dwarka, New Delhi
Introduction:The concept of luxury is not new to human kind and has been defined by various experts in different terms, be it convenience beyond the indispensable minimum or be it in terms of providing pleasure to senses. “Luxury items provide extra pleasure and flatter all senses at once. Luxury is the appendage of the ruling classes” (Kapferer, 1997). But the key is its exclusivity and craftsmanship- “a strong element of human involvement, very limited supply and the recognition of value by others are key components” (Cornell, 2002). Due to very high-quality consciousness, rarity and appreciation by others, consumer is willing to pay much higher prices for the products or services availed, many experts have defined luxury in these terms as well: “luxury brands can be defined as those products whose price and quality ratios are the highest of the market” (McKinsey, 1990) and “even though the ratio of functionality to price might be low regarding certain luxury goods, the ratio of intangible and situational utility to price is comparatively high (Nueno & Quelch, 1998)”.
The study attempts to understand the motives behind the decision of the consumers to choose the luxury brands over high-quality non-luxury brands which are available at a much lesser cost.
Theoretical Framework:Understanding Luxury Construct:
Past research has pointed out to the intricacy of the notion of luxury, As it is abstract and primarily based on the consumer perceptions, the meaning of luxury is determined by personal and interpersonal motives (Vigneron& Johnson, 2004). Also, what is a luxury to one may just be ordinary to another (Phau & Gerard, 1998). Based on a qualitative and quantitative cross-cultural consumer studies in Western Europe, USA and Asia Pacific Dubois, Laurent and Czellar (2001) introduced an explanation about the nature and characteristics of the concept of luxury, and spotted six facets (1) excellent quality, 2) remarkably high price, 3) scarcity and uniqueness, 4) aesthetics and polysensuality, 5) ancestral heritage and personal history, and 6) superfluousness.
The paper provides insights about various motives underlying the purchase behavior of Indian luxury consumers when making a choice between exorbitantly priced luxury brands and high-quality non-luxury brands that are available at a fraction of cost. The study was conducted in two metropolitan cities of India, Delhi and Mumbai, where 203 luxury consumers were examined for understanding the luxury buying motives. Ten retail luxury brands were carefully selected for the study. It was found that the consumers decide in favor of luxury brands over high-quality non luxury brands due to variables such as social recognition, social appeal, brand name/value, quality assurance and social admiration.

Jan - June, 2019 31
Table 1: The six main facets of luxury according to Dubois, Laurent and Czellar (2001)
Excellent quality Exceptional ingredients, components delicacy and expertise, craftsmanship
Very high price Expensive, elite and premium pricing
Scarcity and Uniqueness
Restricted distribution, limited number, tailormade
Aesthetics and Poly-sensuality
Piece of art, beauty, dream
Ancestral heritage and personal history
Long history, tradition, pass-on to generations
Superfluousness Uselessness, non-functional
Beverland (2004) designed a luxury brand model with the following elements: Product integrity; Value-driven emergence; Culture; History; Marketing and Endorsement. Initially, luxury was the prerogative of the limited very rich elite class having old money- “luxury is the appendage of the ruling classes” (Kapferer, 1997). With globalization and opening up of the world economy, there is a shift in terms of the profile of luxury consumers due to the fundamental need of man to be admired, appreciated through positioning himself with his material possessions.
Motives For Luxury Buying:
Why do people buy luxury brands? What are the various factors that drive people to spend a fortune for something they might pick up at may be one-tenth of the cost they paid minus the brand name? What benefits are more important to a luxury buyer- functional or non-functional benefits? These are the challenges which have burdened the luxury brand managers for decades now. A customer may acquire luxury brands to serve a social adjustive function, a value-expressive function, or both (Shavitt, 1989). A ‘Gucci’ loafer may have been purchased because the brand exhibits the consumer’s personality (i.e., self-expression) and/or because it is a status symbol (i.e., self-presentation). As per Sheth (1983), “While purchasing a luxury product, there are two categories of motives - functional and non-
functional. While functional motives are related to tangible attributes, nonfunctional motives are related to non-tangibles. Nonfunctional motives are also connected with social and emotional needs or wants.” A three dimensional model, encompassing functionalism (product features that could solve a current problem), experientialism (features that could stimulate sensory pleasure and hedonic consumption) and symbolic interaction (product components related to status, self-enhancement, and group membership) was developed by Vickers and Renand (2003) to differentiate luxury brands from non-luxury. DeBono (1987) discovered in his study that consumers have a social-adjustive attitude toward a product; they are motivated to consume it to gain approval in social situations. On the other hand, attitudes serving a value-expressive function (i.e., value-expressive attitudes) help people communicate their central beliefs, attitudes, and values to others through their possessions (Katz, 1960). In the case of a value-expressive attitude toward a product, the consumers are motivated to consume it as a form of self-expression (Snyder & DeBono, 1985). Status-oriented consumers will only purchase products that represent status in the eyes of others whom they feel are significant (O’Cass & Frost, 2002). O’Cass and Frost (2002) proved that younger consumers are driven by the need to possess and display status brands. However, teenagers from wealthier families having more disposable money are less likely to be involved in status consumption (Piacentini & Mailer, 2004). Bhat and Reddy (1998), in their study suggested that brands have functional and symbolic importance for consumers. The symbolic importance, which is attached to brands, is often broadcasted via the use and consumption of brands (Gottdeiner, 1985; McCracken, 1986). Consuming luxury brands, a manifestation of conspicuous consumption is reflected by a world culture in which overstatement and ostentation have become acceptable (Phau & Gerard, 1998). Rather buying to impress others, still more or less serves as a strategic principle for the marketing management of luxury brands (Berry 1994; Vigneron and Johnson 1999, 2004; O‘Cass and Frost 2002). To explain
*Etinder Pal Singh **Jyoti Doval

32 Amity Management Analyst Jan - June, 2019
consumers’ behavior in relation to luxury brands, apart from interpersonal aspects like snobbery and conspicuousness (Leibenstein 1950), personal aspects such as hedonist and perfectionist motives as well as situational conditions (e.g., economic, societal, and political factors) have to be taken into consideration (Vigneron and Johnson 1999, 2004).
Rejecting or Avoiding High-Quality Non-Luxury Brands:
Consumption values of individuals explain why people prefer to buy or avoid particular products (Sheth, Newman & Gross, 1991).Why a consumer is purchasing or consuming luxury cannot be just described by a set of social facets like: displaying status, success, distinction and the human desire to impress other people, but also depends on the nature of the economic, functional and individual utilities of the specific consumer.
Major difference that luxury brands enjoy over non-luxury is the premium pricing. Past investigations have established and expressed that the price of a product may have a positive role in determining the perception of high quality (Tellis & Gaeth, 1990), and status-conscious consumers tend to use it as a proxy indicator of prestige (Groth & McDaniel, 1993). Rather prestige pricing i.e. setting a relatively higher price to suggest high quality and/or high status (McCarthy & Perreault, 1987) is a deliberate practice adopted by marketers to make certain products or services even more fascinating (Groth & McDaniel, 1993). The same set of constraints work with respect to the functionality of a brand/product. Consumers expect the items they buy to work right, look good, last longer, and perform as expected and as promised (Fennel, 1978). The perception about the functional benefits of a brand is more positive for luxury brands in comparison to the non-luxury brands. As per Wiedmann, et al., (2009), “The consumer’s perceived level of excellent usability in terms of superior functional values of a luxury product or service is positively related to the functional luxury value perception”, and the same gives an edge
to luxury brands over a non-luxury one. Another study found that one reason why consumers prefer luxury brands to non-luxury brands is because of the superior quality reflected or identified by the brand name (Gentry, et al., 2001). This is in congruence with the studies concluding that not mass-produced, but often hand-made luxury brands are perceived to offer excellent product quality and performance as compared to non-luxury brands (Quelch, 1987; Garfein 1989; Zaichkowsky, 2000; O‘Cass & Frost, 2002; Vigneron & Johnson, 2004). Rather, high quality is a basic character of a luxury product (Quelch, 1987; Garfein, 1989). Thus, high-quality conscious consumer associates luxury products with superior quality (Aaker, 1999) and purchase luxury brands instead of non-luxury brands. Lynn (1991) suggested that perceived exclusivity and the dearth of a limited product i.e. uniqueness enhances the consumer‘s desire or predilection for a brand. This perceived level of uniqueness, as an indicator of the exceptional exclusivity and scarcity of a luxury product or service, makes the product or brand even more desirable for the luxury buyers when they compare the same with non-luxury brands (Wiedmann, et al., 2009). Certain products and services, in addition to their functional utility, carry an emotional value and provide intangible benefits (Hirschman & Holbrook, 1982; Sheth et al., 1991, Westbrook and Oliver, 1991).
Researches in the relevant field have revealed that luxury products are expected to yield such subjective intangible benefits. Additionally, investigations dealing with the concept of luxury have frequently found that the emotional responses linked with luxury consumption, are sensory pleasure and fulfillment, aesthetic beauty, or excitement (Roux & Floch, 1996; Vigneron & Johnson, 2004). Further, the intrinsically attractive properties gained from the purchase and consumption of a luxury brand to evoke emotions and affective states obtained from personal rewards and achievement is another reason why luxury brands are favored to non-luxury brands. (Sheth, et al.,1991; Westbrook & Oliver, 1991).

Jan - June, 2019 33
In comparison to the social facet of one’s self, self-identity refers to the personal facet of one’s self in terms of the way the individual identifies him or herself (Mehta, 1999; Sirgy & Johar, 1999). The consumer’s self-concept has an impact on the purchasing behavior in a self-image or product-image congruity model (Sirgy 1982). In addition, consumer behavior theories suggest that the self-image congruity moderates the relationship between one’s self-image and one’s image of a product or service (Belk, 1988; Mick, 1986). This self-image congruity impact is indeed higher in the luxury brands purchase (Puntoni, 2001) and consumers may use luxury items to incorporate the symbolic meaning into their own identity (Holt, 1995; Vigneron & Johnson, 2004) or they use the luxury brands to support and develop their own identity (Douglas and Isherwood, 1979; Dittmar, 1994) therefore preferring luxury brands over non-luxury brands. The idea that consumer is what he buys – i.e., possessions confer status – has long existed and has influenced purchasing, decisions by (Veblen, 1899). Later, the same was observed as explained by Wackman et al., (1972), Daun (1983), Rassuli & Hollander (1986) that possessions and their acquisitions play a central role in the interpretations of materialism. Much of the prevailing research has highlighted the role of status that takes place in communicating information about their possessors and social relationships (Hyman, 1942; Barkow, 1975; Douglas & Isherwood, 1979; Dittmar, 1994). Hence, an individual may use a prestige brand during the week to conform to one’s reference group image, and use an inexpensive brand during the weekend, as one’s desire to possess luxury brands will serve as a symbolic sign of group membership, (Wiedmann, et al., 2009). This bandwagon effect influences an individual to fit affluent lifestyles and/or to identify themselves from non-affluent lifestyles (Sirgy 1982; Mick 1986; McCracken, 1986; Belk, 1988; Dittmar, 1994). Wiedmann, et al., (2009) defined materialism as the degree to which individuals generally find possessions to play an important role in one’s life. The more materialistic a consumer is, the more likely he is to acquire possessions, to
have positive attitudes related to the acquisition, and assign a high priority to material possessions (Wiedmann, et al., 2009). Highly materialistic individuals may find possessions to be desirable and tend to devote more time and energy to product-related activities (Belk, 1985). This can be associated with the understanding of (materialistic) individuals that possessions serve as a indication or source of communication to others for portraying and managing impressions of who they are and what their status or position is (Douglas & Isherwood, 1979; Belk, 1985). This can be associated with the idea of (materialistic) individuals that possessions serve as a indication or cause of communication to others for depicting and managing perceptions of who they are and what their status or position is (Douglas & Isherwood, 1979; Belk, 1985). Thus, more materialistic an individual, higher the probability of him rejecting non-luxury brands to luxury brands. Studies (Mason, 1981, 1992; Bearden & Etzel, 1982) revealed that conspicuousness of a product was positively linked to its susceptibility to the reference group, they established that luxury goods consumed in public were more likely to be conspicuous goods than privately consumed luxury goods. Eastman, et al., (1999) and O’Cass and Frost (2002) pointed out that status-oriented consumers would only purchase products that represent status in the eyes of others whom they perceive as significant. O’Cass and Frost (2002), proved that the desire to possess and display status brands is greater among younger consumers. The analysis of extant literature indicates that luxury brands not only fulfill the functional needs but also aid in achieving social status and ranking in society due to their conspicuous consumption. Thus, are preferred over non-luxury brands.
Methodology:
The study was confined to Indian consumers based in Delhi, Mumbai. The qualifying condition to fill the survey was that the customers must have purchased at least one of the brands under consideration within the past one year of the questionnaire being administered. It was a study based on primary data.
*Etinder Pal Singh **Jyoti Doval
34 Amity Management Analyst Jan - June, 2019
Secondary data has been utilized to compare and interpret the results. In this study, the problem could be spelled out as to identify ‘why luxury consumers reject high-quality nonluxury brands?’. A qualitative method was used in terms of in-depth interviews with management and employees of brands under study. Consumer focus groups were conducted, and pilot studies were undertaken to define and form the structured questionnaire. The instrument applied for the survey was a structured questionnaire. Based on the review of literature a checklist of critical dimensions of rejection of non-luxury brands was developed. A list of variables was identified which have been found to affect luxury buying behavior in the Indian context. The response on the instrument was measured on 6-point scale based on Likert scaling technique. A six point scale forcing respondent to choose that which side of spectrum they were, was used in this study, using Strongly Agree (6), Agree (5), Somewhat Agree (4), Somewhat disagree (3), Disagree (2), Strongly Disagree (1). The scores were reversed for items in case of negative statements. In the study, researcher used Summated Scale (Likert Six Point Scale) in the second section of the instrument six-point Likert scale (6) Always, Most Often (5), Often (4), Sometimes (3), Rarely (2), Never (1), is adopted to understand the decision-making process. In order to get the right people to participate in the study as well as to get a sufficient respondent rate, this study used snowball sampling. Snowball. This method is especially useful when respondents are not easy to be available (Dillman, 2000). This method helps the respondents meet the research criteria researchers have set up for (Hauck &Stanforth, 2007).
The brands under consideration were thoughtfully determined on the basis of the study by A.C. Neilson(2008) i.e. “Forbes World most desirable luxury brands study”. The brands chosen were Gucci, Chanel, Calvin Klein, Louis Vuitton, Christian Dior, Versace, Armani, Ralph Lauren, Prada, and YSL. About 1000 questionnaires were handed out through the investigator and investigator’s contacts (both online and hard copies). A total of 362 surveys
were returned out of which 159 questionnaires were incomplete. Therefore, a total of 203 completed (104 online and 99 hard copies) surveys were found valid. The response rate was 20.30 percent. After gathering the data, it was tested for adequacy and normality. Thereafter, the data has been processed and analyzed with the use of various statistical techniques. Analysis of the total 203 respondents, more than half were female i.e. 56 % (113) and 44% were males (90) showing a larger percentage of women buyers indulging in luxury. This could be justified due to the nature of the brands and category chosen for the study i.e. apparels and accessories. Majority of respondents i.e. 70% were from the age group 25 - 30 years followed by 22% in the age range 35-45. Indicating a higher usage of luxury brands amongst younger people. The minimum level of education amongst the respondents was a graduation degree (22%), while more than two-thirds of respondents i.e. 78% were post-graduates. The majority of respondents i.e. 34% indicated an annual household income in the range of 10-20 lacs. 28% and 24% of respondents fell in the range of 5-10 lacs and 20 lacs plus range. 15% of the respondents indicated their annual household income to be less than 5 lacs.
Data Analysis:
The key purpose of the study was to highlight the reasons for customers rejecting high-quality non-luxury brands over luxury brands. Structural equation modeling (SEM) was used to test the aspects of construct validity. SEM is a largely confirmatory, rather than exploratory, technique. The structural equation modeling was used to perform a conventional regression analysis on all constructs. It was used to predict a specific observed behavior (exogenous) as a linear combination of other endogenous variables. The path diagrams were drawn to create zero degrees of freedom as required by measurement model of SEM. The error variable could not be calculated alongside regression weights. Hence, a value of one was assigned to it, which does not affect the saturated model.
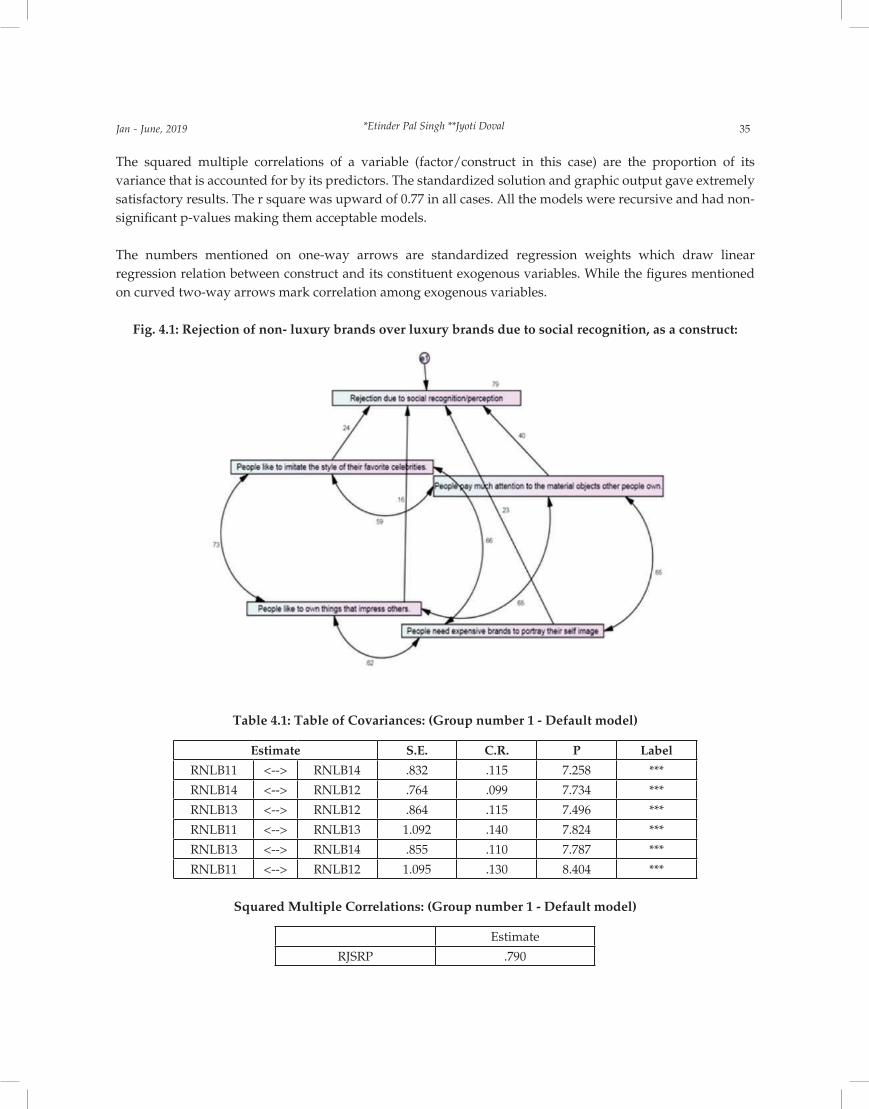
Jan - June, 2019 35
The squared multiple correlations of a variable (factor/construct in this case) are the proportion of its variance that is accounted for by its predictors. The standardized solution and graphic output gave extremely satisfactory results. The r square was upward of 0.77 in all cases. All the models were recursive and had non-significant p-values making them acceptable models.
The numbers mentioned on one-way arrows are standardized regression weights which draw linear regression relation between construct and its constituent exogenous variables. While the figures mentioned on curved two-way arrows mark correlation among exogenous variables.
Fig. 4.1: Rejection of non- luxury brands over luxury brands due to social recognition, as a construct:
Table 4.1: Table of Covariances: (Group number 1 - Default model)
Estimate S.E. C.R. P Label
RNLB11 <--> RNLB14 .832 .115 7.258 ***
RNLB14 <--> RNLB12 .764 .099 7.734 ***
RNLB13 <--> RNLB12 .864 .115 7.496 ***
RNLB11 <--> RNLB13 1.092 .140 7.824 ***
RNLB13 <--> RNLB14 .855 .110 7.787 ***
RNLB11 <--> RNLB12 1.095 .130 8.404 ***
Squared Multiple Correlations: (Group number 1 - Default model)
Estimate
RJSRP .790
*Etinder Pal Singh **Jyoti Doval

36 Amity Management Analyst Jan - June, 2019
It is estimated that the predictors of the Rejection of Non luxury Brands due to social recognition explain 79.0 percent of its variance. In other words, the error variance is approximately 21.0 percent of the variance of Rejection of Non luxury Brands due to social recognition itself. Table 4.1 lists the covariance among exogenous variables forming the part of Rejection of Non luxury Brands due to social recognition construct.
Table4.2: Intercepts: (Group number 1 - Default model)
Estimate S.E. C.R. P Label
RJSRP -4.239 .164 -25.906 ***
The intercept in the equation for predicting the Rejection of non-luxury brands over luxury brands due to social recognition is estimated to be -4.239.
The estimate of the intercept, -4.239, has a standard error of about .164. Dividing the estimate of the intercept by the estimate of its standard error gives z = -4.239/.164= -25.847. In other words, the estimate of the intercept is 25.847 standard errors below zero. The probability of getting a critical ratio as large as 25.847 in absolute value is less than 0.001. In other words, the intercept in the equation for predicting Rejection of non-luxury brands over luxury brands due to social recognition is significantly different from zero at the 0.001 level (two-tailed).These lead us to believe that Rejection of non-luxury brands over luxury brands due to social recognition as construct (Fig 4.1) is very well predicted by and combines the effect of exogenous variables mentioned in figure defined with items like celebrity imitation, paying attention to what other people wear, owning things to impress others and portrayal of self image with expensive brands.
Fig. 4.2: Rejection of non- luxury brands over luxury brands due to social appeal, as a construct:

Jan - June, 2019 37
Squared Multiple Correlations: (Group number 1 - Default model)
Estimate
RJSA .772
It is estimated that the predictors of the Rejection of Non luxury Brands over luxury brands due to social appeal explain 77.2 percent of its variance. In other words, the error variance is approximately 22.8 percent of the variance of Rejection of Non luxury Brands due to social appeal itself. Table 4.3 lists the covariance among exogenous variables forming the part of the Rejection of Non luxury Brands due to social appeal construct.
Table 4.4: Intercepts: (Group number 1 - Default model)
Estimate S.E. C.R. P Label
RJSA -5.390 219 -24.642 ***
The intercept in the equation for predicting Rejection of non-luxury brands over luxury brands due to social appeal is estimated to be -5.390. The estimate of the intercept, -5.390, has a standard error of about .219. Dividing the estimate of the intercept by the estimate of its standard error gives z = -5.390/.219= -24.611. In other words, the estimate of the intercept is 24.611 standard errors below zero. The probability of getting a critical ratio as large as 24.611 in absolute value is less than 0.001. In other words, the intercept in the equation for predicting the Rejection of non-luxury brands over luxury brands due to social appeal is significantly different from zero at the 0.001 level (two-tailed).These lead us to believe that Rejection of non-luxury brands over luxury brands due to social appeal as construct (Fig 4.2) is very well predicted by and combines the effect of exogenous variables mentioned in figure defined with items where individual seek appreciation of significant others.
Table 4.3: Table of Covariances: (Group number 1 - Default model)
Estimate S.E. C.R. P LabelRNLB8 <--> RNLB7 .542 .068 7.984 ***RNLB7 <--> RNLB9 .507 .090 5.606 ***RNLB10 <--> RNLB9 .875 .117 7.454 ***RNLB8 <--> RNLB10 .607 .080 7.600 ***RNLB10 <--> RNLB7 .555 .080 6.919 ***RNLB8 <--> RNLB9 .541 .089 6.098 ***
Fig. 4.3: Rejection of non- luxury brands over luxury brands due to brand name/value/ownership, as a construct:
*Etinder Pal Singh **Jyoti Doval

38 Amity Management Analyst Jan - June, 2019
Squared Multiple Correlations: (Group number 1 - Default model)
Estimate
RJBN .873
It is estimated that the predictors of the Rejection of Non luxury Brands over luxury brands due to brand name/value/ownership of luxury brand explain 87.3 percent of its variance. In other words, the error variance is approximately 12.7 percent of the variance of Rejection of Non luxury Brands due to brand name/value/ownership of luxury brand itself. Table 4.3 lists the covariance among exogenous variables forming the part of Rejection of Non luxury Brands due to social appeal construct.
Table 4.6: Intercepts: (Group number 1 - Default model)
Estimate S.E. C.R. P Label
RJBN -5.190 .153 -33.968 ***
The intercept in the equation for predicting the Rejection of non-luxury brands over luxury brands
due to brand name/value/ownership of luxury brand is estimated to be -5.190. The estimate of the intercept, -5.190, has a standard error of about .153. Dividing the estimate of the intercept by the estimate of its standard error gives z = -5.190/.153= -33.92. In other words, the estimate of the intercept is 33.92 standard errors below zero. The probability of getting a critical ratio as large as 33.92 in absolute value is less than 0.001. In other words, the intercept in the equation for predicting the Rejection of non-luxury brands over luxury brands due to brand name/value/ownership of luxury brand is significantly different from zero at the 0.001 level (two-tailed).These lead us to believe that Rejection of non-luxury brands over luxury brands due to brand name/value/ownership of luxury brand as construct (Fig 4.1.3) is very well predicted by and combines the effect of exogenous variables mentioned in figure defined with items like effect of brand name rather then the product itself, positive self esteem due to ownership of luxury brands, material possessions as a sign of success and reflecting self through possessions.
Table 4.5: Table of Covariances: (Group number 1 - Default model)
Estimate S.E. C.R. P Label
RNLB2 <--> RNLB9 .380 .122 3.128 .002
RNLB17 <--> RNLB9 .659 .118 5.562 ***
RNLB1 <--> RNLB17 .415 .084 4.961 ***
RNLB17 <--> RNLB2 .715 .120 5.953 ***
RNLB1 <--> RNLB2 .473 .092 5.166 ***
RNLB1 <--> RNLB9 .405 .090 4.503 ***

Jan - June, 2019 39
Squared Multiple Correlations: (Group number 1 - Default model)
Estimate
RJQA .921
It is estimated that the predictors of the Rejection of Non luxury Brands over luxury brands due to quality assurance from luxury brands explain 92.1 percent of its variance. In other words, the error variance is approximately 7.9 percent of the variance of Rejection of Non luxury Brands due to quality
assurance from luxury brands itself. Table 4.7 lists the covariance among exogenous variables forming the part of Rejection of Non luxury Brands due to quality assurance from luxury brands construct.
Table 4.8: Intercepts: (Group number 1 - Default model)
Estimate S.E. C.R. P Label
RJQA -5.453 .121 -45.079 ***
The intercept in the equation for predicting the Rejection of non-luxury brands over luxury brands
Fig. 4.4: Rejection of non- luxury brands over luxury brands due to Quality Assurance from luxury brands, as a construct:
Table 4.7: Table of Covariances: (Group number 1 - Default model)
Estimate S.E. C.R. P Label
RNLB6 <--> RNLB5 .532 .091 5.814 ***
RNLB3 <--> RNLB6 .423 .083 5.096 ***
RNLB3 <--> RNLB4 .113 .114 .993 .321
RNLB3 <--> RNLB5 .428 .094 4.579 ***
RNLB4 <--> RNLB5 .308 .124 2.481 .013
RNLB6 <--> RNLB4 .111 .107 1.034 .301
*Etinder Pal Singh **Jyoti Doval

40 Amity Management Analyst Jan - June, 2019
due to quality assurance from luxury brands is estimated to be -5.453. The estimate of the intercept, -5.453, has a standard error of about .121. Dividing the estimate of the intercept by the estimate of its standard error gives z = -5.453/.121= -45.06. In other words, the estimate of the intercept is 45.06 standard errors below zero. The probability of getting a critical ratio as large as 45.06 in absolute value is less than 0.001. In other words, the intercept in the equation for predicting Rejection of non-luxury brands over luxury brands due to quality assurance
from luxury brands is significantly different from zero at the 0.001 level (two-tailed).These lead us to believe that Rejection of non-luxury brands over luxury brands due to quality assurance from luxury brands as construct (Fig 4.4) is very well predicted by and combines the effect of exogenous variables mentioned in figure defined with items where like perception of superior quality products of luxury brands and preference on spending on one luxury brand product rather then having multiple non luxury brand items.
Fig. 4.5: Rejection of non- luxury brands over luxury brands due to social admiration received by luxury brands, as a construct:
Table 4.9: Table of Covariances: (Group number 1 - Default model)
Estimate S.E. C.R. P Label
RNLB15 <--> RNLB16 1.050 .151 6.932 ***
Squared Multiple Correlations: (Group number 1 - Default model)
Estimate
RJSAd .622
It is estimated that the predictors of the Rejection of Non luxury Brands over luxury brands due to social admiration received by luxury brands explain 62.2 percent of its variance. In other words, the error variance is approximately 37.8 percent of the variance of Rejection of Non luxury Brands due to social admiration received by luxury brands itself. Table 4.5 lists the covariance among exogenous variables forming the part of Rejection of Non luxury
Brands due to social admiration received by luxury brands construct.
Table 4.10: Intercepts: (Group number 1 - Default model)
Estimate S.E. C.R. P Label
RJSAd -2.705 .159 -17.047 ***
The intercept in the equation for predicting the Rejection of non-luxury brands over luxury brands due to social admiration received by luxury brands is estimated to be -2.705. The estimate of the intercept, -2.705, has a standard error of about .159. Dividing
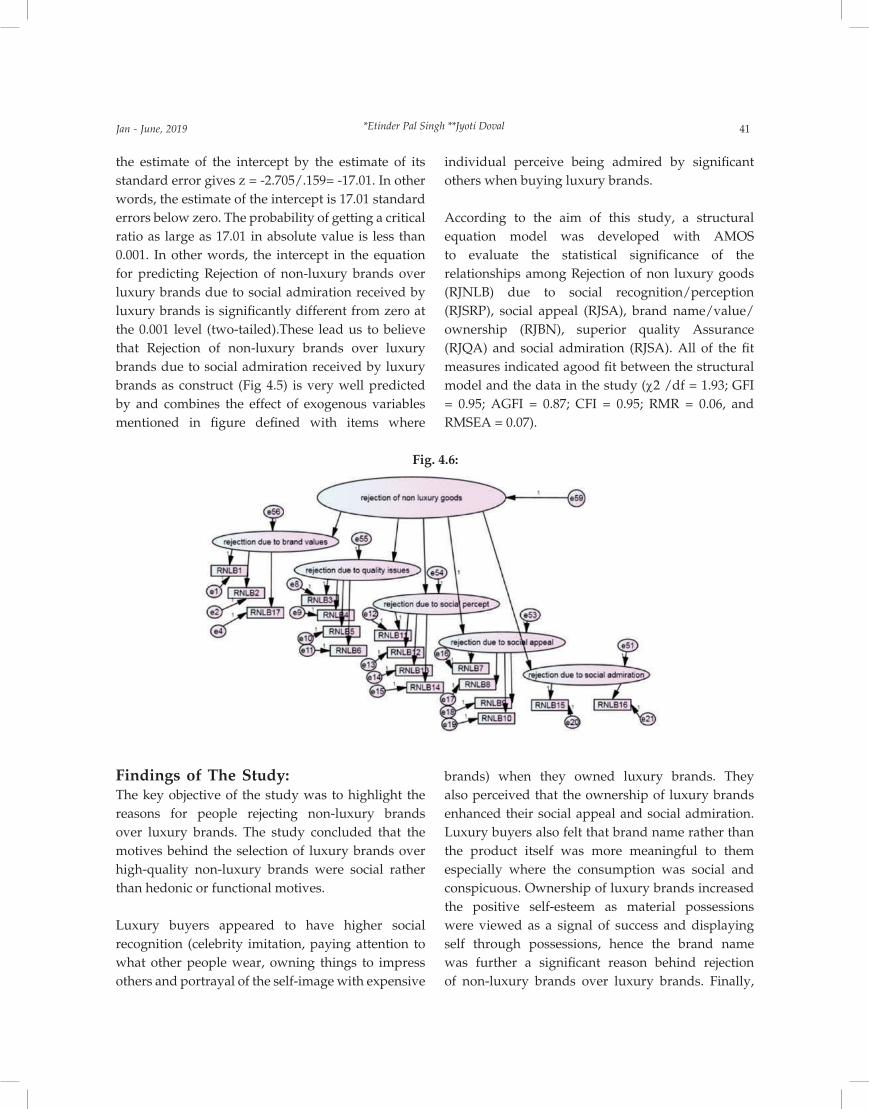
Jan - June, 2019 41
the estimate of the intercept by the estimate of its standard error gives z = -2.705/.159= -17.01. In other words, the estimate of the intercept is 17.01 standard errors below zero. The probability of getting a critical ratio as large as 17.01 in absolute value is less than 0.001. In other words, the intercept in the equation for predicting Rejection of non-luxury brands over luxury brands due to social admiration received by luxury brands is significantly different from zero at the 0.001 level (two-tailed).These lead us to believe that Rejection of non-luxury brands over luxury brands due to social admiration received by luxury brands as construct (Fig 4.5) is very well predicted by and combines the effect of exogenous variables mentioned in figure defined with items where
individual perceive being admired by significant others when buying luxury brands.
According to the aim of this study, a structural equation model was developed with AMOS to evaluate the statistical significance of the relationships among Rejection of non luxury goods (RJNLB) due to social recognition/perception (RJSRP), social appeal (RJSA), brand name/value/ownership (RJBN), superior quality Assurance (RJQA) and social admiration (RJSA). All of the fit measures indicated agood fit between the structural model and the data in the study (χ2 /df = 1.93; GFI = 0.95; AGFI = 0.87; CFI = 0.95; RMR = 0.06, and RMSEA = 0.07).
Fig. 4.6:
Findings of The Study:The key objective of the study was to highlight the reasons for people rejecting non-luxury brands over luxury brands. The study concluded that the motives behind the selection of luxury brands over high-quality non-luxury brands were social rather than hedonic or functional motives.
Luxury buyers appeared to have higher social recognition (celebrity imitation, paying attention to what other people wear, owning things to impress others and portrayal of the self-image with expensive
brands) when they owned luxury brands. They also perceived that the ownership of luxury brands enhanced their social appeal and social admiration. Luxury buyers also felt that brand name rather than the product itself was more meaningful to them especially where the consumption was social and conspicuous. Ownership of luxury brands increased the positive self-esteem as material possessions were viewed as a signal of success and displaying self through possessions, hence the brand name was further a significant reason behind rejection of non-luxury brands over luxury brands. Finally,
*Etinder Pal Singh **Jyoti Doval
42 Amity Management Analyst Jan - June, 2019
respondents showed a preference for spending on one luxury brand item rather than having multiple non-luxury brand items due to the quality assurance that takes place with a luxury brand name.
Managerial Implications:
The ramifications of this research are relevant to marketers in the field of luxury brands. Development of a strong brand certainly fosters the success of branding activities. Thus, the scale and the distinctive dimensions identified in this research can be used as a practical marketing tool for brand managers in the luxury market. Specifically, for Indian luxury buyers, social motives are much stronger as compared to functional and hedonic motives for luxury buying.
The reason being functional excellence is supposed to be present as a hygiene factor for luxury brands in terms of high quality, high performance, and durability. Hence to enhance the acceptability the high-quality non-luxury brands might need to work on strengthening the perception of customer Brand Identification and also focus on emotional benefits. Probably benefits like sustainability, social admiration, legacy and identification with the brand, etc. could be communicated to give reasons for luxury buyers to convert.
Future Research:
The current study examined only the buyers of ten luxury brands available in India. The study was restricted to Indian consumers based in Delhi, Mumbai and surrounding regions only. The scope of future studies could be extended to other luxury brands both in product and service category. The impact of luxury experience on repurchase intentions could be considered for the Excursionist consumer, who is occasionally indulging in the luxury buying experience. Role and influence of social media on luxury buying is another area,
which might be of interest to the future researchers as social media is establishing itself as a part of the marketing strategy of the majority of brands. Researchers propose that an identical study can be undertaken on high-end real estate and automobiles
References:Aaker, J.L., (1999), “The Malleable Self: The Role Of Self-Expression
In Persuasion,” Journal of Marketing Research, 36(1), 45-57.
Bearden, W. O. and Etzel, M. J., (1982), “Reference group influence on product and brand purchase decisions”, Journal of Consumer Research 9 (2): 183–194.
Belk, R. W., (1988), “Possessions and the Extended Self”, Journal of Consumer Research 15 (2): 139-168.
Belk, R. W., (1985), “Materialism: Trait Aspects of Living in the Material World,” Journal of Consumer Research, 12(December), 265-280.
Berry, C. J., (1994), The Idea of Luxury. A Conceptual and Historical Investigation. Cambridge University Press.
Beverland, M., (2004), “Uncovering ‘theories in use’: building luxury wine brands”, European Journal of Marketing, Vol. 38 Nos 3/4, pp. 446-66.
Bhat, S. & Reddy, S. K. 1998.“Symbolic and functional positioning of brands,” Journal of Consumer Marketing, 15(1), 32-43.
Dillman, D. A. (2000), “Mail and Internet surveys: The tailored design method” (2nd ed.), New York: John Wiley & Sons, Inc.
Cornell, A., (2002). “Cult of luxury: The new opiate of the masses,” Australian Financial Review, 27th April: 47.
DeBono, K. G. (1987), “Investigating the Social Adjustive and Value Expressive Functions of Attitudes: Implications for Persuasion Processes,” Journal of Personality and Social Psychology, 52 (2), 279–87.
Dittmar, H., (1994), “Material possessions as stereotypes: Material images of different socio-economic groups”, Journal of Economic Psychology 15 (4): 561–585.
Douglas, M., and Isherwood, B., (1979), “The World of Goods”, Basic. New York.
Dubois, B., Laurent, G., Czellar, S. (2001), “Consumer rapport to luxury: analyzing complex and ambivalent attitudes”, (No. 736). HEC School of Management, Paris.
Eastman, J.K., Goldsmith, R.E. and Flynn, L.R. (1999), “Status consumption in consumer behavior: Scale development and validation”, Journal of Marketing Theory and Practice, Vol. 7 No. 3, pp. 41-52.
Fennell, Geraldine G. (1978), ”Perceptions of the Product-in-use Situation”, Journal of Marketing 42 (2): 39-47.
Jan - June, 2019 43
Garfein, R. T., (1989), “Cross-Cultural Perspectives on the Dynamics of Prestige”, Journal of Services Marketing 3 (3),17-24.
Gentry, J. W., Sanjay P., Clifford S., and Commuri S., (2001), “How now Ralph Lauren? The separation of brand and product in a counterfeit culture”.Advances in Consumer Research, (28), 258–265.
Gottdeiner, M. (1985), “Hegemony and mass culture: a semiotic approach,” American Journal of Sociology, 90(Fall), 979-1001.
Groth, J. C., & McDaniel, S. W. (1993). “The exclusive value principle: the basis for prestige racing.” Journal of Consumer Marketing, 10(1), 10-16.
Hauck, W. E., &Stanforth, N. (2007).Cohort perception of luxury goods and services.Journal of Fashion Marketing and Management: An International Journal, 11(2), 175-188.
Hirschman, E. C., and Holbrook, M. B.,(1982), “Hedonic Consumption: Emerging Concepts, Methods and Propositions”, Journal of Marketing 46 (3): 92-101.
Holt, D. B., (1995), “How consumers consume: A typology of consumption practices” Journal of Consumer Research 22 (1): 1–16.
Kapferer, J.-N., (1997). “Managing luxury brands”, Journal of Brand Management, 4 (4): 251-260.
Katz, Daniel (1960), “The Functional Approach to the Study of Attitudes,” Public Opinion Quarterly, 24 (2), 163–204.
Leibenstein, H.,(1950). “Bandwagon, Snob, and Veblen Effects in the Theory of Consumers’ Demand,” Quarterly Journal of Economics 64 (May): 183-207.
Lynn, M., (1991), “Scarcity Effects on Value: A Quantitative Review of the Commodity Theory Literature”, Psychology and Marketing 8 (1): 45-57.
Mason, R. S., (1981), “Conspicuous consumption: A study of exceptional consumer behaviour” Gower Publishing Company: Farnborough, UK.
Mason, R. (1992), “Modeling the demand for status goods”, Association for Consumer Research Special Volumes: 88 -95.
McCarthy E. J., and Perreault W. D. Jr., (1987), “Basic Marketing: A Managerial Approach”, 9th Edition.
McCracken, G. (1986), “Culture and consumption: a theoretical account of the structure and movement of cultural meaning of consumer goods,” Journal of Consumer Research, 13( June), 71-84.
McKinsey, (1990), “The Luxury Industry: An Asset for France” Paris: McKinsey.
Mehta, A., (1999), “Using self-concept to assess advertising effectiveness”, Journal of Advertising Research, 39 (1): 81–89.
Mick, D. G. (1986), “Consumer Research and Semiotics: Exploring the Morphology of Signs, Symbols, and Significance”, Journal of Consumer Research, 13 (2): 196-213.
Nia, A. and Lynne Zaichkowsky, J., (2000), “Do counterfeits devalue the ownership of luxury brands”, Journal of Product and Brand Management, 9 (7): 485–497.
Nueno, J. L. and Quelch. J. A., (1998), “The mass marketing of luxury,” Business Horizons 41 (6): 61–68.
O’Cass, A. and Frost, H. (2002), “Status brands: examining the effects of non-product-related brand associations on status and conspicuous consumption”, The Journal of Product and Brand Management, Vol. 11 No. 2, pp. 67-88.
Phau, I. and Gerard. P. (1998).”Asia’s brand of conspicuous consumption — Research Directions”, Business and Economics for the 21st Century, Volume II, pp. 46–52.
Piacentini, M. and Mailer, G. (2004), “Symbolic consumption in teenagers’ clothing choices”, Journal of Consumer Behaviour, Vol. 3 No. 3, pp. 251-62.
Puntoni, S., (2001), “Self-identity and purchase intention: an extension of the theory of planned behavior”, European Advances in Consumer Research 5: 130–134.
Quelch, J. A., (1987), “Marketing the premium product,” Business Horizons 30 (3): 38–45.
Roux, E. and Floch, J. M., (1996), “GérerL’ingérable: La Contradiction Interne De TouteMaison De Luxe”, Décisions Marketing, vol. 9 (September-December), pp. 15-23.
Shavitt, S. (1989), “Products, personalities and situations in attitude functions: Implications for consumer behavior”, Advances in Consumer Research, 16(1), 300-305.
Sheth, J.N., (1983), “An integrative theory of patronage preference and behavior” Patronage Behavior and Retail Management, Elsevier Science Publishing Co., New York, pp.9–28.
Sheth, J. N., Bruce I. N., and Gross, B. I., (1991), “Why we buy what we buy: A theory of consumption values,” Journal of Business Research 22 (1): 159–170.
Sirgy, M. J. and Johar, J. S., (1999), “Toward an integrated model of self-congruity and functional congruity”, European Advances in Consumer Research 4: 252–256.
Sirgy, M.J., (1982), “Self-concept in consumer behaviour: a critical review,” Journal of Consumer Research, 9(December), 287-300.
Snyder, M., &DeBono, K. G. (1985), “Appeals to image and claims about quality: Understanding the psychology of advertising”, Journal of Personality and Social Psychology, 49(3), 586.
Tellis, G. J., &Gaeth, G. J. (1990). Best value, price-seeking, and price aversion: The impact of information and learning on consumer choices. Journal of marketing, 54(2), 34-45.
Veblen, T., (1899), “The Theory of the Leisure Class”, New York: Mentor Book.
Vickers, J. S., &Renand, F. (2003). “The marketing of luxury goods: an exploratory study-three conceptual dimensions”, The Marketing Review, 3(4), 459-478.
*Etinder Pal Singh **Jyoti Doval

44 Amity Management Analyst Jan - June, 2019
Vigneron, F. and Johnson, L.W. (1999), “A review and a conceptual framework of prestige-seeking consumer Behaviour”, Academy of Marketing ScienceReview, pp. 1-15
Vigneron, F. and Johnson, L.W., (2004), “Measuring Perceptions of Brand Luxury”, The Journal of Brand Management, vol. 11, no. 6, pp. 484-506.
Wackman, D. B., Greg R., and Ward, S., (1972), “Racial differences in responses to advertising among adolescents, In Television in day to day life”, US Department of Health, Education and Welfare, Rockville, MD, 543–551.
Westbrook, R. A., and Oliver, R. L., (1991), “The dimensionality of consumption emotion patterns and consumer satisfaction”, Journal of Consumer Research 18 (1): 84–91.
Wiedmann, K. P., Hennigs, N. and Siebels, A., (2009), “Measuring Consumers‘ Luxury Value Perception: A Cross-Cultural Framework”, Academy of Marketing Science Review, Volume 2007 no. 7

Jan - June, 2019 45© Amity Management Analyst
2019 Vol IX, No I
Case Study
Dangee Dums
*Anupam Shukla **Arunkumar Dubey ***Bhabani Shankar Gupta
****Bhavesh Prakash Joshi
*Professor, Institute of Computer Science & Technology, Varanasi,[email protected] **Assistant Professor , S K Somaiya College of Arts, Science and Commerce, Mumbai. ***Faculty of BOI - RSETI, Dhanbad ****Associate Professor,Manav Rachna International Institute Of Research And Studies, Faridabad
On March 8, 2015, at 11:00 AM, Mr Nikul Patel, managing director of Dangee Dums, called a meeting, on the occasion of completion of fourth year of Dangee Dums. Nikul had to discuss the future business strategy, with Dhara Patel, H.R head, Ravi Patel, Head Operations and Forum Head Production, regarding expansion of the business. Staring at “Beans to Bliss – The Chocó-journey!” written on the Dangee Dums cup on his desk, Nikul reflected on his aspiration of having hundred outlets by the end of 2017 and of branding it as a “Sweet Boutique” at national level. Though Nikul had opened the thirteenth outlet in and around Ahmedabad, since March, 2011, he had not moved out of the city in order to maintain the quality of product and services. He had to decide which way to expand the business, either the well-accepted franchise route or the operator model which they were practicing.
According to Nikul, the Operator model helped them to achieve their quality standards in terms of service delivery. Since all the operators were their previous employees they understood the philosophy and work culture of Dangee Dums. Moreover they were getting a chance to become partners of Dangee Dums and enhancing their own income. But, while the franchise was fully dependent on them they lacked the passion for quality that Dangee Dums had, Nikul noted.
Journey:
Dangee Dums was a venture of Aromen Hospitality Pvt Ltd, based at Ahmedabad, Gujarat, involved
in the chocolate business since March 2011. After completing his B.Tech from Nirma Institute of Technology, Ahmedabad, Nikul joined the family infrastructure business. But there was always a latent desire to do something different and start his own business. He was an avid traveler and a foodie, so when his friend Mridang came up with an idea of starting a business related to food and that too chocolates, he could not resist the idea. As Nikul was actively involved in the family business he decided to become an investor in the new business, thus he limited himself to involvement in key decisions, while Mridang became acting partner looking after entire operations.
They started to operationalise the idea into reality, and their struggle started with choosing a brand name--they wanted a name which was not related to any product, geography, culture or region. Nikul explained, “The basic idea was to choose such a name that could be carried forward to any country.” They decided to use the brand name “Dangee Dums”, which did not have any meaning.
As Nikul noted, Dangee Dums wanted to offer a premium quality product at premium price for premium people. Now another challenge was to find a recipe and a chef who could make high quality products. After trying many cooks and chefs from across India, he finally met a pastry chef from Mumbai whose preparation and taste was as per Dangee Dums’ standards. The chef provided a cook and Nikul could start operations at Panjrapore, a busy locality in Ahmedabad, in March 2011.

46 Amity Management Analyst Jan - June, 2019
Initial blow:Dangee Dums started by launching cakes for minimum price tag of Rs. 1200 for one kg cake when other cake retailers were selling at Rs. 500 to Rs. 600 per kg; moreover, they restricted themselves to sell minimum one kg cake and not the smaller variants. For the first month, they were not able to recover their expenses and the trend continued for next six months. Mridang who was operating partner of the firm expressed his wish to exit the business, but Nikul wanted to continue. Finally Dangee Dums faced split three months after the opening of the business. Mridang left in June 2011, and Nikul took over the business and started giving full time to Dangee Dums, focusing on manufacturing, operations and marketing. In addition to that he appointed a manager to look after day to day operations.
Nikul said that the first year was very frustrating. Once he called his father to taste the food and services at his outlet; his father was so disappointed that he said “I won’t enter your outlet, because service is very poor”. After which he decided to improve the services offered at his outlet. Nikul’s philosophy was spelled by himself, “If you are persistent in your efforts and focus towards maintaining the quality then success would follow surely.”
Dangee Dums initially decided to enhance the footfall by the sale of food items, as the sales of cakes and chocolate were not as per expectations. But at the same time they wanted to create a niche in cakes and chocolates and not in the food category; therefore, to promote their cakes they introduced the concept of “designer cake”1 in 2011, which Nikul claimed was the first of its kind in Ahmadabad. This was a successful attempt which pushed their sales. They also took permission from the local government authorities to open their outlet till late at night up to 1 AM .The decision was taken because of two reasons, first was due to the fact that dessert was preferred
after dinner and the second was to provide facility to his customers to perform cake cutting ceremony in his outlet, during midnight when the date changes. This had impacted their sales positively; footfall2 increased which resulted in higher sales.
Mrs. Forum Patel, wife of Nikul Patel had taken charge of all the manufacturing process and she entered the business after they fired their first chef within the first year of operation of Dangee Dums. She observed that customers were demanding food items beyond the sweet Cakes, Cupcakes and Chocolates. But they didn’t want to become regular restaurant and at the same time they wanted to fulfill customers’ demand. So she revamped the menu, but they decided not to offer full meals in order to differentiate themselves from regular restaurants. For this, she added American, European and other cuisines in the menu card. Items included pizza, hotdog, etc.
Dangee Dums started to expand their business and they opened a new outlet in a new shopping mall, Alpha Mall. It had more footfall than other malls. And they opened a small kiosk despite high rentals. Nikul noted that he wanted to achieve his vision through passion: “Every time most of the logical decisions don’t work and it’s the passion that moved me ahead even when Panjrapore outlet sales were down; we excelled due to passion not only the logic”.
The marketing initially was taken care of by Nikul himself, but later as the business grew, they hired external agencies for marketing. But they had to change them regularly. “The first one was limited to build the logo but was not good at services. Second used to give only his own inputs and did not listen to our context.”Then finally they landed up with “Identix” whose owner was Kamal, a marketing expert, who specially worked for branding, product innovation, strategic inputs, and store It was August 2013 when they started working with Kamal. Kamal
1Specially ordered Cake which has calligraphic designs specially done by artistic workers. 2Footfall refers to number of customers entering the outlet.

Jan - June, 2019 47
suggested changes in the interiors of their outlet as the perception of the customers was it was a Ghost’s Den and he changed the interior settings to attract the masses as Dangee Dums was perceived to be high priced.
Nikul got the idea of “Cake for the week” offer from “Subway”, where they were offering one of their signature products at lowest rate for one day. He discussed this idea with Kamal and they came up with the 500 Gms of their signature cake for Rs.250, when the original price was Rs.1200 per kg. Since the shelf life of a cake was 3 to 4 days they could easily manage to sell for one week. The response was over whelming according to Nikul. Dangee Dums opened outlets in Prahladnagar in Ahmedabad, and in Info city in Gandhi Nagar.
Adding People:
On September 5, 2011 Dhara Patel joined as a HR head and Ravi Patel joined as operation head to look after all the operations regarding supply chain management and logistics. One of the critical issues which Dhara faced was high attrition of manpower as the sector is highly unorganized and workers are generally unskilled and after getting some experience they switched the job for even minor hike pay. No formal training was provided to the employees and they had to learn, on the job. Also employees had to work late in night, as the outlet was open till 1 am in the morning. She had ensured that staff salaries were paid on time i.e. every first week of the month. She also rewarded their employees on the basis of performance. Of late Dangee Dums had started the practice of Best Employee Award. Dhara’s biggest concern was to retain the employees and inculcate a sense of loyalty in them.
Need of Operator Model:
The franchise experience of the Dangee Dums was not encouraging. Ravi Patel, who was looking after the operations, was happy with the product assortment and inventory of the franchise at
Vastrapur, but the high focus on quality and service, were missing.
Ravi and Nikul discussed the issue and they came up with the idea of Operator model, which was the other option for expanding the business. Under this model Dangee Dums invested the money and gave the right to operate for one year, operator needed to submit deposit money of Rs. One Lac only and profit sharing was percentage basis on the sales. Operational part was with operator, and marketing and inventory was with Dangee Dums. Regarding profit sharing, they had to achieve base sales on which they would get a fixed remuneration. In case they had sold above base sales figure then they were eligible for profit sharing on the sales. There were no fixed criteria and eligibility to become operator. Dangee Dums gave first preference to their employees as there was chance of increasing the income of the employee and since the employees were imbibed with the philosophy of Dangee Dums and their passion for quality.
The challenges ahead:
Dhara highlighted the benefit of operator model in the dimensions of human resource and on the other hand Ravi pointed out the marketing issues, but he also raised a question: could they afford to carry on with this model, because when they expanded to more outlets, new problems like establishing cost would come up. So, for the next 87 outlets how to generate funds was the question? The franchise model was well accepted in the food industry, but they had found it difficult to maintain the quality and passion in the franchise.
Nikul wanted to grow fast and he wanted to maintain the quality of Dangee Dums’ products and services. His dilemma was to choose a route to expand the business and move as per his aspirations, aligning his commitment of “consistently delivering the highest quality cakes and chocolates with outstanding personalized service in a vibrant store atmosphere.”
*Anupam Shukla **Arunkumar Dubey ***Bhabani Shankar Gupta ****Bhavesh Prakash Joshi

48 Amity Management Analyst Jan - June, 2019
Exhibit – 1: Financial abstract by Aromen Hospitality Private Limited (Dangee Dums) for BA & BP
Particulars Business Associates Status.
Establishment Cost Rs- 2000000 Bear by owner of BA
Deposit Money Rs- 800000 Non refundable
Operation Cost Rs- 100000. Bear by owner of BA
Revenue Sharing 50% sales Amt & 8% royalty on sale. Mutually
Wastages NA Bear by owner of BA
Administration NA Bear by owner of BA
Others Expences. NA Bear by owner of BA
Particulars Business Partner
( Service Operator Status.Establishment Cost Rs- 1200000 Bear by AHPLDeposit Money Rs- 100000 Bear by operatorOperation Cost Rs- 75000 Bear by AHPLRevenue Sharing Fixed Rs-20000/-PM & above base sale@10% Mutually Wastages If wastage more than 1%, then bear by operator.Administration NA Bear by operatorOthers Expenses. NA Bear by operator
*Source – AHPL, Ahmedabad.
Exhibit -2: DANGEE DUMS menu chart
Cupcakes Cute Cupcakes Signature Cakes & PastriesFairy Fern Black Out Caramel Walnut TartChocolate Affair Verry Berry TrilogySeasonal Hawaiian Touch Butter Scotch BlissChunchy Oreo Mango Mania. American Apple Pie
Black ForestDark Chocolate Dutch CakeFresh Fruit Gateau CakeOreo Dome CakeNew York Baked Cheese Cake.Butter ScotchFudge BrownieBlueberry Baked Chees CakeBrazilian ChocolateMississippi MudpieRed VelvetHazelnut CrunchyOperaChocolate Mocha TowerSelf Disciplined Belgium Truffle
Source – AHPL, Ahmedabad.
Jan. - June, 2019 Book Review 49
© Amity Management Analyst2019 Vol IX, No I
Book Review
Title: Electionomics
Author: Vivek Narayan Sharma, Advocate-on-Record, Supreme Court of India & Ex- Standing Counsel for State of UK
Publisher: Thomson Reuters
Publication Year: 2019
ISBN: 978-93-89046-26-7
Pages: 303
Price: INR 995/- & US $14.55 (Shall be available in India, US, Canada, UK, Europe, Singapore & Malaysia)
Reviewed by: Prof. (Dr) Vikas Madhukar, Professor and Dy. Director, Amity Business School, Amity University Gurugram
Prof. (Dr) Deependra Sharma, Professor, Amity Business School, Amity University, Gurugram
Electionomics is insightful and historically tickling. The book has been written by well known advocate of Supreme Court of India Mr. Vivek Narayan Sharma who exhibits strong legal and spiritual intellect.His book Electionomics presents the unique amalgamation of Law, Court Judgments, Statistics and Mythology. The book starts and finishes the epic Mahabharata in the Prologue and then becomes unputdownable as Dhritrashtra and Sanjay continue their dialogues on current Democratic and Election Scenario. The narrative of the ancient mythological characters makes the insights of current Election Process extremely engaging and satirical.
The complicated process and loopholes of the Election Process and Politics are explained with phenomenal ease. The use of Quotes, Law, Judgments, Statistics and Bhagwad Geeta Shlokas is perfectly woven and gives a consistent structure to the book. After reading the book, one can attain clarity and understanding on the incremental number of Members of Parliament (MPs) with
criminal background, the prevailing lawlessness during elections, use of social media, Indian sentiments, money, dynastical mileage etc. along with the grassroot realities and compulsions behind these complex scenarios. If Pulwama attack and its electoral consequences unsettle you, you must read the book for that deep insightful analysis of the sentiments of the countrymen.
The Law related to Elections and Democratic process is well brought out from all the statutory books, such as the Constitution of India, the Representation of People Act, Indian Penal Code and Information Technology Act and many others. The selected 100 court judgments of Indian courts are extremely relevant and highlight Indian Judiciary System that works tirelessly for improving the Indian Democracy. Every loophole or complication of the Democracy has been taken to Indian Courts and been addressed with great progression. The role of Election Commission exercised, partially exercised or unexercised has been duly pointed out in the book. The speciality of the book is its simplicity. It works like a quick-course on Indian Democracy right from its basic legal structure, to its implementation, loopholes and suggestive vision.
The Author appears to have used Krishna’s voice through the dialogues between the authentic characters of Dhritrashthra and Sanjay, who witnessed Lord Krishna in Mahabharata. The pattern is enticing and commendable. One can find it ingeniously humorous as to the way Law and Court Judgmentsvis-à-vis Shlokas of Shrimad Bhagwad Geeta have been applied to current situations.The narratives presented in the book are strong, meaningfuland bang on target. The book presents chaotic circumstances but reposes faith in the Arjunas of Indian Society, who through their good deeds benefit and upgrade the society. Reading the book perfectly brings and bewilders the ancient characters of Mahabharata. The reaction of antique,

50 Amity Management Analyst Jan. - June, 2019
spiritual and kingly Maharaja Dhritrashthra to the current circumstances deliver eye-opening and out-worldly analysis. The equation of Sanjay and Dhritrashthra is also very captivating.
Electionomics is not only a must read but is a treasure and bookkeepers delight and is a readymade
reference of all the relevant legal provisions and judgments pertaining to Election Law. A must read for all students of Law, Civils Services aspirants, Mass Communication and anyone who wants to live with awareness about the current democratic machinery of India.
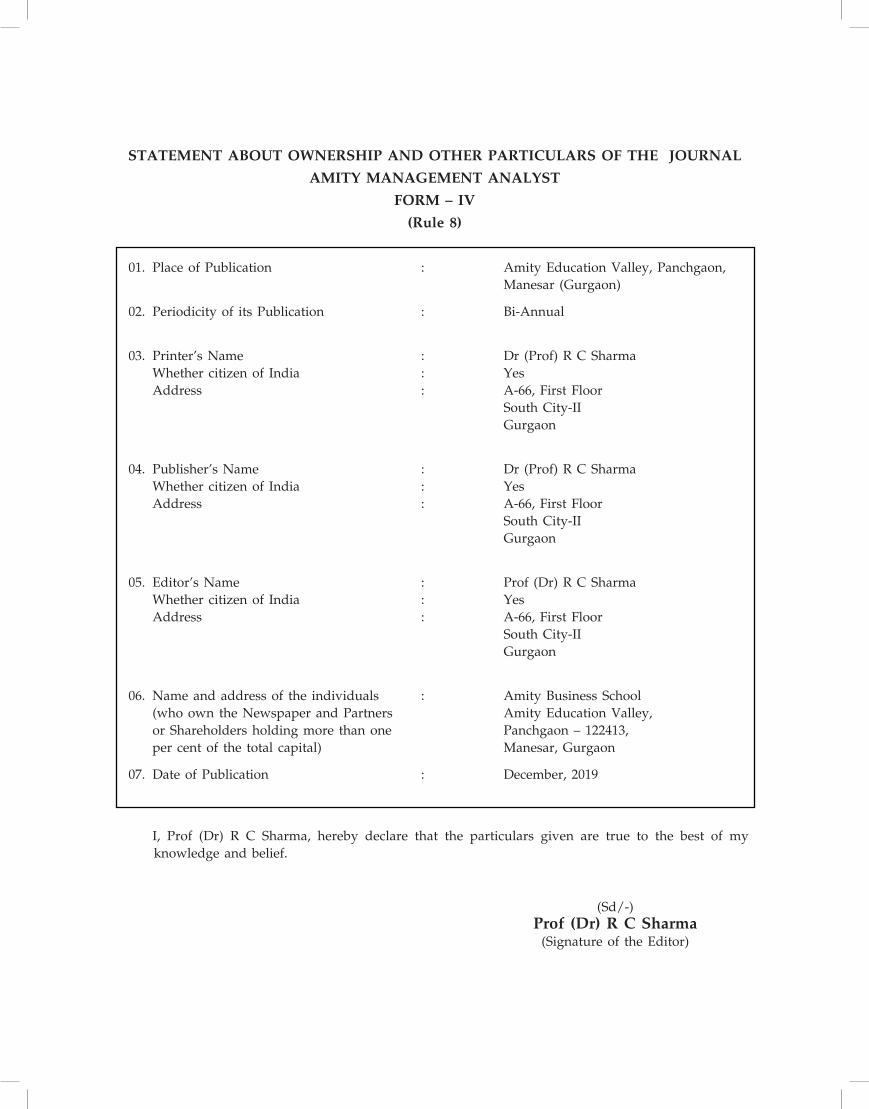
STATEMENT ABOUT OWNERSHIP AND OTHER PARTICULARS OF THE JOURNAL
AMITY MANAGEMENT ANALYST
FORM – IV
(Rule 8)
01. Place of Publication : Amity Education Valley, Panchgaon, Manesar (Gurgaon)
02. Periodicity of its Publication : Bi-Annual
03. Printer’s Name : Dr (Prof) R C Sharma Whether citizen of India : Yes Address : A-66, First Floor South City-II Gurgaon
04. Publisher’s Name : Dr (Prof) R C Sharma Whether citizen of India : Yes Address : A-66, First Floor South City-II Gurgaon
05. Editor’s Name : Prof (Dr) R C Sharma Whether citizen of India : Yes Address : A-66, First Floor South City-II Gurgaon
06. Name and address of the individuals : Amity Business School (who own the Newspaper and Partners Amity Education Valley, or Shareholders holding more than one Panchgaon – 122413, per cent of the total capital) Manesar, Gurgaon
07. Date of Publication : December, 2019
I, Prof (Dr) R C Sharma, hereby declare that the particulars given are true to the best of my knowledge and belief.
(Sd/-) Prof (Dr) R C Sharma (Signature of the Editor)
Guidelines for Contributors
Amity Management Analyst(AMA) invites original research-based papers and management cases from both academicians and practitioners on topics addressing contemporary issues pertaining to the area of management and allied fields.
Guidelines to be followed for submissions by the contributors.
01. Manuscripts should be sent along with the authorization letter in favor of the Editor-in-Chief that it may be published after necessary editing and the copyright shall remain with the AMA.
02. Nature of Submission:
o Full length articles (5000–8000 words): Original high-quality research papers.
o Management Cases (5000–7000 words exclusive of teaching notes).
o Interview of renowned academician/ corporate personnel- (4000-5000 words with the consent letter of the interviewee)
Manuscripts should be submitted by electronic mail with the cover page bearing only title of the paper and author (s) names, designations, official addresses, phone/ fax numbers and e-mail addresses. The title page should clearly mention the name of corresponding author who will be handling communications at all stages of refereeing and publication, even post-publication.
03. Abstracts: All the manuscripts should include an abstract of about 150 to 200 words with five keywords. It shall cover purpose of the study, methodology used, results, uniqueness, and implications.
04. Footnotes: All footnotes should be indicated by serial numbers in the text and literature cited should be detailed at the end of the paper..
05. Tables and Figures: Tables/ Figures should be placed within the text. Table should contain the detail of the source and unit of messurement. The heading of the tables should be left aligned. A punctuation mark (:) i.e. Colon should be used after the numbering of the table.
Ex. Table 1: summary of the review.
06. References: For all sources APA format to be used. Place the references at the end of the manuscript. For more than one publication by the same author, list them in chronological order, with the older item first. For more than one publication in one year by the same author, use small (lower case) letters to distinguish them (e.g., 1980a, 1980b). Following are some hypothetical examples:
Book – Robert, S (1988), Managerial Effectiveness and Quality of Worklife: India Insights. New Delhi Tata McGraw Hill Publishing Co. Ltd.
Journal- Manikutty, S (1997), “Telecom Services in Urban and Corporate Segments: A Consumer Perspective” Vikalpa, Vol. 22, No.3, pp. 15-28
07. No stops after abbreviations (UK, USA, MBA, etc.)
08. Use double quotes throughout. The use of single quotes to be restricted for use within double quotes, e.g., “In the words of Churchill, ‘Anyone can suggest you when you are right; friends are there to support you when you are wrong’” Quotations in excess of 50 words should be separated from the text with a line space above and below and indented on the left. Quotes should be cited accurately from the original source, should not be edited and should give the page umbers of the original publication.
09. Use of italics and diacriticals should be minimized, should be kept to the minimum and should be consistent.
10. An author will receive a complimentary copy of the issue in which his/ her paper is published.
11. Manuscripts and all editorial correspondence should be e-mailed at [email protected]

Subscription FormI wish to subscribe / renew my subscription to “Amity Management Analyst” for 1/2/3 years(s). A bank draft/cheque bearing no. ____________ dated _________________ for Rs/US$____________ drawn in favour of “Amity Business School Manesar” towards subscription for ________________ years is enclosed.
Name _____________________________________________________________________________________
Address _____________________________________________________________________________________
_____________________________________________________________________________________
City _____________________________________ Pin ___________________________________________
Country _____________________________________________________________________________________
Phone _____________________________________________________________________________________
_____________________________________ Fax ___________________________________________
E-mail _____________________________________________________________________________________
Category 1 year 2 years 3 years
Indian (in Rs.)
Institutions 400 750 1000
Individuals 300 550 800
Alumni 200 300 500
Students 200 300 500
Foreign (in US$)
Air-Mail 75 125 170
Sea-Mail 60 100 135
Signature with date
Please send the amount by DD/Crossed account payee cheque favouring“Amity Business School, Manesar” for timely receipt of the Journal.For outstation cheques, please add Rs 30 towards bank charges.
