amitabh kundu research and information system for
TRANSCRIPT

Amitabh Kundu Research and Information System for
Developing Countries
The 94th Foundation Course for Trainee Civil Servants
Dr MCR HRD Institute, Government of Telangana, Hyderabad
The 11th September 2019

2
United States
China
EU
India
Others
Other Asia Japan
2000 2042 2003 2006 2009 2012 2015 2018 2021 2024 2027 2030 2033 2036 2039 2045 2048
0%
10%
20%
30%
40%
50%
60%
70%
80%
90%
100%

3
United States
China
EU
India
Others
Other Asia Japan
2000 2042 2003 2006 2009 2012 2015 2018 2021 2024 2027 2030 2033 2036 2039 2045 2048
0%
10%
20%
30%
40%
50%
60%
70%
80%
90%
100%

0
10
20
30
40
50
60
70
80
9019
50
1955
196
0
196
5
1970
1975
198
0
198
5
199
0
199
5
200
0
200
5
2010
2015
2020
2025
2030
2035
204
0
204
5
2050
% o
f U
rban
Po
pu
lati
on
Trend in the Percentage of Urban Population in India and China
China India

0
0.5
1
1.5
2
2.5
3
Africa Latin
America
Asia
70-90
90-2020

0
0.5
1
1.5
2
2.5
3
3.5
4
East Asia China Asia
70-90
90-2000
70-90 90-2020

2200
2300
2400
2500
2600
2700
2800
Urban Population in Asia 2025
0
0.5
1
1.5
2
2.5
Growth in Urban Population in
Projected Urban Population for Asia in 2025 and its Growth Rate during 2025-30 as given in World Urbanization Prospects
WUP Revision 1995
WUP Revision 2015

0
0.5
1
1.5
2
2.5
3
3.5
WUP 1995 WUP 2004 WUP 2008 WUP 2010 WUP 2012
Ra
tes o
f G
row
th
Growth Rates of Urban Population in India as Projected in World Urbanisation Prospects (WUP)
2025-30
2045-50

0.00
0.50
1.00
1.50
2.00
2.50
3.00
3.50
WUP 1996 WUP 2010
Urban Growth 2000-05
3.16
2.37
Urbban Growth Rate 2025-30
Projected Urbanisation Level for India in 2020 and its Growth Rate during 2025-30 as given in World Urbanization Prospects


Census years
1971 1981 1991 2001 2011
Total 29.1 30.3 27.4 30.1 37.5
Male 17.5 17.2 14.7 17.0 22.6
Female 41.7 44.3 41.2 44.6 53.2
Table 1b: Percentage of migrants (POLR) in the population as per decennial censuses Source: Compiled from Census tables on Migration.
Include estimated figures of J&K an Assam where applicable


Country National Census Agglomeration Index
UNPD (WUP2011) World Bank WDR 2009
Bangladesh 23.2 48.0
India 28.7 52.4
Pakistan 33.2 53.6
Sri Lanka 15.7 38.2
China 36.0 37.0

Europe Africa Less
Developed
Countries
World
Average
Developed
Countries
Asia South
Central
Asia
India
Percentage of Population in Cities with Population over 5 million to Total Urban
Population
7.5 9 15 15.5 16 18 23 23.5
Implications of top heavy urban structure: high infrastructural cost, energy consumption, regional disparity and threat to sustainable development.

Proportion of urban population in different size categories,
1901–2001
0%
25%
50%
75%
100%
1901 1911 1921 1931 1941 1951 1961 1971 1981 1991 2001 2011
Class I Class II Class III Class IV Class V Class VI

Trends in all-India average monthly per capita consumption at constant
prices (Rs.) 1972-73 to 2011-12
0.0
20.0
40.0
60.0
80.0
100.0
120.0
140.0
160.0
1972-73 1977-78 1983 1987-88 1993-94 1999-00 2004-05 2009-10 2011-12Rural Urban


Bunker fuels are used for international transport is 3.1% of global emissions. Statistical differences between the global estimates and sum of national totals are 1.2% of global emissions.
Source: CDIAC; Le Quéré et al 2016; Global Carbon Budget 2016

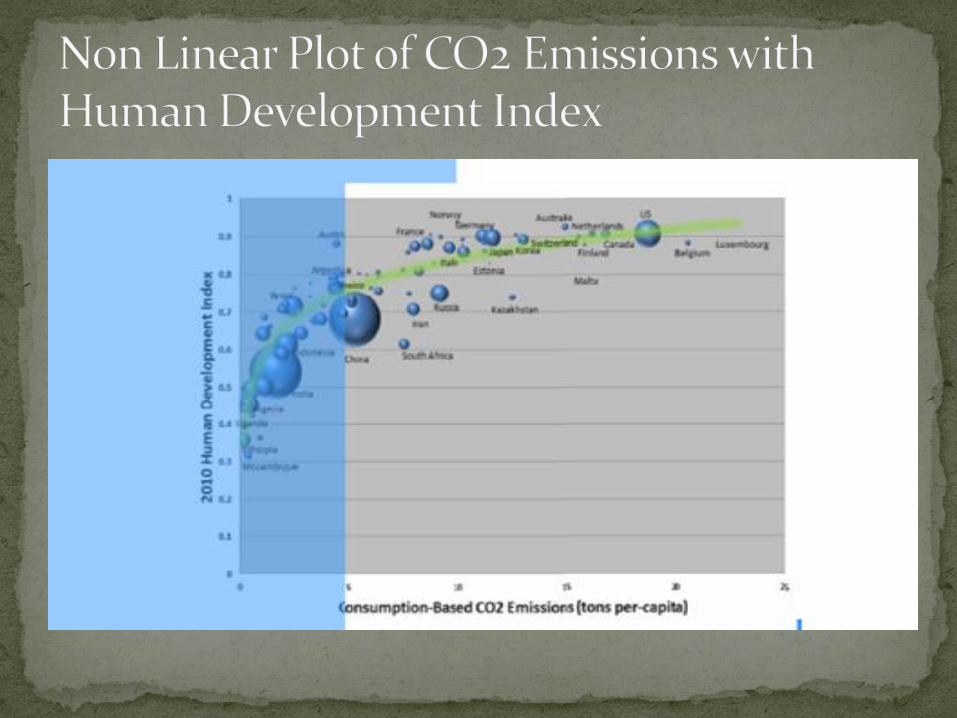
Regressing energy consumption on PCI and HDI for 1982 and 2002 using the data for UNDP
Three categories of countries (a) Below 1,000 KOE
(b) Between 1000 KOE and 3000 KOE and (c) Above 3000 KOE ( 60, 30 and 32 countries respectively)
(c) Relationship strong and positive for low KOE, low for medium an none for high KOE countries
(d) Relation over time remains strong in 2002 but becomes weak for others

Linear Functions relating Level of Urbanization with Per Capita Income
% U
rban
Po
pu
lati
on
Gross National Income (at constant prices of 2005, PPP )


Power Plant Type Cost $/kW-hr
Coal with CCS $0.12-0.13
CC Natural Gas $0.05
CC with CCS $0.075
Nuclear $0.093
Wind onshore $0.059
Wind offshore $0.139
Solar PV $0.063
Solar Thermal $0.165
Geothermal $0.045
Biomass $0.095
Hydro $0.062
COST COMPARISON OF ENERGY SOURCES 2018 Adapted from US DOE2
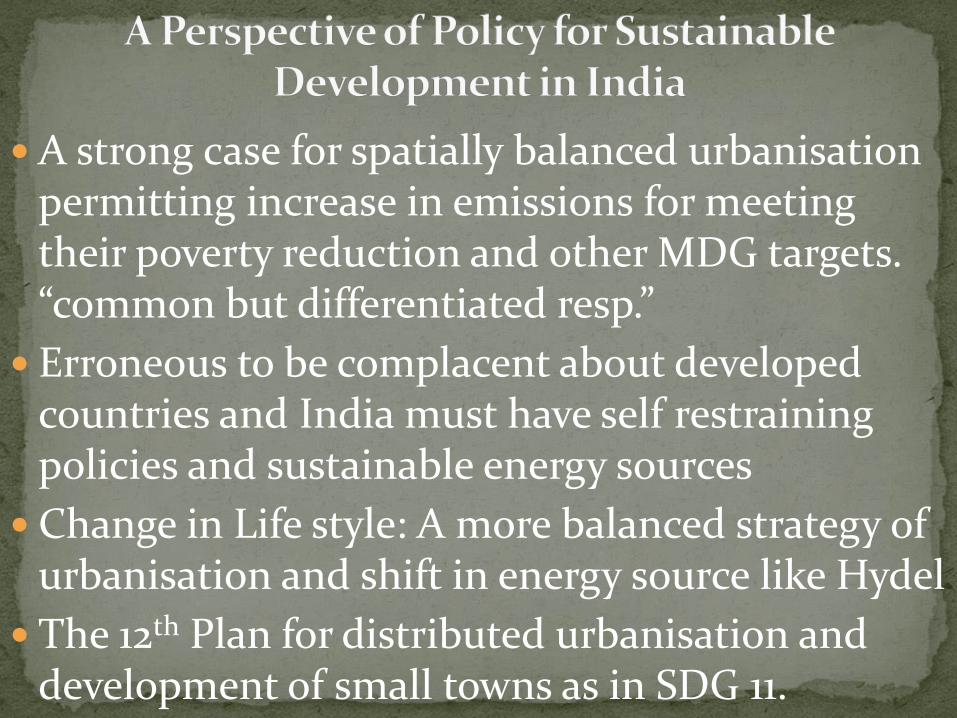
A strong case for spatially balanced urbanisation permitting increase in emissions for meeting their poverty reduction and other MDG targets. “common but differentiated resp.”
Erroneous to be complacent about developed countries and India must have self restraining policies and sustainable energy sources
Change in Life style: A more balanced strategy of urbanisation and shift in energy source like Hydel
The 12th Plan for distributed urbanisation and development of small towns as in SDG 11.

The End