amino acid analysis of mammalian cell culture …...4 on analysis day, the samples were thawed,...
TRANSCRIPT

Application benefits• Provides amino acid analysis that is simpler and less expensive than analysis
by mass spectrometer
• Allows for a long column lifetime of over 2000 injections
IntroductionMost biopharmaceuticals are therapeutic proteins produced in host cells modified by recombinant DNA technology. Mammalian cells, especially Chinese hamster ovary (CHO) cells, are the host for more than half of all therapeutic proteins. Mammalian cells require amino acids for protein synthesis, as a nitrogen source, and as intermediates in metabolic pathways. The relative concentrations of supplemental amino acids affect the equilibria of metabolic pathways, making consumption over time difficult to predict. Frequent monitoring of the amino acid concentrations in bioreactors maximizes production efficiency.
Authors Katherine Lovejoy, Susanne Fabel, Mirko Pietsch, Soo Hyun Park, Frank Steiner
Thermo Fisher Scientific, Germering, Germany
Keywords AccQ –Tag™, protein hydrolysate analysis, ACQ, pre-column derivatization, bioprocessor, OPA-FMOC
Amino acid analysis of mammalian cell culture medium by liquid chromatography with UV and fluorescence detection and derivatization with 6-aminoquinolyl-N-hydroxysuccinimidyl carbamate
APPLICATION NOTE 73057
GoalAmino acid analysis by pre-column derivatization with the AQC reagent demonstrated over a one-year period with samples from a bioreactor in active production
2
Most amino acids do not have a strong UV chromophore, which impedes detection by UV. They are similar in structure, which complicates chromatographic separation. Selective modification of the amine functional group of amino acids with a chromophore and/or fluorophore differentiates them from the matrix. Furthermore, the modification facilitates chromatographic separation because of the addition of a hydrophobic moiety that improves retention by reversed phase of the otherwise poorly retained amino acids. A powerful reagent for pre-column derivatization is 6-aminoquinolyl-N-hydroxysuccinimidyl carbamate (AQC) because of the stability of AQC-derivatized amino acids and the reproducibility of the derivatization reaction with both primary and secondary amino acids.1
The AQC reagent reacts with primary and secondary amino acids to form stable UV-active and fluorescent derivatives. In this method, manual pre-column derivatization is followed by separation with reversed phase UHPLC. A dataset that reflects one year of daily use of this method with serum-free cell culture medium samples is described. Besides analysis of amino acids in cell culture medium, this method is also intended for use with standards, protein or peptide hydrolysates, fermentation broth, food, and animal feed. This method has not been tested with physiological samples. Ready-to-use sequence generation, instrument methods, devices settings and data processing methods are provided in the eWorkflow™ available on Thermo Scientific™ AppsLab. These tests include resolution, linearity, derivatization, reproducibility, and accuracy. Long term reliability data for this method are shown as well as intra-day validation statistics.
Experimental Chemicals for derivatization• 6-Aminoquinolyl-N-hydroxysuccinimidyl carbamate
(CAS 148757-94-2) (Synchem.de P/N s041)
• Anhydrous acetonitrile, 30 mL (Applied Biosystems™ P/N 400060)
• Borate buffer, (1 M diluted to 50 mM), pH 8.5, 500 mL (Thermo Scientific™ Pierce™ P/N 28341)
• Thermo Scientific™ Pierce™ Amino Acid Standard H, hydrolysates standard, 10 × 1 mL ampules (P/N 20088)
Chemicals for chromatography• Deionized water, 18.2 MΩ·cm resistivity or higher
(P/N N/A)
• Acetonitrile, Fisher Scientific™ Optima™ LC/MS grade (P/N A955)
• Formic acid, Fisher Scientific™ Optima™ LC/MS grade (P/N A117)
• Ammonium formate, Fisher Scientific™ Optima™ LC/MS grade (P/N A115)
Sample handling• Thermo Scientific™ Digital Heating Cooling Drybath
(P/N 88880030)
• Fisherbrand™ Mini Centrifuge (P/N 12-006-901)
• Thermo Scientific™ Orion 3 Star™ pH Benchtop Meter (P/N 13-644-928)
• Fisher Scientific™ Fisherbrand™ Mini Vortex Mixer (P/N 14-955-152)
• Thermo Scientific™ Finpipette™ F1 Variable Volume Single-Channel Pipettes: 100–1000 µL, 10–100 µL, 1–10 µL (P/N 4641100N, 4641070N, 4641030N)
• High recovery HPLC vials, e.g. 9 mm Screw Thread Vial 200 µL, Fused Insert-Gold grade glass (P/N 02-FISVG)
• HPLC vial caps with closed septum, e.g. 9 mm Open Top Short Screws AVCS Cap, 6 mm hole (P/N 9-SCK(B)-ST1)
• 1.8 mL HPLC vials and screw caps, for preparing standards (P/N 2-SVWGKST-CPK)
• Fisher Scientific™ Fisherbrand™ Microcentrifuge Tubes, 0.6 mL (P/N 02-681-273)
InstrumentationThermo Scientific™ Vanquish™ Flex UHPLC system consisting of:
• Vanquish System Base (P/N VF-S01-A-02)
• Vanquish Binary Pump F (used in long-term test) (P/N VF-P20-A or
• Vanquish Quaternary Pump F VF-P10-A-01 (P/N VF-P20-A)
• Vanquish Autosampler FT (P/N VF-A10-A-02)

3
• Vanquish Column Compartment H (P/N VH-C10-A-02)
• Vanquish Fluorescence Detector F, with micro biocompatible flow cell, 2 µL (P/N VF-D50-A, and 6079.4330)
• Vanquish Variable Wavelength UV/Vis Detector F, with semi-micro biocompatible flow cell, 2.5 µL, VF-D4 (P/N VF-D40-A and 6077.0300)
All intra-system connections are made with Vanquish System Viper capillaries.
Preparation of standardsWhile testing this method, background contamination of glycine, serine, aspartate, and glutamate was of concern. Because the lab environment can be a source of amino acid contamination, careful preparation of the standards and samples was critical. Reagents were purchased especially for this analysis and were kept separate from other laboratory reagents to prevent problems caused by contaminated pipette tips. Uncontaminated pipette tips and vials were used for all solutions and eluents. The standard solution was prepared starting with the Amino Acid Standard H, which contains 2.5 mM of each
of 16 amino acids (Ala, Arg, Asp, Glu, Gly, His, Ile, Leu, Lys, Met, Phe, Pro, Ser, Thr, Tyr, and Val), (NH4)2SO4, and 1.25 mM of cystine (the oxidized, dimer form of cysteine). Additionally, 2.5 mM solutions of five more amino acids were prepared in 25 mL volumetric flasks according to Table 1. The stock solutions and calibration standards were stable for one month at -20 °C. The unopened ampules of Amino Acid Standard H can be stored for one year at -20 °C. The final supplemented amino acid standard solution containing 22 amino acids and (NH4)2SO4 was prepared in a 1.8 mL HPLC vial as shown in Table 2.
Eight calibration standard levels were produced by diluting the 250 pmol/µL standard with water as shown in Table 3. Dilutions were made in a 1.8 mL HPLC vial.
Sample preparation and check sample preparationDaily aliquots of cell culture medium were taken from a bioreactor that was producing monoclonal antibodies in CHO cells. The samples were centrifuged and the cell culture supernatant was stored at -20 °C until analysis.
Table 1. Preparation of stock solutions of individual amino acids for supplementation of the commercially available 17-amino acid standard
Amino acidMolecular weight
[g/mol]Weighed amount
[mg]Volume
[mL] Concentration
Asparagine 132.1 8.26 25 2.5 mM
Glutamine 146.1 9.13 25 2.5 mM
Hydroxyproline 131.1 8.19 25 2.5 mM
Norvaline 117.2 7.32 25 2.5 mM
Tryptophan 204.2 12.76 25 2.5 mM
Table 2. Preparation of supplemented amino acid standard stock solution with final concentration of 250 pmol/µL (except cystine 125 pmol/µL). On a mass basis, the concentration is between 0.019 and 0.051 mg/mL, depending on the molecular weight of the amino acid.
Solution Concentration Volume [µL]
Amino Acid Standard H 2.5 mM 100
Asparagine stock solution 2.5 mM 100
Glutamine stock solution 2.5 mM 100
Tryptophan stock solution 2.5 mM 100
Norvaline stock solution 2.5 mM 100
Hydroxyproline stock solution 2.5 mM 100
Water n.a. 400
Amino acid standard (17+ 5 amino acids) stock solution250 pmol/µL (between 0.019
and 0.51 mg/mL)1000
4
On analysis day, the samples were thawed, vortexed, and diluted 100-fold with ultrapure water such that the concentrations of all amino acids of interest were between 2.5 and 250 pmol/µL. The diluted samples were filtered through a 0.2 µm membrane filter.
Although the analysis of free amino acids in cell fermentation broth requires only filtration and, in some cases, protein precipitation, the analysis of amino acid content in other types of samples such as peptides, protein, food, nutritional supplements, or animal feed may require other special sample preparation steps, such as acidic or basic hydrolysis. Protocols are available in the literature and are not discussed in this work.
A standard at a concentration of 100 pmol/µL was used as the check sample to evaluate accuracy during the initial method validation.
Pre-column derivatizationA 4 mg portion of the AQC reagent in a 2 mL amber glass screw-top vial was solubilized by adding 1 mL anhydrous acetonitrile and alternately vortexing and heating to 80 °C in a heat block for a few minutes until dissolved. The solution was stored at room
Table 3. Preparation of calibration standards
temperature and was freshly prepared once per week. Routine storage of this solution over five days at room temperature did not result in any visible precipitation or notable decrease in derivatization efficacy.
The borate buffer, commercially available as a 1 M solution, was diluted to 50 mM by adding 50 µL buffer to 950 µL water.
Three samples were prepared for each sample of filtered cell culture supernatant and 28 samples were prepared for the standards, shown in Table 4, that were derivatized for generation of the calibration curve and reproducibility data. Specifically, three replicates of each of the 0, 2.5, 5, 10, 25, and 50 pmol/µL calibration standards; six replicates of the 100 pmol/µL standard; and four replicates of the 250 pmol/µL standard were derivatized. The six replicates of the 100 pmol/µL standard were used for the reproducibility test and the fourth replicate of the 250 pmol/µL standard was used to generate the test chromatogram (see next section). A 96-well hard-shell PCR plate, covered with film after the derivatization step, or high-recovery HPLC vials with 200 µL inserts were used.
Calibration standardFinal concentration
[pmol/µL]Volume of stock solution
(250 pmol/µL) [µL]Volume of water
[µL]Level 8 250 500 0
Level 7 100 200 300
Level 6 50 100 400
Level 5 25 50 450
Level 4 10 20 480
Level 3 5 10 490
Level 2 2.5 5 495
Level 1 0 0 500

5
Table 4. Overview of standards and samples to be derivatized
Derivatization was performed in a 0.6 mL polypropylene microcentrifuge tube by adding 70 µL of 50 mM borate buffer (pH 8.5) to 10 µL of the diluted sample and pipetting up and down to mix. A 20 µL portion of the 4 mg/mL AQC reagent was then added and mixed by pipette. The derivatization occurs immediately after addition of AQC. If a 96-well PCR plate was used, it was sealed with a plastic foil designed for use with HPLC. Alternatively, vials were securely closed with a screw cap. Samples were then heated for 10 min at 55 °C on a heat block to convert a di-derivatized product of tyrosine to the main, singly derivatized product.1 If this kinetic conversion step is omitted and the sample is simply left at room temperature, the unstable di-derivatized product reverts to the desired, singly derivatized tyrosine product with a half-life of about an hour. Heating has no effect on the yield of the other amino acids.1
After cooling to room temperature, the samples were used for HPLC analysis. Samples could be stored between +2 and +8 °C for two days after derivatization without changes in their measured concentration. After two days, response decreased significantly and samples were discarded.
Mobile phase preparationEluents were prepared using HPLC quality reagents and buffers as described in Table 5. Buffer-containing eluents were filtered before use. The pH electrode was carefully calibrated before use and the pH adjustment of Eluent A was made to within ±0.04 pH. A deviation of as little as ±0.1 pH resulted in overlapping peaks due to changes in retention times.
Standard Replicates of derivatization Samples
Supplemented Amino Acid Standard Level 1 (0 pmol/µL)
0-1 0-2 0-3
28
Supplemented Amino Acid Standard Level 2 (2.5 pmol/µL)
2_5-1 2_5-2 2_5-3
Supplemented Amino Acid Standard Level 3 (5 pmol/µL)
5-1 5-2 5-3
Supplemented Amino Acid Standard Level 4 (10 pmol/µL)
10-1 10-2 10-3
Supplemented Amino Acid Standard Level 5 (25 pmol/µL)
25-1 25-2 25-3
Supplemented Amino Acid Standard Level 6 (50 pmol/µL)
50-1 50-2 50-3
Supplemented Amino Acid Standard Level 7 (100 pmol/µL) + reproducibility
100-1 100-2 100-3 100-4 100-5 100-6
Supplemented Amino Acid Standard Level 8 (250 pmol/µL)
250-1 250-2 250-3 250-4
Table 5. Eluents preparation details
Eluent Content Preparation
A
50 mM ammonium formate, pH 2.9
A 3.153 g portion of ammonium formate was dissolved in 900 mL H2O in a 1000 mL graduated cylinder. The pH was carefully lowered to pH 2.9 with about 8 mL of formic acid to within ±0.04 pH. Water was added to 1000 mL and the buffer was filtered through a 0.2 µm filter.
B Acetonitrile
6
Chromatographic conditionsThe chromatographic conditions for the Vanquish Flex Binary system used over one year with serum- free mammalian cell culture medium are described in Table 6. The flow rate for this long-term use case (0.65 mL/min) was chosen to ensure that the commonly observed increase in backpressure over the lifetime of a column did not exceed the 1000 bar pressure limit of the system. A flow rate of 0.89 mL/min is generally possible with a new column, which allows the gradient to be two minutes shorter. A method transfer tool3 was used to adapt the gradient to a given flow rate.
A Thermo Scientific™ Chromeleon™ eWorkflow™ file including instrument method details is provided in AppsLab for this application note. All intra-system connections were made using Thermo Scientific™ Viper™ Fingertight Fitting capillaries that are in the system’s ship kit. The post-column cooler was not installed. The Vanquish autosampler needs no washing step between injections for this application due to its technical design, but an autosampler washing step during instrument shutdown is recommended.
Chromatography data systemThe Thermo Scientific™ Chromeleon™ 7.2.8 CDS was used for data acquisition and analysis.
Analytical tests performed, initial method validationTwo equilibration runs were performed without injection. Then, as a system suitability test (SST), three injections of the test sample (250-4 in Table 4) were made and compared with a reference chromatogram (Figure 1) to ensure the method was working properly. If the test chromatograms showed sufficient separation of all 22 amino acids, a calibration curve was generated by injecting each of the 24 derivatized standards (three derivatization reactions at each of eight calibration levels) once. After the calibration curve, a single run without injection was made to check for carryover. Derivatization reproducibility was checked by injections of three different 100 pmol/µL derivatization reactions and evaluating retention time and peak area RSD for histidine. Histidine elutes early in the chromatogram where creation of the shallow gradient is particularly challenging for the pump and the retention time reproducibility is worst. Reproducibility was checked by six injections from a single 100 pmol/µL sample and evaluating retention
Table 6. Chromatographic conditions for the Vanquish Flex Binary and Quaternary systems. The use of other instruments such as the Thermo Scientific™ UltiMate™ 3000(Bio)RS systems or other columns or flow rates requires manual adaption of this method.. The method transfer tool might be used.3
Pump: Vanquish Flex Binary (used in long-term test) or Vanquish Flex Quaternary UHPLC
Flow rate: 0.650 mL/min
Column: Thermo Scientific™ Acclaim™ Vanquish™ C18, 2.1 × 150 mm, 2.2 µm (P/N 071399-V) [recommended: Viper Inline Filter (P/N 2261-1045)]
Mobile phase: A: 50 mM Ammonium formate, pH 2.9 with formic acid (See Table 5 for preparation details.) B: Acetonitrile
Gradient: 0–0.548 min 0.5% B 0.548–5.342 min 0.5%–5.2% B 5.342–8.077 min 5.2%–9.2% B 8.077–8.626 min 9.2%–14.0% B 8.626–11.227 min 14.0%–19.2% B 11.227–13.696 min 19.2%–19.5% B 13.696–13.761 min 19.5%–90.0% B 13.761–14.377 min 90.0% B 14.377–14.446 min 90.0%–0.5% B 18.000 min 0.5% B
Column temp.: 45 °C (still air), easy mode, active preheater 45 °C
Autosampler temp.: 10 °C
Pump and autosampler rear seal wash: 10% methanol in water
Injection volume: 1 µL
Detector: Vanquish Variable Wavelength UV Detector with 2.5 µL biocompatible flow cell Optional: Vanquish FLD with 2 µL biocompatible flow cell
UV detector Detection at 260 nm, data collection parameters rate 50 Hz, response time 0.10 s
FLD detector Excitation at 266 nm, emission (optional) at 473 nm, sensitivity 3, filter wheel parameters: auto, data collection rate 50 Hz, standard lamp mode, response time 0.1 s, temperature control 35 °C
7
time and peak area of the histidine peak. Accuracy was checked by injecting the check sample of 100 pmol/µL five times and evaluating the result using the calibration curve. The amino acid concentration in the check sample was confirmed by an alternate analytical method.
After these 47 injections, unknown samples were analyzed by injecting three different derivatization reactions for each unknown sample.
Daily practice, analytical tests performedFor daily use, the sequence consisted of a single run with Type = “Blank”, one run of a derivatization reaction performed in the absence of amino acids (the reaction blank), one run of each of the eight calibration standards, one run of the reaction blank, one run of each of the unknown samples, and one last run of the reaction blank.
Standby methodA standby method kept the system running at a flow rate of 0.050 mL/min at the end of each sequence. A wash method, used periodically, flushed the system with a mixture of acetonitrile and water at a flow rate of 0.1 mL/min over several days every two weeks when the instrument was not used over a weekend. The B3 solvent channel delivered the wash solvent of
60/40 water/acetonitrile (v/v) through the right, normally acetonitrile-only pump head. In a binary pump, it is particularly important not to store the organic-delivering pump head in pure acetonitrile.
Results and discussionThis method has proven itself over a one-year test period with cell culture medium samples to be a robust and inexpensive solution to amino acid analysis. It produces stable retention times and allows for long column life. In particular, column lifetime is at least five times longer relative to the OPA/FMOC derivatization chemistry. The eluents are common and easily prepared. An optional module, the Thermo Scientific™ Vanquish™ Charger supports high throughput by expanding the autosampler capacity from four multiwell plates to 23 multiwell plates.
This method runs cost-effectively because it features a long column lifetime and flexible ordering of individual parts. The column, standard, HPLC, and solvents all conveniently come from the same source, Thermo Fisher Scientific. A typical chromatogram showing the fluorescence and UV channels for 22 amino acids is shown in Figure 1. All 22 amino acids are well-separated. Tryptophan is quantified on the UV channel, due to fluorescence quenching related to the proximity of the
Figure 1. Chromatogram showing fluorescence (blue, top) and UV (red, bottom) channels for a 250 pmol/µL standard containing 22 amino acids. Tryptophan is quantified on the UV channel only due to fluorescence quenching.
Resp
onse
[cou
nts]
TRP
DP1
Pro-
OH
HIS
ASN
SER
GLN
ARG
GLY
ASP
GLU TH
R
ALA
PRO
CYS
LYS
TYR
MET
VAL
NVA
ILE
LEU
PHE
Absorbance [mAU]
1530
70
250
500
1250
750
1000
3 4 5 8 10 12 14 15Time [min]
7.5e7
1.3e7
8.4e7
6.3e7
5.0e7
3.8e7
2.5e7
0.0e0
-5.8e6
8
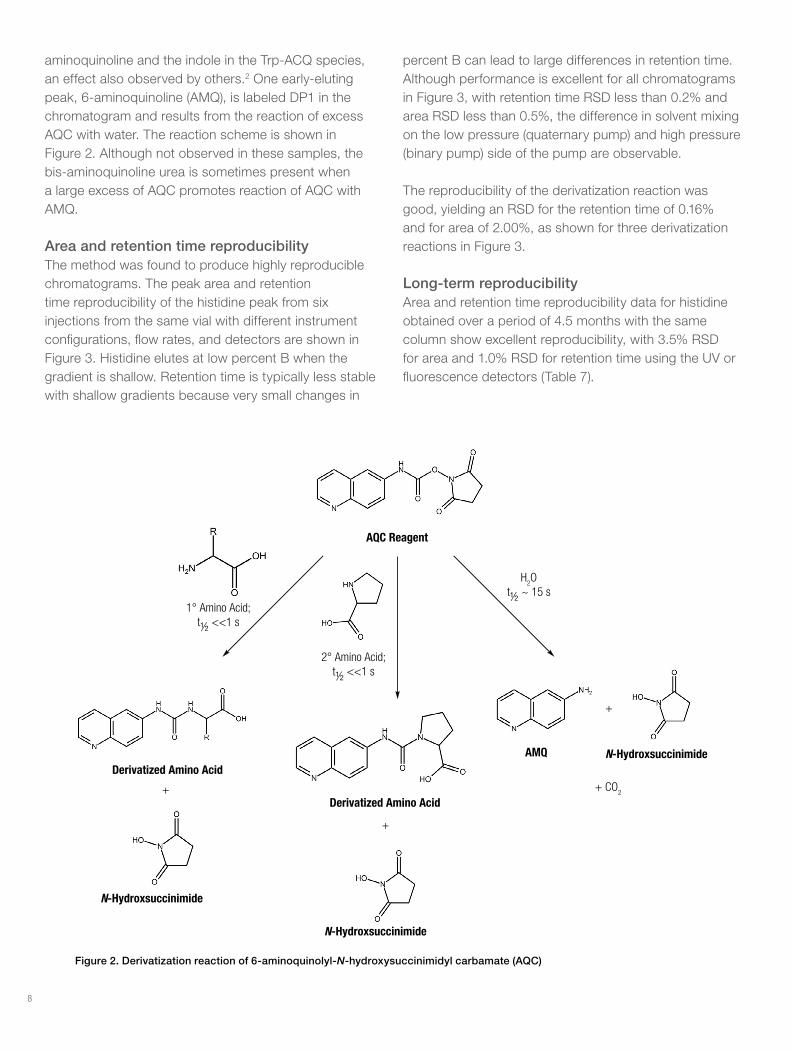
aminoquinoline and the indole in the Trp-ACQ species, an effect also observed by others.2 One early-eluting peak, 6-aminoquinoline (AMQ), is labeled DP1 in the chromatogram and results from the reaction of excess AQC with water. The reaction scheme is shown in Figure 2. Although not observed in these samples, the bis-aminoquinoline urea is sometimes present when a large excess of AQC promotes reaction of AQC with AMQ.
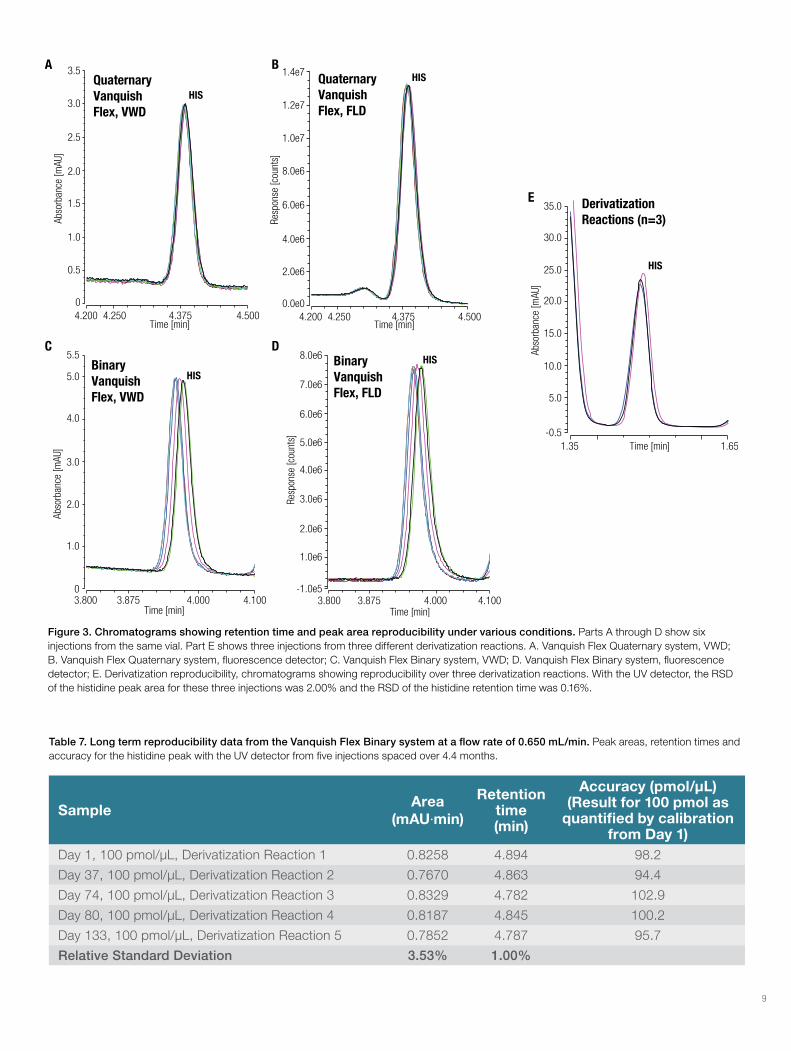
Area and retention time reproducibilityThe method was found to produce highly reproducible chromatograms. The peak area and retention time reproducibility of the histidine peak from six injections from the same vial with different instrument configurations, flow rates, and detectors are shown in Figure 3. Histidine elutes at low percent B when the gradient is shallow. Retention time is typically less stable with shallow gradients because very small changes in
percent B can lead to large differences in retention time. Although performance is excellent for all chromatograms in Figure 3, with retention time RSD less than 0.2% and area RSD less than 0.5%, the difference in solvent mixing on the low pressure (quaternary pump) and high pressure (binary pump) side of the pump are observable.
The reproducibility of the derivatization reaction was good, yielding an RSD for the retention time of 0.16% and for area of 2.00%, as shown for three derivatization reactions in Figure 3.
Long-term reproducibility Area and retention time reproducibility data for histidine obtained over a period of 4.5 months with the same column show excellent reproducibility, with 3.5% RSD for area and 1.0% RSD for retention time using the UV or fluorescence detectors (Table 7).
Figure 2. Derivatization reaction of 6-aminoquinolyl-N-hydroxysuccinimidyl carbamate (AQC)
N-Hydroxsuccinimide
N-Hydroxsuccinimide
Derivatized Amino Acid
N-HydroxsuccinimideAMQ
AQC Reagent
Derivatized Amino Acid+ CO
2
+
+
+
H2O
t½ ~ 15 s1° Amino Acid;
t½ <<1 s
2° Amino Acid;t½ <<1 s
9
Figure 3. Chromatograms showing retention time and peak area reproducibility under various conditions. Parts A through D show six injections from the same vial. Part E shows three injections from three different derivatization reactions. A. Vanquish Flex Quaternary system, VWD; B. Vanquish Flex Quaternary system, fluorescence detector; C. Vanquish Flex Binary system, VWD; D. Vanquish Flex Binary system, fluorescence detector; E. Derivatization reproducibility, chromatograms showing reproducibility over three derivatization reactions. With the UV detector, the RSD of the histidine peak area for these three injections was 2.00% and the RSD of the histidine retention time was 0.16%.
Table 7. Long term reproducibility data from the Vanquish Flex Binary system at a flow rate of 0.650 mL/min. Peak areas, retention times and accuracy for the histidine peak with the UV detector from five injections spaced over 4.4 months.
SampleArea
(mAU·min)
Retention time (min)
Accuracy (pmol/µL) (Result for 100 pmol as
quantified by calibration from Day 1)
Day 1, 100 pmol/µL, Derivatization Reaction 1 0.8258 4.894 98.2
Day 37, 100 pmol/µL, Derivatization Reaction 2 0.7670 4.863 94.4
Day 74, 100 pmol/µL, Derivatization Reaction 3 0.8329 4.782 102.9
Day 80, 100 pmol/µL, Derivatization Reaction 4 0.8187 4.845 100.2
Day 133, 100 pmol/µL, Derivatization Reaction 5 0.7852 4.787 95.7
Relative Standard Deviation 3.53% 1.00%
AQuaternary Vanquish Flex, VWD
BQuaternary Vanquish Flex, FLD
CBinaryVanquish Flex, VWD
DBinaryVanquish Flex, FLD
E Derivatization Reactions (n=3)
HIS
HIS
HIS
HIS
HIS
4.200 4.250 4.375Time [min]
4.500
Abso
rban
ce [m
AU]
2.5
0
0.5
1.0
3.0
2.0
1.5
3.5
4.200 4.250 4.375Time [min]
4.500
Resp
onse
[cou
nts]
1.4e7
4.0e6
1.2e7
1.0e7
8.0e6
6.0e6
0.0e0
2.0e6
1.35 Time [min] 1.65
25.0
-0.5
5.0
10.0
30.0
20.0
15.0
35.0
Abso
rban
ce [m
AU]
3.800 3.875 4.000Time [min]
4.100
Resp
onse
[cou
nts]
4.0e6
8.0e6
7.0e6
6.0e6
5.0e6
1.0e6
3.0e6
-1.0e5
2.0e6
Abso
rban
ce [m
AU]
4.0
0
1.0
3.0
2.0
5.0
5.5
3.800 3.875 4.000Time [min]
4.100

10
Figure 4. Chromatograms from the FLD channel of samples taken at three time points from a CHO bioreactor and diluted 100 times. Arginine is not present in these samples. Tryptophan was quantified on the UV channel.
QuantificationSamples taken on days 7, 9, and 11 of a bioreactor containing CHO cells that was actively producing a biopharmaceutical were quantified using calibration curves consisting of a single injection of each of eight standards. For a linear fit with offset, the coefficient of determination was above 0.999 for all 22 amino acids and greater than 0.9999 for 15 of the 22. Figure 4 shows chromatograms from the FLD channel for each of the three samples. Figure 1 shows the both the UV and FLD chromatograms, including the quantification of tryptophan by UV.
The results of quantification for each of the 22 amino acids are shown in four plots in Figure 5. The concentrations of all amino acids depend on consumption by cellular processes, incorporation into the protein product, decomposition, and the amino acid supplementation schedule. Glutamine, an important source of energy, carbon, and nitrogen, is not only consumed by the cells, but also decomposes over time at physiological pH. Alanine is both an essential amino acid and a waste product of cellular processes.
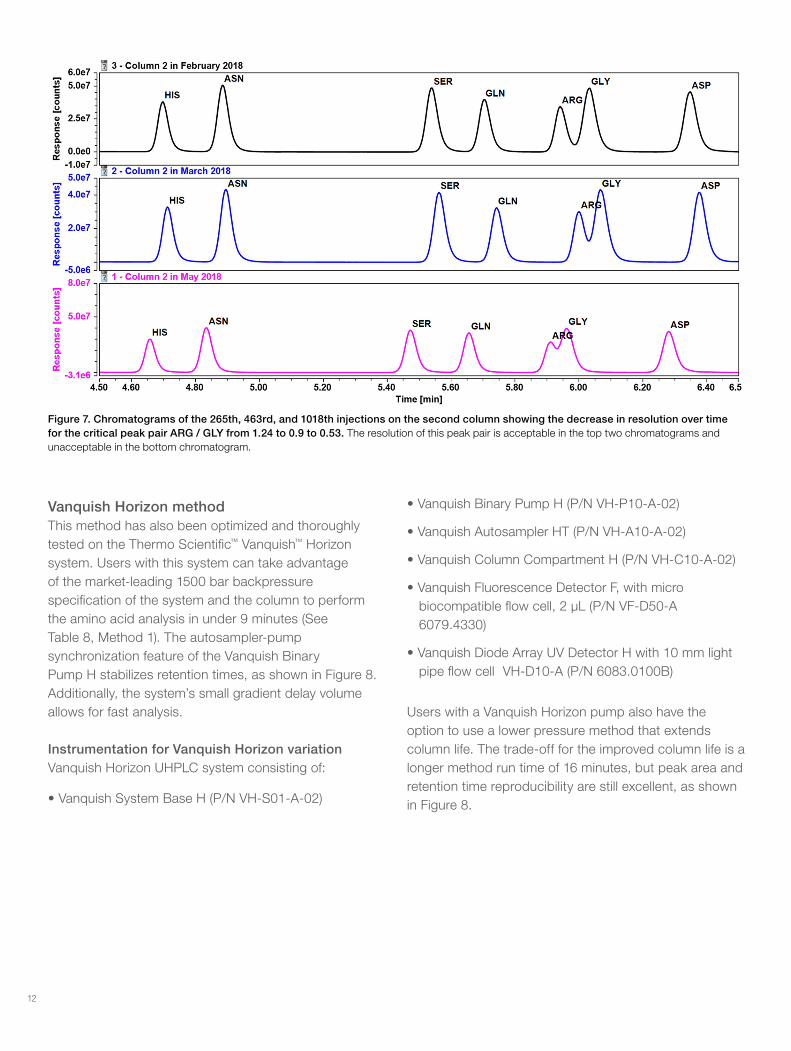
Column lifetimeThe lifetime of the Thermo Scientific™ Acclaim™ Vanquish™ C18 column was recorded for three different columns that were subjected to daily injections of standards and samples until the critical peak pair of arginine and glycine was not sufficiently resolved. Figure 6 shows resolution as a function of injection count for all three columns. Differences in injection count are attributable to the workload of the lab in a given period. For example, column 3 saw continuous use, whereas columns 1 and 2 went through numerous non-identical cycles of use, removal, and storage. Each column was from a different lot. Figure 7 depicts acceptable and unacceptable resolution and shows that column aging led to shorter retention times. Specifically, chromatograms of the 265th, 463rd, and 1018th injections on the second column show the decrease in resolution over time for the critical peak pair ARG / GLY from 1.24 to 0.9 to 0.53. A resolution of 0.53 was considered unacceptable. The increase in backpressure over the lifetimes of the columns was always less than 50 bar. Even when backpressure increased, the backpressure was always at least 200 bar under the specified pressure limits of the column (1500 bar) and, more critically, of the system (1000 bar in the case of Vanquish Flex UHPLC system). The column lifetime ranged from 730 injections for the shortest-lived column to more than 2200 injections for the longest-lived column.
DP1
Pro-OH
HIS
ASN
SER
GLN
GLY
ASP
GLU
THR
ALA
PRO
CYS
LYS
TYR
MET
VAL
NVA
ILE
LEU
PHE
Bioreactor, Day 7
Bioreactor, Day 9
Bioreactor, Day 11
Resp
onse
[cou
nts]
3 4 6 8 10 12 14Time [min]
1.0e6
4.0e6
3.0e6
2.0e6
0.0e0
-5.0e5

11
Figure 5. Four plots showing the concentration of 22 amino acids in the bioreactor. Samples were diluted 100-fold prior to analysis. Tryptophan was quantified on the UV channel.
Figure 6. Resolution of glycine and arginine as a function of injection count for three columns used for daily analysis of bioreactor medium. Data shown are for the Vanquish Flex Binary pump. Resolution was calculated according to the USP method.
0
100
200
300
400
500
600
Con
cent
ratio
n in
Bio
reac
tor
(mg/
L)
Pro-OHHISASNSERGLNARG
0
100
200
300
400
500
600
Con
cent
ratio
n in
Bio
reac
tor
(mg/
L)
GLYASPGLUTHRALA
0
100
200
300
400
500
600
Day 7 Day 9 Day 11
Con
cent
ratio
n in
Bio
reac
tor
(mg/
L)
PROCYSLYSTYRMET
0
100
200
300
400
500
600
Con
cent
ratio
n in
Bio
reac
tor
(mg/
L)
VALNVAILELEUPHETRP
Day 7 Day 9 Day 11
Day 7 Day 9 Day 11
Day 7 Day 9 Day 11
0
0.5
1
1.5
2
2.5
3
0 500 1000 1500 2000 2500
Rs o
f GLY
, AR
G (U
SP
met
hod
)
Injections (count)
Column 1
Column 2
Column 3
0.84
2.35
1.24
1.56
1.22
0.90
1.17
0.53 0.50
2.60
12
Figure 7. Chromatograms of the 265th, 463rd, and 1018th injections on the second column showing the decrease in resolution over time for the critical peak pair ARG / GLY from 1.24 to 0.9 to 0.53. The resolution of this peak pair is acceptable in the top two chromatograms and unacceptable in the bottom chromatogram.
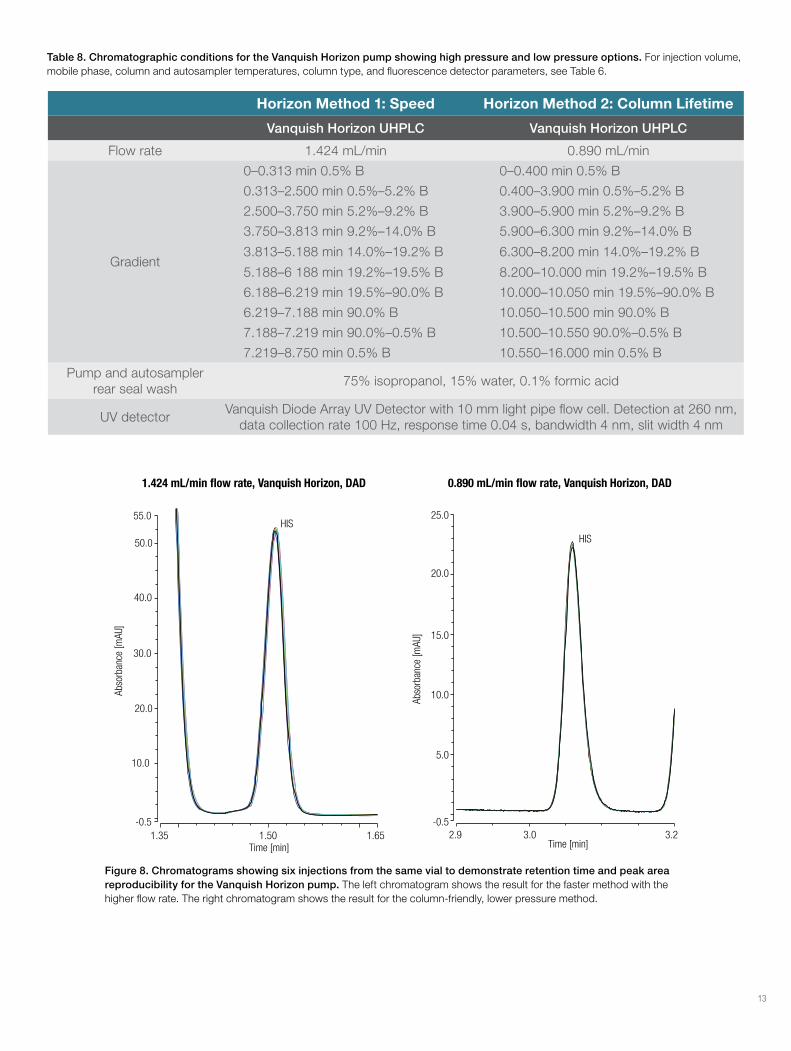
Vanquish Horizon methodThis method has also been optimized and thoroughly tested on the Thermo Scientific™ Vanquish™ Horizon system. Users with this system can take advantage of the market-leading 1500 bar backpressure specification of the system and the column to perform the amino acid analysis in under 9 minutes (See Table 8, Method 1). The autosampler-pump synchronization feature of the Vanquish Binary Pump H stabilizes retention times, as shown in Figure 8. Additionally, the system’s small gradient delay volume allows for fast analysis.
Instrumentation for Vanquish Horizon variationVanquish Horizon UHPLC system consisting of:
• Vanquish System Base H (P/N VH-S01-A-02)
• Vanquish Binary Pump H (P/N VH-P10-A-02)
• Vanquish Autosampler HT (P/N VH-A10-A-02)
• Vanquish Column Compartment H (P/N VH-C10-A-02)
• Vanquish Fluorescence Detector F, with micro biocompatible flow cell, 2 µL (P/N VF-D50-A 6079.4330)
• Vanquish Diode Array UV Detector H with 10 mm light pipe flow cell VH-D10-A (P/N 6083.0100B)
Users with a Vanquish Horizon pump also have the option to use a lower pressure method that extends column life. The trade-off for the improved column life is a longer method run time of 16 minutes, but peak area and retention time reproducibility are still excellent, as shown in Figure 8.
13
Table 8. Chromatographic conditions for the Vanquish Horizon pump showing high pressure and low pressure options. For injection volume, mobile phase, column and autosampler temperatures, column type, and fluorescence detector parameters, see Table 6.
Horizon Method 1: Speed Horizon Method 2: Column Lifetime
Vanquish Horizon UHPLC Vanquish Horizon UHPLC
Flow rate 1.424 mL/min 0.890 mL/min
Gradient
0–0.313 min 0.5% B 0–0.400 min 0.5% B
0.313–2.500 min 0.5%–5.2% B 0.400–3.900 min 0.5%–5.2% B
2.500–3.750 min 5.2%–9.2% B 3.900–5.900 min 5.2%–9.2% B
3.750–3.813 min 9.2%–14.0% B 5.900–6.300 min 9.2%–14.0% B
3.813–5.188 min 14.0%–19.2% B 6.300–8.200 min 14.0%–19.2% B
5.188–6 188 min 19.2%–19.5% B 8.200–10.000 min 19.2%–19.5% B
6.188–6.219 min 19.5%–90.0% B 10.000–10.050 min 19.5%–90.0% B
6.219–7.188 min 90.0% B 10.050–10.500 min 90.0% B
7.188–7.219 min 90.0%–0.5% B 10.500–10.550 90.0%–0.5% B
7.219–8.750 min 0.5% B 10.550–16.000 min 0.5% B
Pump and autosampler rear seal wash
75% isopropanol, 15% water, 0.1% formic acid
UV detectorVanquish Diode Array UV Detector with 10 mm light pipe flow cell. Detection at 260 nm,
data collection rate 100 Hz, response time 0.04 s, bandwidth 4 nm, slit width 4 nm
Figure 8. Chromatograms showing six injections from the same vial to demonstrate retention time and peak area reproducibility for the Vanquish Horizon pump. The left chromatogram shows the result for the faster method with the higher flow rate. The right chromatogram shows the result for the column-friendly, lower pressure method.
1.424 mL/min flow rate, Vanquish Horizon, DAD 0.890 mL/min flow rate, Vanquish Horizon, DAD
1.35 1.50 1.65 2.9 3.0 3.2
HIS
Time [min] Time [min]
Abso
rban
ce [m
AU]
Abso
rban
ce [m
AU]
HIS
50.0
25.0
-0.5
10.0
20.0
55.0
40.0
30.0
-0.5
5.0
20.0
15.0
10.0
For research use only. ©2019 Thermo Fisher Scientific Inc. All rights reserved. All trademarks are the property of Thermo Fisher Scientific and its subsidiaries unless otherwise specified. AccQ-Tag and related products are trademarked and owned by Waters Corporation. This information is presented as an example of the capabilities of Thermo Fisher Scientific products. It is not intended to encourage use of these products in any manners that might infringe the intellectual property rights of others. Specifications, terms and pricing are subject to change. Not all products are available in all countries. Please consult your local sales representatives for details. AN73057-EN 0819S
Find out more at www.thermofisher.com
Conclusion• Samples from a bioreactor containing mammalian cells
in active production were analyzed for amino acid content.
• Amino acid level quantification using pre-column labeling allows reproducible, sensitive characterization of complex samples.
• The Acclaim Vanquish C18 column allows for resolution of the ARG/GLY peak pair for an average of 1300 and up to 2200 injections, which is excellent durability for amino acid analysis.
• Three gradient options allow for customization of this method according to customer requirements using a variety of instrument configurations of the Vanquish UHPLC platform.
References
1. Cohen, S. A.; Michaud, D. P. Synthesis of a fluorescent derivatizing reagent, 6-aminoquinolyl-N-hydroxysuccinimidyl carbamate, and its application for the analysis of hydrolysate amino acids via high-performance liquid chromatography. Anal. Biochem. 1993, 211 (2), 279–287.
2. Reverter, M.; Lundh, T.; Lindberg, J. E. Determination of free amino acids in pig plasma by precolumn derivatization with 6-N-aminoquinolyl-N-hydroxysuccinimidyl carbamate and high-performance liquid chromatography. J. Chrom. B. 1998, 696, 1–8.
3. HPLC Method Transfer Calculator. Available at https://www.thermofisher.com/de/de/home/global/forms/industrial/lc-method-transfer-calculator.html