amg investor presentation november 2017
TRANSCRIPT
The image part with relationship ID rId2 was not found in the file.
AMG Advanced Metallurgical Group N.V.Investor Presentation November 2017
About AMG 4
CO2 Reduction 5
Strong Capital Structure 6
Critical Raw Materials 7
Critical Materials Price Trends 8
Critical Materials Prices: 10 Year Perspective 9
AMG Business Segments 10
Global Footprint 11
Health and Safety Focus 13
Financial Highlights 14
Strategy & Outlook 25
Key Products & End Markets 29
Appendix 35
TABLE OF CONTENTS
CAUTIONARY NOTE
THIS DOCUMENT IS STRICTLY CONFIDENTIAL AND IS BEING PROVIDED TO YOU SOLELY FOR YOUR INFORMATION BY AMG ADVANCED METALLURGICAL GROUP N.V. (THE “COMPANY”) AND MAY NOT BE REPRODUCED IN ANY FORM OR FURTHER DISTRIBUTED TO ANY OTHER PERSON OR PUBLISHED, IN WHOLE OR IN PART, FOR ANY PURPOSE. FAILURE TO COMPLY WITH THIS RESTRICTION MAY CONSTITUTE A VIOLATION OF APPLICABLE SECURITIES LAWS.
This presentation does not constitute or form part of, and should not be construed as, an offer to sell or issue or the solicitation of an offer to buy or acquire securities of the Company or any of its subsidiaries nor should it or any part of it, nor the fact of its distribution, form the basis of, or be relied on in connection with, any contract or commitment whatsoever.
This presentation has been prepared by, and is the sole responsibility of, the Company. This document, any presentation made in conjunction herewith and any accompanying materials are for information only and are not a prospectus, offering circular or admission document. This presentation does not form a part of, and should not be construed as, an offer, invitation or solicitation to subscribe for or purchase, or dispose of any of the securities of the companies mentioned in this presentation. These materials do not constitute an offer of securities for sale in the United States or an invitation or an offer to the public or form of application to subscribe for securities. Neither this presentation nor anything contained herein shall form the basis of, or be relied on in connection with, any offer or commitment whatsoever. The information contained in this presentation has not been independently verified. No representation or warranty, express or implied, is made as to, and no reliance should be placed on, the fairness, accuracy or completeness of the information or the opinions contained herein. The Company and its advisors are under no obligation to update or keep current the information contained in this presentation. To the extent allowed by law, none of the Company or its affiliates, advisors or representatives accept any liability whatsoever (in negligence or otherwise) for any loss howsoever arising from any use of this presentation or its contents or otherwise arising in connection with the presentation.
Certain statements in this presentation constitute forward-looking statements, including statements regarding the Company's financial position, business strategy, plans and objectives of management for future operations. These statements, which contain the words "believe,” “expect,” “anticipate,” “intends,” “estimate,” “forecast,” “project,” “will,” “may,” “should” and similar expressions, reflect the beliefs and expectations of the management board of directors of the Company and are subject to risks and uncertainties that may cause actual results to differ materially. These risks and uncertainties include, among other factors, the achievement of the anticipated levels of profitability, growth, cost and synergy of the Company’s recent acquisitions, the timely development and acceptance of new products, the impact of competitive pricing, the ability to obtain necessary regulatory approvals, and the impact of general business and global economic conditions. These and other factors could adversely affect the outcome and financial effects of the plans and events described herein.
Neither the Company, nor any of its respective agents, employees or advisors intend or have any duty or obligation to supplement, amend, update or revise any of the forward-looking statements contained in this presentation.
The information and opinions contained in this document are provided as at the date of this presentation and are subject to change without notice.
This document has not been approved by any competent regulatory or supervisory authority.
3
4
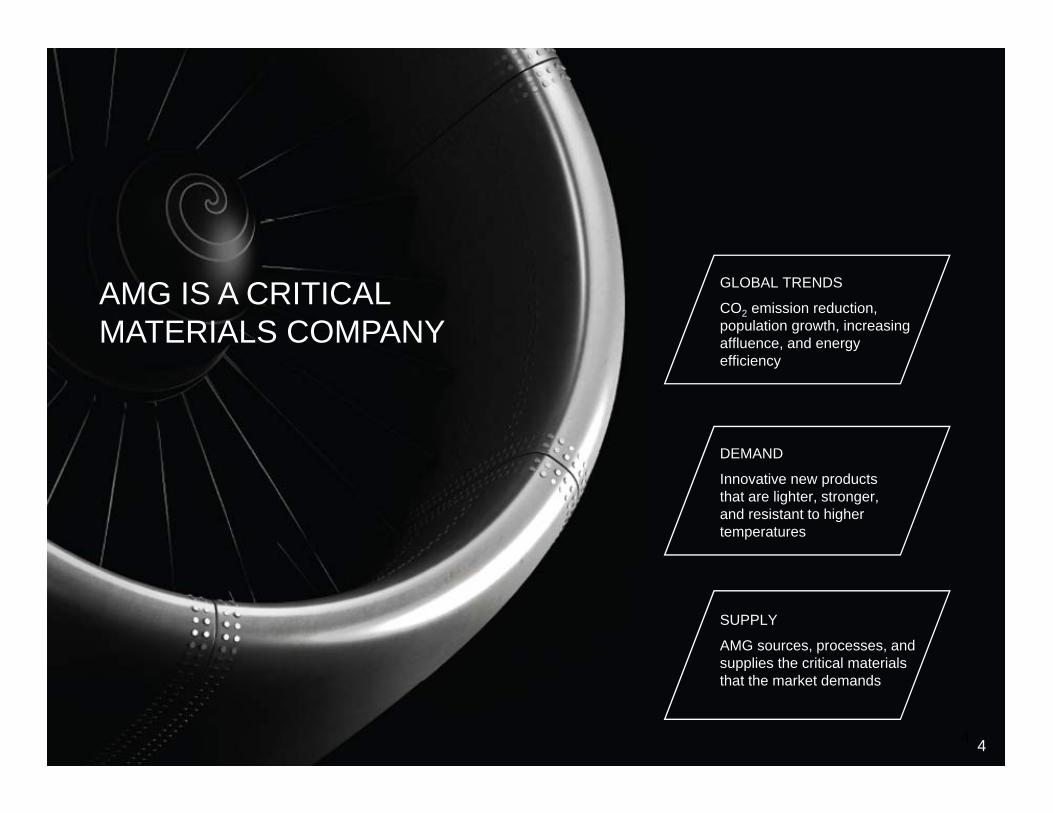
GLOBAL TRENDS
CO2 emission reduction, population growth, increasing affluence, and energy efficiency
DEMAND
Innovative new products that are lighter, stronger, and resistant to higher temperatures
SUPPLY
AMG sources, processes, and supplies the critical materials that the market demands
AMG IS A CRITICAL MATERIALS COMPANY
4
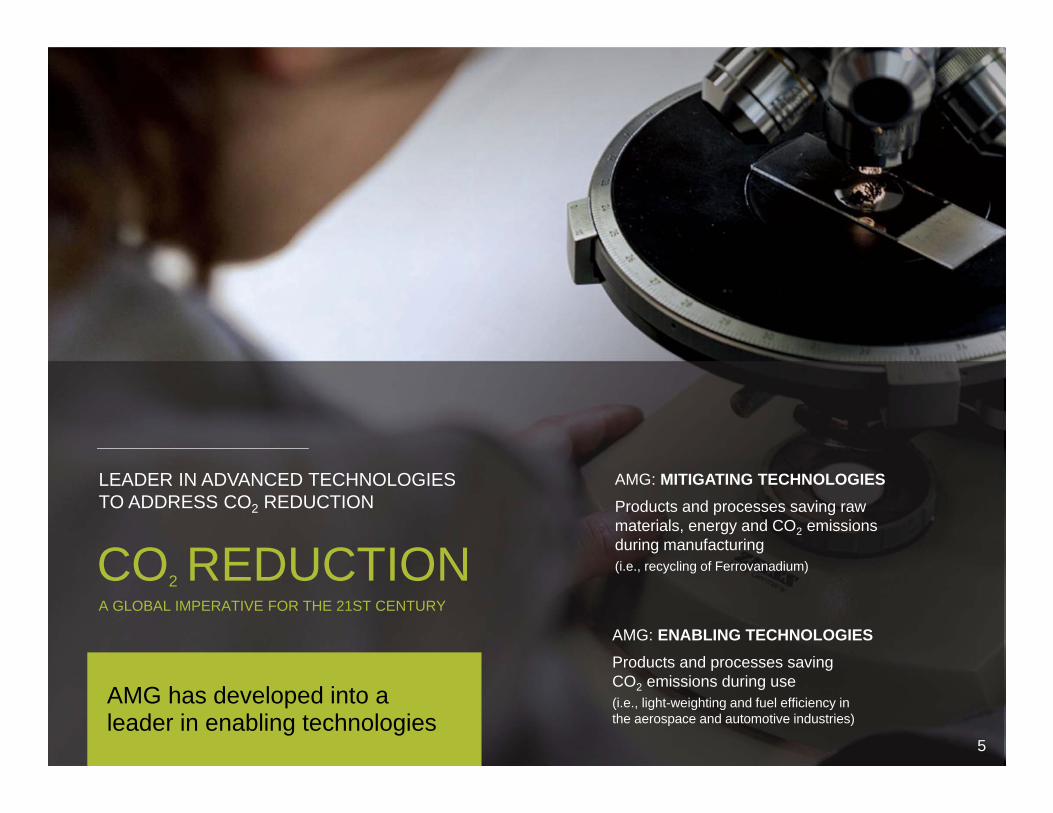
AMG: MITIGATING TECHNOLOGIESProducts and processes saving raw materials, energy and CO2 emissions during manufacturing(i.e., recycling of Ferrovanadium)
AMG: ENABLING TECHNOLOGIESProducts and processes saving CO2 emissions during use(i.e., light-weighting and fuel efficiency in the aerospace and automotive industries)
A GLOBAL IMPERATIVE FOR THE 21ST CENTURY
CO2 REDUCTION
LEADER IN ADVANCED TECHNOLOGIES TO ADDRESS CO2 REDUCTION
AMG has developed into a leader in enabling technologies
5
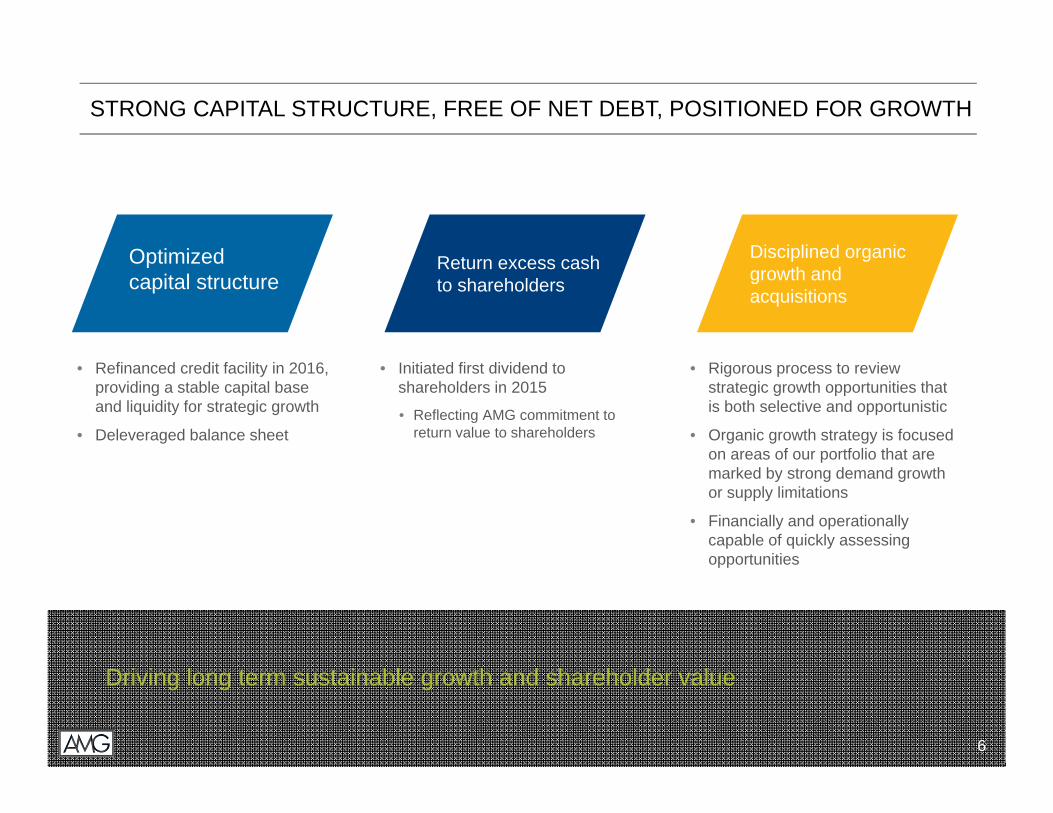
STRONG CAPITAL STRUCTURE, FREE OF NET DEBT, POSITIONED FOR GROWTH
• Refinanced credit facility in 2016, providing a stable capital base and liquidity for strategic growth
• Deleveraged balance sheet
Optimized capital structure
• Rigorous process to review strategic growth opportunities that is both selective and opportunistic
• Organic growth strategy is focused on areas of our portfolio that are marked by strong demand growth or supply limitations
• Financially and operationally capable of quickly assessing opportunities
• Initiated first dividend to shareholders in 2015
• Reflecting AMG commitment to return value to shareholders
Disciplined organicgrowth and acquisitions
Return excess cash to shareholders
Driving long term sustainable growth and shareholder value
6
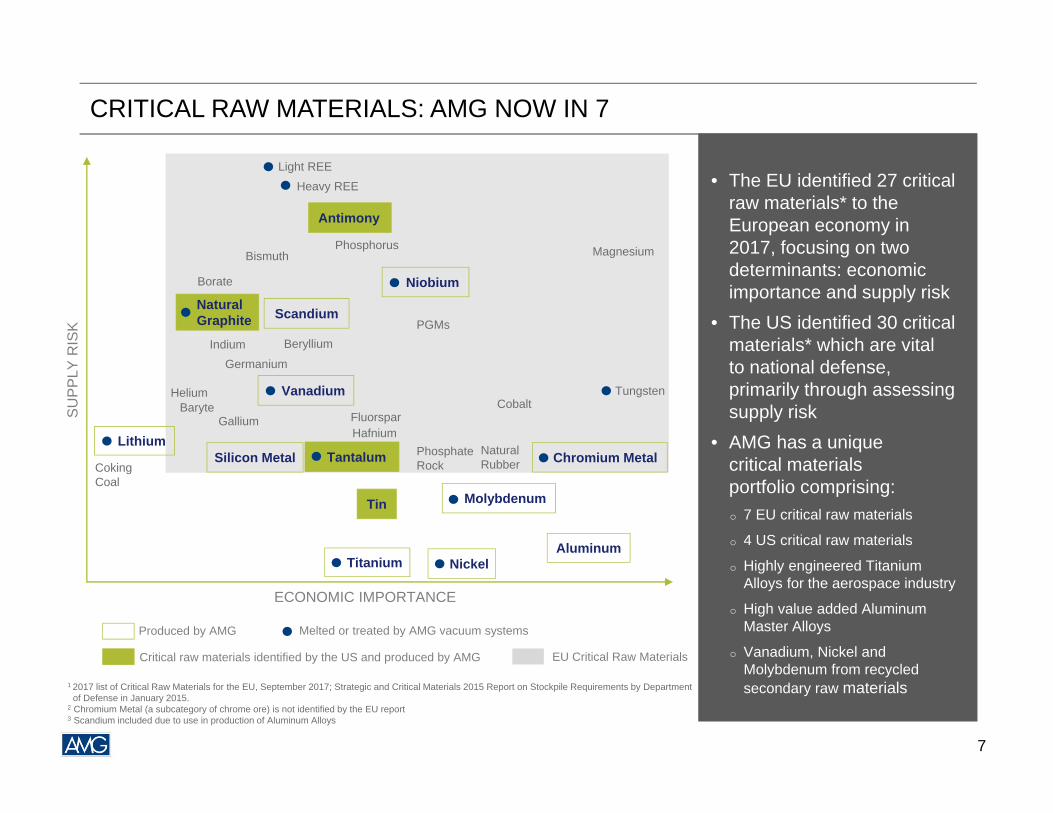
CRITICAL RAW MATERIALS: AMG NOW IN 7
• The EU identified 27 critical raw materials* to the European economy in 2017, focusing on two determinants: economic importance and supply risk
• The US identified 30 critical materials* which are vital to national defense, primarily through assessing supply risk
• AMG has a unique critical materials portfolio comprising:o 7 EU critical raw materials
o 4 US critical raw materials
o Highly engineered Titanium Alloys for the aerospace industry
o High value added Aluminum Master Alloys
o Vanadium, Nickel and Molybdenum from recycled secondary raw materials
Heavy REELight REE
Magnesium
Germanium
Gallium
BerylliumPGMs
PhosphateRock
Borate
TungstenVanadium
Aluminum
Tin Molybdenum
Nickel
Antimony
Silicon Metal
Natural Graphite
Niobium
SU
PP
LY R
ISK
ECONOMIC IMPORTANCE
Chromium MetalTantalum
Melted or treated by AMG vacuum systemsProduced by AMG
Critical raw materials identified by the US and produced by AMG EU Critical Raw Materials
Titanium
Lithium
1 2017 list of Critical Raw Materials for the EU, September 2017; Strategic and Critical Materials 2015 Report on Stockpile Requirements by Department of Defense in January 2015.
2 Chromium Metal (a subcategory of chrome ore) is not identified by the EU report3 Scandium included due to use in production of Aluminum Alloys
Coking Coal
BaryteHelium
Bismuth
Natural Rubber
CobaltFluorsparHafnium
Scandium
Indium
Phosphorus
7
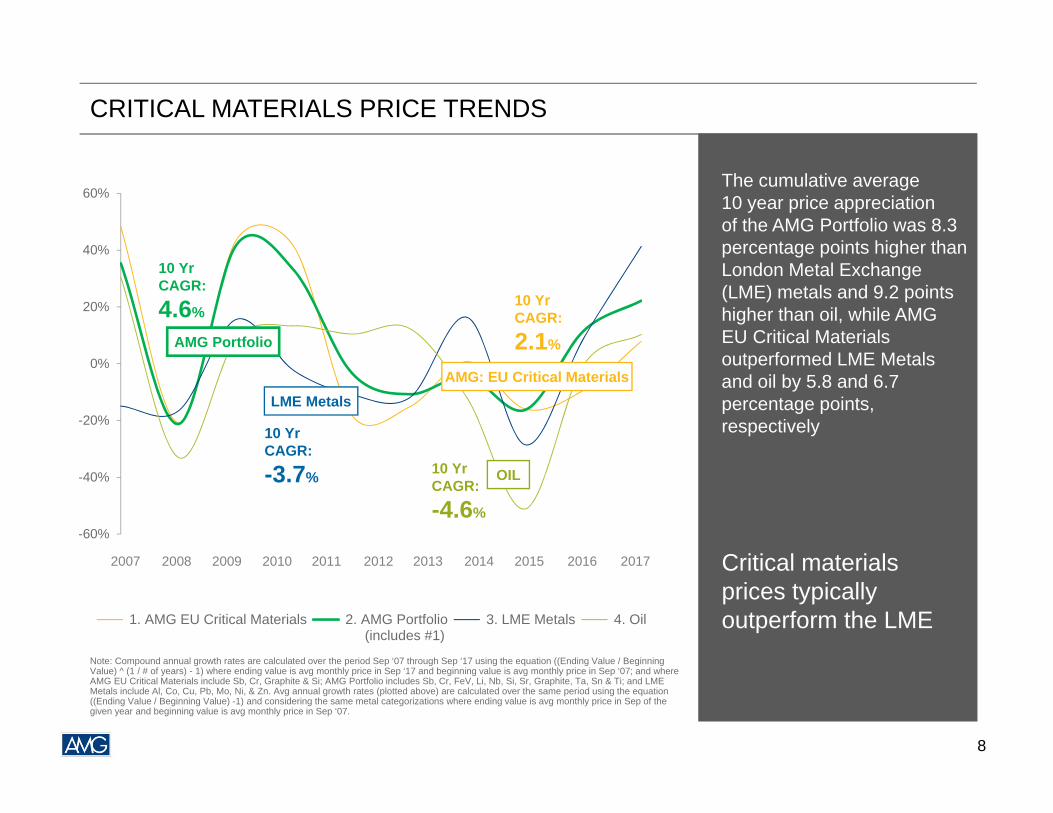
CRITICAL MATERIALS PRICE TRENDS
-60%
-40%
-20%
0%
20%
40%
60%
1. AMG EU Critical Materials 2. AMG Portfolio (includes #1)
3. LME Metals 4. Oil
10 Yr CAGR:
-3.7%
10 Yr CAGR:
2.1%
10 Yr CAGR:
-4.6%
AMG: EU Critical Materials
OIL
LME Metals
AMG Portfolio
The cumulative average 10 year price appreciation of the AMG Portfolio was 8.3 percentage points higher than London Metal Exchange (LME) metals and 9.2 points higher than oil, while AMG EU Critical Materials outperformed LME Metals and oil by 5.8 and 6.7 percentage points, respectively
Critical materials prices typically outperform the LME
Note: Compound annual growth rates are calculated over the period Sep ‘07 through Sep ‘17 using the equation ((Ending Value / Beginning Value) ^ (1 / # of years) - 1) where ending value is avg monthly price in Sep ‘17 and beginning value is avg monthly price in Sep ‘07; and where AMG EU Critical Materials include Sb, Cr, Graphite & Si; AMG Portfolio includes Sb, Cr, FeV, Li, Nb, Si, Sr, Graphite, Ta, Sn & Ti; and LME Metals include Al, Co, Cu, Pb, Mo, Ni, & Zn. Avg annual growth rates (plotted above) are calculated over the same period using the equation ((Ending Value / Beginning Value) -1) and considering the same metal categorizations where ending value is avg monthly price in Sep of the given year and beginning value is avg monthly price in Sep ‘07.
2007 2008 2009 2010 2011 2012 2013 2014 2015 2016 2017
10 Yr CAGR:
4.6%
8
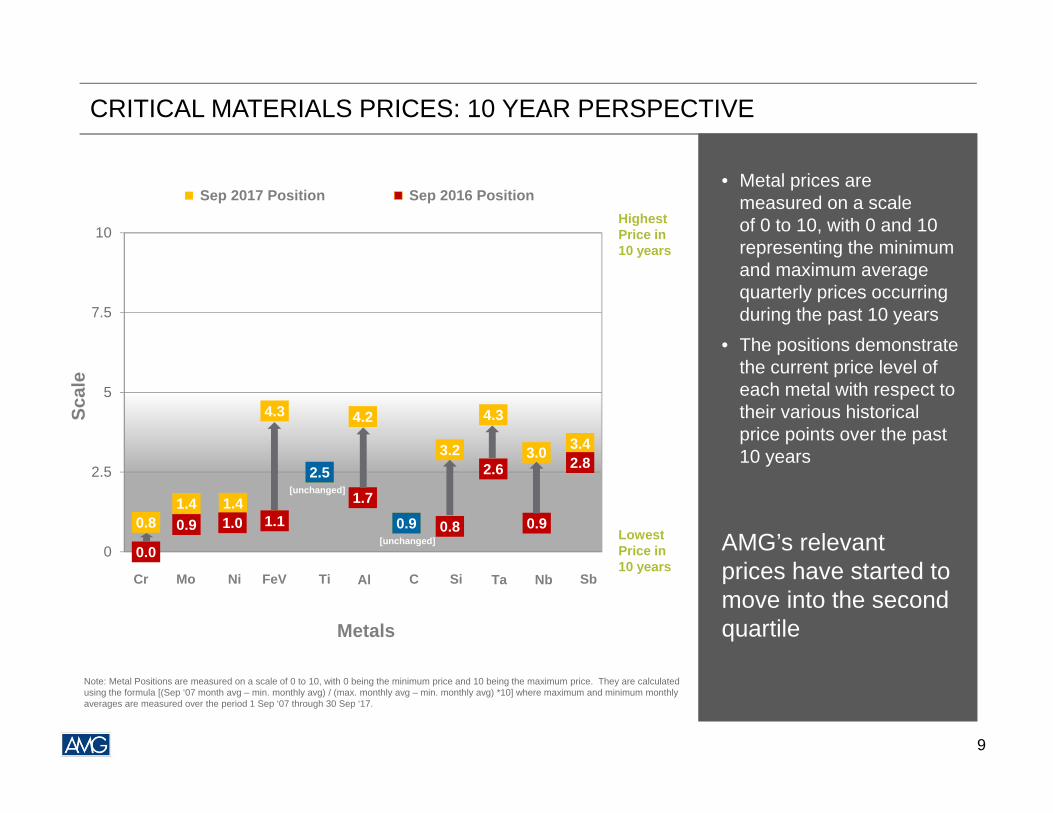
CRITICAL MATERIALS PRICES: 10 YEAR PERSPECTIVE
• Metal prices are measured on a scale of 0 to 10, with 0 and 10 representing the minimum and maximum average quarterly prices occurring during the past 10 years
• The positions demonstrate the current price level of each metal with respect to their various historical price points over the past 10 years
AMG’s relevant prices have started to move into the second quartile
0.81.4 1.4
4.3
2.5
4.2
0.9
3.2
4.3
3.0 3.4
0.0
0.9 1.0 1.1
2.5
1.7
0.9 0.8
2.6
0.9
2.8
0
2.5
5
7.5
10
Scal
e
Metals
Sep 2017 Position Sep 2016 Position
Cr Mo Ni FeV Ti Al C Si Ta Sb
Highest Price in 10 years
Lowest Price in 10 years
Nb
[unchanged]
Note: Metal Positions are measured on a scale of 0 to 10, with 0 being the minimum price and 10 being the maximum price. They are calculated using the formula [(Sep ‘07 month avg – min. monthly avg) / (max. monthly avg – min. monthly avg) *10] where maximum and minimum monthly averages are measured over the period 1 Sep ‘07 through 30 Sep ‘17.
9
[unchanged]
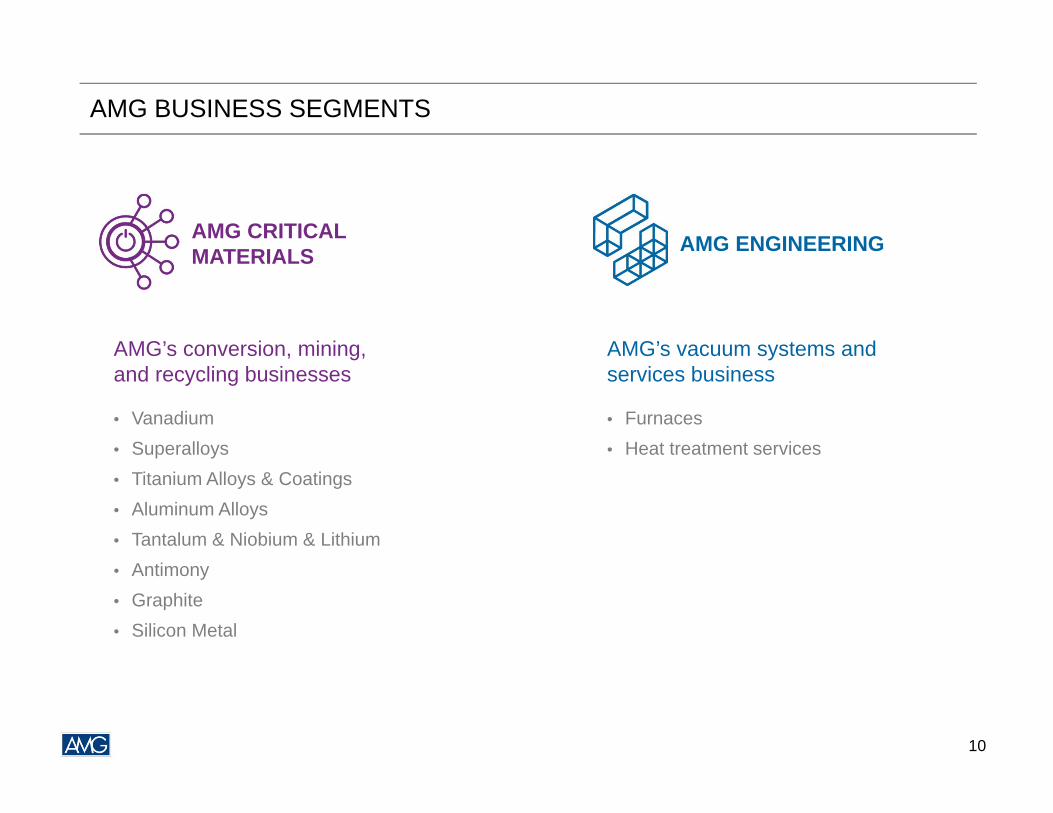
AMG BUSINESS SEGMENTS
AMG CRITICAL MATERIALS
AMG’s conversion, mining, and recycling businesses
• Vanadium• Superalloys• Titanium Alloys & Coatings• Aluminum Alloys• Tantalum & Niobium & Lithium• Antimony• Graphite• Silicon Metal
AMG ENGINEERING
AMG’s vacuum systems and services business
• Furnaces• Heat treatment services
10
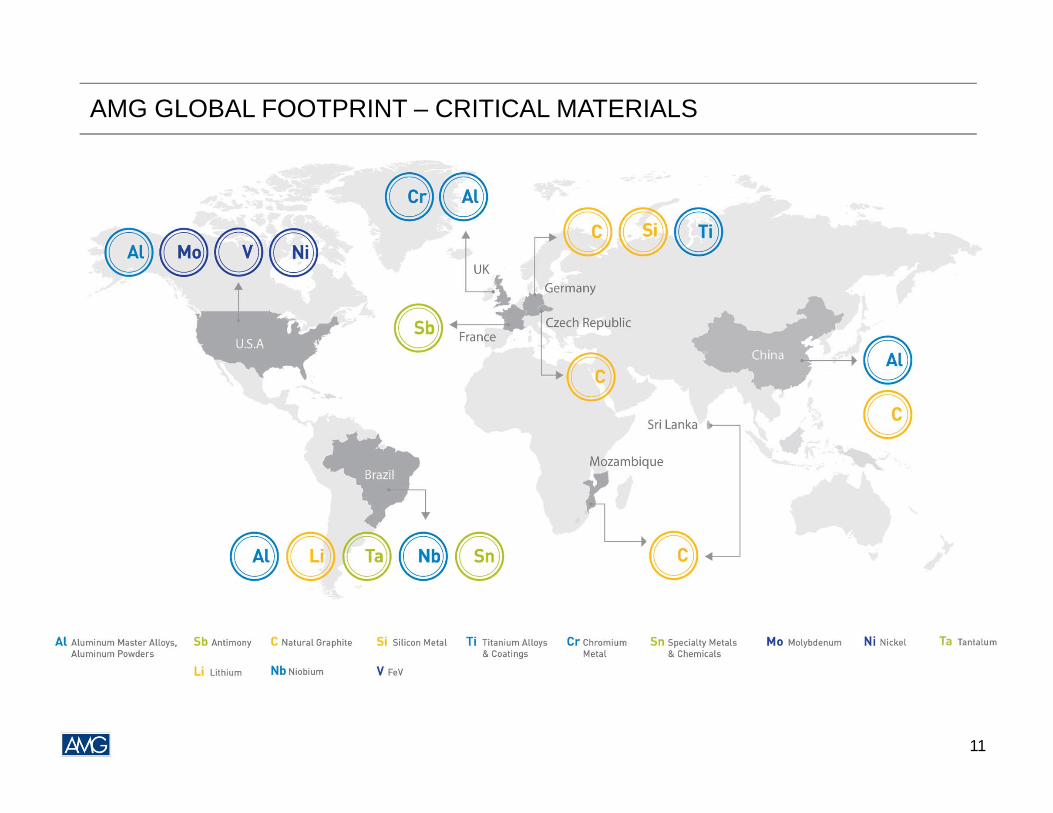
AMG GLOBAL FOOTPRINT – CRITICAL MATERIALS
11
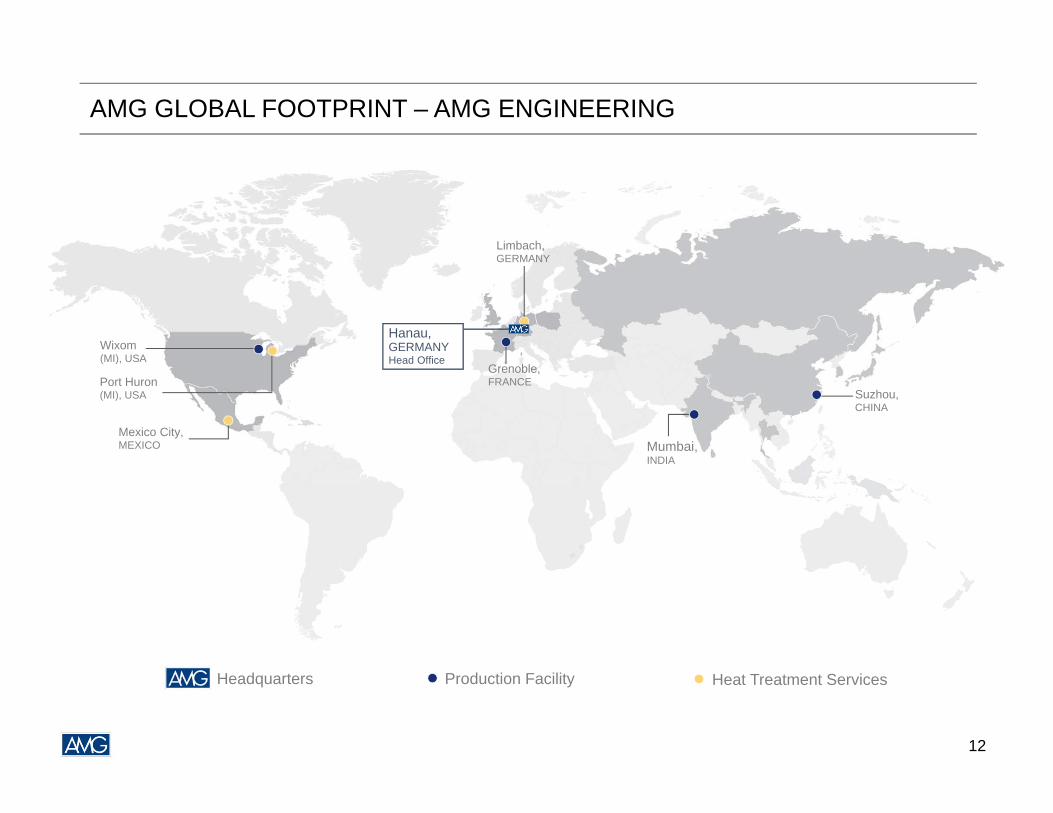
AMG GLOBAL FOOTPRINT – AMG ENGINEERING
Mexico City, MEXICO
Port Huron (MI), USA
Limbach, GERMANY
Mumbai, INDIA
Suzhou, CHINA
Wixom (MI), USA
Grenoble,FRANCE
Headquarters Production Facility Heat Treatment Services
Hanau, GERMANYHead Office
12
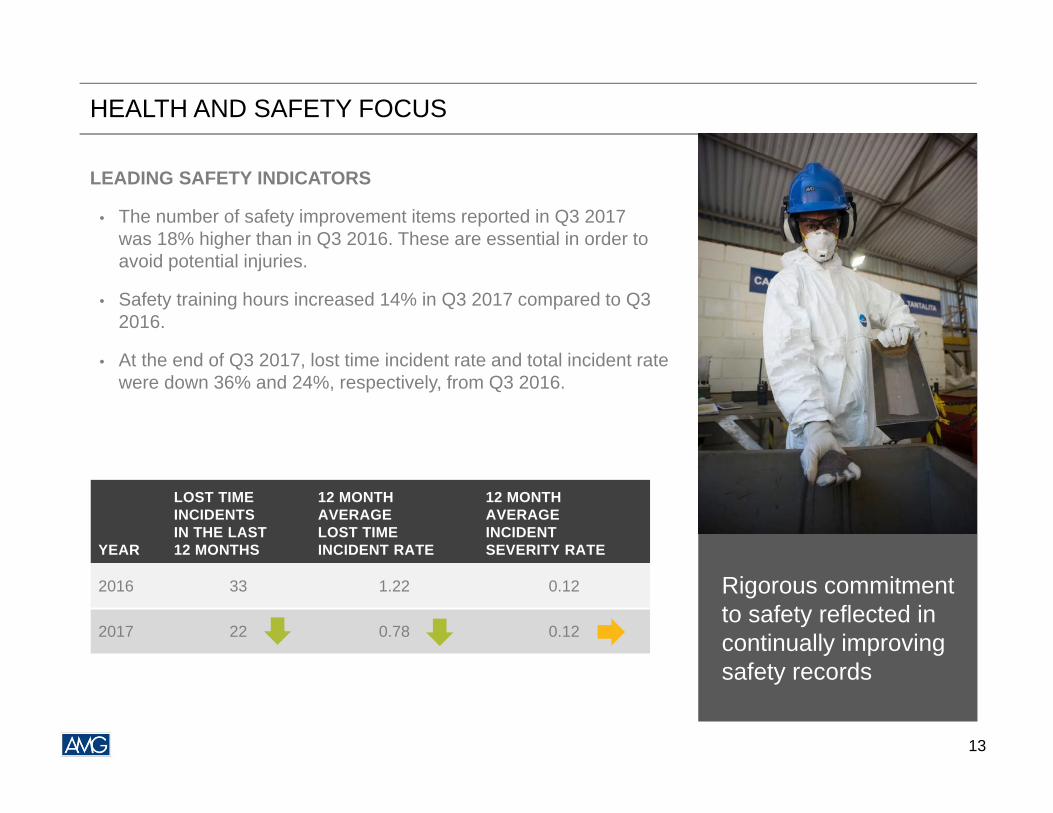
HEALTH AND SAFETY FOCUS
Rigorous commitment to safety reflected in continually improving safety records
LEADING SAFETY INDICATORS
• The number of safety improvement items reported in Q3 2017 was 18% higher than in Q3 2016. These are essential in order to avoid potential injuries.
• Safety training hours increased 14% in Q3 2017 compared to Q3 2016.
• At the end of Q3 2017, lost time incident rate and total incident rate were down 36% and 24%, respectively, from Q3 2016.
YEAR
LOST TIME INCIDENTS IN THE LAST 12 MONTHS
12 MONTH AVERAGE LOST TIMEINCIDENT RATE
12 MONTH AVERAGE INCIDENT SEVERITY RATE
2016 33 1.22 0.12
2017 22 0.78 0.12
13
AMG Advanced Metallurgical Group N.V.
Financial Highlights
14
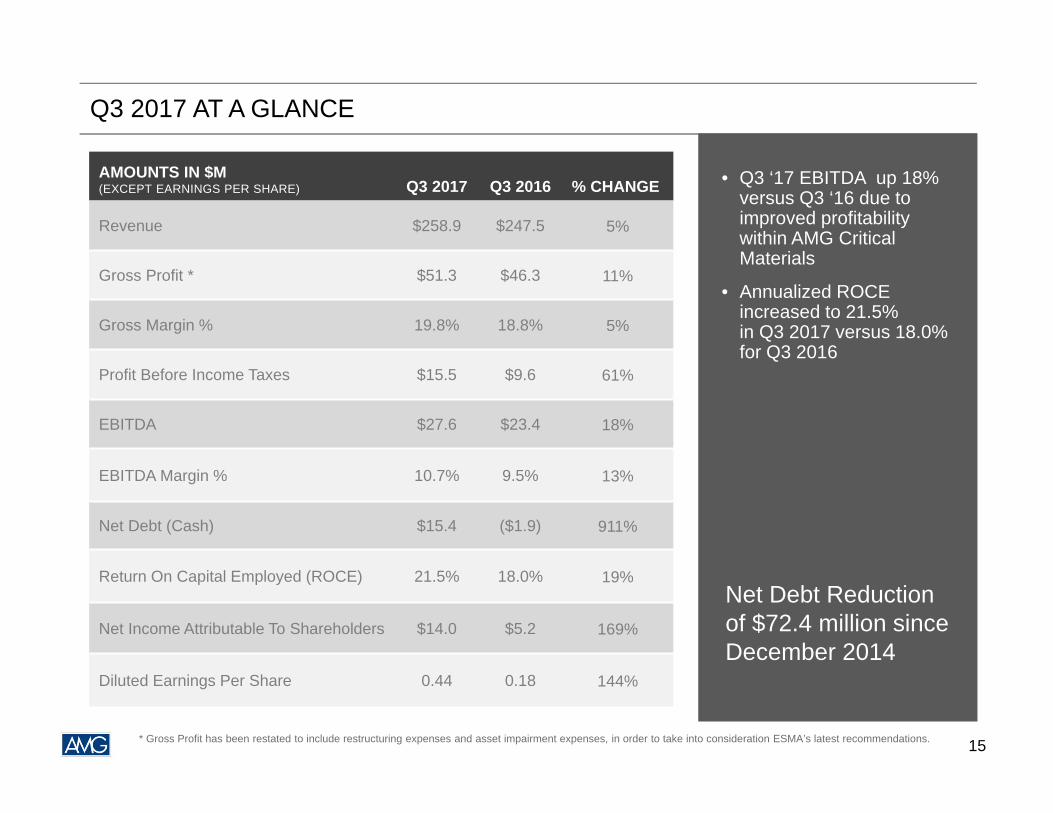
Q3 2017 AT A GLANCE
• Q3 ‘17 EBITDA up 18% versus Q3 ‘16 due to improved profitability within AMG Critical Materials
• Annualized ROCE increased to 21.5% in Q3 2017 versus 18.0% for Q3 2016
Net Debt Reduction of $72.4 million since December 2014
AMOUNTS IN $M (EXCEPT EARNINGS PER SHARE) Q3 2017 Q3 2016 % CHANGE
Revenue $258.9 $247.5 5%
Gross Profit * $51.3 $46.3 11%
Gross Margin % 19.8% 18.8% 5%
Profit Before Income Taxes $15.5 $9.6 61%
EBITDA $27.6 $23.4 18%
EBITDA Margin % 10.7% 9.5% 13%
Net Debt (Cash) $15.4 ($1.9) 911%
Return On Capital Employed (ROCE) 21.5% 18.0% 19%
Net Income Attributable To Shareholders $14.0 $5.2 169%
Diluted Earnings Per Share 0.44 0.18 144%
* Gross Profit has been restated to include restructuring expenses and asset impairment expenses, in order to take into consideration ESMA’s latest recommendations. 15
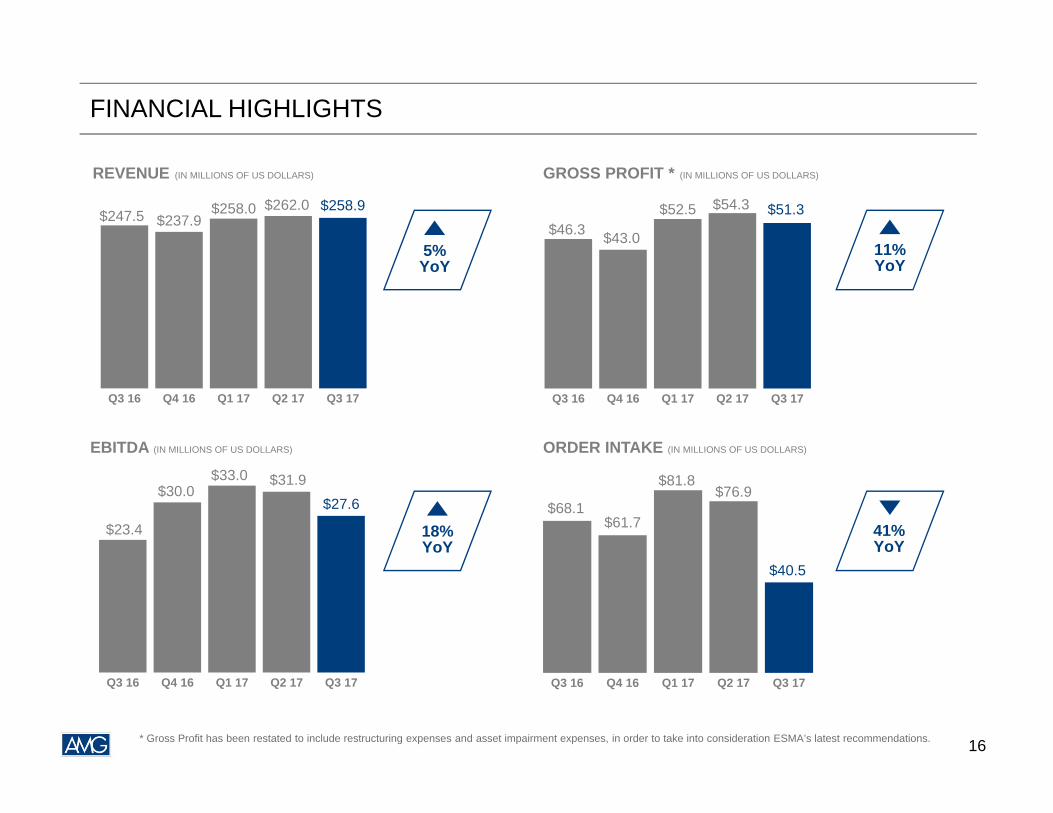
FINANCIAL HIGHLIGHTS
$23.4
$30.0$33.0 $31.9
$27.6
Q3 16 Q4 16 Q1 17 Q2 17 Q3 17
$247.5 $237.9$258.0 $262.0 $258.9
Q3 16 Q4 16 Q1 17 Q2 17 Q3 17
$46.3 $43.0
$52.5 $54.3 $51.3
Q3 16 Q4 16 Q1 17 Q2 17 Q3 17
REVENUE (IN MILLIONS OF US DOLLARS)
$68.1$61.7
$81.8$76.9
$40.5
Q3 16 Q4 16 Q1 17 Q2 17 Q3 17
* Gross Profit has been restated to include restructuring expenses and asset impairment expenses, in order to take into consideration ESMA’s latest recommendations.
GROSS PROFIT * (IN MILLIONS OF US DOLLARS)
ORDER INTAKE (IN MILLIONS OF US DOLLARS)EBITDA (IN MILLIONS OF US DOLLARS)
5%YoY
18% YoY
41%YoY
11%YoY
16
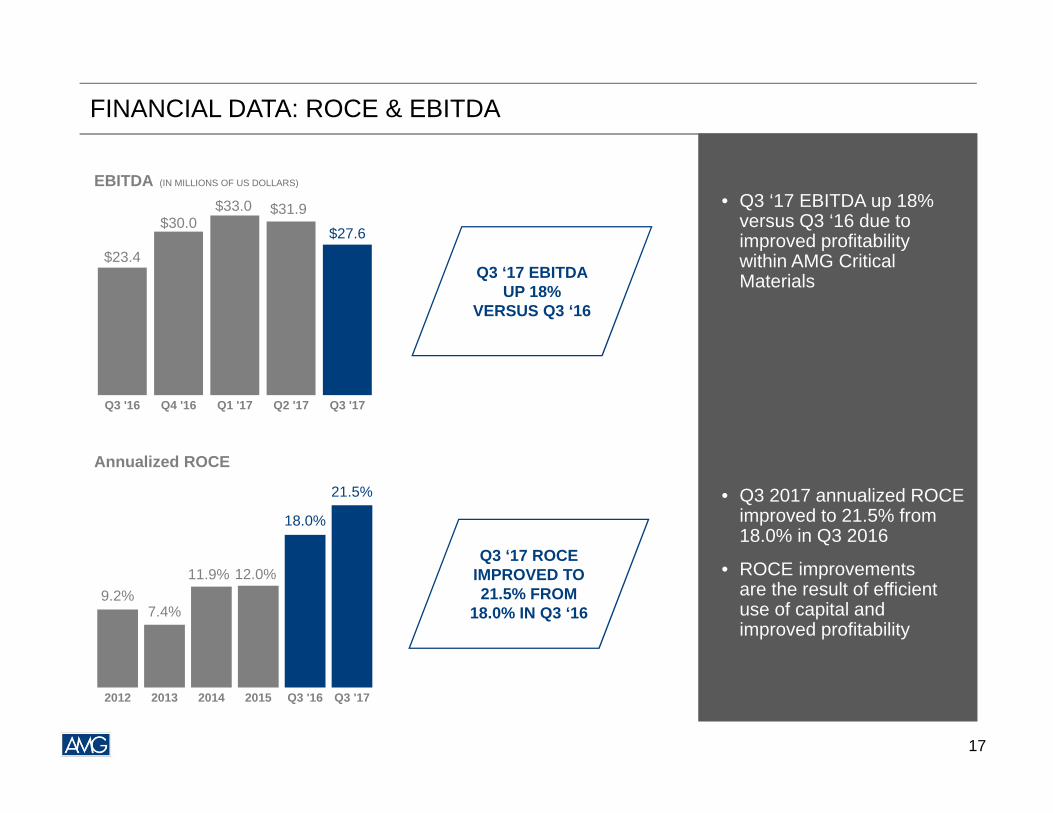
FINANCIAL DATA: ROCE & EBITDA
• Q3 ‘17 EBITDA up 18% versus Q3 ‘16 due to improved profitability within AMG Critical Materials
• Q3 2017 annualized ROCE improved to 21.5% from 18.0% in Q3 2016
• ROCE improvements are the result of efficient use of capital and improved profitability
Annualized ROCE
EBITDA (IN MILLIONS OF US DOLLARS)
$23.4
$30.0 $33.0 $31.9
$27.6
Q3 '16 Q4 '16 Q1 '17 Q2 '17 Q3 '17
Q3 ‘17 ROCE IMPROVED TO 21.5% FROM
18.0% IN Q3 ‘16
Q3 ‘17 EBITDA UP 18%
VERSUS Q3 ‘16
9.2%7.4%
11.9% 12.0%
18.0%
21.5%
2012 2013 2014 2015 Q3 '16 Q3 '17
17
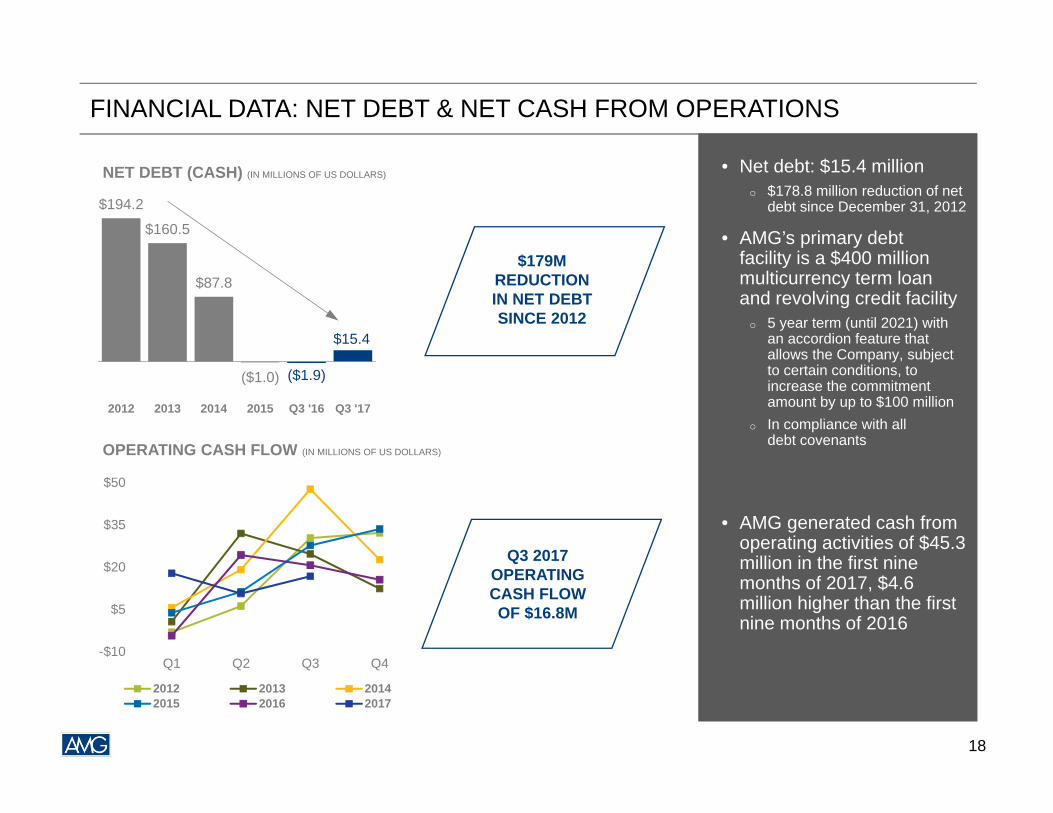
FINANCIAL DATA: NET DEBT & NET CASH FROM OPERATIONS
• Net debt: $15.4 milliono $178.8 million reduction of net
debt since December 31, 2012
• AMG’s primary debt facility is a $400 million multicurrency term loan and revolving credit facility
o 5 year term (until 2021) with an accordion feature that allows the Company, subject to certain conditions, to increase the commitment amount by up to $100 million
o In compliance with all debt covenants
• AMG generated cash from operating activities of $45.3 million in the first nine months of 2017, $4.6 million higher than the first nine months of 2016
$194.2
$160.5
$87.8
($1.0) ($1.9)
$15.4
2012 2013 2014 2015 Q3 '16 Q3 '17
-$10
$5
$20
$35
$50
Q1 Q2 Q3 Q4
2012 2013 20142015 2016 2017
NET DEBT (CASH) (IN MILLIONS OF US DOLLARS)
OPERATING CASH FLOW (IN MILLIONS OF US DOLLARS)
$179M REDUCTION IN NET DEBT SINCE 2012
Q3 2017 OPERATING CASH FLOW OF $16.8M
18
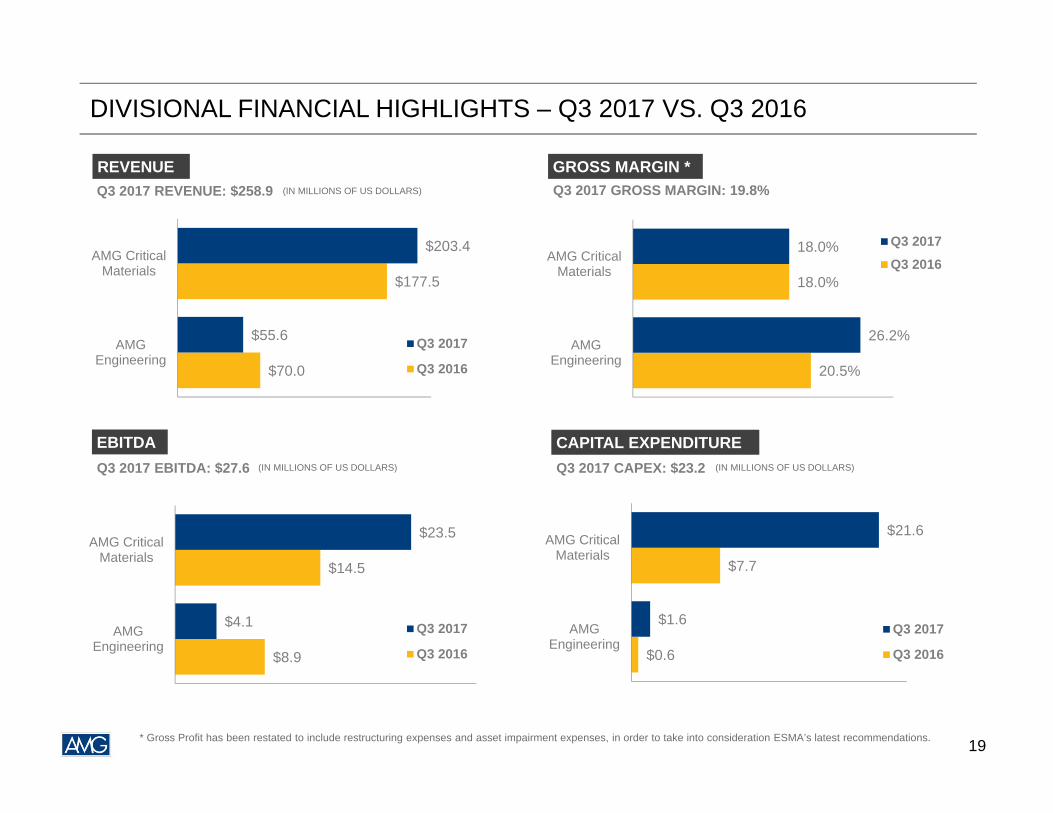
DIVISIONAL FINANCIAL HIGHLIGHTS – Q3 2017 VS. Q3 2016
REVENUE
EBITDAQ3 2017 EBITDA: $27.6
Q3 2017 REVENUE: $258.9 Q3 2017 GROSS MARGIN: 19.8%GROSS MARGIN *
CAPITAL EXPENDITUREQ3 2017 CAPEX: $23.2
$70.0
$177.5
$55.6
$203.4
AMGEngineering
AMG CriticalMaterials
Q3 2017
Q3 2016
$8.9
$14.5
$4.1
$23.5
AMGEngineering
AMG CriticalMaterials
Q3 2017
Q3 2016 $0.6
$7.7
$1.6
$21.6
AMGEngineering
AMG CriticalMaterials
Q3 2017
Q3 2016
20.5%
18.0%
26.2%
18.0%
AMGEngineering
AMG CriticalMaterials
Q3 2017Q3 2016
(IN MILLIONS OF US DOLLARS)
(IN MILLIONS OF US DOLLARS) (IN MILLIONS OF US DOLLARS)
* Gross Profit has been restated to include restructuring expenses and asset impairment expenses, in order to take into consideration ESMA’s latest recommendations. 19
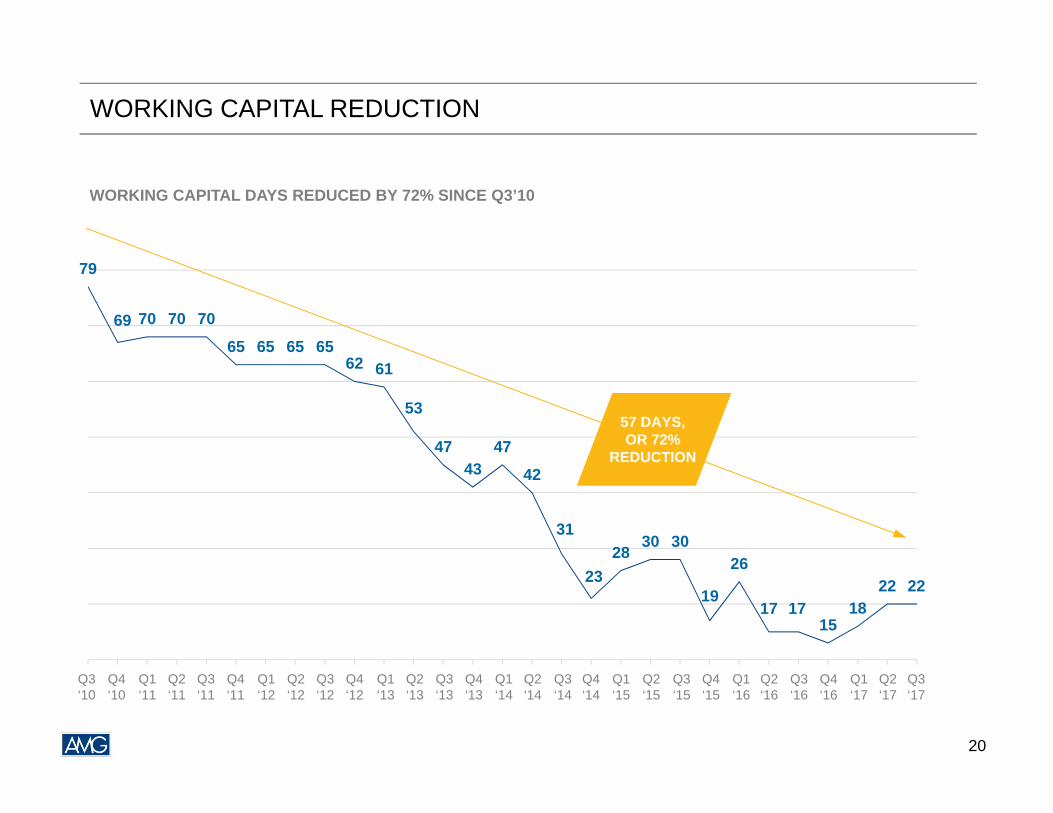
WORKING CAPITAL REDUCTION
WORKING CAPITAL DAYS REDUCED BY 72% SINCE Q3’10
79
69 70 70 70
65 65 65 6562 61
53
4743
47
42
31
2328
30 30
19
26
17 1715
1822 22
Q3
10
Q4
10
Q1
11
Q2
11
Q3
11
Q4
11
Q1
12
Q2
12
Q3
12
Q4
12
Q1
13
Q2
13
Q3
13
Q4
13
Q1
14
Q2
14
Q3
14
Q4
14
Q1
15
Q2
15
Q3
15
Q4
15
Q1
16
Q2
16
Q3
16
Q4
16
Q1
17
Q2
17
Q3
17
57 DAYS, OR 72%
REDUCTION
20
Q1‘11
Q2‘11
Q3‘11
Q4‘11
Q1‘12
Q2‘12
Q3‘12
Q4‘12
Q1‘13
Q2‘13
Q3‘13
Q4‘13
Q1‘14
Q2‘14
Q3‘14
Q3‘10
Q4‘10
Q4‘14
Q1‘15
Q2‘15
Q3‘15
Q4‘15
Q1‘16
Q2‘16
Q3‘16
Q4‘16
Q1‘17
Q2‘17
Q3‘17
AMG CRITICAL MATERIALS
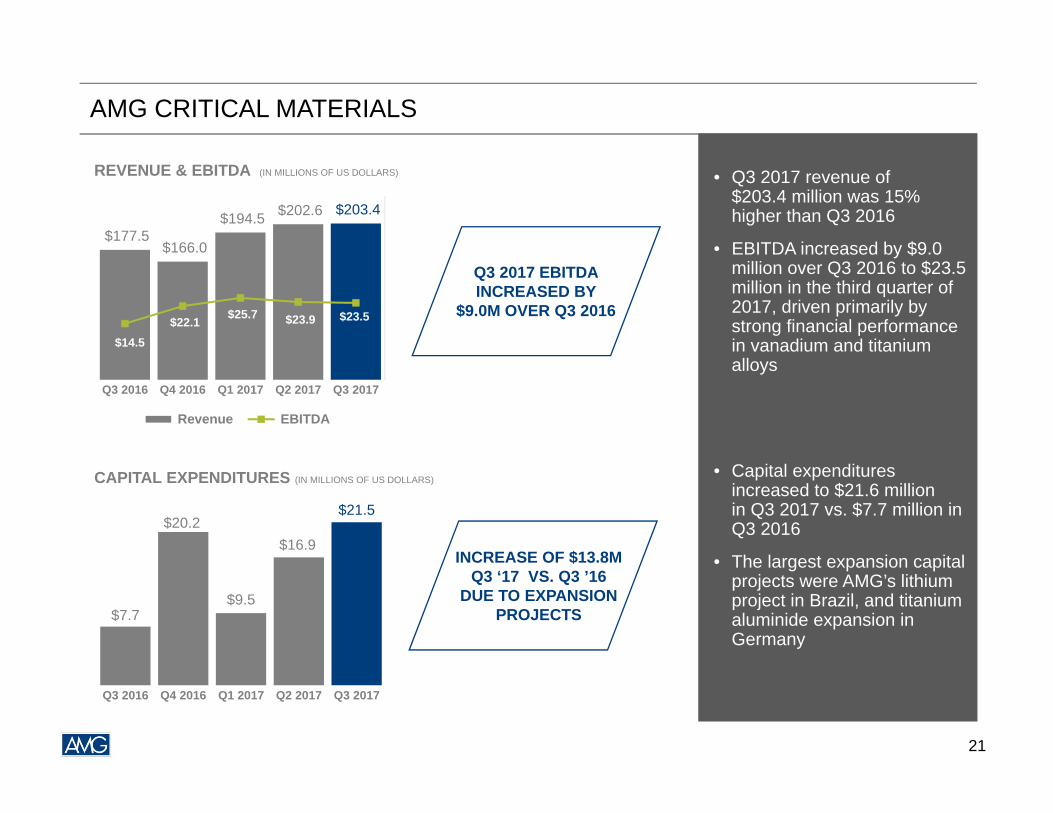
• Q3 2017 revenue of $203.4 million was 15% higher than Q3 2016
• EBITDA increased by $9.0 million over Q3 2016 to $23.5 million in the third quarter of 2017, driven primarily by strong financial performance in vanadium and titanium alloys
• Capital expenditures increased to $21.6 million in Q3 2017 vs. $7.7 million in Q3 2016
• The largest expansion capital projects were AMG’s lithium project in Brazil, and titanium aluminide expansion in Germany
$177.5 $166.0
$194.5 $202.6 $203.4
$14.5 $22.1 $25.7 $23.9 $23.5
Q3 2016 Q4 2016 Q1 2017 Q2 2017 Q3 2017
Revenue EBITDA
$7.7
$20.2
$9.5
$16.9
$21.5
Q3 2016 Q4 2016 Q1 2017 Q2 2017 Q3 2017
REVENUE & EBITDA (IN MILLIONS OF US DOLLARS)
CAPITAL EXPENDITURES (IN MILLIONS OF US DOLLARS)
Q3 2017 EBITDA INCREASED BY
$9.0M OVER Q3 2016
INCREASE OF $13.8M Q3 ‘17 VS. Q3 ’16
DUE TO EXPANSION PROJECTS
21
AMG CRITICAL MATERIALS – QUARTERLY REVENUE DRIVERS
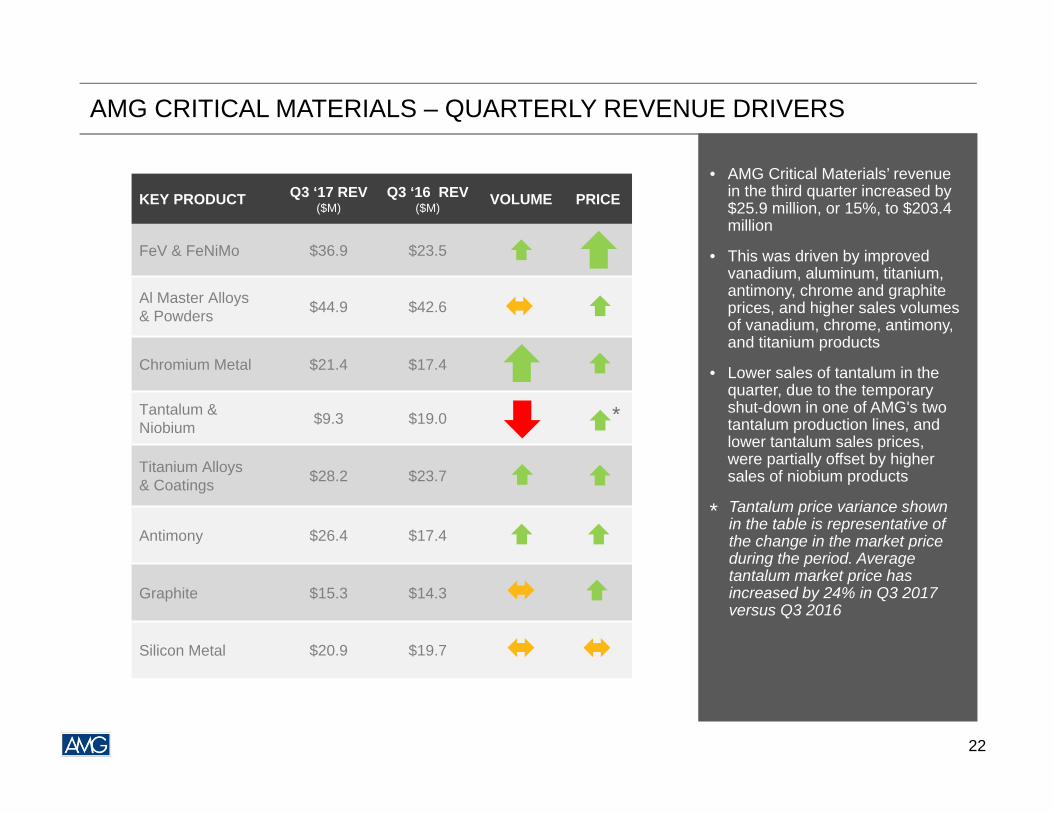
• AMG Critical Materials’ revenue in the third quarter increased by $25.9 million, or 15%, to $203.4 million
• This was driven by improved vanadium, aluminum, titanium, antimony, chrome and graphite prices, and higher sales volumes of vanadium, chrome, antimony, and titanium products
• Lower sales of tantalum in the quarter, due to the temporary shut-down in one of AMG's two tantalum production lines, and lower tantalum sales prices, were partially offset by higher sales of niobium products
Tantalum price variance shown in the table is representative of the change in the market price during the period. Average tantalum market price has increased by 24% in Q3 2017 versus Q3 2016
KEY PRODUCT Q3 ‘17 REV($M)
Q3 ‘16 REV($M) VOLUME PRICE
FeV & FeNiMo $36.9 $23.5
Al Master Alloys & Powders $44.9 $42.6
Chromium Metal $21.4 $17.4
Tantalum & Niobium $9.3 $19.0
Titanium Alloys& Coatings $28.2 $23.7
Antimony $26.4 $17.4
Graphite $15.3 $14.3
Silicon Metal $20.9 $19.7
22
*
*
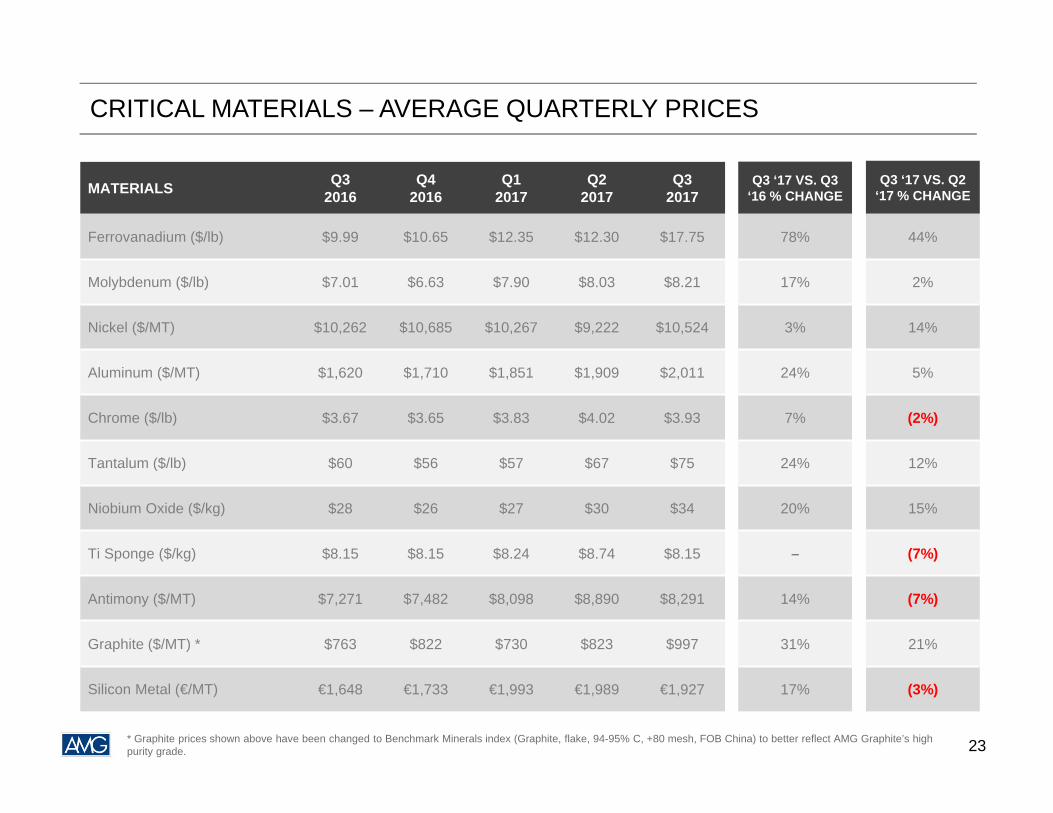
CRITICAL MATERIALS – AVERAGE QUARTERLY PRICES
MATERIALS Q32016
Q42016
Q12017
Q22017
Q32017
Ferrovanadium ($/lb) $9.99 $10.65 $12.35 $12.30 $17.75
Molybdenum ($/lb) $7.01 $6.63 $7.90 $8.03 $8.21
Nickel ($/MT) $10,262 $10,685 $10,267 $9,222 $10,524
Aluminum ($/MT) $1,620 $1,710 $1,851 $1,909 $2,011
Chrome ($/lb) $3.67 $3.65 $3.83 $4.02 $3.93
Tantalum ($/lb) $60 $56 $57 $67 $75
Niobium Oxide ($/kg) $28 $26 $27 $30 $34
Ti Sponge ($/kg) $8.15 $8.15 $8.24 $8.74 $8.15
Antimony ($/MT) $7,271 $7,482 $8,098 $8,890 $8,291
Graphite ($/MT) * $763 $822 $730 $823 $997
Silicon Metal (€/MT) €1,648 €1,733 €1,993 €1,989 €1,927
Q3 ‘17 VS. Q3‘16 % CHANGE
78%
17%
3%
24%
7%
24%
20%
–
14%
31%
17%
Q3 ‘17 VS. Q2‘17 % CHANGE
44%
2%
14%
5%
(2%)
12%
15%
(7%)
(7%)
21%
(3%)
23* Graphite prices shown above have been changed to Benchmark Minerals index (Graphite, flake, 94-95% C, +80 mesh, FOB China) to better reflect AMG Graphite’s high purity grade.
AMG ENGINEERING
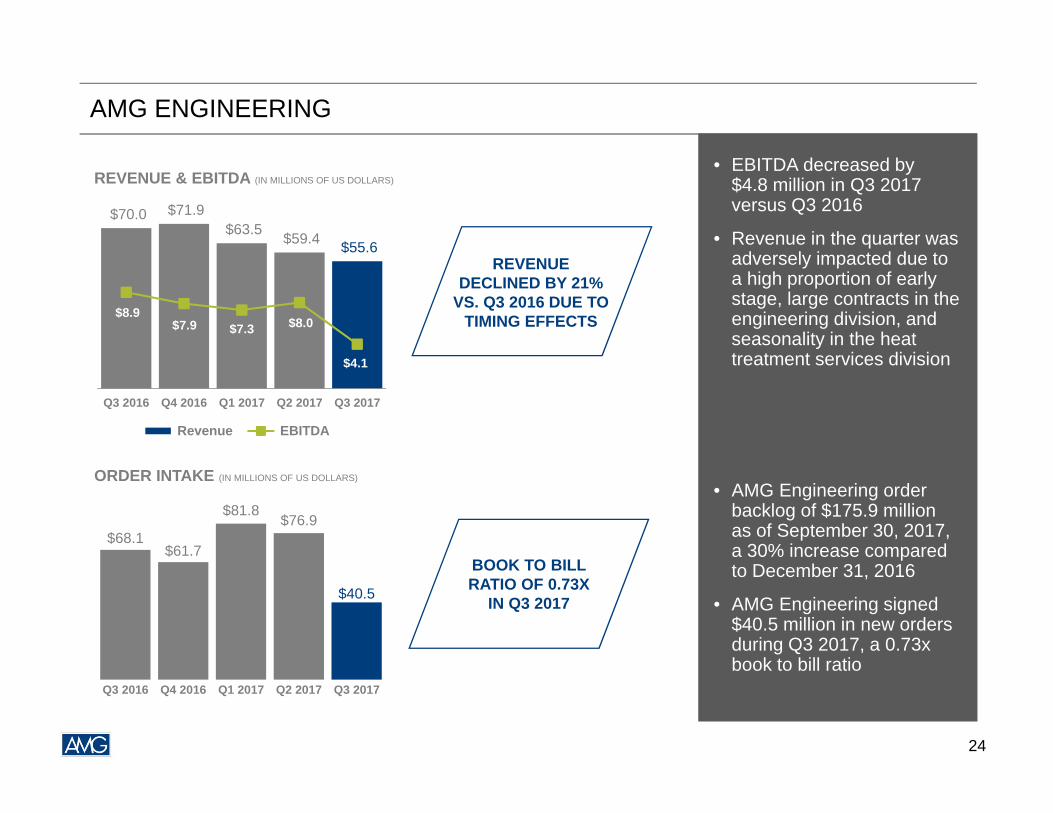
• EBITDA decreased by $4.8 million in Q3 2017 versus Q3 2016
• Revenue in the quarter was adversely impacted due to a high proportion of early stage, large contracts in the engineering division, and seasonality in the heat treatment services division
• AMG Engineering order backlog of $175.9 million as of September 30, 2017, a 30% increase compared to December 31, 2016
• AMG Engineering signed $40.5 million in new orders during Q3 2017, a 0.73x book to bill ratio
$70.0 $71.9 $63.5 $59.4 $55.6
$8.9 $7.9 $7.3 $8.0
$4.1
Q3 2016 Q4 2016 Q1 2017 Q2 2017 Q3 2017
Revenue EBITDA
$68.1$61.7
$81.8$76.9
$40.5
Q3 2016 Q4 2016 Q1 2017 Q2 2017 Q3 2017
REVENUE & EBITDA (IN MILLIONS OF US DOLLARS)
ORDER INTAKE (IN MILLIONS OF US DOLLARS)
REVENUE DECLINED BY 21%
VS. Q3 2016 DUE TO TIMING EFFECTS
BOOK TO BILL RATIO OF 0.73X
IN Q3 2017
24
AMG Advanced Metallurgical Group N.V.
Strategy & Outlook
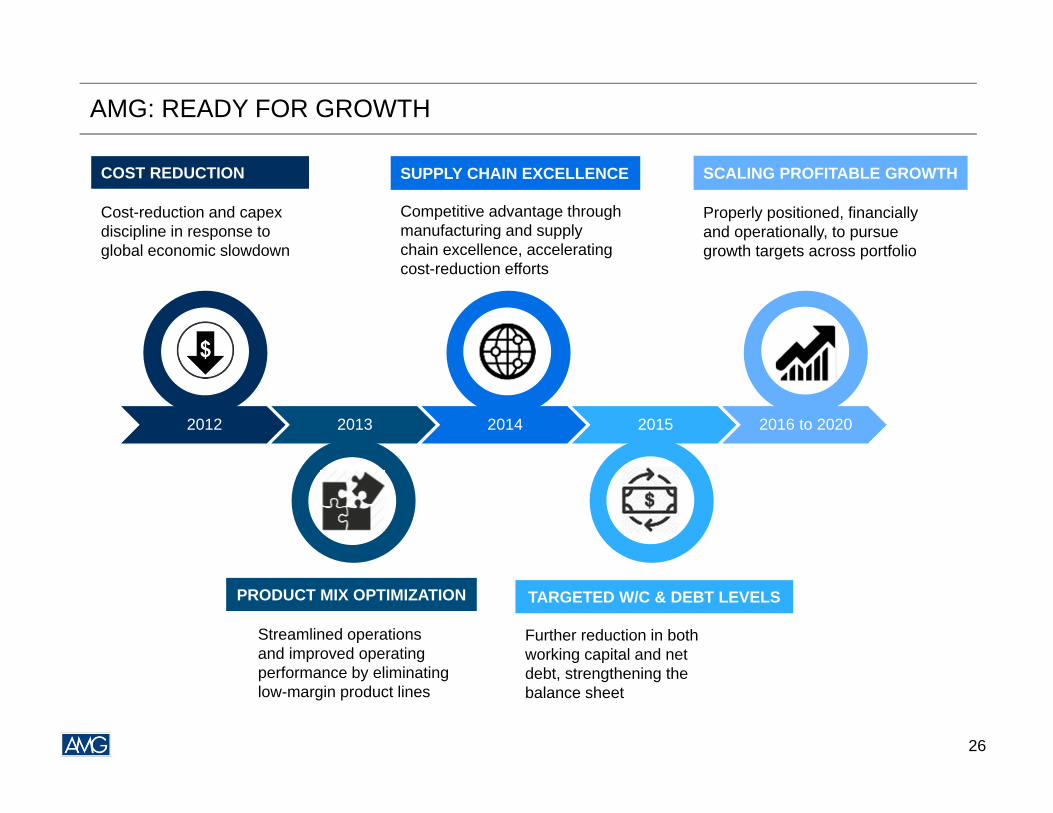
AMG: READY FOR GROWTH
2012 2013 2014 2015 2016 to 2020
COST REDUCTION
PRODUCT MIX OPTIMIZATION
SUPPLY CHAIN EXCELLENCE
TARGETED W/C & DEBT LEVELS
SCALING PROFITABLE GROWTH
Cost-reduction and capex discipline in response to global economic slowdown
Competitive advantage through manufacturing and supply chain excellence, accelerating cost-reduction efforts
Properly positioned, financially and operationally, to pursue growth targets across portfolio
Streamlined operations and improved operating performance by eliminating low-margin product lines
Further reduction in both working capital and net debt, strengthening the balance sheet
26
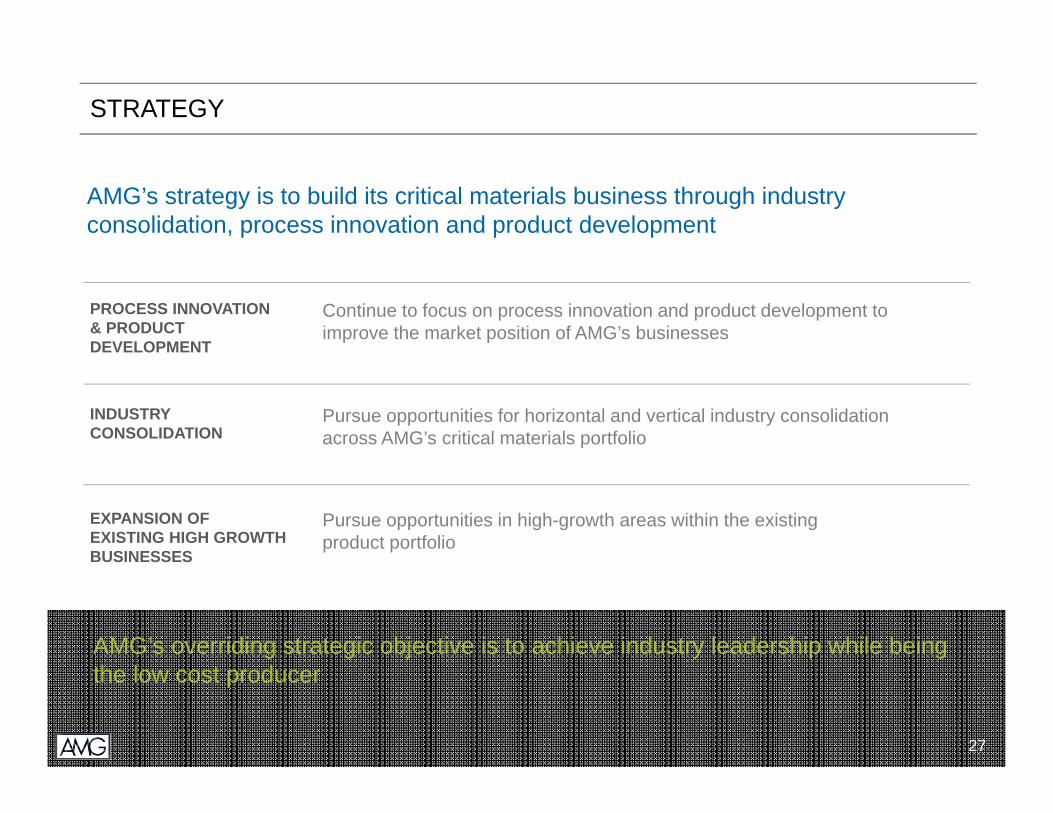
STRATEGY
INDUSTRY CONSOLIDATION
PROCESS INNOVATION & PRODUCT DEVELOPMENT
Pursue opportunities for horizontal and vertical industry consolidation across AMG’s critical materials portfolio
Continue to focus on process innovation and product development to improve the market position of AMG’s businesses
AMG’s strategy is to build its critical materials business through industry consolidation, process innovation and product development
EXPANSION OF EXISTING HIGH GROWTH BUSINESSES
Pursue opportunities in high-growth areas within the existing product portfolio
AMG’s overriding strategic objective is to achieve industry leadership while being the low cost producer
27
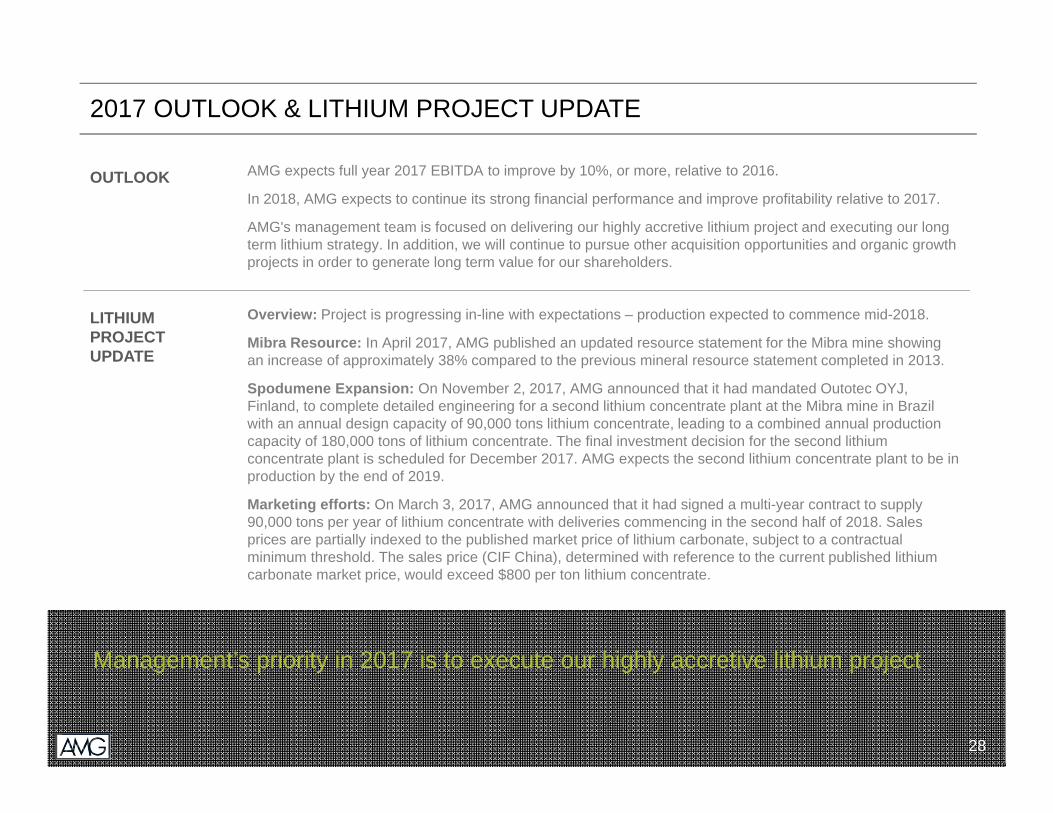
2017 OUTLOOK & LITHIUM PROJECT UPDATE
LITHIUM PROJECT UPDATE
OUTLOOK
Overview: Project is progressing in-line with expectations – production expected to commence mid-2018.
Mibra Resource: In April 2017, AMG published an updated resource statement for the Mibra mine showing an increase of approximately 38% compared to the previous mineral resource statement completed in 2013.
Spodumene Expansion: On November 2, 2017, AMG announced that it had mandated Outotec OYJ, Finland, to complete detailed engineering for a second lithium concentrate plant at the Mibra mine in Brazil with an annual design capacity of 90,000 tons lithium concentrate, leading to a combined annual production capacity of 180,000 tons of lithium concentrate. The final investment decision for the second lithium concentrate plant is scheduled for December 2017. AMG expects the second lithium concentrate plant to be in production by the end of 2019.
Marketing efforts: On March 3, 2017, AMG announced that it had signed a multi-year contract to supply 90,000 tons per year of lithium concentrate with deliveries commencing in the second half of 2018. Sales prices are partially indexed to the published market price of lithium carbonate, subject to a contractual minimum threshold. The sales price (CIF China), determined with reference to the current published lithium carbonate market price, would exceed $800 per ton lithium concentrate.
AMG expects full year 2017 EBITDA to improve by 10%, or more, relative to 2016.
In 2018, AMG expects to continue its strong financial performance and improve profitability relative to 2017.
AMG's management team is focused on delivering our highly accretive lithium project and executing our long term lithium strategy. In addition, we will continue to pursue other acquisition opportunities and organic growth projects in order to generate long term value for our shareholders.
Management’s priority in 2017 is to execute our highly accretive lithium project
28
AMG Advanced Metallurgical Group N.V.
Key Products& End Markets
29
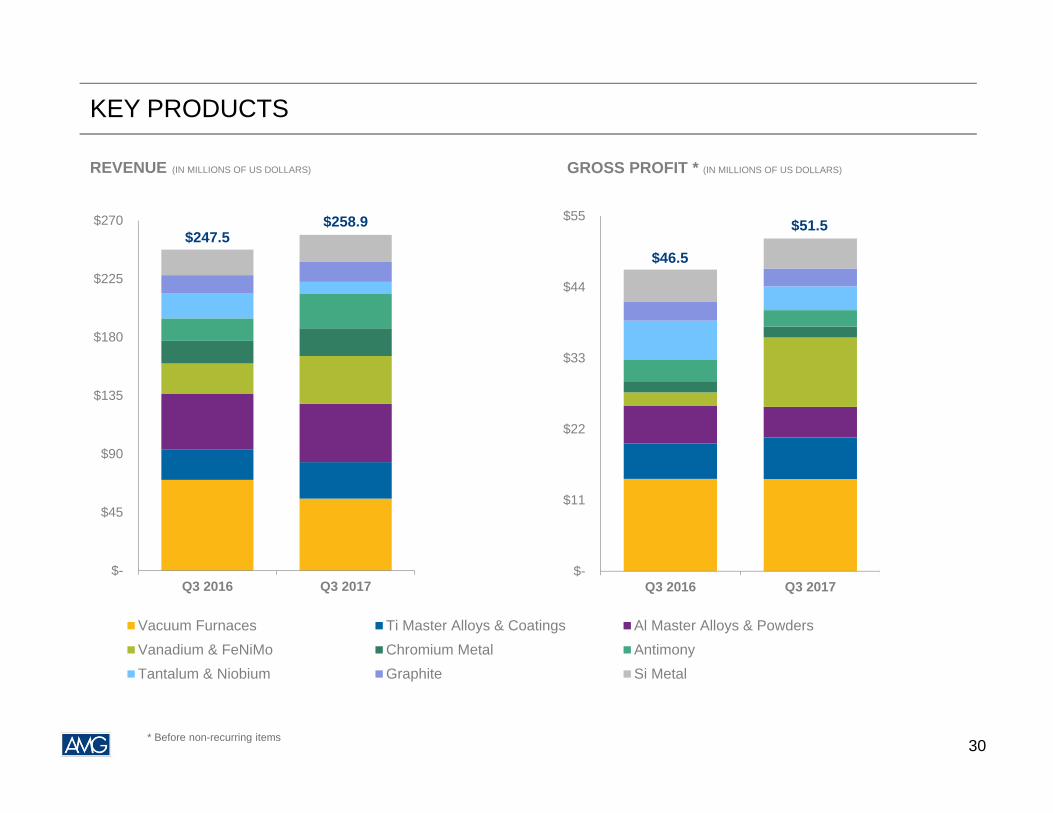
KEY PRODUCTS
$-
$45
$90
$135
$180
$225
$270
Q3 2016 Q3 2017
Vacuum Furnaces Ti Master Alloys & Coatings Al Master Alloys & PowdersVanadium & FeNiMo Chromium Metal AntimonyTantalum & Niobium Graphite Si Metal
$-
$11
$22
$33
$44
$55
Q3 2016 Q3 2017
$51.5$258.9$247.5
$46.5
* Before non-recurring items
REVENUE (IN MILLIONS OF US DOLLARS) GROSS PROFIT * (IN MILLIONS OF US DOLLARS)
30
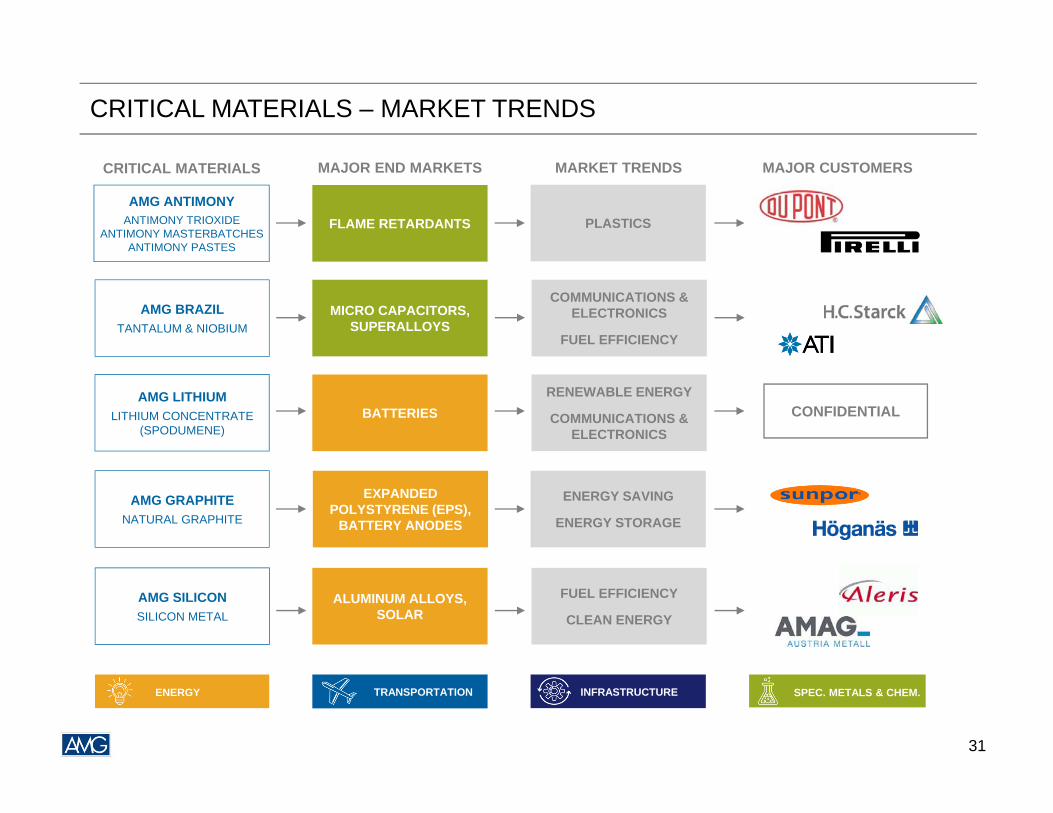
CRITICAL MATERIALS – MARKET TRENDS
ENERGY TRANSPORTATION INFRASTRUCTURE SPEC. METALS & CHEM.
CRITICAL MATERIALS MARKET TRENDSMAJOR END MARKETS MAJOR CUSTOMERS
AMG ANTIMONYANTIMONY TRIOXIDE
ANTIMONY MASTERBATCHESANTIMONY PASTES
PLASTICSFLAME RETARDANTS
MICRO CAPACITORS, SUPERALLOYS
AMG BRAZILTANTALUM & NIOBIUM
COMMUNICATIONS & ELECTRONICS
FUEL EFFICIENCY
EXPANDED POLYSTYRENE (EPS),
BATTERY ANODES
AMG GRAPHITENATURAL GRAPHITE
ENERGY SAVING
ENERGY STORAGE
ALUMINUM ALLOYS,SOLAR
AMG SILICONSILICON METAL
FUEL EFFICIENCY
CLEAN ENERGY
BATTERIES AMG LITHIUM
LITHIUM CONCENTRATE (SPODUMENE)
RENEWABLE ENERGY
COMMUNICATIONS & ELECTRONICS
CONFIDENTIAL
31
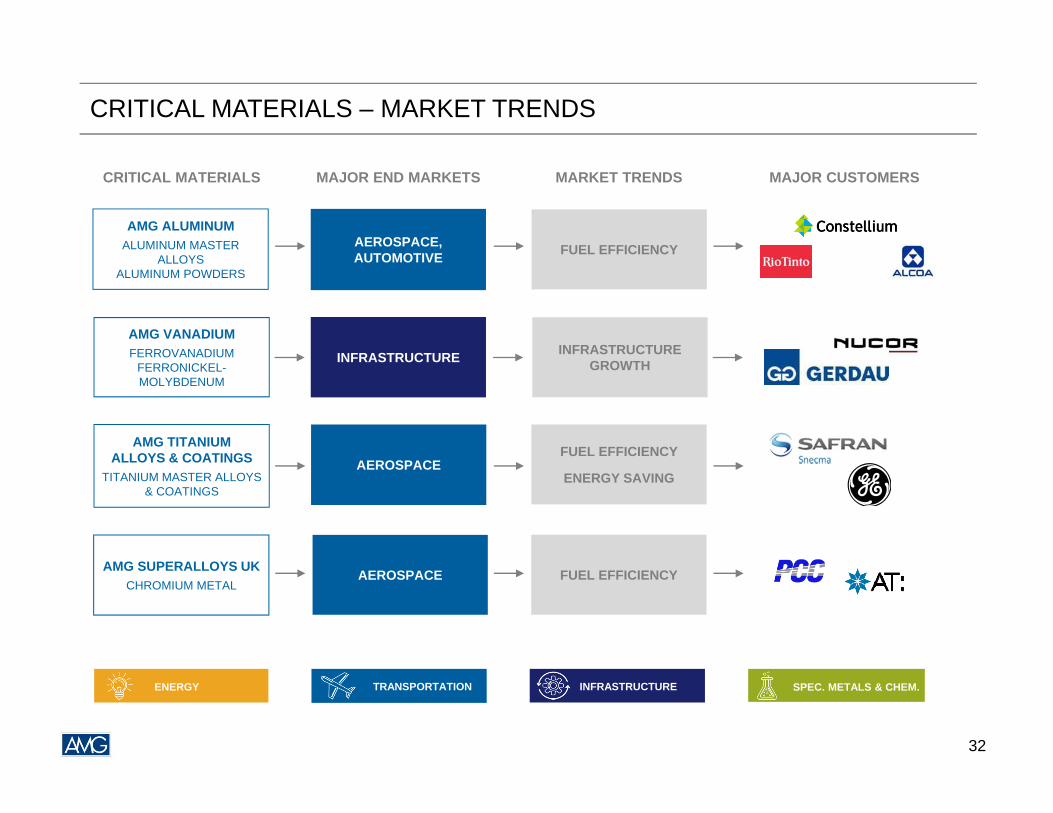
CRITICAL MATERIALS – MARKET TRENDS
AMG ALUMINUMALUMINUM MASTER
ALLOYSALUMINUM POWDERS
FUEL EFFICIENCYAEROSPACE, AUTOMOTIVE
INFRASTRUCTURE
AMG VANADIUMFERROVANADIUM
FERRONICKEL-MOLYBDENUM
INFRASTRUCTURE GROWTH
AEROSPACEAMG TITANIUM
ALLOYS & COATINGSTITANIUM MASTER ALLOYS
& COATINGS
FUEL EFFICIENCY
ENERGY SAVING
AMG SUPERALLOYS UKCHROMIUM METAL
FUEL EFFICIENCYAEROSPACE
CRITICAL MATERIALS MARKET TRENDSMAJOR END MARKETS MAJOR CUSTOMERS
ENERGY TRANSPORTATION INFRASTRUCTURE SPEC. METALS & CHEM.
32
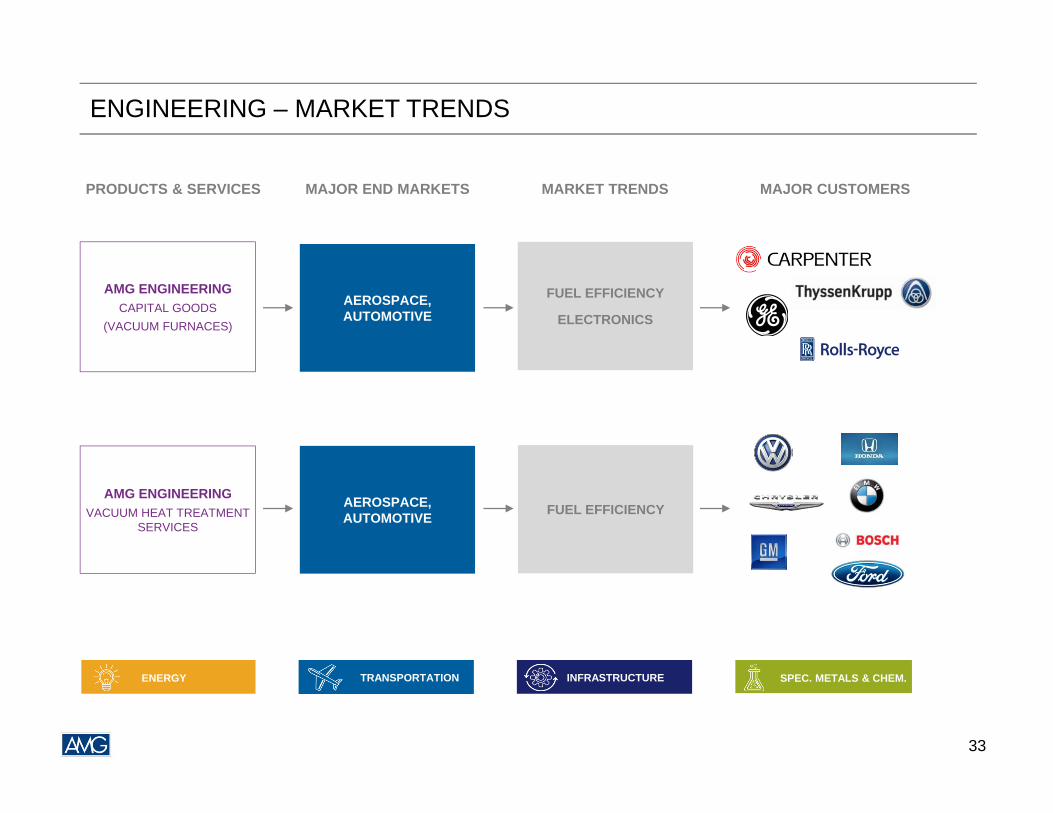
ENGINEERING – MARKET TRENDS
AMG ENGINEERING CAPITAL GOODS
(VACUUM FURNACES)
FUEL EFFICIENCY
ELECTRONICS
AMG ENGINEERING VACUUM HEAT TREATMENT
SERVICESFUEL EFFICIENCYAEROSPACE,
AUTOMOTIVE
AEROSPACE, AUTOMOTIVE
PRODUCTS & SERVICES MARKET TRENDSMAJOR END MARKETS MAJOR CUSTOMERS
ENERGY TRANSPORTATION INFRASTRUCTURE SPEC. METALS & CHEM.
33
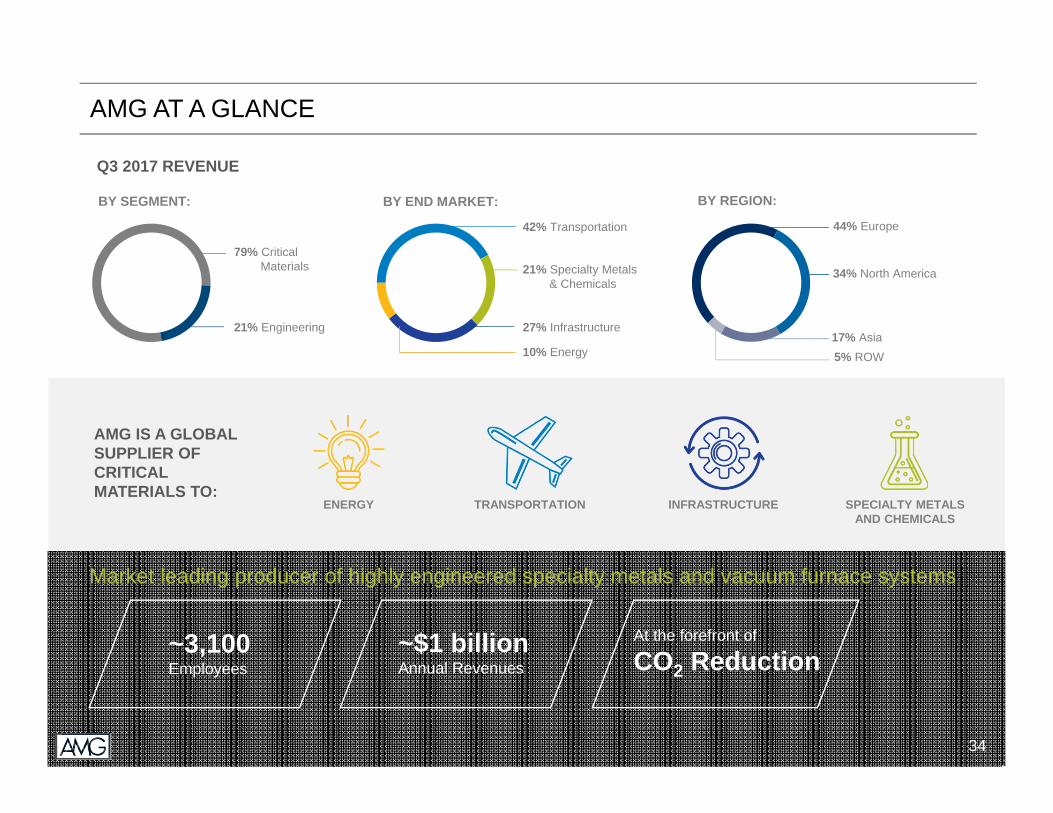
AMG AT A GLANCE
AMG IS A GLOBAL SUPPLIER OF CRITICAL MATERIALS TO:
Q3 2017 REVENUE
TRANSPORTATIONENERGY INFRASTRUCTURE SPECIALTY METALSAND CHEMICALS
BY END MARKET: BY REGION:BY SEGMENT:
44% Europe
34% North America
17% Asia5% ROW
21% Engineering
79% Critical Materials
27% Infrastructure
21% Specialty Metals & Chemicals
42% Transportation
10% Energy
Market leading producer of highly engineered specialty metals and vacuum furnace systems
~3,100Employees
~$1 billionAnnual Revenues
At the forefront of
CO2 Reduction
34
AMG Advanced Metallurgical Group N.V.
Appendix
35
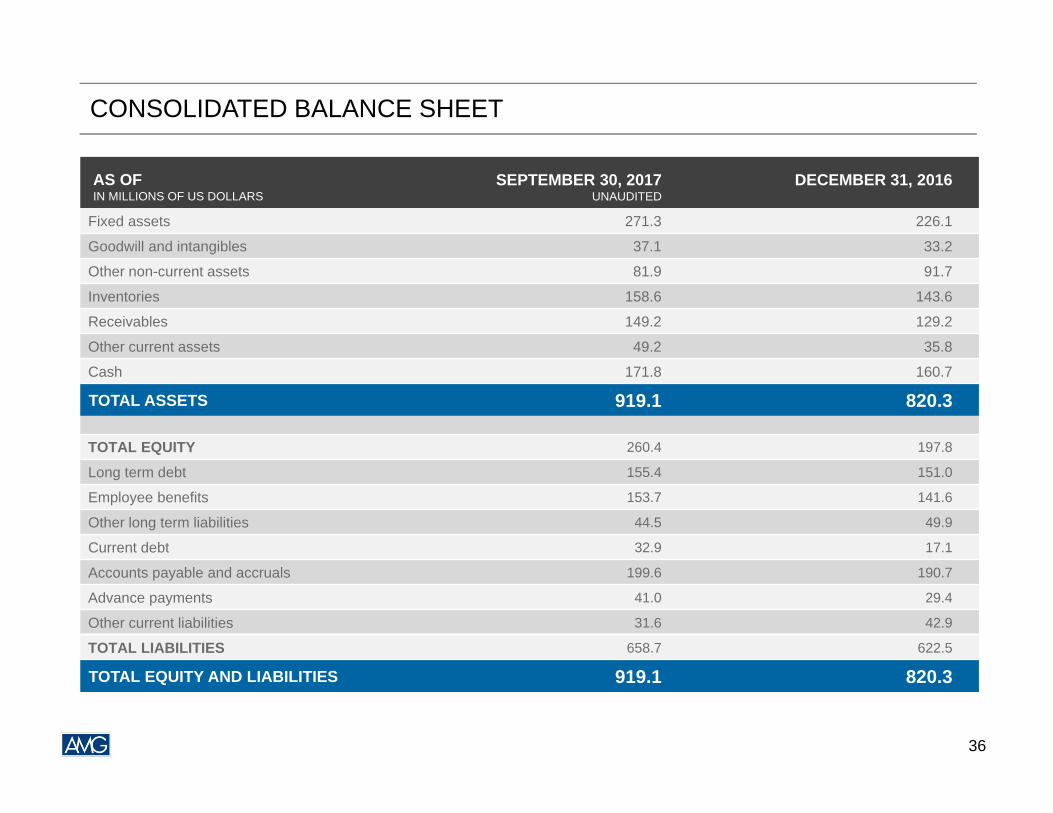
CONSOLIDATED BALANCE SHEET
AS OFIN MILLIONS OF US DOLLARS
SEPTEMBER 30, 2017UNAUDITED
DECEMBER 31, 2016
Fixed assets 271.3 226.1
Goodwill and intangibles 37.1 33.2
Other non-current assets 81.9 91.7
Inventories 158.6 143.6
Receivables 149.2 129.2
Other current assets 49.2 35.8
Cash 171.8 160.7
TOTAL ASSETS 919.1 820.3
TOTAL EQUITY 260.4 197.8
Long term debt 155.4 151.0
Employee benefits 153.7 141.6
Other long term liabilities 44.5 49.9
Current debt 32.9 17.1
Accounts payable and accruals 199.6 190.7
Advance payments 41.0 29.4
Other current liabilities 31.6 42.9
TOTAL LIABILITIES 658.7 622.5
TOTAL EQUITY AND LIABILITIES 919.1 820.3
36
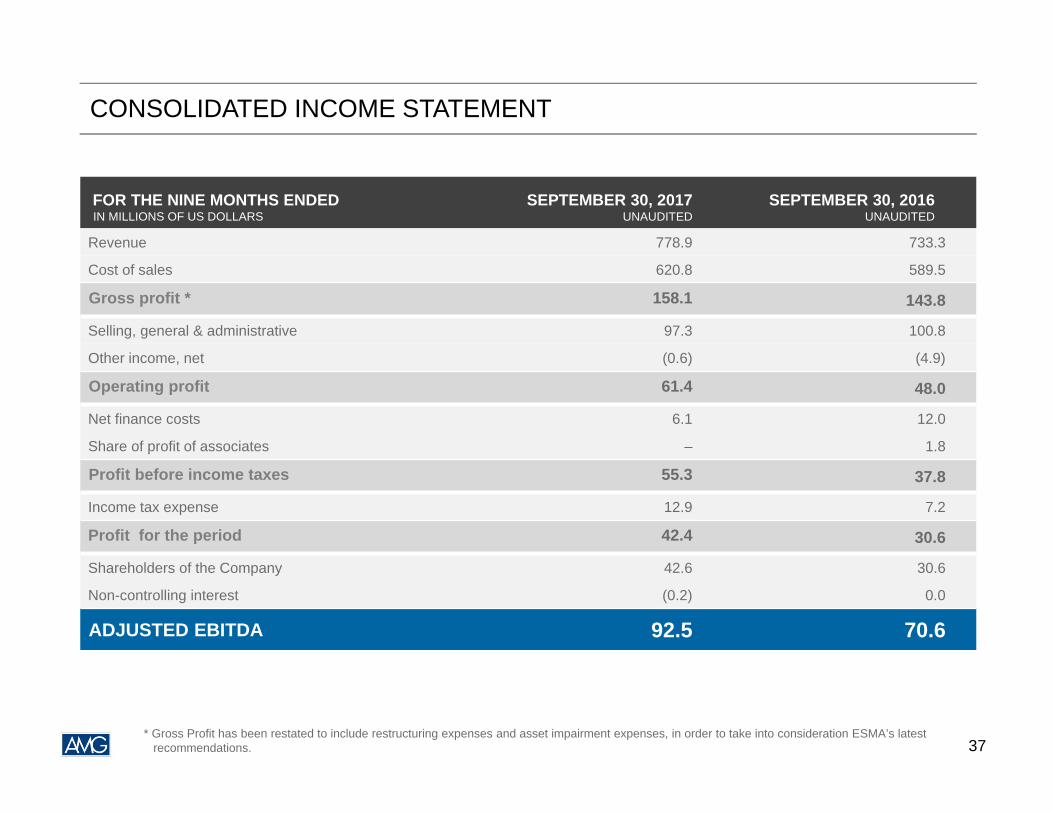
CONSOLIDATED INCOME STATEMENT
FOR THE NINE MONTHS ENDED IN MILLIONS OF US DOLLARS
SEPTEMBER 30, 2017UNAUDITED
SEPTEMBER 30, 2016UNAUDITED
Revenue 778.9 733.3
Cost of sales 620.8 589.5
Gross profit * 158.1 143.8
Selling, general & administrative 97.3 100.8
Other income, net (0.6) (4.9)
Operating profit 61.4 48.0
Net finance costs 6.1 12.0
Share of profit of associates – 1.8
Profit before income taxes 55.3 37.8
Income tax expense 12.9 7.2
Profit for the period 42.4 30.6
Shareholders of the Company 42.6 30.6
Non-controlling interest (0.2) 0.0
ADJUSTED EBITDA 92.5 70.6
* Gross Profit has been restated to include restructuring expenses and asset impairment expenses, in order to take into consideration ESMA’s latest recommendations. 37
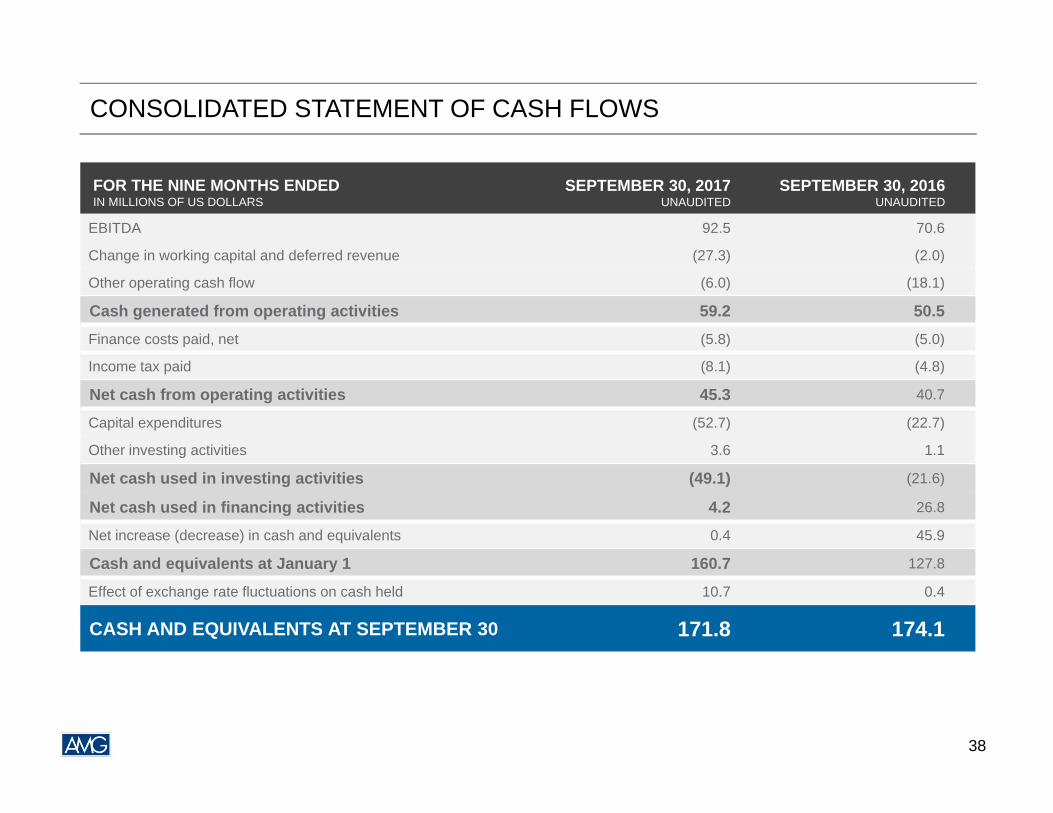
CONSOLIDATED STATEMENT OF CASH FLOWS
FOR THE NINE MONTHS ENDED IN MILLIONS OF US DOLLARS
SEPTEMBER 30, 2017UNAUDITED
SEPTEMBER 30, 2016UNAUDITED
EBITDA 92.5 70.6
Change in working capital and deferred revenue (27.3) (2.0)
Other operating cash flow (6.0) (18.1)
Cash generated from operating activities 59.2 50.5Finance costs paid, net (5.8) (5.0)
Income tax paid (8.1) (4.8)
Net cash from operating activities 45.3 40.7
Capital expenditures (52.7) (22.7)
Other investing activities 3.6 1.1
Net cash used in investing activities (49.1) (21.6)
Net cash used in financing activities 4.2 26.8
Net increase (decrease) in cash and equivalents 0.4 45.9
Cash and equivalents at January 1 160.7 127.8
Effect of exchange rate fluctuations on cash held 10.7 0.4
CASH AND EQUIVALENTS AT SEPTEMBER 30 171.8 174.1
38