amerus group co/ia - shareholder group co/ia (unscheduled material events) filed 10/2/2003 for...
TRANSCRIPT
FORM 8-K
AMERUS GROUP CO/IA
(Unscheduled Material Events)
Filed 10/2/2003 For Period Ending 9/30/2003
Address 699 WALNUT STREET
DES MOINES, Iowa 50309
Telephone 515-362-3600
CIK 0001051717
Industry Insurance (Life)
Sector Financial
Fiscal Year 12/31

UNITED STATES SECURITIES AND EXCHANGE COMMISSION
Washington, D.C. 20549
FORM 8-K
CURRENT REPORT
PURSUANT TO SECTION 13 OR 15(d) OF THE SECURITIES EXCHANGE ACT OF 1934
Date of Report (Date of earliest event reported: September 30, 2003)
AMERUS GROUP CO. (Exact Name of Registrant as Specified in its Charter)
Registrant’s telephone number, including area code: (515) 362-3600
IOWA 42-1458424 001-15166
(State or Other Jurisdiction
of Incorporation) (Commission File Number)
(IRS Employer Identification No.)
699 WALNUT STREET DES MOINES, IOWA
50309-3948
(Address of principal executive offices) (Zip Code)

ITEM 7 (c). EXHIBITS
ITEM 12. RESULTS OF OPERATIONS AND FINANCIAL CONDITION
On September 30, 2003, management of AmerUs Group Co. (“Company”) presented the materials attached hereto as Exhibit 99.1 via web cast.
During the web cast, the Company also disclosed the following.
Spreads on new sales for the Company’s premium allocation strategies for its equity index annuity products are approximately 200 basis points for the multi-year equity index strategy; approximately 300 basis points for the annual equity index strategy; approximately 200 basis points for the traditional fixed strategy; approximately 250-275 basis points (varying by product) for total return strategies.
99.1
AmerUs Group Co. Presentation on Equity Index Annuities and Equity Index Life Insurance on September 30, 2003 (furnished pursuant to Item 12)
SIGNATURE
Pursuant to the requirements of the Securities Exchange Act of 1934, the Registrant has duly caused this report to be signed on its behalf by the undersigned hereunto duly authorized.
Dated: October 2, 2003
AMERUS GROUP CO.
By:
/s/ MELINDA S. URION
Melinda S. Urion Executive Vice President and Chief Financial Officer

EXHIBITS Exhibit No Description
99.1
AmerUs Group Co. Presentation on Equity Index Annuities and Equity Index Life Insurance on September 30, 2003 (furnished pursuant to Item 12)

EXHIBIT 99.1
AmerUs Group's Equity Index Annuit ies and Equ ity Index L ife Insurance September 30, 2003

Safe Harbor Statement All s tatements, trend analyses and other information contained in this report relative to markets for our products and trends in ou r operating or financial resul ts, as well as other statements including words such as "anticipate", "bel ieve", "plan", "estimate", "expect", "intend", and other similar expressions, constitute forward -looking statements under the Private Securi ties Li tigat ion Reform Act of 1995 . Factors that may cause our actual results to differ material ly from those contemp lated by these fo rward -looking statements include, among others, the fo llowing possibi lit ies: (a) general economic condit ions and performance of our investment portfolio (b) customer response to new products and marketing in itiat ives; (c) increasing competition in the sale of insurance and annuities and the recruitmen t of sales represen tatives; (d) regulatory changes including those related to the sale of products ; and (e) expected product margins. Please refer to the Company's 10 -K and most recent 10 -Q fo r add itional facto rs . There can be no assurances that other factors no t current ly anticipated by us will not materially and adversely our results of operat ions. You are cautioned not to place undue reliance on any forward-looking statements made by us on our behalf. All s tatements speak only as of the date of the presentation was made or as of the date speci fied in the statement. We undertake no obligat ion to update o r revise any fo rward-looking or historical statements o r o ther factual assertions con tained in the presen tation .

Non-GAAP Information Sales Sales are presented as annualized premium, wh ich is measured in accordance with industry pract ice, and represent the amount of new business sold during the period . Sales are a non- GAAP financial measure for an insurance company for which there is no comparable GAAP financial measure. We use sales to measure the productivity of our dis tribut ion network and as a basis fo r compensation of sales and marketing employees and agents. Sales are also a lead ing indicator of futu re revenue trends. However, revenues are driven by prior period sales as well as current period sales and therefo re, a reconci liation of sales to revenues would not be meaningful or determinable. Product-Related Measures This presentation contains statistical and o ther measures which are not GAAP financial measures and fo r wh ich there are no comparable GAAP measures. Since these measures are derived in part from statuto ry financial measures and other measures used in industry practice, no reconcil iation to a comparable GAAP measure would be determinable or meaningful These measures are in accordance with insurance industry pract ice and are, we believe, useful in describing the characteristics and profitab ility of the Company's products. T hese measures include, for example, the expected internal rate of retu rn on statutory distributable earnings, expected margins, sp reads on premium allocation strategies and b locks of business and pol icyholder account value.

Equity Index Products Simple Product-- Some Account ing Differences Simple because they're similar to our tradit ional fixed products Similarities : Allocat ion o f policyho lder premium: 10 cents^Agen t commiss ion 87 cents^Invest in well-diversified fixed income portfol io 3 cents^Credited rate paid to pol icyholder Differences: What happens to the 3 cents T radi tional fixed product: Returned to pol icyholder as the credited rate Equity index product: Invested in S&P 500 index options to support po licyholder participation in equity index gains, up to a cap Different because of accounting treatment under FAS 133
Agenda Equity Index Annu ities Product structure, profitabi lity and experience Quest ion and answer sess ion E quity Index Life Insurance Product s tructure, profitabil ity and experience Question and answer sess ion Hedging and accounting Overview Question and answ er sess ion Summary

Equity Index Product Rat ionale Equity index (EI) p roducts: Meet consumer's need and financial ob ject ives Offer greater pro fi t poten tial Offer a sustainable advantage Leverage A merUs Group's management skil ls
Equity Index Annuities
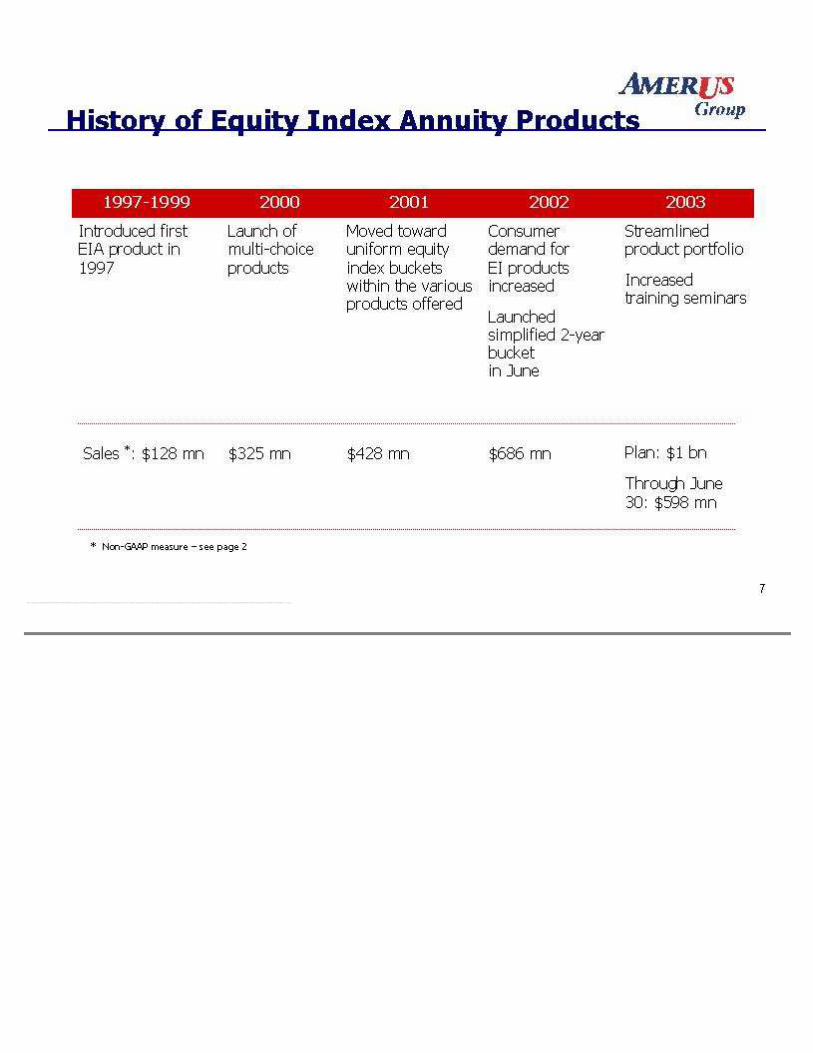
Histo ry of Equity Index Annu ity Products 1997-1999 2000 2001 2002 2003 Introduced fi rst EIA product in 1997 Launch of multi -cho ice p roducts Moved toward un iform equity index buckets within the various products o ffered Consumer demand for EI products increased Launched s imp lified 2 -year bucket in June Streamlined product port fol io Increased training seminars Sales *: $128 mn $325 mn $428 mn $686 mn Plan: $1 bn Through June 30: $598 mn * Non-GAAP measure - see page 2
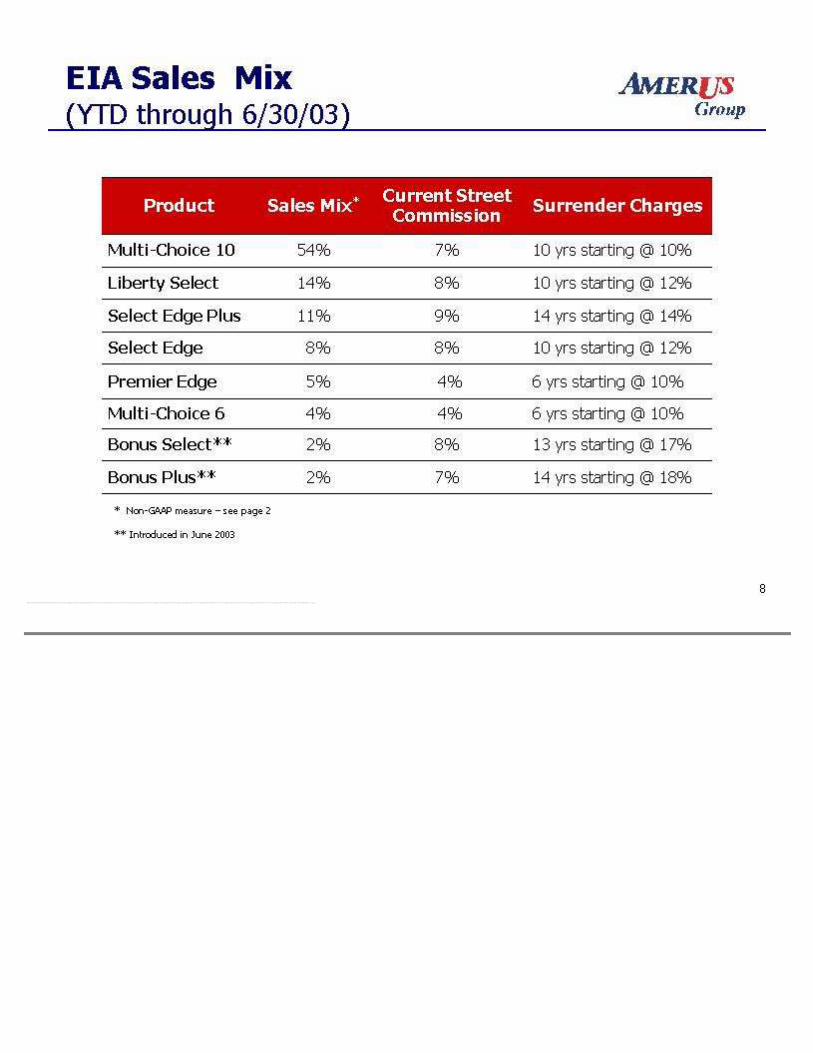
EIA Sales Mix (YTD through 6/30/03) Product Sales Mix* Current Street Commission Surrender Charges Mult i-Choice 10 54% 7% 10 yrs starting @ 10% Liberty Select 14% 8% 10 y rs starting @ 12% Select E dge Plus 11% 9% 14 yrs s tarting @ 14% Select Edge 8% 8% 10 yrs starting @ 12% Premier Edge 5% 4% 6 yrs starting @ 10% Multi -Choice 6 4% 4% 6 yrs s tarting @ 10% Bonus Select** 2% 8% 13 yrs start ing @ 17% Bonus Plus** 2% 7% 14 yrs starting @ 18% ** In troduced in June 2003 * Non-GAAP measure - see page 2

Premium Allocat ion Strategies Stated Spread A nnual Guarantee* Maximum Annual Gain Curren t Benefit Structu re Multi -Year Equity Impl icit 0% 7.5% 100% of index up to 15% over 2 years Annual Equity Implici t 0% 7.5% 100% o f average index up to 11% less 3.5% fee Trad itional Fixed Rate Implicit 2% None 3% Investment Grade Bond Index Exp licit 0% None Total return less 2.50% - 2.75% annual fee Convert ible Bond E xplici t 0% None To tal return less 2.50% - 2.75% annual fee * Each policy has an underlying guarantee
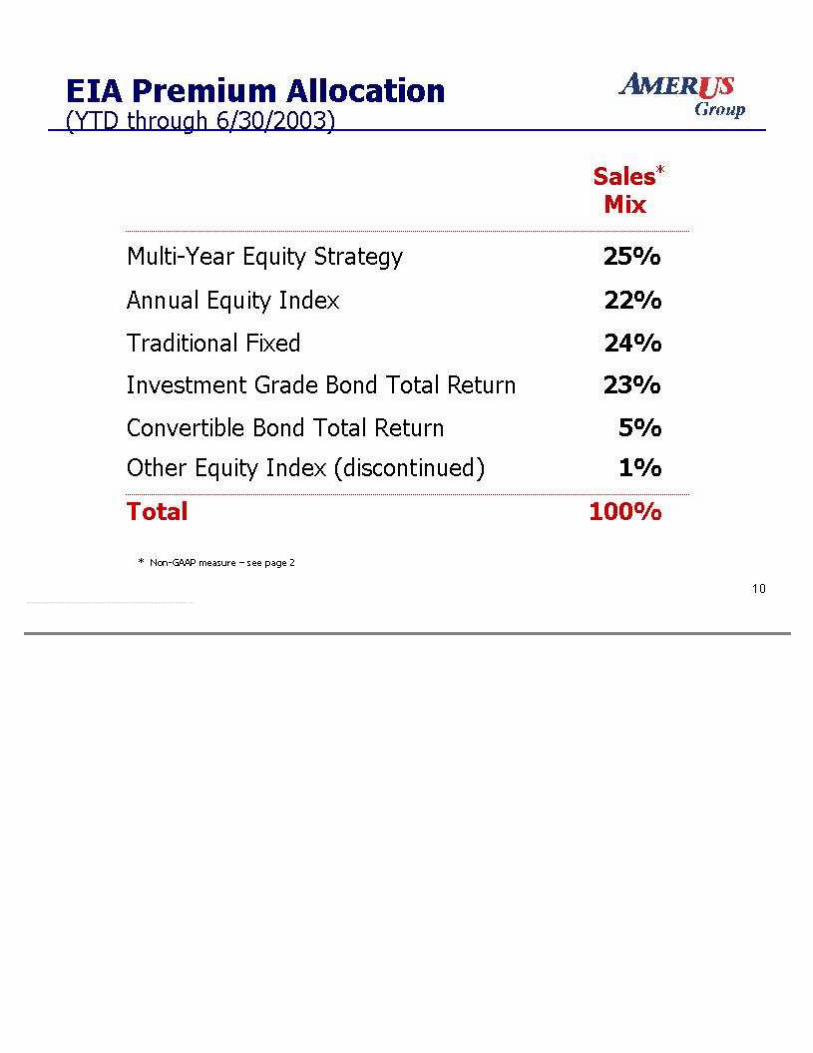
EIA Premium Allocat ion (YTD through 6 /30/2003) Sales* Mix Mu lti -Year Equity Strategy 25% Annual Equ ity Index 22% Traditional Fixed 24% Investment Grade Bond Total Retu rn 23% Convertible Bond Total Return 5% Other E quity Index (discontinued) 1% To tal 100% * Non-GAAP measure - see page 2
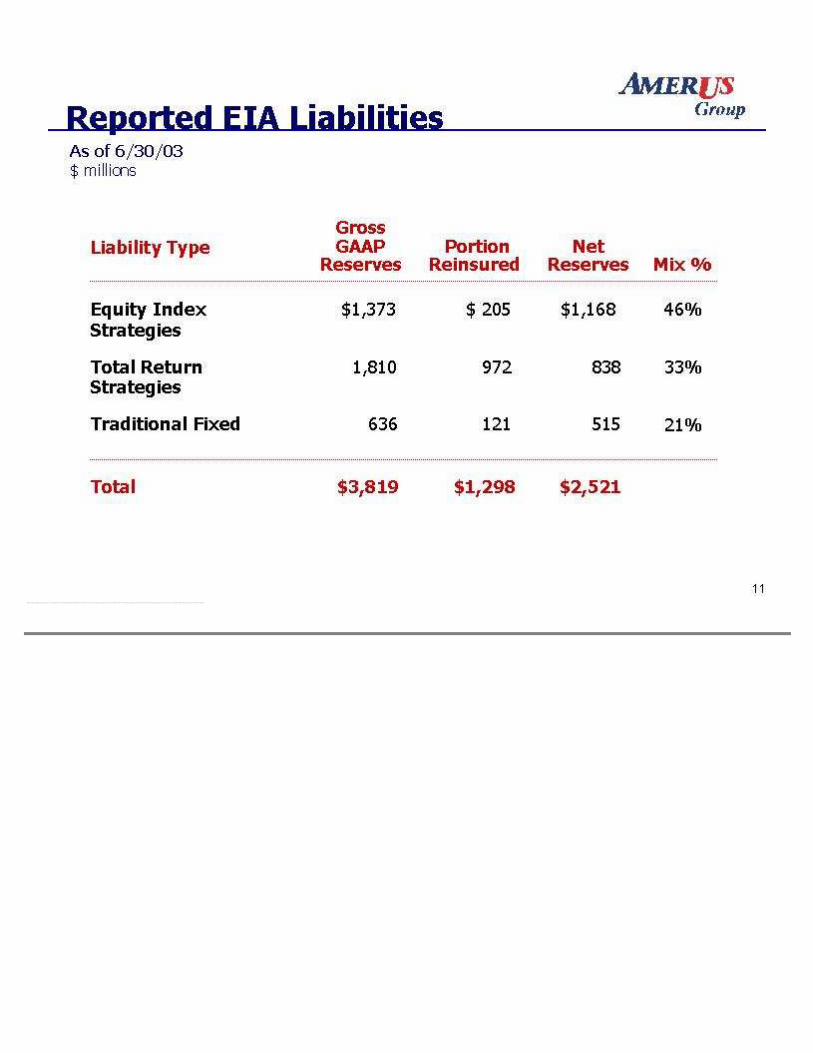
Reported EIA Liabi lit ies Liabi lity Type Gross GAAP Reserves Port ion Reinsured Portion Reinsured Net Reserves Mix % Equity Index Strategies $1,373 $1,373 $ 205 $1,168 46% Total Retu rn Strategies 1,810 1 ,810 972 838 33% Trad itional Fixed 636 636 121 515 21% Total $3,819 $3,819 $1,298 $2,521 As of 6/30/03 $ mi llions

Product Levers Mult i-Year Equity Strategy Reset cap rate bi-annual ly Annual Equity Strategy Reset cap rate and/o r fee annually T otal Return Strateg ies Reset spread annual ly Tradit ional Fixed Strategy Reset credi ted rate annual ly
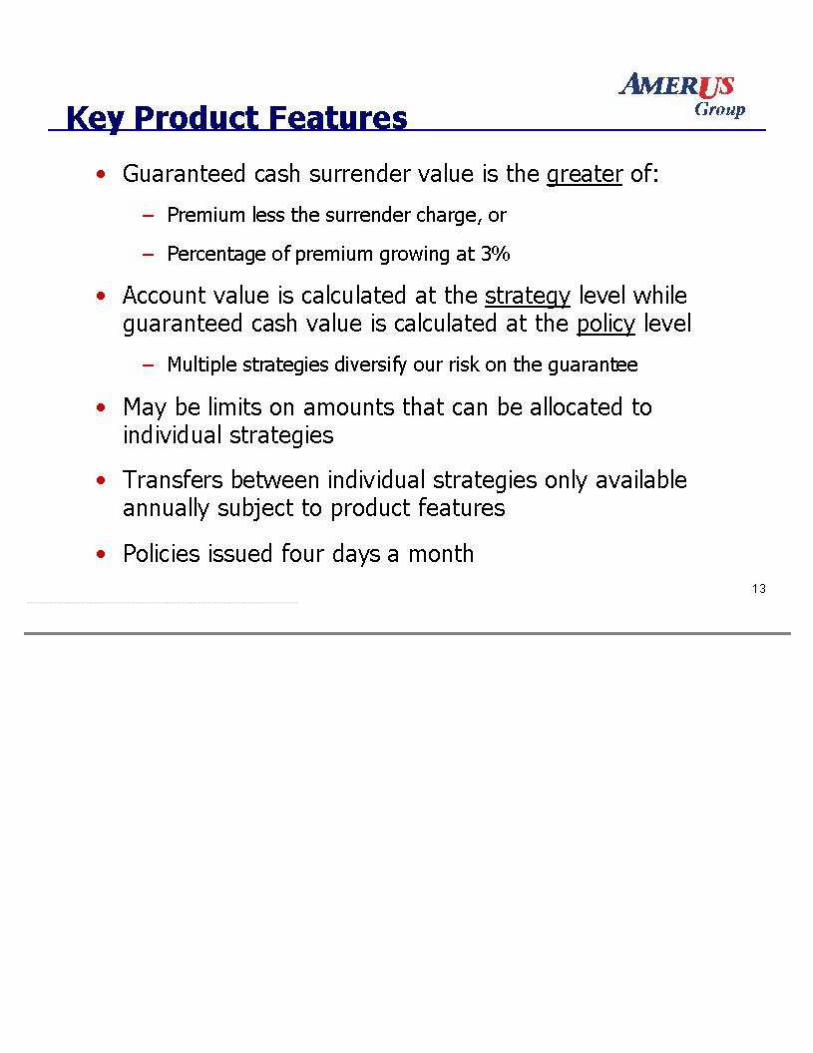
Key Product Features Guaranteed cash surrender value is the greater of: Premium less the surrender charge, or Percentage of premium growing at 3% Account value is calculated at the s trategy level whi le guaran teed cash value is calculated at the policy level Multiple s trategies diversi fy our risk on the guarantee May be limits on amounts that can be allocated to individual strategies Transfers between individual strategies on ly available annual ly subject to p roduct featu res Pol icies issued four days a month
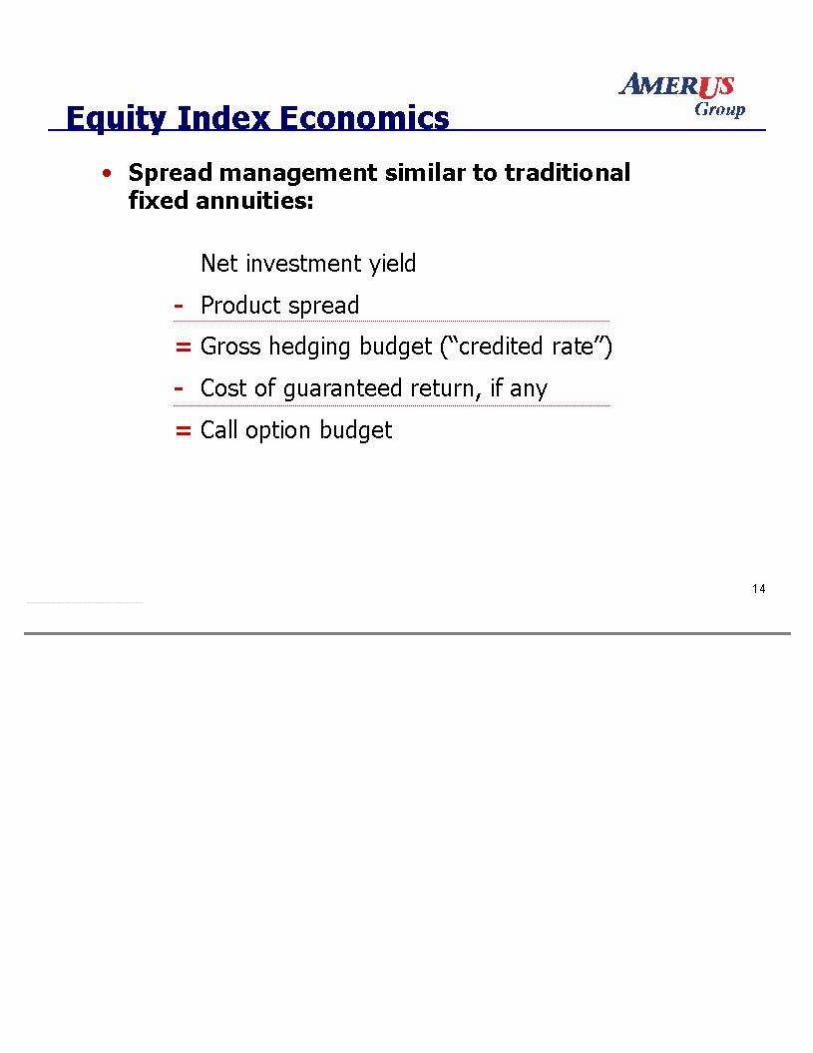
Equity Index Economics Spread management similar to traditional fixed annuities: Net investment yield - Product spread = Gross hedging budget ("credi ted rate") - Cost of guaranteed retu rn , if any = Call opt ion budget

Equity Index Economics Guaran tees are funded by the fixed income securi ties Cal l op tions are purchased to hedge the equity index s trategy exposure We are not invest ing in the s tock market Index-linked credited interest is funded by the proceeds from the cal l opt ions Product is p rofi table even if options exp ire worthless
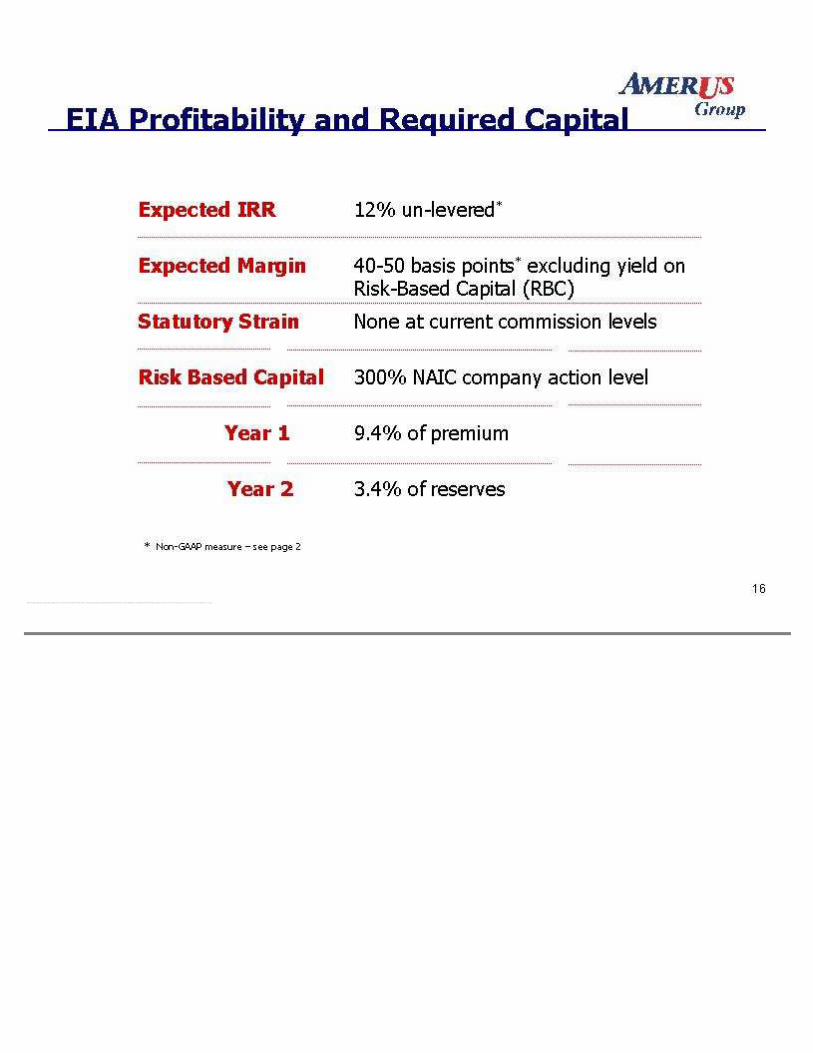
EIA Profitabi lity and Requ ired Capital Expected IRR 12% un-levered* Expected Margin 40-50 basis poin ts* exclud ing y ield on Risk -Based Capital (RBC) Statu tory Strain None at current commiss ion levels Risk Based Capital 300% NAIC company action level Year 1 9.4% o f p remium Year 2 3.4% of reserves * Non-GAAP measure - see page 2

Experience To Date Spreads have been better than pricing Generally in the 250 basis point range (excluding IL Annuity block)* Slow account value growth has offset some of this favorable experience Anti -selection on exercise of free look was minimal during the bear market Surrenders consis tent with expectations Overal l performance has met expectat ions * Non-GAAP measure - see page 2
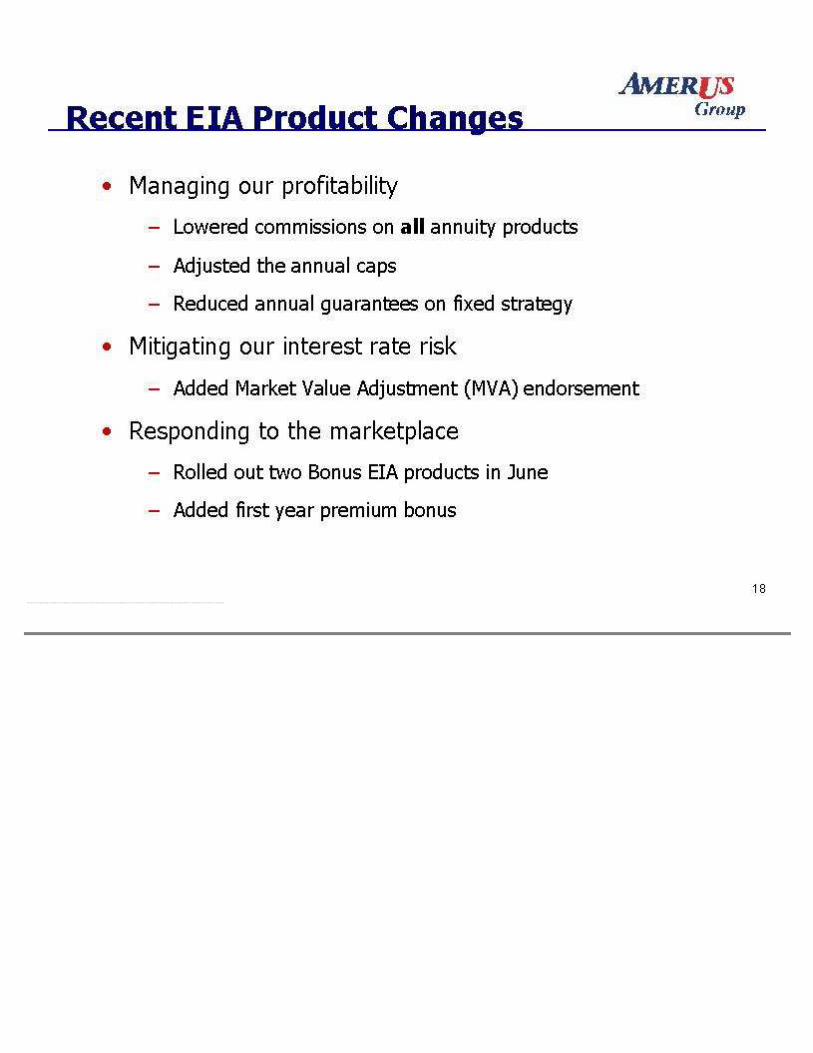
Recent EIA Product Changes Managing our profitabil ity Lowered commissions on all annuity products Adjusted the annual caps Reduced annual guarantees on fixed s trategy Mitigating our interest rate risk Added Market Value Adjustment (MVA) endorsement Responding to the marketp lace Rolled out tw o Bonus EIA products in June Added first year p remium bonus
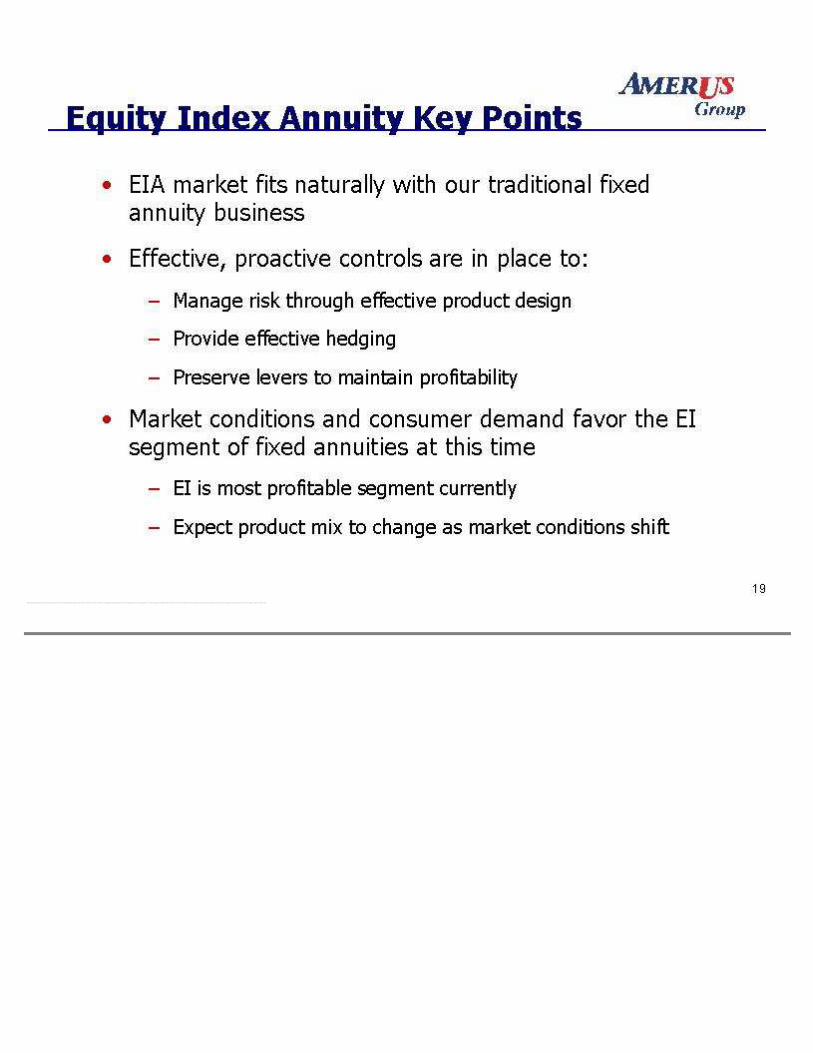
Equity Index Annuity Key Poin ts EIA market fi ts natu rally with our tradit ional fixed annuity business Effective, proactive controls are in place to: Manage risk through effective product design Provide effect ive hedging Preserve levers to maintain p ro fi tabili ty Market conditions and consumer demand favor the EI segment of fixed annu ities at this time EI is most p ro fi table segment cu rrently Expect product mix to change as market conditions sh ift

Equity Index Annuities Q & A

Equity Index Life Insurance
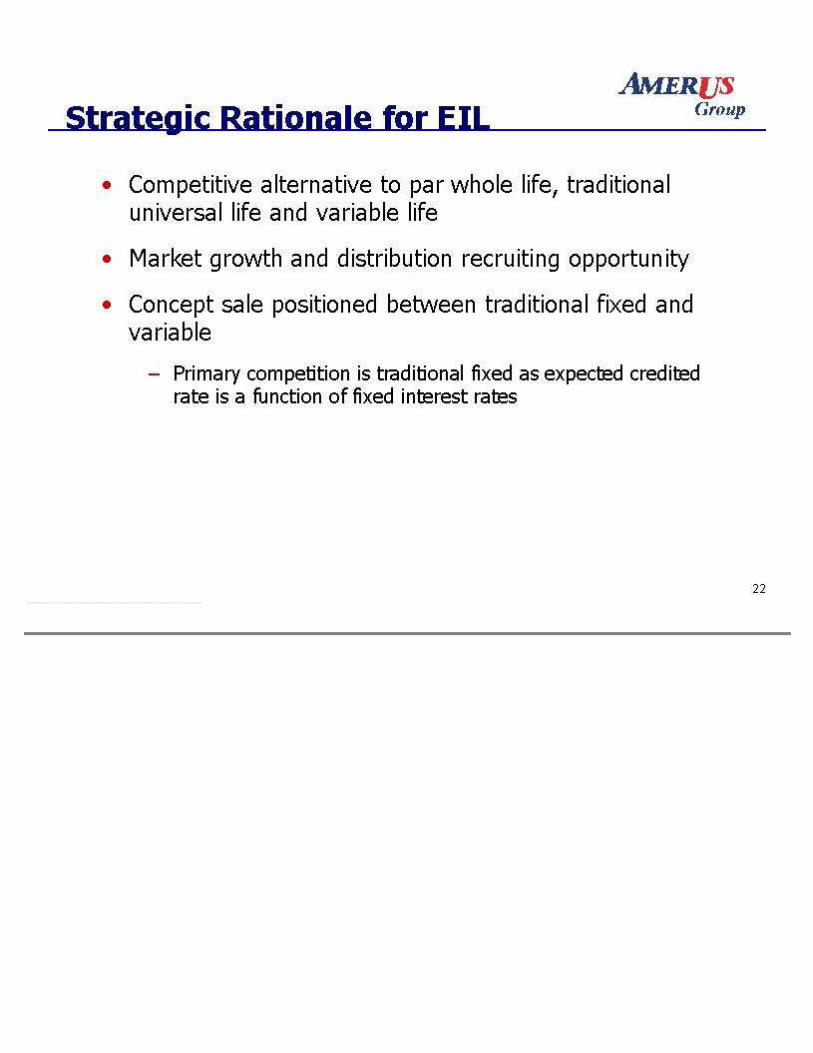
Strategic Rat ionale for EIL Competi tive alternative to par whole l ife, trad itional universal life and variable life Market growth and distribu tion recruiting opportuni ty Concep t sale pos itioned between traditional fixed and variable Primary competition is traditional fixed as expected cred ited rate is a function of fixed interest rates
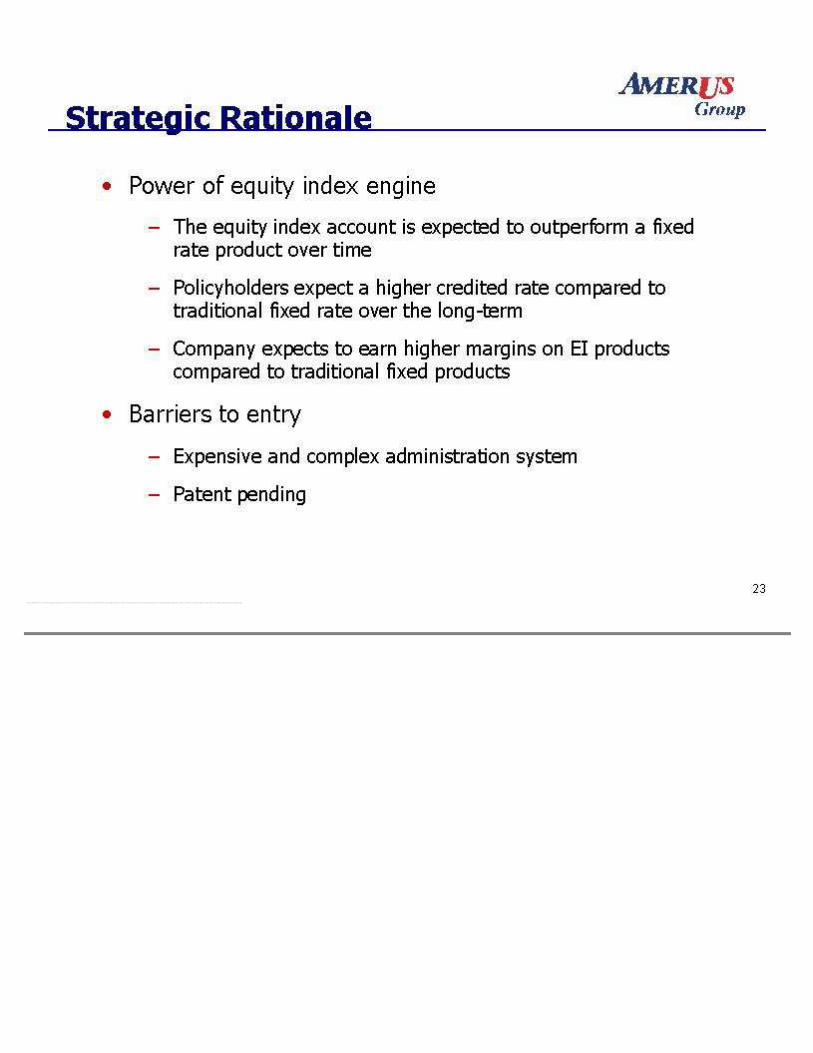
Strategic Rat ionale Power of equity index engine The equity index account is expected to outperform a fixed rate product over time Pol icyholders expect a higher credited rate compared to trad itional fixed rate over the long-term Company expects to earn h igher margins on EI products compared to tradi tional fixed products Barriers to entry Expensive and complex adminis trat ion system Patent pending
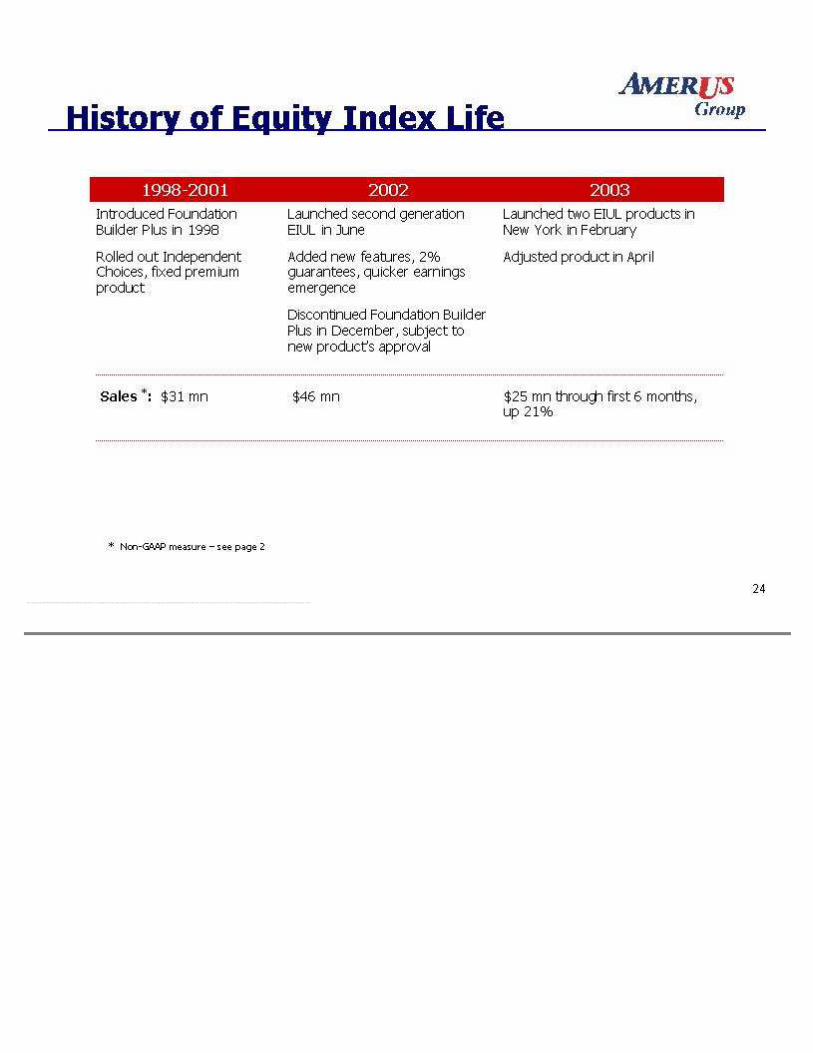
Histo ry of Equity Index Life 1998-2001 2002 2003 Introduced Foundation Builder Plus in 1998 Rolled out Independent Choices, fixed premium product L aunched second generation EIUL in June Added new features, 2% guarantees, quicker earnings emergence Discont inued Foundat ion Builder Plus in December, subject to new product 's approval Launched two EIUL products in New York in February Adjusted product in April Sales * : $31 mn $46 mn $25 mn through first 6 months, up 21% * Non-GAAP measure - see page 2

Equity Index Life Sales Mix ** Two E IUL products sold by each li fe company Product YTD through 6/30/03 June 2003 Account Value * Underlying Guarantee Current Annual Cap Premium Structu re Foundation Builder Plus 21% 6% $95.4 mn 3% 10% Flexible Independent Choices 7% 8% $4.7 mn 5% 9% Fixed Second Generat ion** 72% 86% $28.6 mn 2% 11% Flex ible * Non-GAAP measure - see page 2
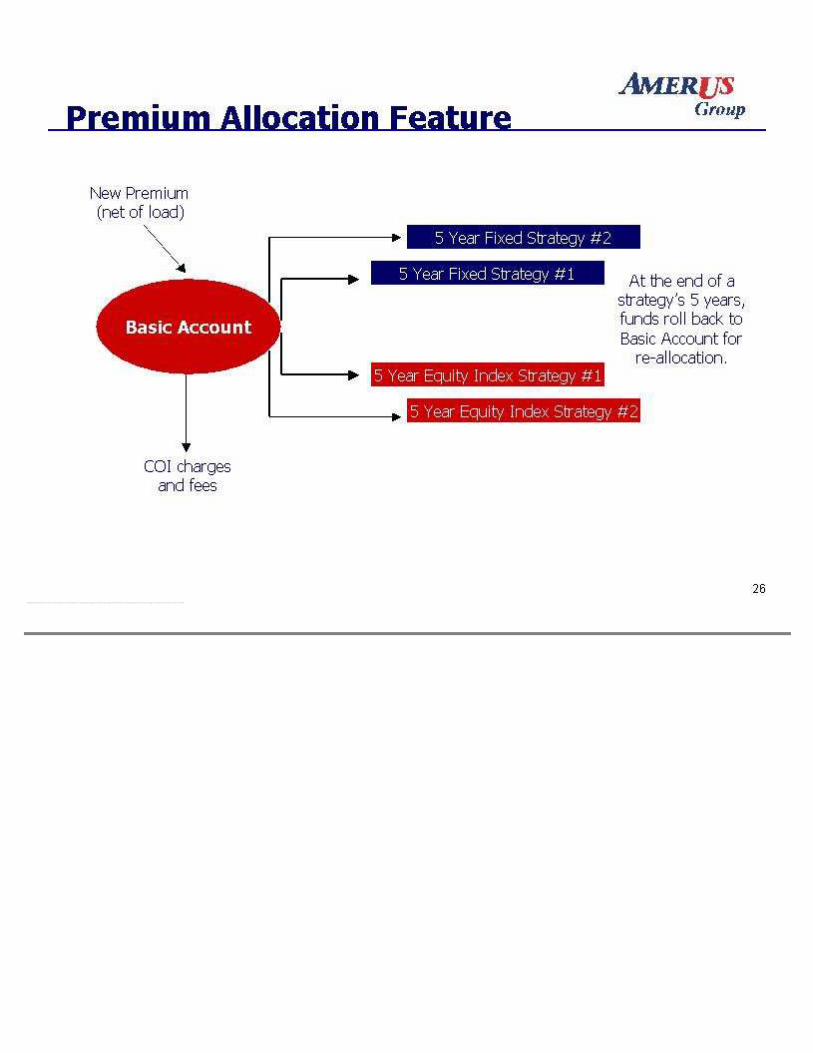
Premium Allocat ion Feature Basic Account 5 Year Fixed Strategy #2 5 Year Fixed Strategy #1 5 Year Equity Index Strategy #2 5 Year Equ ity Index Strategy #1 New Premium (net o f load) COI charges and fees At the end of a strategy's 5 years, funds roll back to Bas ic Accoun t for re-al locat ion.
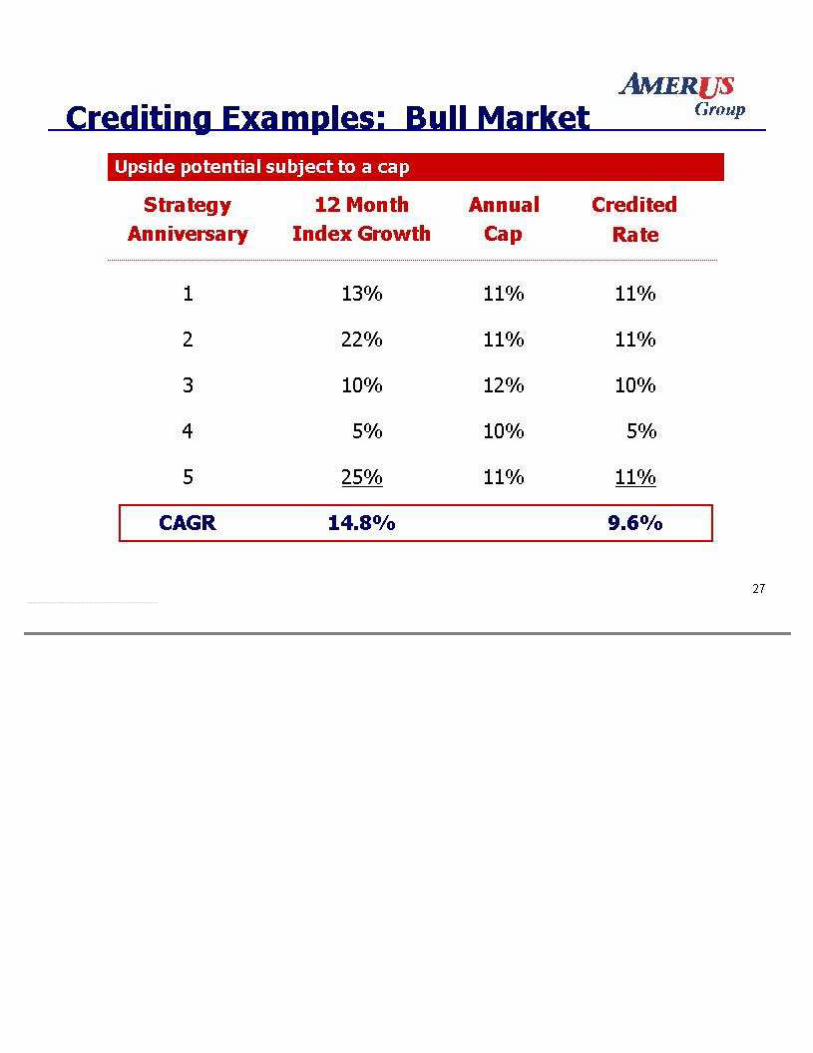
Crediting Examples: Bull Market Strategy Anniversary 12 Month Index Growth Annual Cap Credited Rate 1 13% 11% 11% 2 22% 11% 11% 3 10% 12% 10% 4 5% 10% 5% 5 25% 11% 11% CAG R 14 .8% 9.6% Upside poten tial subject to a cap

Crediting Examples: Bear Market Strategy Ann iversary 12 Month Index Growth Annual Cap Credited Rate 1 4% 11% 4% 2 -5% 11% 0% 3 -15% 12% 0% 4 8% 10% 8% 5 -2% 11% 0%* CAGR -2.3% 2.4% *Addit ional interest would be credi ted at this point to bring the 5 year CAGR up to 2%, if necessary. Annual lock-in and downside protection

Crediting Examples: Ex treme Bear Market Strategy Anniversary 12 Month Index Growth Annual Cap Credited Rate 1 -4% 11% 0% 2 -5% 11% 0% 3 -15% 12% 0% 4 -8% 10% 0% 5 -2% 11% 10.4%* CAGR -6.9% 2.0% G uarantee structu re (2%) *Additional interest would be credited at this point to bring the 5 year CAGR up to 2%, if necessary.
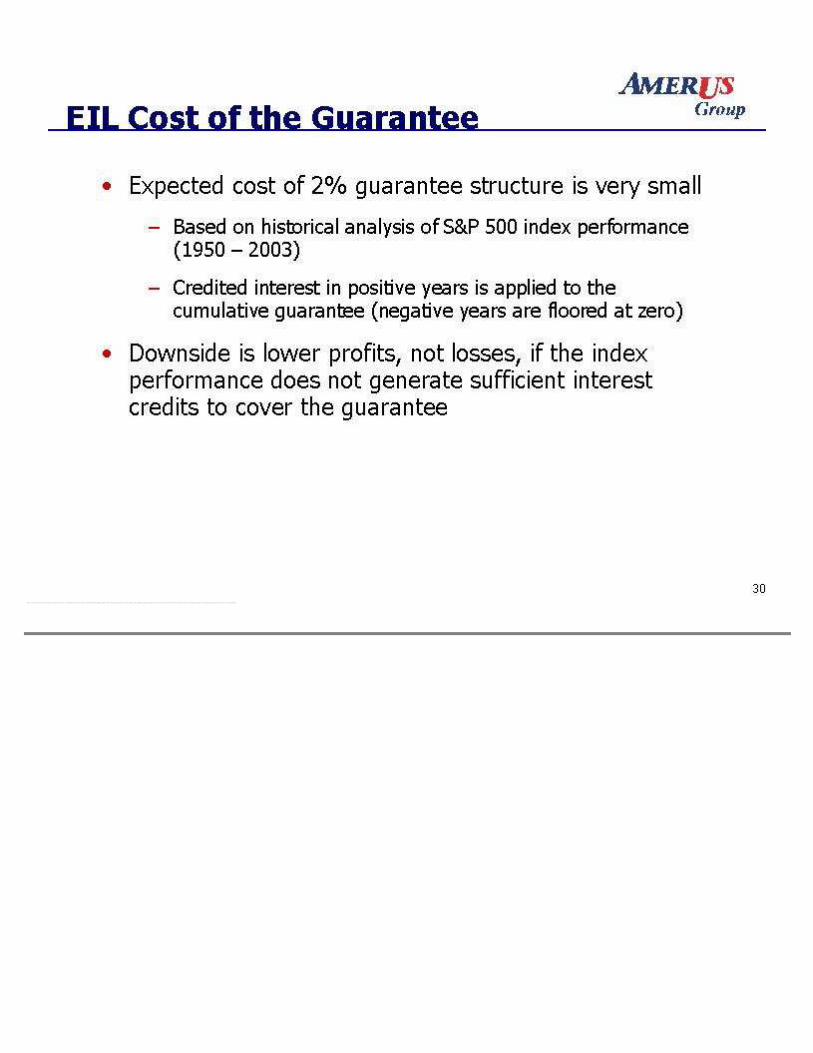
EIL Cost of the Guarantee Expected cost of 2% guarantee structure is very smal l Based on his torical analysis of S&P 500 index performance (1950 - 2003) Credited interest in pos itive years is applied to the cumulative guarantee (negative years are floo red at zero) Downside is lower profi ts, no t losses, if the index performance does not generate sufficient interest credi ts to cover the guarantee

EIL Cost of the Guarantee Poten tial management act ions in the event the index declines perpetually Fund some o f the cost of the guarantee by not hedging the 5 th year after 4 consecutive down years since the cumulative guarantee (e.g. 10.4%) wi ll l ikely be credited in the 5th year regardless o f index perfo rmance Reduce the annual cap to reduce the hedging costs E xtend the 5 -year true-up period for newly created index buckets

Equity Index Life Economics Spread management similar to t radi tional universal l ife products: Net investment yield - Product spread = Gross hedging budget ("credi ted rate") - Expected cost of guarantee = Call option budget

Equity Index Life Economics One-year cal l opt ions are used to hedge the equity index exposure Guaran tees are funded by the fixed income securi ties Index-linked credited interest is funded by the proceeds from the cal l opt ions Hedging costs are managed by adjusting cap annual ly as needed

EIUL Profitabi lity and Required Capital Expected IRR 15% un-levered* Expected Margin 6 - 7% of premium*, excluding RBC Statuto ry Strain 40% of repet itive premium Risk Based Capital 300% NAIC company action level Year 1 24% of repet itive premium * Non-GAAP measure - see page 2

EIL Experience To D ate Spreads have been much better than pricing on a portfolio basis Spreads have been around 200 basis points; 60 basis points higher than target* Second quarter option costs were 4.5% (i.e. credited rate)* Spreads on a new money rate investment bas is have been sl ightly lower than pricing Accrued cost of guarantee is s ligh tly h igher than long- term expectat ions Persis tency has been better than expected Overal l performance has exceeded expectations * Non-GAAP measure - see page 2
Recent EIL Developments Added a No L apse Guarantee rider to the second generation products Guarantees death benefit for a fee Excel lent tool for competing against par whole l ife, trad itional UL and variable l ife Replacing Indianapo lis Life's niche Interest Sensi tive Whole Life p roduct with an equity-index version
Equity Index Life Key Points Niche segment of the tradit ional fixed life market "Sweet spot" of competitiveness and profitabi lity due to product innovation and administrat ive barriers to entry for smal ler companies Product challenges and risks are effectively managed Accelerated statutory pay back enhances our ab ili ty to finance sales growth, reduce risk and boost statutory cap ital Experience is consisten t with expectat ions

Equity Index Life Q & A
Hedg ing and A ccount ing
Hedg ing For Equity -Linked Strategies Most o f the premiums are invested cons istent with other products (e.g. fixed income security) Smal l part of the p remium is used to purchase cal l opt ions to hedge the equ ity index accoun t exposure Proceeds from the cal l opt ion replicates the credited interest
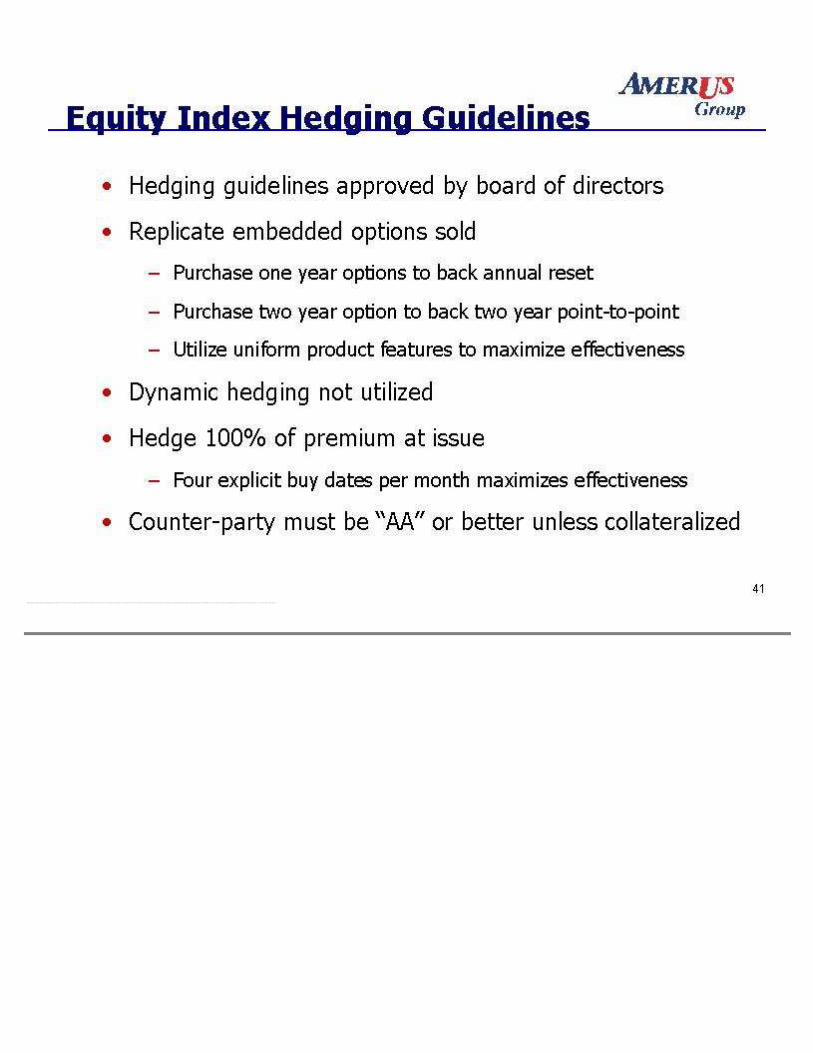
Equity Index Hedging Guidelines Hedging guidel ines approved by board of directors Rep licate embedded opt ions sold Purchase one year options to back annual reset Purchase two year opt ion to back two year poin t-to-point Util ize uniform p roduct featu res to maximize effect iveness Dynamic hedging not uti lized Hedge 100% of premium at issue Four explici t buy dates per month maximizes effectiveness Counter-party must be "AA" or better unless collateralized
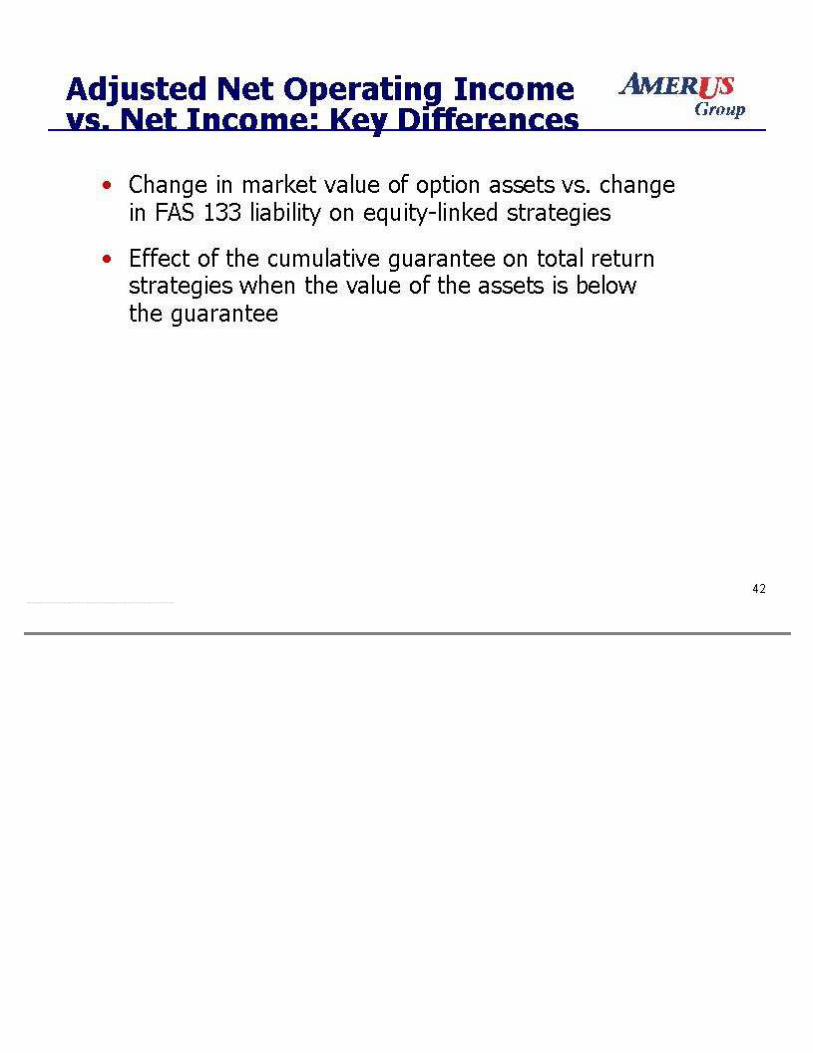
Adjusted Net Operat ing Income vs. Net Income: Key Differences Change in market value of opt ion assets vs. change in FAS 133 liabi lity on equity-linked s trateg ies Effect o f the cumulat ive guaran tee on total retu rn strategies when the value of the assets is below the guarantee
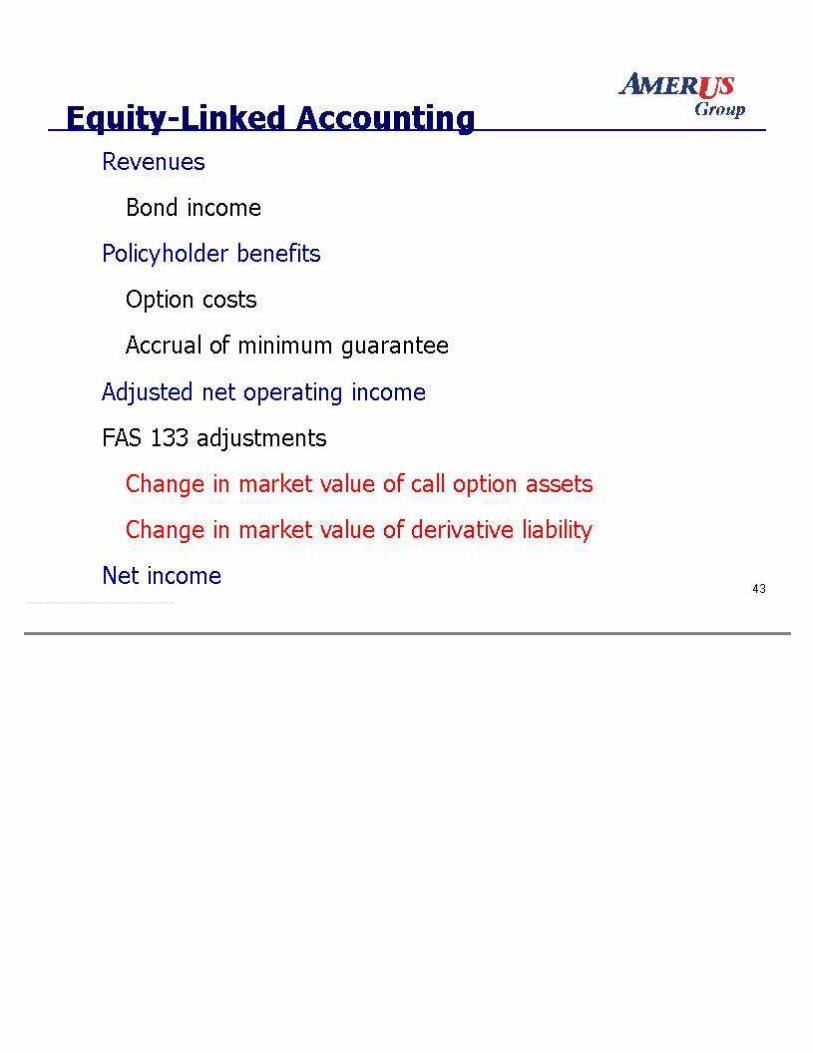
Equity-Linked Accounting Revenues Bond income Pol icyholder benefits Option costs Accrual of minimum guarantee Adjusted net operating income FAS 133 ad justments Change in market value of cal l op tion assets Change in market value of derivat ive liab ility Net income
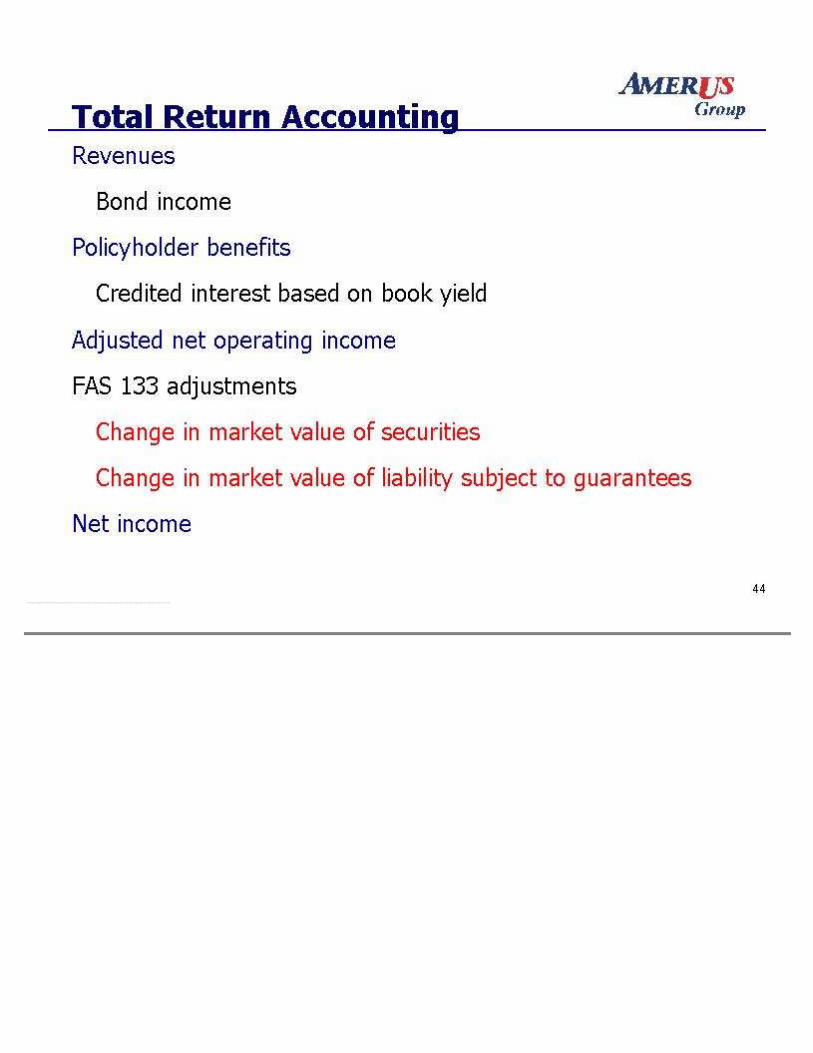
Total Return Accounting Revenues Bond income Policyholder benefi ts Cred ited interest based on book yield Adjusted net operating income FAS 133 adjustments Change in market value of securities Change in market value of liab ility sub ject to guarantees Net income

Adjusted Net Operat ing Income vs. Net Income: Key Differences Change in market value of opt ion assets vs. change in FAS 133 liabi lity on equity-linked s trateg ies Effect o f the cumulat ive guaran tee on total retu rn strategies when the value of the assets is below the guarantee

FAS 133 Impact $ Mi llions 2003 2003 2002 2002 Q 2 Q1 Q4 Q3 Option gains (losses) 24 .0 (10.7) 6.7 (14.7) Total retu rn gains (losses) 17.3 2.3 11 .6 2.6 T otal investment gains (losses) 41.3 (8.4) 18.3 (12 .1) Equity index reserve adjustment Total return reserve adjustment Deferred Acquisi tion Costs Taxes After-tax impact Impact as percent of reserves (29.9) (5.9) (0.7) (1.7) $3 .1 .14% 10.6 (2.0) 0.1 (0.1) $0.2 .01% (7.7) (4.6) (1.0) (1.8 ) $3.2 .17% 6.5 (1.2) 2.0 1.7 ($3.1) (.17%)
Hedg ing and A ccount ing Q & A

Equity Index Product Rat ionale Equity index (EI) p roducts meet consumers' needs and financial objectives EI products offer greater p rofi t poten tial EI products offer a sustainable advantage EI products leverage AmerUs Group's management skills
End of Filing
© 2005 | EDGAR Online, Inc.
AmerUs Group's Equity Index Annuit ies and Equ ity Index L ife Insurance September 30, 2003