american samoa seismic hazard maps mark d. petersen, stephen c. harmsen, kenneth s. rukstales,...
TRANSCRIPT

American Samoa Seismic Hazard Maps
Mark D. Petersen, Stephen C. Harmsen, Kenneth S. Rukstales, Charles S. Mueller, Daniel E. McNamara, Nicolas Luco, and Melanie Walling

American Samoa
• Formed by migration of tectonic plate over hot spot 2 to 28 Ma
• Pacific Plate motion GPS vector • Tonga trench is one of most active subduction
zones ( 15-24 cm/yr), 22 M 7 earthquakes in last 110 yrs
• September, 2009 M 8.1 event on outer rise and interface

American Samoa tectonics

Depth sections

Moment tensors

South Pacific Zones for calculating b-value and Mmax

Seismicity analysis

Magnitude-frequency
4 5 6 7 8 91
10
100
1000
Comparison of rates of Samoa/Vanuatu catalogs (1900-2010)
rate all -declusteredrate all not declusteredrate 1964+ declusteredRate 1964+ not declustered
Magnitude
Annu
al ra
te o
f ear
thqu
akes
•For this analysis we use 1964+ catalog•The rate of M 5’s seems to be higher•The rate of M 7+ is similar•Completeness near M 5

Magnitude-frequency
5.25 5.75 6.25 6.75 7.25 7.75 8.251
10
100
1000
b-Values BackgroundBackground (elsewhere)0-50 (b=1.01)
Background50-100 (b=0.93)
Background100-200 (b=0.89)
Background200-300 (b=0.95)
Background300-400 (b=0.97)
Background400-500 (b=1.16)
Background500-600 (b=0.87)
Background600-723 (b=0.87)
Magnitude
N

Magnitude-frequency plot by source
5.25 5.75 6.25 6.75 7.25 7.75 8.251
10
100
1000
b-Values0-50 km
Tonga Outer Rise 0-50 (b=0.99)
New Hebrides Outer Rise 0-50 (b=1.11)
Tonga subduction 0-50 (b=0.87)
New Hebrides subduc-tion 0-50 (b=0.58)
Fiji zone0-50 (b=0.86)
Background (elsewhere)0-50 (b=1.01)
Magnitude
N

Magnitude-frequency plot Vanuatu
6.5 7.0 7.5 8.0 8.5 9.01.0
10.0
100.0
New Hebrides (Vanuatu) M>7 since 1900, M7+, 32 events
Observed - New Hebrides
predicted - New Hebrides, b=0.58
predicted - New Hebrides, b=0.87
predicted - New Hebrides, b=1
Magnitude
log
cum
ulati
ve n
umbe
r of e
arth
quak
es
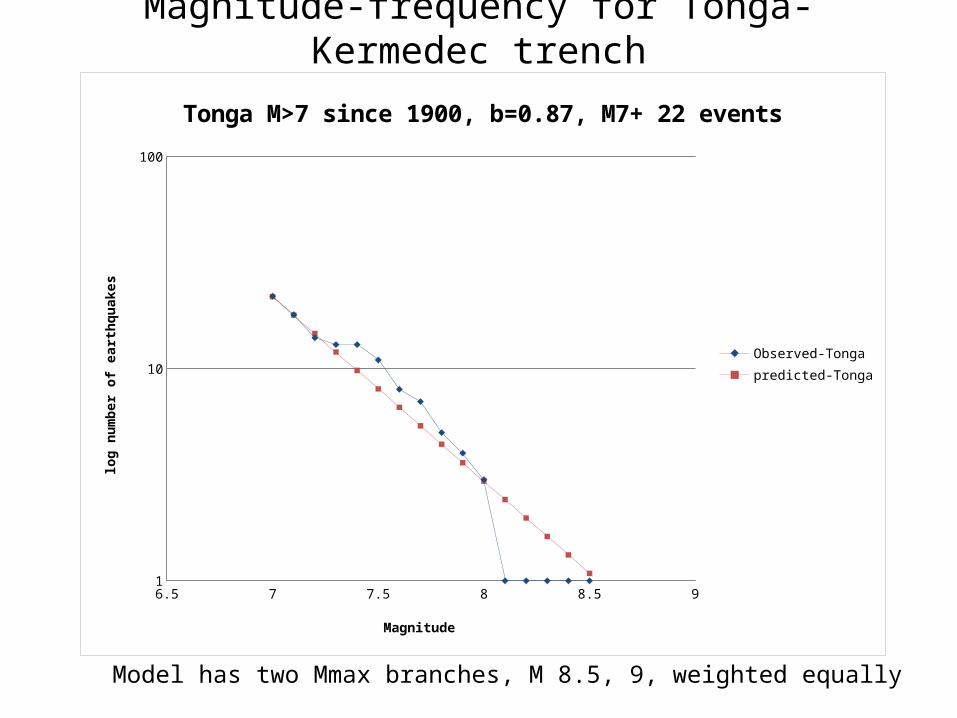
Magnitude-frequency for Tonga-Kermedec trench
6.5 7 7.5 8 8.5 91
10
100
Tonga M>7 since 1900, b=0.87, M7+ 22 events
Observed-Tongapredicted-Tonga
Magnitude
log
num
ber o
f ear
thqu
akes
Model has two Mmax branches, M 8.5, 9, weighted equally

Ground motion analysis

Interface and Intraplate
Earthquakes
Interface and Intraplate, d=25 km

Interface and Intraplate Earthquakes

Intraplate and Interface Earthquakes
M 9 curves


Intraplate earthquakes by
depth (1 s and 0.2 s SA)

Ground motions for Shallow crustal
earthquakes(1 s and 0.2 s SA)
•For M 8 crustal earthquakes Zhao is highest (less gm saturation with M)•For M 6 crustal earthquakes Zhao is lowest •In 2011 paper Zhao et al. suggests more magnitude saturation for M 7+ earthquakes.

Zhao et al. (2006) crustal, inslab, and
interface earthquake ground motions
•Inslab earthquakes cause high gm•Guam ground motions are dominated by
Intraslab ground motions•American Samoa ground motions are
dominated by crustal sources

Oceanic data by distance and depth
Red – interface, blue – intraplate

Zhao et al. (2006) model with Pacific strong ground motion data ( 1 s and PGA)

PGA station residuals
after subtracting station term and systematic offsetStation residuals
Residuals = data-prediction

PGA average single station residuals by magnitude and distance
Residuals = data-prediction

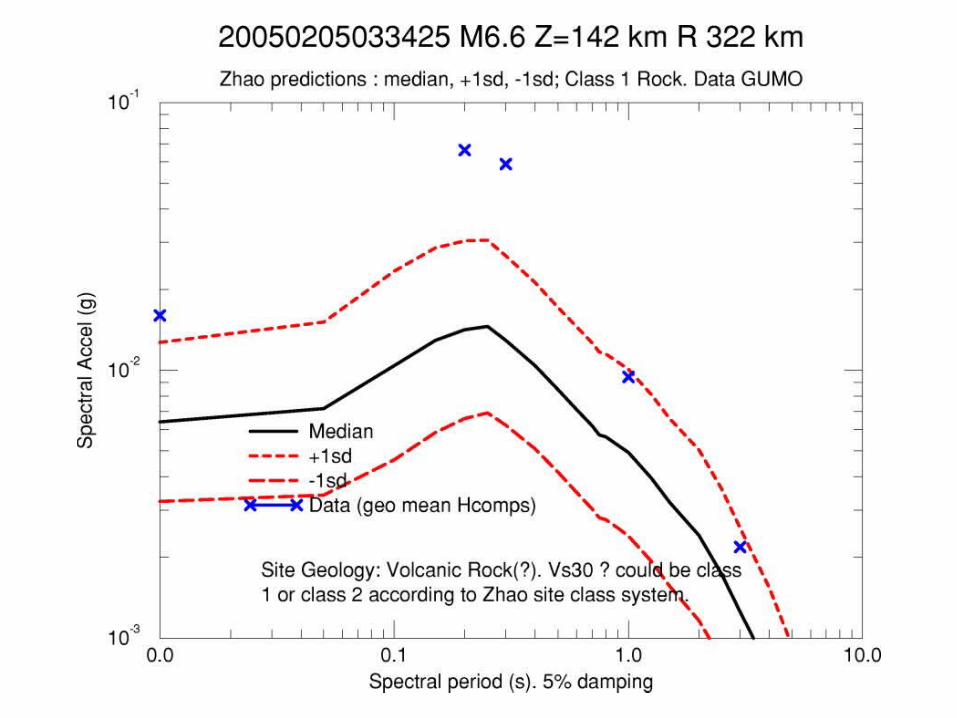
Comparison of Guam data and Zhao

Comparison of Guam data and Zhao

Comparison of Guam data and Zhao

Comparison of Guam data and Zhao


PGA 5HZ 1HZ
ZHAO -0.0542 0.0777 0.2018
Systematic offset of Pacific data with Zhao et al. (2006) model
Total Sigma, distance ≤ 300 km, M ≥ 6.0
Zhao and others (2006) GeomatrixAtkinson and Boore
(2003)
PGA 0.9297 0.9685 1.1587
5HZ .9709 1.0342 1.0194
1HZ .7024 .7434 .7554

Source Model (depth)Calculate
d
b-value
b-value
standar
d
deviatio
n
Maximum
recorded
magnitude
since 1900
Maximum
recorded
magnitud
e
since
1964
Maximum
magnitude
for
calculations
Rate of
M≥7
since
1900
Type of
source
S=smoot
h
F=fault
Model
source
depth
(km)
Ground
motion
models
Tonga Outer Rise (0–50 km)
0.99 0.07 8.2 8.1 (8.0*)
8.2 S 10 Crustal Zhao and NGA
New Hebrides Outer Rise (0–50 km)
1.11 0.10 7.7 7.7 8.2 S 10 Crustal Zhao and NGA
Tonga Subduction Zone interface (0–50 km)
0.87 0.03 8.5 7.9 (8.0*)
7.0 (see interface zone below)
S 10 Crustal Zhao and NGA
New Hebrides Subduction Zone Interface (0–50 km)
0.58 0.04 7.9 7.8 7.0 (see interface zone below)
S 10 Crustal Zhao and NGA
Fiji zone (0–50 km) 0.86 0.03 7.8 7.7 8.0 S 10 Crustal Zhao and NGA
Background (elsewhere; 0–50 km)
1.01 0.07 7.1 7.1 7.3 S 10 Crustal Zhao and NGA
Background (50–100 km) 0.93 0.05 8.2 8.1 8.2 S 75 Intraslab
Background (100–200 km)
0.89 0.04 7.8 7.8 8.0 S 150 Intraslab
Background (200–300 km)
0.95 0.05 7.9 7.1 8.0 S 250 Intraslab
Background (300–400 km)
0.97 0.07 8.0 7.2 8.0 S 350 Intraslab
Background (400–500 km)
1.16 0.09 7.5 7.3 8.0 S 450 Intraslab
Background (500–600 km)
0.87 0.05 7.8 7.6 8.0 S 550 Intraslab
Background (600–723 km)
0.87 0.07 7.7 7.7 8.0 S 650 Intraslab
Tonga Subduction Zone Interface (0–50 km)M7–M9, 1900–2010
0.87 (fixed)**
8.5 7.9 (8.0(fixed)* )
8.5, 9.0 22 events / 110 years
F H=25, top of zone is 10 km
Inter-face
New Hebrides Subduction Zone Interface (0–50 km)M7–M9, 1900–2010
1.0 (fixed)**
7.9 7.8 8.5, 9.0 32 events / 110 years
F H=25, top of zone is 10 km
Inter-face

Model and Results

Logic tree
In zones that include subduction zones, we use 30 percent strike-slip and 70 percent reverse in the ground-motion models. In all other zones, we use half strike-slip and half normal faulting mechanisms in the ground-motion models,

Hazard from subduction zones and seismicity ( 1 s SA)

Sensitivity


Maps and deaggregations

Seismic hazard map (10% PE of
exceedance in 50 years for 1 s SA)

Seismic hazard map (2% PE of
exceedance in 50 years for 1 s SA)

Seismic hazard map (10% PE of
exceedance in 50 years for 0.2 s SA)

Seismic hazard map (2% PE of exceedance
in 50 years for 0.2 s SA)

Deterministic analysis

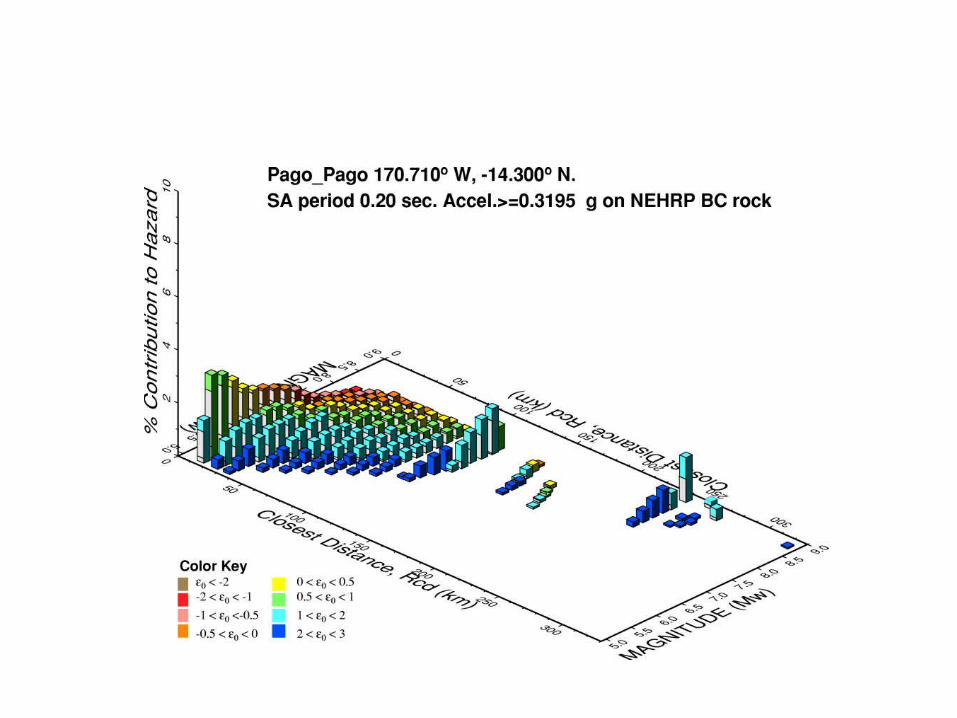
Deaggregation for Pago Pago
Contribution to hazard is shown by the height from one color to the next color.


Geographic deaggregation ( 1 s top, 0.2 s bottom)

Conclusions• Model seismicity rates defined by historic seismicity• We don’t know of any crustal faults on or near American Samoa• For Pago Pago outer rise earthquakes and subduction interface
earthquakes dominate hazard• For Pago Pago crustal GMPE’s are the most important• For Pago Pago we apply equally weighted Zhao et al. (2006, class
1-rock of about 600 m/s) and 3 NGA equations (NEHRP B/C, Vs30=760)
• Even though the ground motions are half the current IBC, we feel that the model for Pago Pago includes plausible sources and ground motion models and represents a reasonable estimate of the hazard