american community survey presented at the meeting of the national neighborhood indicators...
TRANSCRIPT

American Community Survey
Presented at the Meeting of the National Neighborhood Indicators Partnership
Susan SchechterMay 2010
1

2
What I’ll Cover
Introduction to the American Community Survey
Census 2000 and ACS – Similarities and Differences
Plans for the first release of ACS 5-year estimates

3
Introduction to the ACS
The 2010 Census will only collect critical data required of the full population
The detailed demographic, social, economic, and housing data will now be collected and disseminated using the American Community Survey

4
Introduction to the ACS
While ACS content is similar to the Census 2000 long form, the design and methodology differ
ACS data are collected continuously throughout the year and estimates are released once-a-year in the form of 1-year, 3-year, and 5-year aggregates
5
Introduction to the ACS
The ACS has a diverse set of data users including federal, state, and local governments, academia, media, and the private sector
Uses range from a single estimate for a grant application or homework assignment to complex research using microdata files

6
Census 2000 and ACSSimilarities
Census 2000 questions are on the ACS
ACS produces many of the same tables and characteristics as Census 2000
Same broad set of geographic areas
Same basic data dissemination vehicle – American FactFinder and same basic types of data products

7
ACS Data Products Used in Census 2000
Detailed Tables Summary Files Data Profiles and Subject Tables (Similar to
Quick Tables)Thematic MapsGeographic Comparison TablesPublic Use Microdata Sample (PUMS) Files

8
ACS Data Products Not Included in Census 2000
Narrative ProfilesRanking TablesComparison Profiles Selected Population Profiles

9
Census 2000 and ACSKey Differences
ACS data are collected continuously and all ACS estimates are period estimates
Estimates will be released every year rather than once-a-decade
ACS estimates are released in the form of both single year and multiyear estimates
ACS estimates have more sampling error

Period Estimates
Describe the average characteristics over a specific period of time
Contrast with point-in-time estimates – ACS estimates do not describe the characteristics
as of a specific date
Period is 1 year, 3 years, or 5 years for ACS
10

11
ACS estimates will be released every year while
census estimates were released only once-a-decade

12
ACS estimates are released in the form of both single year and multiyear estimates based on the
estimated population of the geographic area

ACS Data Release Schedule
13
Data Product Population Size Data released in:
of Area 2006 2007 2008 2009 2010 2011 2012
1-Year Estimates 65,000+ 2005 2006 2007 2008 2009 2010 2011
for Data Collected in:
3-Year Estimates 20,000+ 2005-2007 2006-2008 2007-2009 2008-2010 2009-2011
for Data Collected in:
5-Year Estimates All Areas* 2005-2009 2006-2010 2007-2011
for Data Collected in:
* Five-year estimates will be available for areas as small as census tracts and block groups.Source: US Census Bureau* Five-year estimates will be available for areas as small as census tracts and block groups.Source: US Census Bureau
Hypothetical situation: If Census 2010 contained a long form, detailed characteristic data would not be available until 2012

14
Data Release Rules
Estimated Population of Geographic Area
Type of ACS Estimates Released
65,000 or more 1-year, 3-year, and 5-year
20,000 to 64,999 3-year, and 5-year
Less than 20,000 5-year

151
Example 1: Percent Foreign Born Population Areas with 65,000+ population
2005 2006 2007 2008 2009 2010
Single-year estimates 20.0 21.2 23.3 28.6 32.6 35.1
3-year estimates (2005 – 2007) 21.5
3-year estimates (2006 – 2008) 24.8
3-year estimates (2007 – 2009) 28.6
5-year estimates (2005 – 2009) 25.9
3-year estimates (2008 – 2010) 32.2
5-year estimates (2006 – 2010) 28.9

163
Example 1: Percent Foreign Born Population Areas with population between 20,000 and 65,000
2005 2006 2007 2008 2009 2010
3-year estimates (2005 – 2007) 21.5
3-year estimates (2006 – 2008) 24.8
3-year estimates (2007 – 2009) 28.6
5-year estimates (2005 – 2009) 25.9
3-year estimates (2008 – 2010) 32.2
5-year estimates (2006 – 2010) 28.9

175
Example 1: Percent Foreign Born Population Areas with less than 20,000 population
2005 2006 2007 2008 2009 2010
5-year estimates (2005 – 2009) 25.9
5-year estimates (2006 – 2010) 28.9

18
The ACS sample is smaller than the sample in Census
2000 which means that ACS estimates will include more
sampling error

19
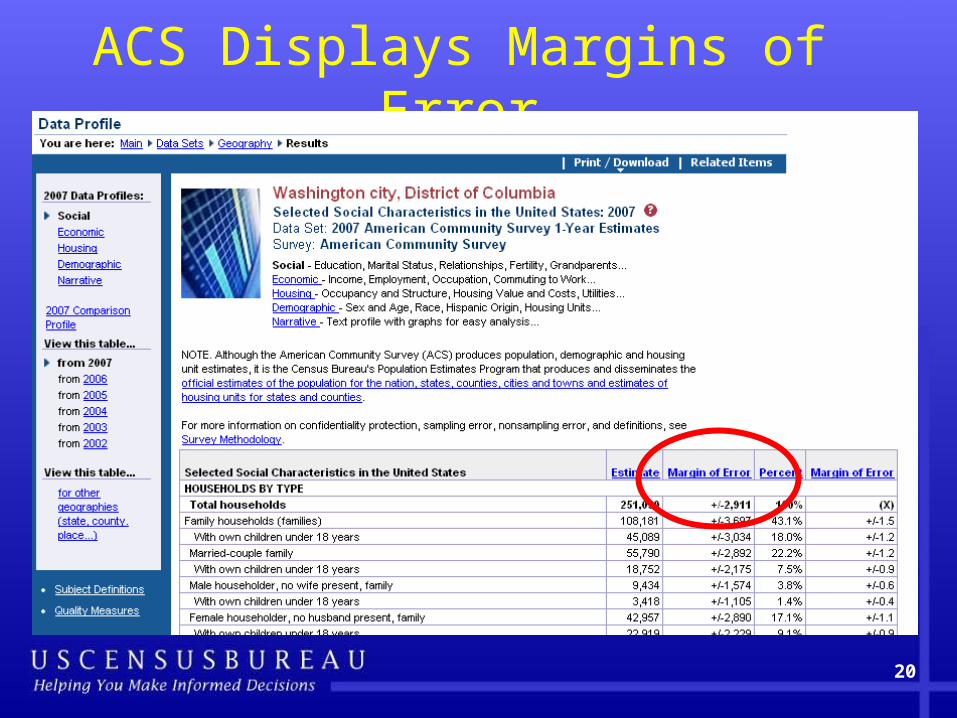
Quality of ACS Estimates
Recent research suggests that margins of error around ACS 5-year estimates will be about 1.75 times as large as those associated with the Census 2000 sample estimates
Evaluations after Census 2000 demonstrated reductions in ACS nonsampling error relative to Census 2000
20
ACS Displays Margins of Error

21
Census 2000 and ACSOther Differences
ACS includes a few revisions to question wording as compared with Census 2000
ACS has added several new questions that were not included in Census 2000
ACS reference periods and residence rules differ from those used in Census 2000

22
Questions Added to the ACS
Health Insurance Coverage
Marital History
Service-Connected Disability Status and Rating
Field of Degree
23
Residence Rules
Both the census and the ACS describe the resident population (housing units and group quarters) in the United States and Puerto Rico
Census 2000 - usual residence as of April 1, 2000
ACS – current residence as of interview date

24
Reference PeriodsCensus 2000 centers its count and age distributions on
a reference date of April 1, 2000. Some questions have a reference period different than April 1. Data generally describe characteristics between March and June of 2000.
The ACS collects all data using a reference date of the date of interview. Like Census 2000, some questions have reference periods. Given that interviews are spread fairly evenly across the year, the data describe the calendar year but there is an overlap for questions that include a 12 month reference period.

25
Differences between the 2010 Census and the ACS
The 2010 Census will count the population to support apportionment and redistricting
The ACS will supplement this information with annually updated data on the characteristics of population and housing
Plus, many of the same differences (residence rules, reference periods) when you compare Census 2000 long form data to ACS

2009 ACS
First release of ACS 5-year estimates– Data will be available for small areas
• Census tracts • Block Groups
– Will be based on data collected from 2005, 2006, 2007, 2008 and 2009
The 2009 ACS (1-year estimates) and the 2007-2009 ACS (3-year estimates) will also be released
26

Census 2000Data Products from the Long Form Sample
Product Released
Summary File 3 (SF3) 2002 - 2003
Summary File 4 (SF4) 2003
American Indian and Alaska Native Summary File (AIAN SF)
2003
Public use microdata sample (PUMS) files
2003
27

ACS Data Products1-Year and 3-Year Estimates
ACS data products have included detailed tables, other summary products and PUMS files
The geographic detail of SF3 as well as data comparable to the SF4 and the AIAN SF were not possible with 1-year and 3-year estimates
28

ACS 5-Year Estimates
We plan to release the first ACS 5-year estimates this year
The 5-year data products will be similar in many ways to the existing ACS products and to Census 2000 products
Over time, we expect the specific set of data products to change as we receive input from users and evaluate usage
29

ACS 5-Year EstimatesRelease Restrictions
Unlike the 1- and 3-year estimates, there will be no 5-year population thresholds and no table restrictions based on reliability
Only restrictions will be to protect the confidentiality of the data
Margins of error will be published with all ACS estimates
30

ACS 5-Year EstimatesSet of Proposed Tables
We will produce the ACS tables that are most comparable to those released in Census 2000 Summary File 3
We will also produce some tables that were not included in Census 2000 – new tables that were designed after Census 2000
31
ACS 5-Year EstimatesSet of Proposed Tables
Most proposed summary levels will receive a full set of 5-year tables regardless of size or type – exception is block groups
Some tables have geographic restrictions similar to those in place for Census 2000 SF3
32

2005-2009 ACS Data Products Planned
Detailed tablesSummary filesData profilesNarrative profilesSubject tables
**No Selected Population Profiles for ACS 5-Year Data
**No SF4, or AIAN SF Files for the first release.
Geographic comparison tablesThematic mapsPUMS files
33
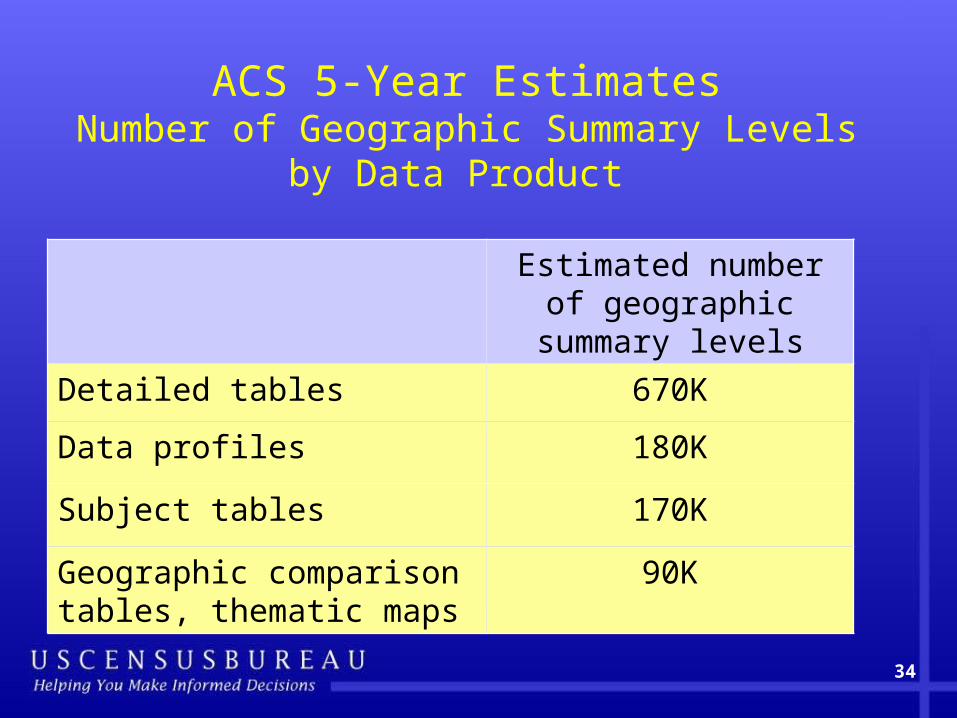
ACS 5-Year EstimatesNumber of Geographic Summary Levels by
Data Product
Estimated number of geographic summary
levels
Detailed tables 670K
Data profiles 180K
Subject tables 170K
Geographic comparison tables, thematic maps
90K
34
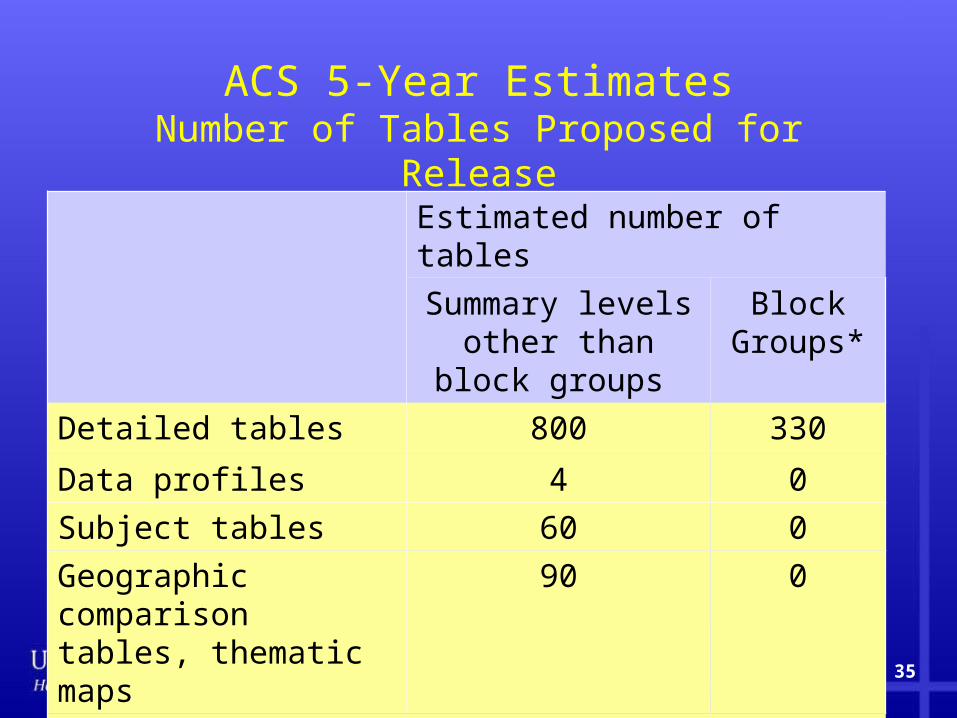
ACS 5-Year EstimatesNumber of Tables Proposed for Release
Estimated number of tables
Summary levels other than block
groups
Block Groups*
Detailed tables 800 330
Data profiles 4 0
Subject tables 60 0
Geographic comparison tables, thematic maps
90 0
* The total number of block groups is estimated to be about 210,000
35

ACS 5-Year EstimatesGeographic Summary Levels
Most, but not all, of the geographic summary levels in Census 2000 SF3 will be included in the first ACS 5-year release
This includes tracts, block groups, geographic components, and geographic intersections
36

ACS 5-Year EstimatesData Product Limitations by Geographic
Summary Level
For proposed geographic summary levels, we will always produce detailed tables
We will only produce data and narrative profiles, subject tables and geographic comparison tables for a subset
37

ACS 5-Year EstimatesExamples of 5-year Geographic Summary
Levels for US and Puerto Rico
Residence-based
tabulations
Estimated number of areas
1-year 3-year 5-year
Congressional districts
435 435 435
Counties 785 1,030 3,221
Tracts 0 0 ~66,000
Block groups 0 0 ~ 210,000
All summary levels ~ 6,500 ~ 13,500 ~ 670,000
38

ACS 5-year EstimatesData Dissemination Plan
We plan to release 5-year estimates annually and disseminate all 5-year ACS data products through the American FactFinder
We plan to release census block group data only in a summary file format, accessible from the American FactFinder download center
39

ACS 5-Year EstimatesTentative Data Release Schedule
Type of estimate Release date
2009 ACS
1-year estimates
Sept 2010
2007-2009 ACS
3-year estimates
Dec 2010 or later, after the release of the 5-year estimates
2005-2009 ACS
5-year estimates
Nov or Dec 2010, some data products released in 2011
40

ACS 5-Year EstimatesFuture Products
We are evaluating the disclosure avoidance issues related to producing annual 5-year PUMS files.
We plan to release the ACS SF4 and the ACS AIAN SF in 2012 based on the 2006-2010 ACS 5-year estimates
41

ACS 5-Year EstimatesFuture Products
We expect to refine this plan for future releases and value your feedback on shortcomings or overkill
We will continue to look for the most effective way to release 3 sets of ACS estimates annually along with the production of SF3, SF4, and AIAN SF-like products and PUMS files
42

43
For more information
Subscribe to “ACS Alert”
http://www.census.gov/acs/www/Special/Alerts.htm
Visit the ACS/PRCS website:
http://www.census.gov/acs/www
Contact by telephone:
301-763-1405
Contact by email: