amec foster wheeler client presentation - jan 10 2017
TRANSCRIPT

Establishing Appropriate LID BMP Runoff Capture Targets to Effectively Address Subwatershed Objectives- How Much is Enough?
TRIECA Presentation, March 22-23, 2017
Daron Abbey (Matrix Solutions Inc.),
Ron Scheckenberger (Amec Foster Wheeler),
Bill Blackport (Blackport and Associates),
Christian Gabriel (Matrix Solutions Inc.),
Cam Portt (C. Portt and Associates), and
Soran Sito (City of Markham)

1. Core Thesis – How Much is Enough?
2. LID BMP Capture 101 – The Basics!
3. Problem Overview – The Case Study
4. Detailed Analysis / Assessment – The Numerics
5. Recommendations – What’s Next?
3
Presentation Outline

4
1. Core Thesis How Much is Enough?
Greenfield
(Milton)
Intensification
(Burlington)
Generally two (2) types of development:
i. Greenfield / Large Scale Infill
ii. Intensification / Redevelopment
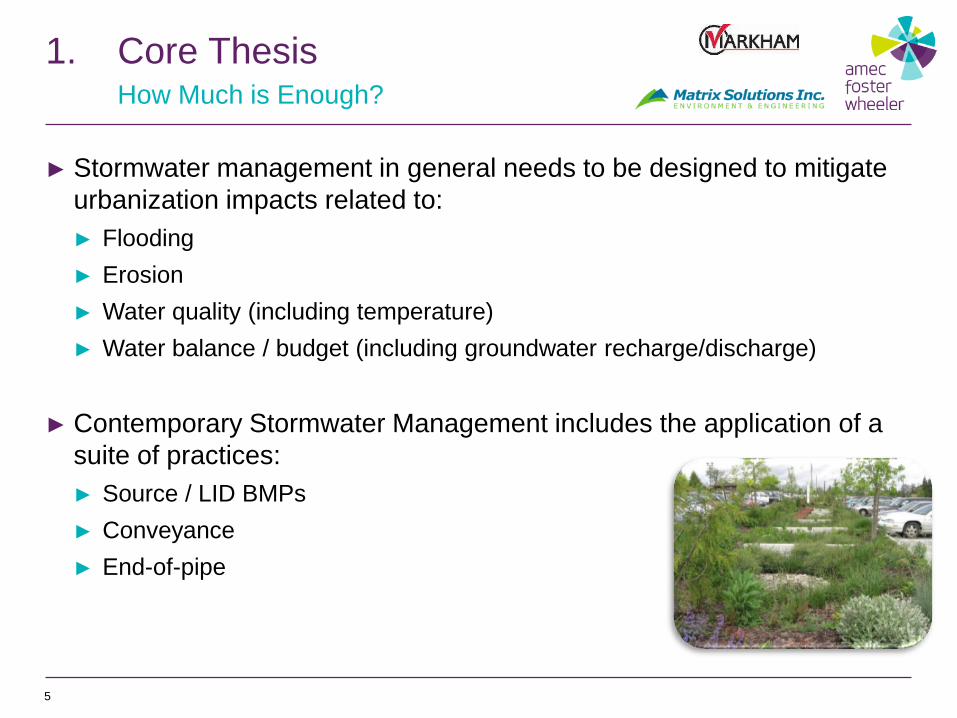
► Stormwater management in general needs to be designed to mitigate
urbanization impacts related to:
► Flooding
► Erosion
► Water quality (including temperature)
► Water balance / budget (including groundwater recharge/discharge)
► Contemporary Stormwater Management includes the application of a
suite of practices:
► Source / LID BMPs
► Conveyance
► End-of-pipe
5
1. Core Thesis How Much is Enough?

► Various Stormwater Management practices are aligned with various
functional objectives:
Flooding (Post- to Pre-Peak Flows)
► Short-term storage areas (ponds, public spaces)
► Conveyance upgrades (pipes, culverts, channels)
Erosion (Cumulative Shear Stress Balance)
► Extended storage areas (ponds, public spaces)
► Volume management (LID BMPs)
► Stabilize receiving system (Natural
(Natural Channel Design)
6
1. Core Thesis How Much is Enough?
Culvert upgrade – City of Brantford
Traditional Stormwater Management Pond

Water Quality (80% TSS removal, T° mitigation)
► Extended storage areas (ponds, public spaces)
► Volume management (LID BMPs)
► Other best practices (salt management, etc.)
Water Balance (Post- to Pre-Volumes)
► Volume management (LID BMPs)
► Maintenance of functional recharge/
groundwater level/groundwater discharge
connections
7
1. Core Thesis How Much is Enough?
Source: sustainabletechnologies.ca
Source: UrbanToronto.ca

► Fully integrated Stormwater Management Planning and Design needs
to consider all potential impacts of urbanization
► Physical (Stream Morphology)
► Bankfull flow and duration
► Sediment transport
► Social (Risk Management)
► Major flooding
► Ecological (Fish / Aquatic Habitat)
► Baseflow
► Channel form and stability
► Temperature/Quality
8
1. Core Thesis How Much is Enough?

LID BMPs principally focus on:
► Frequent storm volume control providing benefits to:
► Erosion
► Water quality
► Aquatic habitat
► Groundwater recharge/discharge
► Temperature
9
1. Core Thesis How Much is Enough?
Source: urbantoronto.ca

Emerging guidance (MOECC) focusses on generic volume control
targets:
► 90th percentile event
► 20-30 mm capture / management
Emphasis is on Lot-level practices:
► Infiltration, water re-use, evapotranspiration, filtration
10
1. Core Thesis How Much is Enough?
Source: peacefulparks.org – London Ontario Source: oaec.org

► Application of generic volume capture does not consider subwatershed
scale system characteristics:
► Spatial variability of soil and subsoil properties (infiltration)
► Temporal dynamics of water movement (discharge)
► If not properly planned generic volume control could lead to issues
related to:
► Groundwater mounding / related infrastructure impacts
► Reductions / increases in baseflow
► Imbalance to sediment transport / stream energy
► Impacts to Natural Heritage Systems: wetland - hydroperiods
► Headwater drainage features soil moisture
11
1. Core Thesis How Much is Enough?

12
1. Core Thesis How Much is Enough?
► Integrated surface water – groundwater modelling used to:
► Characterize function of current system
► Spatial variability (infiltration/runoff)
► Temporal dynamics (discharge)
► Spatial and temporal linkages, discharge areas, NHS
► Establish Area-specific volume capture (retention targets) for proposed
future land use
► Optimize<over / under control>
Source: California Water Plan 2013: Bulletin 160-13

► Total Capture = retention + detention
► Retention = infiltration controls recharge and ET, re-use
► Infiltration: residential/bioswales/rain gardens, employment/infiltration
systems
► ET: conversion of forest/agriculture to urban, lower potential
► Reduction in overall run-off
► Detention = filtration & storage controls swales, and historically end-
of-pipe systems
► Still counted as run-off
► Our Capture focus is on amount “retained”
13
2. LID BMP Capture 101 The Basics!

14
2. LID BMP Capture 101 The Basics!
Existing - Greenfield Total Area = 0.1 ha Pervious = 100% Impervious = 0 %
Future - Urbanization Total Area = 0.1 ha Pervious = 25% Impervious = 75%
Precipitation = Runoff + Infiltration + ET
Precipitation = 900 mm/a = 900 m3
Runoff = 125 mm/a = 125 m3
Infiltration = 200 mm/a = 200 m3
ET = 575 mm/a = 575 m3
Pervious Area reduced by 75% Infiltration reduction = 150 m3
ET reduction = 432 m3
Assume ET in pervious area same potential as pre-development
LID BMPs needed to compensate for loss of both infiltration and ET = 582 m3

North Markham Future Urban Area (FUA)
15
3. Problem Overview The Case Study

North Markham Future Urban Area (FUA)
► 38,000 residents
► 19,000 jobs
Provincial stronghold for Redside Dace
► High quality habitat
► Significant groundwater recharge / discharge
16
3. Problem Overview The Case Study
Redside Dace

Provincial Planning Objectives
► 2013 – Places to Grow: The Growth Plan for the Greater Golden
Horseshoe (Section: 2.2.7.2)
► 50 people / jobs / ha
► 2016 – Proposed Growth Plan for the Greater Golden Horseshoe
(Section 2.2.7.2 and Section 2.2.4.5)
► General 80 people / jobs / ha
► Mobility Hubs 120 people / jobs / ha
17
3. Problem Overview The Case Study

18
3. Problem Overview The Case Study
The disconnect…
► More people more lot coverage per hectare
► Increasing requirement to infiltrate and manage runoff on-site

4. Detailed Analysis Assessment Numerical Representation – Subwatershed
19
MIKESHE Integrated Surface – Groundwater Model
Represent current
conditions
Spatial and temporal
characteristics
Calibrated to streamflow,
groundwater levels,
ponded water

4. Detailed Analysis Assessment Numerical Representation – Subwatershed
Regional
Local/Subcatchment

4. Detailed Analysis Assessment Numerical Representation– Subwatershed
Average Recharge 226 mm/year Monthly Groundwater Discharge to Stream
Typical 29 mm event water balance
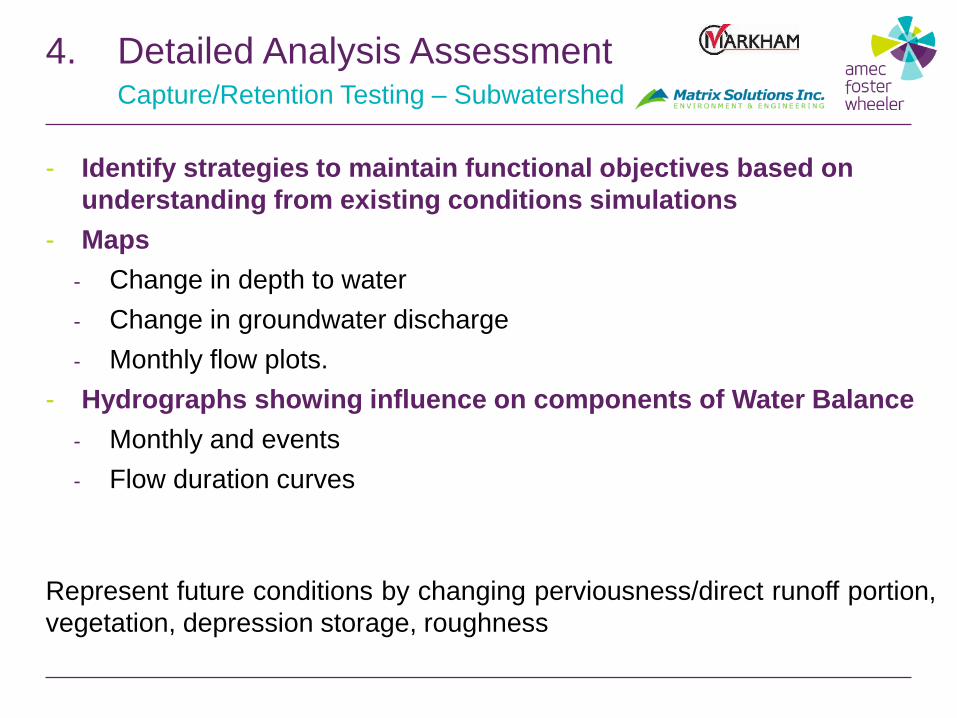
4. Detailed Analysis Assessment Capture/Retention Testing – Subwatershed
- Identify strategies to maintain functional objectives based on
understanding from existing conditions simulations
- Maps
- Change in depth to water
- Change in groundwater discharge
- Monthly flow plots.
- Hydrographs showing influence on components of Water Balance
- Monthly and events
- Flow duration curves
Represent future conditions by changing perviousness/direct runoff portion,
vegetation, depression storage, roughness

4. Detailed Analysis Assessment Capture/Retention Testing – Subwatershed
Brown area reduction in recharge 50 + mm/yr
Blue areas increase in recharge 50+ mm/yr
Highlights dynamics of systems
Change in Recharge – Future No LID BMPs
Increased recharge
no change
decreased recharge

4. Detailed Analysis Assessment Capture/Retention Testing – Subwatershed
Future No LIDs
Without LID BMPs reductions in groundwater
levels in majority of the study area but
increase in groundwater levels in other areas
demonstrating the dynamics of the
groundwater system
Change in Depth to Water Table– Future No LID BMPs
Shallower Water Table
no change
Deeper Water Table

4. Detailed Analysis Assessment Capture/Retention Testing – Subwatershed
Without LIDs reductions in groundwater
discharge throughout study area
Increased discharge
no change
decreased discharge
Change in Groundwater Discharge – Future No LID BMPs

4. Detailed Analysis Assessment Capture/Retention Testing – Subwatershed
Adding 10 mm of capture per impervious
hectare minimizes reduction in recharge in
places and increases recharge in others
compared to existing conditions; total capture
varies by land use
Change in Recharge
– Future 10 mm Additional Capture/ impervious hectare
Increased recharge
no change
decreased recharge

4. Detailed Analysis Assessment Capture/Retention Testing – Subwatershed
Changing depth to water table and
groundwater flow direction dynamics are
simulated and demonstrating the non-linear
response to changes capture
Change in Depth to Water Table
– Future 10 mm Additional Capture/ impervious hectare
Shallower Water Table
no change
Deeper Water Table

4. Detailed Analysis Assessment Capture/Retention Testing – Subwatershed
28
Infiltration
Groundwater
Discharge
Influence of different levels of capture on
future infiltration and groundwater
discharge -compared to existing
conditions
4. Detailed Analysis Assessment Capture/Retention Testing – Subwatershed
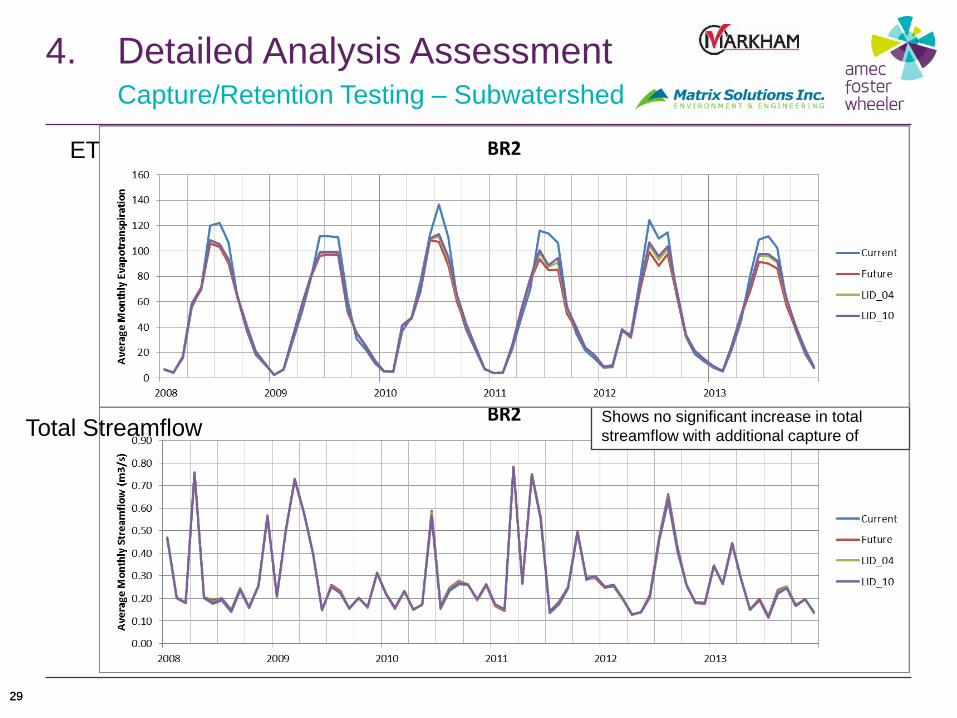
29 29
ET
Total Streamflow Shows no significant increase in total
streamflow with additional capture of

4. Detailed Analysis Assessment Capture/Retention Testing – Subwatershed
30 30
29 mm Event Water Balance Comparison of
Management Strategies
BMPs
Capture = Retention + Detention
Current Conditions= 25 mm
LID BMPs 10 mm = 27 mm including EOP
= 23.5 mm ET & Infiltration components

1. Application of generic capture targets (i.e. 90 percentile) can lead to potential negative impacts
► Recommend integrated surface / groundwater assessment for greenfield communities.
2. Increasing lot / land coverage is reducing available land for water / ground contact
► Recommend strategic application of LID BMPs in most functional areas of the landscape.
3. Public Realm versus Private Realm application of LID BMPs
► Recommend distinct strategies for each.
4. Study Scale considerations – Top down guidance
► More Modelling and field work required at site scale
31
5. Recommendations / Conclusions What’s Next?