am i my brother's keeper? sibling spillover effects: the ... · am i my brother's keeper?...
TRANSCRIPT
NBER WORKING PAPER SERIES
AM I MY BROTHER'S KEEPER? SIBLING SPILLOVER EFFECTS:THE CASE OF DEVELOPMENTAL DISABILITIES AND EXTERNALIZING BEHAVIOR
Jason FletcherNicole L. Hair
Barbara L. Wolfe
Working Paper 18279http://www.nber.org/papers/w18279
NATIONAL BUREAU OF ECONOMIC RESEARCH1050 Massachusetts Avenue
Cambridge, MA 02138August 2012
The authors thank the WT Grant Foundation for their support for this research. Fletcher also thanksthe Robert Wood Johnson Foundation Health and Society Scholars Program for financial support.The views expressed herein are those of the authors and do not necessarily reflect the views of theNational Bureau of Economic Research.
NBER working papers are circulated for discussion and comment purposes. They have not been peer-reviewed or been subject to the review by the NBER Board of Directors that accompanies officialNBER publications.
© 2012 by Jason Fletcher, Nicole L. Hair, and Barbara L. Wolfe. All rights reserved. Short sectionsof text, not to exceed two paragraphs, may be quoted without explicit permission provided that fullcredit, including © notice, is given to the source.
Am I my Brother's Keeper? Sibling Spillover Effects: The Case of Developmental Disabilitiesand Externalizing BehaviorJason Fletcher, Nicole L. Hair, and Barbara L. WolfeNBER Working Paper No. 18279August 2012JEL No. I12,J24
ABSTRACT
Using a sample of sibling pairs from the PSID-CDS, we examine the effects of sibling health statuson early educational outcomes. We find that sibling developmental disability and externalizing behaviorar associated with reductions in math and language achievement Estimated spillovers for developmentaldisability are large and robust to both a rich set of family-level controls and a fixed effects analysisthat exploits the availability of in-sample cousins. Our results suggest the importance of siblings inthe determination of children's human capital as well as the potential for typically uncounted benefitsto improving children's health through family multiplier effects
Jason FletcherYale School of Public HealthDepartment of Health Policy and Management60 College Street, #303New Haven, CT 06520and [email protected]
Nicole L. HairDepartment of EconomicsUniversity of Wisconsin-MadisonMadison, WI [email protected]
Barbara L. Wolfe1225 Observatory DrUniversity of WisconsinMadison, WI 53706and [email protected]
Am I my Brother’s Keeper? Sibling Spillover Effects:The Case of Developmental Disabilities and
Externalizing Behavior
Jason Fletcher, Nicole Hair, and Barbara Wolfe∗
July 27, 2012
Abstract
Using a sample of sibling pairs from the PSID-CDS, we examine the effects of siblinghealth status on early educational outcomes. We find that sibling developmental dis-ability and externalizing behavior are associated with reductions in math and languageachievement. Estimated spillovers for developmental disability are large and robust toboth a rich set of family-level controls and a fixed effects analysis that exploits theavailability of in-sample cousins. Our results suggest the importance of siblings inthe determination of children’s human capital as well as the potential for typicallyuncounted benefits to improving children’s health through family multiplier effects.
1 Introduction
While there has been extensive research across the social sciences examining the determi-
nants of child achievement, researchers still do not fully understand how the immediate
circumstances faced during childhood affect human capital accumulation. The influence of
children’s health status on their own educational outcomes (as well as parental decisions
and family resources) is well-documented. Much less is known about the direct and indirect
∗Fletcher: Yale University. Hair: University of Wisconsin-Madison. Wolfe: University of Wisconsin-Madison. The authors thank the WT Grant Foundation for their support of this research. Fletcher alsoacknowledges the Robert Wood Johnson Foundation Health & Society Scholars program for its financial sup-port. The authors would like to thank Marsha Seltzer for sharing her knowledge of developmental disabilitieswith them and Donna Nordquist at the PSID help desk. The authors thank participants at a seminar atthe Rand Corporation, the 2011 iHEA Conference, the PSID CDS-III and TA New Results Workshop Con-ference, the 2012 summer health economics workshop in Sydney, a seminar at RSE at Australian NationalUniversity, and the 2012 ASHE Conference for helpful comments on preliminary presentations of this work.
1
effects of children’s health status on the outcomes of their siblings. The relative scarcity of
large scale research in this area is surprising. The great majority (roughly 80%) of children
in the United States grow up with siblings (Dunn, 1992). Siblings share a common family
heritage, both genetically and experientially, and may take on a number of roles during devel-
opment: role models, playmates, teachers, friends, and confidants. They share the benefits
of their parents’ human capital and capital resources (i.e., housing, private transport, and
neighborhood), while competing for parental attention and investments (Becker and Lewis,
1973; Rosenzweig and Zhang, 2009).
A sibling’s health status may be expected to directly influence children’s development in
a number of ways. Sociologists have suggested that siblings may exert influence by acting
as role models (Haynie and McHugh, 2003). In addition, there is evidence in the psychology
literature to suggest that children’s personality and intelligence are shaped by direct inter-
actions with their siblings (Arnold, Levine and Patterson, 1975). To the extent that health
status influences these interactions, a child’s poor health could directly impinge on siblings’
outcomes. It is also possible that a child’s health problems may affect siblings indirectly.
Many childhood conditions have been shown to influence the availability of family finan-
cial resources (i.e., through direct medical expenditures or maternal labor supply decisions).
Parents may also consider variation in endowments when allocating resources across their
children (Becker and Lewis, 1973; Rosenzweig and Zhang, 2009).
This study examines the effects of a sibling’s poor health on a set of early educational
outcomes intended to capture a child’s human capital accumulation. Most related research
has been based on small convenience samples1 and there are few, if any, studies that use
large national datasets to examine sibling health spillovers on global educational outcomes.
Our analysis is based on a sample of sibling pairs from the Child Development Supplement
1For example, Smith et al. (2002) examine a sample of 30 males diagnosed with ADHD and their siblings;Mikami and Pfiffner (2008) examine a sample of 91 children recruited from a university ADHD researchclinic; Mash and Johnston (1983) examine a sample of 46 boys to study the effects of ADHD; Derouin andJessee (1996) examine information from 15 families; Williams et al. (2002) examine 252 siblings of childrenin poor health; and Greene et al. (2011) examine approximately 500, mostly white children recruited fromclinical settings.
2
of the Panel Study of Income Dynamics (PSID-CDS). The PSID includes extensive infor-
mation on families over the past 40 years (and across three generations). We investigate the
importance of sibling health spillovers using several different estimation strategies, including
OLS estimation with a rich set of family-level controls and a fixed effects analysis. Our fixed
effects analysis is unique in that it exploits the genealogical design of the PSID in order to
use cousins to control for otherwise unobserved family characteristics. Finally, guided by
evidence in the psychology literature, we explore heterogeneity in sibling health spillovers
according to the child’s gender and relative age.
We focus on two childhood chronic conditions: developmental disability and external-
izing behavior. These conditions are both common and recently found to be increasing in
prevalence. Using data from the National Health Interview Survey, Boyle et al. (2011) report
that nearly 10 percent of children have some form of developmental disability, and nearly 7
percent of children have reported ADHD (these diagnoses may overlap). In contrast, “only”
0.58 percent of children have a reported sensory disability, such as blindness or moderate to
profound hearing loss. In terms of trends, the study reports marked increases in autism from
1997-99 to 2008-09, along with increases in ADHD, seizures, and other developmental delays
over the same time period. These conditions have far-reaching effects on the affected indi-
vidual. Consequently, having an affected child in the household can be expected to present
challenges for the family unit that may lead to spillover effects on siblings (as well as other
family members).
We find that chronic conditions during childhood, namely developmental disability and
externalizing behavior, may have negative consequences not only for the child directly af-
fected by the condition but also for other children in the household. Specifically, we find
that having a sibling with a developmental disability or externalizing behavior is associated
with reductions in measured math and language achievement. There is also some evidence
to suggest an increased propensity for grade repetition. We find that estimates of sibling
health spillovers vary across our conditions of interest, with larger effects estimated in the
3
case of developmental disability. We also find evidence that a sibling’s poor health may have
heterogeneous effects according to particular characteristics of the sibship, with sisters and
younger siblings (particularly in the case of externalizing behavior) appearing to fare worse.
2 Background
2.1 Why Would Siblings Affect Human Capital Accumulation?
When addressing the potential importance of siblings in children’s human capital accumula-
tion, three theoretical perspectives from the economics literature are relevant: the quantity-
quality trade-off in children, parental labor market response, and the intra-household alloca-
tion of resources across children. The literature on the quantity-quality trade-off in children
(Becker and Lewis, 1973; Rosenzweig and Zhang, 2009) explores the interaction of parents’
fertility and child-investment decisions. When making choices about fertility, parents are
thought to weigh outcomes of quantity (increased number of children) against quality (hu-
man capital of children). Models of the trade-off suggest that as family size increases, there
are reductions in average child quality. With a larger number of siblings present, there are
likely fewer resources available per child. Parents provide material goods and emotional
support to their children, and siblings are then thought to vie for parents’ time and at-
tention. This literature typically assumes homogeneity of children within a household. If
parents have a child with a significant disability, the quantity-quality trade-off and associated
resource constraints may become more complex.
Work in the parental labor market response literature has investigated the effects of hav-
ing a child with a disability on parental decisions (rather than sibling outcomes). The focus
has typically been on either mother’s time allocation, i.e. maternal labor force participation
(Powers, 2004) or family resources (Parish and Cloud, 2006). In general, the literature has
found small reductions in maternal labor force participation, and hence reductions in family
resources. Recent work suggests, however, that the implications of the reported reductions
4
in maternal labor market participation on child development may be unclear; there may be
fewer material resources available, but perhaps more parental time (Gould, 2004; Burton
and Phipps, 2009).
Intra-household resource allocation across children has been a topic of interest since
the early work of Becker and Tomes (1976) and Behrman, Pollak and Taubman (1982).
Parents are thought to care about the quality (human capital, wealth) of their children
in addition to their own consumption. Depending on parental preferences and the human
capital technology, parents may optimally exhibit investment strategies that compensate for
or reinforce the variation in endowments across their children. An early-life shock to the
endowment of one child may therefore alter the parental investments made in all children in
the household.2
Following the existing literature, we broadly consider a simple framework for a two-child
household that fits within the context of the current study (see Appendix A). One sibling
is healthy (high endowment), while the other has a disability or chronic health condition
(low endowment). Children’s human capital is a function of this initial endowment as well
as parental investments. Altruistic parents, who care about the quality (human capital) of
their children in addition to their own consumption, maximize utility subject to the human
capital technology and a budget constraint. Whether parents optimally adopt a reinforc-
ing, compensating, or neutral investment strategy in response to the differences in their
children’s endowments will hinge on a tension between parental preferences and the human
capital production technology, i.e. parental aversion to inequality (Behrman, Pollack, and
Taubman, 1982) and the complementarity (substitutability) of endowment and investment
in the production of human capital. If parents adopt a compensating strategy, such that
2There is no consensus in the empirical literature as to whether parents tend to invest in ways thatcompensate for rather than reinforce variation in endowments across their children. Some studies, particu-larly those in developing countries, have found evidence of reinforcing investment behaviors(Rosenzweig andWolpin, 1988; Behrman, Rosenzweig and Taubman, 1994). Other work suggests that parents make com-pensatory investments (Behrman, Pollak and Taubman, 1982; Pitt, Rosenzweig and Hassan, 1990). In morerecent work, Hsin (2013) finds little evidence of a relationship between low birth weight and maternal timeinvestments, but argues that this average effect masks important heterogeneity by socioeconomic status.
5
more resources are allocated to the low endowment child, the human capital accumulation
of the healthy sibling suffers. If, instead, parents adopt a reinforcing strategy, such that
more resources are allocated to the high endowment child, the healthy sibling benefits from
increased human capital.
The standard framework generally precludes any direct effect of sibling poor health (low
endowment) on human capital accumulation. A sibling’s early-life health insult may only
affect human capital outcomes through the reallocation of intra-household resources. This is
a potential concern, particularly in the context where one member of the sibling pair is dis-
abled. In order to accommodate expectations of a direct or social learning effect of a sibling’s
poor health (Arnold, Levine and Patterson, 1975; Hauser and Wong, 1989; Oettinger, 2000;
Smith et al., 2002; Mikami and Pfiffner, 2008), the standard framework may be extended to
introduce sibling endowment as an additional factor in the human capital production func-
tion (see Appendix A). In this case, the effect on human capital may be decomposed into two
channels: the resource reallocation effect and the direct or social learning effect. As before,
if parents adopt a compensating strategy, such that more resources are allocated to the low
endowment child, the human capital accumulation of the healthy sibling suffers. However,
if parents adopt a reinforcing strategy, such that more resources are allocated to the high
endowment child, the net effect on the human capital of the healthy child is now ambiguous.
The relative magnitudes of the social learning (detrimental) and resource reallocation effect
(beneficial) are important.
2.2 Prior Evidence on the Effects of Siblings on Children’s Out-
comes
While it has been well documented that children’s health status and behaviors impact their
own educational outcomes as well as parental decisions and family resources, much less is
known about the direct and indirect effects of children’s health on their siblings’ outcomes.
Within the economics literature, there is some existing evidence of sibling influences from
6
an older sibling to a younger sibling, including high school graduation status (Oettinger,
2000), tobacco, alcohol, and marijuana use (Ouyang, 2004), and the initiation of sexual
intercourse (Widmer, 1997). Beyond this, there is some research that is suggestive of the
importance of siblings, including the literature that finds that family size (Hanushek, 1992),
birth order (Behrman and Taubman, 1986), and sex composition of sibship (Butcher and
Case, 1994; Kaestner, 1997) all help to shape achievement in children. The large literature
providing evidence that peers influence achievement and health behaviors is also suggestive
that siblings may also exert a strong influence (Hanushek and Rivkin, 2003; Gaviria and
Raphael, 2001).
Most past research on the siblings of individuals with developmental disabilities is from
the psychology literature. This work tends to focus on emotional and adjustment outcomes
of the sibling pair during childhood (Rossiter and Sharpe, 2001; Sharpe and Rossiter, 2002;
Stoneman, 1998; Stoneman and Brody, 1993). In reviewing this research, Stoneman (2001,
2005) concluded that there are high levels of interaction when one sibling has a developmental
disability (DD), especially during childhood, although some of this interaction is likely due to
the expanded childcare roles that non-disabled siblings, especially sisters, often play. A meta-
analytic review of the effects on the sibling relationship and sibling well-being came to a more
negative conclusion (Rossiter and Sharpe, 2001). Based on 25 studies of siblings of individuals
with DD, Rossiter and Sharpe concluded that there was a statistically significant but small
negative effect on the psychological functioning of these siblings (depression, anxiety, and
behavioral adjustment in terms of internalizing and externalizing behaviors). Rossiter and
Sharpe (2001) show that well children with siblings with chronic or severe health conditions
may be disadvantaged because their parents’ attention is diverted to the siblings with an
illness, their siblings with a condition exhibit impaired interactions, other children ostracize
and isolate all the children in this family, and because of the direct caretaking responsibilities
of having an unhealthy sibling.
In related research, children with siblings with ADHD have been shown to experience
7
higher negative relationships within the family as symptoms increase (Smith et al., 2002;
Mikami and Pfiffner, 2008), younger siblings mimic the bad behaviors of their older siblings
with ADHD (Arnold, Levine and Patterson, 1975), and have higher risks of substance use
disorders (Milberger et al., 1997). Well children with siblings with mental retardation have
lower psychological functioning, including higher rates of depression and anxiety (Rossiter
and Sharpe, 2001). In more recent work, Fletcher and Wolfe (2008) explore the possible
influence of having a sibling with ADHD on adolescents. They find significant negative
effects of having a sibling with ADHD on three different measures of years of schooling as
well as the probability of being suspended. In terms of measures of schooling, they estimate
a larger influence of ADHD on siblings than on the individual with ADHD for years of school
and the probability of attending college but not for other measures, some of which (GPA
and grade repetition) are only significant for the individual with ADHD.
3 Data
Our analysis is based on data from the Panel Study of Income Dynamics (PSID) and its
Child Development Supplement (PSID-CDS). The PSID is a longitudinal study that began in
1968 with a core sample of approximately 4,800 families. The core PSID survey includes data
covering employment, income, wealth, education, health, marriage and fertility histories, and
numerous other topics. The study has a genealogical-based design. As children of sample
families establish households of their own, they and all the members of their new household
continue to be followed as sample members. As a result of this rather unique design, the
dataset contains information about multiple generations of a family. In many cases, as 1968
PSID children have now started families of their own, it is possible to trace families across
three generations and access extensive background information collected from these families
over the past 40 years.
The Child Development Supplement was introduced in 1997 to collect additional infor-
8
mation for a subset of PSID children (ages 0-12 years in 1997) and includes an array of
measures tied to the development of children across the domains of health, psychological
well-being, social relationships, cognitive development, and education. Sample children have
been followed over a period of ten years, with subsequent rounds of the CDS administered in
2002 and 2007. The PSID-CDS sample currently contains approximately 8,000 observations
on 5,500 children from 2,400 families. The survey sampled up to two children per family
unit,3and our analysis will focus on the approximately 1,100 CDS sibling pairs.4 The sibling
sample, combining observations from the supplement’s three waves, contains approximately
5,000 observations on children ranging in age from 0 to 18 years.
As part of our analysis, we estimate fixed effects models in order to control for otherwise
unobserved family characteristics. As our sibling sample described above consists solely of
sibling pairs and we are interested in chronic health conditions that do not vary with time,
sibling-level fixed effects would be perfectly collinear with own and sibling health status. Our
fixed effects analysis exploits the unique genealogical design of the PSID. Nearly 90 percent of
children in the sibling sample are members of long-term PSID families and represent a third
generation of PSID participation. In these cases, it may be possible to identify extended
family members, or cousins, in the CDS sample by tracing sample children back to their
original 1968 PSID household. Just under half (43.8%) of children in the sibling sample have
in-sample cousins. The extended families range in size from two unique sibling pairs (59%
of extended families) to, in one instance, five unique sibling pairs. Combining observations
from the supplement’s three waves, the cousin sample includes 2,723 observations on 982
children from 209 distinct extended families.
The remaining 10 percent of children in the sibling sample are drawn from family units
3The PSID-CDS surveyed a maximum of two children per family unit, so it is possible for a child in oursibling sample to have additional siblings not captured in the CDS sample. To the extent that there areunobserved children in poor health in these households, our estimates may be biased downward. We test thesensitivity of our results to restricting our sample to only those families reporting fewer than three children(around half of our sibling sample) and find our estimates to be robust (Table 5).
4Siblings were identified using the PSID’s FIMS map file. All sibling types (full, step, adopted) werepermitted, but the sample was restricted to those sibling pairs identified as residing in the same family unit
9
newly added to the PSID through the immigrant refresher sample in 1997.5 These children
do not have the same family history available as those children descended from original 1968
families. While these children represent only a small fraction of the overall sibling sample,
they represent over 85 percent of the Hispanic children and over 97 percent of the children
reporting Asian or Pacific Islander background. This change in composition from our sibling
sample to our cousin sample is a potential limitation of our cousin-based fixed effect analysis.
However, we test the sensitivity of our baseline estimates (sibling sample) to the exclusion of
children in these groups and find that our results are not sensitive to the sample restriction
(Table 5).
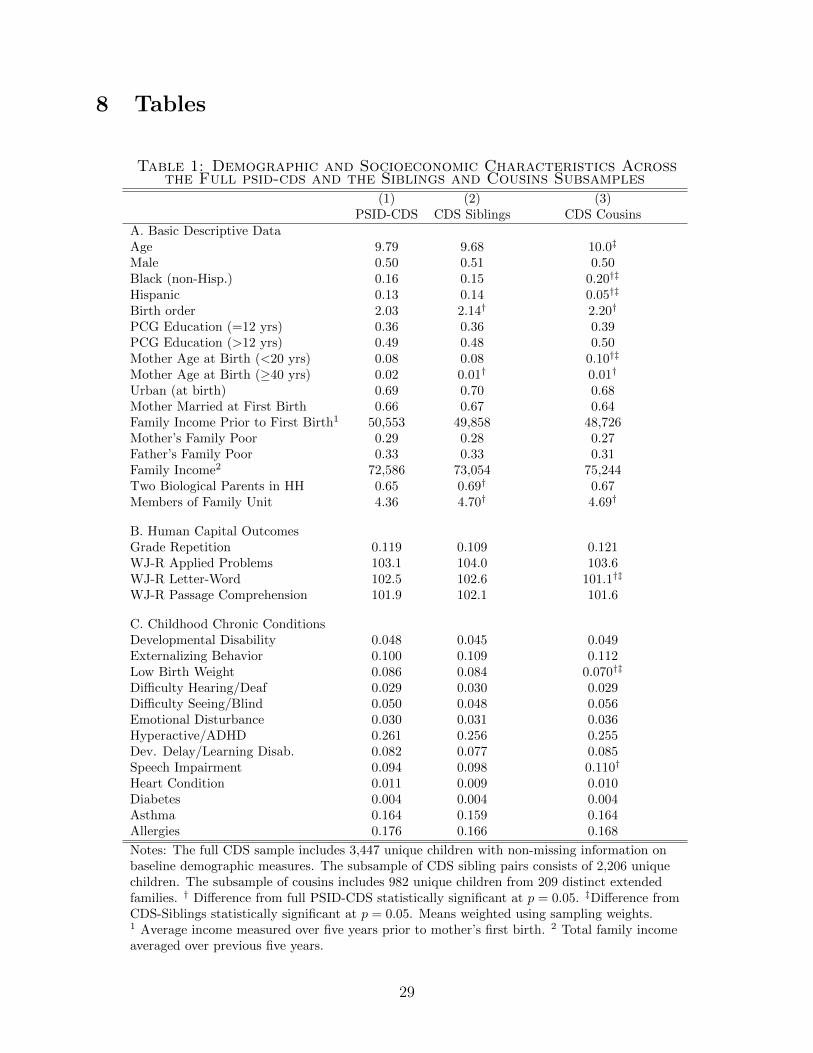
Table 1 provides a comparison of the full PSID-CDS sample to our sibling sample, as well
as to the subsample of siblings who also have extended family members in the sample (CDS
cousins). The sample means presented in Table 1 suggest that our sibling sample is highly
comparable to the full PSID-CDS in terms of observable demographic and socioeconomic
characteristics. We find no concerning differences in terms of age, gender, race, primary
caregiver education, income, or parental socioeconomic backgrounds. The average family
size is slightly larger in households with CDS siblings, but this may be expected given the
nature of the sample. A comparison of CDS siblings to the subsample of siblings with CDS
cousins shows the samples to be comparable with the exception of racial composition as
mentioned earlier.
3.1 Measures of Human Capital
We focus on a set of early education outcomes that are intended to capture a child’s human
capital accumulation. These measures include grade repetition and children’s scores on three
sections of the Woodcock-Johnson Revised (WJ-R) tests of achievement: Applied Problems,
Letter-Word, and Passage Comprehension. The WJ-R tests are standardized educational
5The immigrant refresher sample introduced recent (post-1968) immigrant families and their children tothe PSID sample in order to reflect changes in the composition of the U.S. national population. These recentimmigrants were not previously represented in the PSID.
10
achievement assessments and are designed to provide a normative score that shows the
child’s language and math abilities in comparison to a national average for the child’s age.6
Children aged 3 years and older were eligible to complete the Applied Problems and Letter-
Word tests. The Passage Comprehension test was administered to older children who were
at least 6 years of age.7
Panel B of Table 1 provides a comparison of our measures of human capital accumulation
across the full PSID-CDS sample and our CDS siblings and cousins samples. Close to 11%
of our CDS siblings sample has ever repeated a grade. Grade repetition is more common
among males (14.7%) than females (7.7%). The average scores on all three sections of the
WJ-R tests of achievement are slightly above national norms. This holds true in the full
PSID-CDS as well as in our CDS siblings and cousins samples. Males score slightly higher
on the WJ-R Applied Problems test, while females tend to score higher on the Letter-Word
and Passage Comprehension tests.
3.2 Indicators of Poor Health
As part of the CDS interview, primary caregivers are asked a series of questions assessing the
sample child’s health status, including a global measure of health and diagnosis of chronic
conditions. In addition, the CDS includes the Behavior Problems Index (BPI)8 to assess the
incidence and severity of behavioral problems in children. The BPI divides problem behaviors
into two subscales: a measure of externalizing or aggressive behavior9 and a measure of
6Scores on the WJ-R are standardized with a mean of 100 and standard deviation of 15.7In a small number of cases where that was a severe disability (e.g., co-morbid autism and mental
retardation), a child may not have been able to complete the assessments. Interviewers deferred to thejudgement of the primary caregiver. This may bias downward estimates of the effect of own disability, butshould not affect estimates of sibling spillovers. These sibling pairs are not excluded from the regressionsample when the health sibling is the target child.
8The Behavior Problem Index was developed by James Peterson and Nicholas Zill from the AchenbachBehavior Problems Checklist to measure in a survey setting the incidence and severity of child behaviorproblems.
9In the case of the externalizing subscale, these problem behaviors include: sudden changes in moodor feelings; difficulty concentrating/cannot pay attention for long; bullies or is cruel or mean to others;disobedient; does not seem to feel sorry after misbehavior; trouble getting along with people his/her ownage; impulsive or acts without thinking; restless or overly active, cannot sit still; stubborn, sullen, or irritable;
11
internalizing, withdrawn or sad behavior.
As noted above, our analysis of sibling health spillovers will focus alternately on devel-
opmental disability and externalizing behavior as an indicator of health status.10 These
conditions are both common and expected to have far-reaching effects on the educational
and social outcomes of the affected individual. As a result, having an affected child in the
household is expected to present challenges for the family unit that may lead to spillover
effects on siblings (as well as other members of the family). Developmental disability is per-
haps the most studied of children’s chronic conditions. Consistent with federal definitions
of developmental disability, we classify a sample child as developmentally disabled if he/she
has ever been diagnosed with epilepsy,11 autism, or mental retardation. These conditions
are generally diagnosed in the first few years of life, so a child is likely to be influenced from
a time very close to the sibling’s birth (or their own birth in the case of younger siblings).
According to recent work by Eget (2009)
Growing up in a family of a student with a developmental disability, specifically
mental retardation, autism, and those consistent with significant mental limita-
tions, can be a challenging experience. Siblings of these students are often faced
with more responsibilities, and sacrifices, and may have less attention given to
them because of their sibling’s needs.12
has a very strong temper and loses it easily; breaks things on purpose or deliberately destroys his/her ownor another’s things; demands a lot of attention
10We had considered sensory deficit (i.e., difficulty hearing/deafness or difficulty seeing/blindness) as anadditional disability of potential interest. We did not find statistically significant effects on measures inour set of early educational outcomes, and the results are not presented here. We do not include medicalconditions such as asthma and allergies in our analysis. These conditions may present symptoms over quite abroad range of severity. As a result they are not well-defined in terms of the expected limitations experiencedby the affected individual (or the resulting challenges faced by the family).
11While children with epilepsy/seizure disorder generally have normal intelligence, they are at increasedrisk for mental health and developmental comorbidities, increasing the need for care coordination and spe-cialized services. In a nationally representative sample, they were found to have a greater risk of limitationin ability to do things, repeating a school grade, poorer social competence and greater parent aggravation(SA, K and N, 2012).
12Eget cites the following as the basis of the above quote: Bischoff and Tingstrom (1991); Breslau, Weitz-man and Messenger (1981); Dellve, Cernerud and & Hallberg (2000); Dodd (2004); Opperman and Alant(2003); Pilowsky et al. (2004).
12
In recent years, there has been increasing attention paid to externalizing behavior as it
is a primary symptom of ADHD. Our measure of externalizing behavior is based on the
sample child’s score on the externalizing subscale of the BPI. We classify a child as having
an externalizing behavior problem if his/her score, averaged over the sample period, is at or
above the 90th percentile13 of the externalizing subscale distribution (a score of 11 our of a
maximum of 17).14 We average a child’s BPI score over all available periods in order to best
identify those children with chronic behavioral problems.15
Panel C of Table 1 shows the incidence of chronic health conditions in our CDS siblings
and cousins samples as well as in the full PSID-CDS. By construction, approximately 10
percent of our sample children are classified as having an externalizing behavior problem.
Developmental disabilities are less common, with 4.5% of sample children affected by at
least one developmental disability. Among CDS siblings with a developmental disability,
epilepsy is the most common qualifying condition. Comorbidity is common. In our sample,
17 percent of children with DD report multiple qualifying disabilities (Table B.1). There are
some differences in the distribution of disabilities according to gender. As may be expected,
autism is found to be more prevalent in males than females (37.8% of DD cases versus 15.1%).
Tables AB.2 and AB.3 offer insight into individual comorbidity and within-family corre-
lation of chronic conditions, respectively. Developmental disability is positively but modestly
correlated between siblings (ρ = 0.066). The correlation between sibling externalizing be-
havior is somewhat stronger (ρ = 0.149). Children with an externalizing sibling also have
13We test the sensitivity of our results to our selection of the 90th percentile as the threshold for exter-nalizing behavior. Our results are robust to lowering the threshold to the 85th and 80th percentiles (Table5).
14Currie and Stabile (2006) use a similar approach in their work with ADHD. They argue that it isproblematic to focus only on those with diagnosed ADHD as there can be systematic differences in thosechildren for whom treatment has been sought and for those whom it has not. Our approaches differ in theparticular scales used. In our work, we use the 17-item externalizing subscale of the PSID-CDS BPI. In theirwork, Currie and Stabile use the 5-item hyperactivity subscale of the NLSY BPI. In our sample, childrenwith diagnosed ADHD score one standard deviation higher at the mean compared to the full PSID-CDSsample (Table B.4).
15In our sample, 88.5% of observations were consistently identified as ”externalizing”/”non-externalizing”across permanent and transitory measures. We test the sensitivity of our results to the use of contempora-neous (versus averaged) BPI score in classifying children with externalizing behavior (Table 5).
13
slightly elevated BPI scores (Table B.4).16 Neither developmental disability nor externalizing
behavior appears to be concentrated within extended families.
3.3 Predictors of Poor Health
The aim of our study is to examine the potential spillover effects of a sibling’s poor health
on outcomes tied to human capital accumulation. An important alternative hypothesis for
these associations is that they are driven by confounding family factors; households with a
child in poor health may differ systematically from households with healthy children. These
(potentially unobservable) differences in households may bias our estimation of sibling health
spillover effects. In order to explore the potential importance of this issue, we examine the
observable family correlates of having a child in poor health using the PSID-CDS sample.
Table 2 shows the results of an analysis attempting to predict the presence of a child
with a developmental disability. We utilize a set of factors that predate the birth of the child
in order to focus on exogenous determinants. We find some racial differences, where black
families are nearly 2 percentage points less likely to have a child in the household with a
developmental disability. We also find some evidence that the likelihood of having a child
with a developmental disability is negatively associated with maternal education, since high
school dropout mothers are 3 to 4 percentage points more likely to have this outcome. On
the other hand, many family and individual factors are unrelated to this outcome, including
socioeconomic status of the father during childhood and age of the mother at birth. Table
3 then shows the results of a similar analysis for the presence of a child with externalizing
behavior, and we find even fewer associations with family factors. The only statistically
significant difference across families is the educational level of the mother.
These findings of the predictors of the presence of an unhealthy child in a household
necessitate the use of controls for observable differences across families. Following the logic
16We test the sensitivity of our results to a control for own BPI score (rather than an indicator for ownexternalizing behavior). The magnitude of the coefficients of interest are slightly reduced, but our resultsare largely robust (Table 5).
14
of Altonji, Elder and Taber (2005), among others, we suggest that if the estimated effects
of sibling health spillovers are robust to the inclusion of important observable factors in our
data, any residual effects of unobservables is likely to be small. However, there may be
additional unobserved differences in families with and without a child that is DD or exhibits
externalizing behaviors including genetic differences. We utilize the unique genealogical
structure of our data to deploy cousin fixed effects specifications to explore this possibility.
4 Empirical Methods
To obtain baseline estimates of the effects of sibling poor health on children’s human cap-
ital accumulation, we follow Fletcher and Wolfe (2008) and begin with OLS models of the
following form:
Yit = β + β1Healthj + β2Healthi + β3Xit + δt + εit (1)
where Yit is one of the early educational outcomes for child i in period t. Healthj is
a measure of the sibling’s health status. Depending on the specified health condition of
interest, this measure is either an indicator for a sibling’s developmental disability or a
sibling’s externalizing behavior. Healthi is similarly defined, but is an indicator for a child’s
own health status. Xit is a vector of individual- and family-level covariates. Our models
allow for separate intercepts for the three waves of the PSID-CDS, and all standard errors
are clustered at the family (sibling pair) level.
We estimate equation (1) using three different versions of Xit. The first version includes
child age, child gender, child race, birth order, an indicator of high-risk birth (mother’s
age at birth < 20 years or ≥ 40 years), and maternal education (less than high school,
high school, or more than high school). The second version of Xit is a much fuller list
of controls. In addition to the measures listed above, it also includes: mother’s marital
status at time of first birth; urbanicity at time of birth (urban, non-urban); parental family
15
background (mother grew up “poor”, father grew up “poor”); average family income over
five years prior to the birth of first child; parental history of childhood psychological or
emotional problems; primary caregiver’s religion (Catholic, Protestant, no religion, other
religions); parent(s) ever incarcerated; father’s interview status (active PSID member, non-
sample/non-response); and whether the child’s family recently immigrated to the United
States (PSID immigrant refresher family). The third version of Xit instead introduces a set
of potentially endogenous mediators: family income (five-year rolling average of total family
income),17 family size (number of persons in the family unit), and family structure (whether
both biological parents in household).
In each case, we attempt to carefully define our comparison or control group. The PSID-
CDS sample includes children with a range of health conditions. However, for many of
these conditions, the incidence within our sample is too low to address them directly in our
analysis. We restrict our focus to two specific conditions of interest: developmental disability
and externalizing behavior. For each of these conditions of interest, we restrict the regression
sample such that a sibling pair is included in the sample only if (at least) one of the following
conditions is satisfied:18 the target child has the specified health condition, the child’s sibling
has the specified health condition, or both members of the sibling pair are healthy. A child
is classified as “healthy” if he/she is free of a set of health conditions we observe in the CDS,
including developmental disability, externalizing behavior, developmental delay (including
speech impairment), serious hearing difficulty or deafness, and serious difficulty seeing or
blindness.
We next estimate fixed effects models using cousins. As our sample consists solely of
sibling pairs and we are interested in chronic health conditions that do not vary with time,
17We tested the sensitivity of our results to alternative measures of family income, including contempo-raneous income, average income in five years prior to child’s birth, average income in five years prior tomother’s first birth, and income adjusted for family size
18A sibling pair will be included in the regression sample if both the target child and his/her sibling havethe condition of interest. A sibling pair may also be included in the regression sample if one sibling hasthe condition of interest and the other sibling is “unhealthy”, i.e. has a chronic condition other than thecondition of interest.
16
we are not able to introduce sibling-level fixed effects to our specifications. Using the sub-
sample of sibling pairs who also have extended family members (CDS cousins) in the sample,
however, we estimate fixed effects models of the form:
Yit = β + β1Healthj + β2Healthi + β3Xit + δt + αE + εit (2)
where αE is a set of binary indicators for each extended family (or set of cousins). Xit
is a vector of individual and immediate family-level controls that includes child age, child
gender, child birth order, child high-risk birth, and maternal education. There was too little
variation of reported race within extended families to include child race in Xit. By including
extended family or cousin fixed effects, we control for otherwise unobservable time-invariant
characteristics consistent across units in the extended family, including shared genetics and
common grandparent’s SES and culture, diet and norms.
For the cousin fixed effects analysis, we adjust our definition of the control or comparison
group to reflect the increased scale of the family structure of interest. For each of our con-
ditions of interest, we restrict the regression sample such that all members of an extended
family are included in the sample if any member of the extended family has the specified
health condition or if all members of the extended family are healthy. An additional ad-
justment was made for large extended families (i.e. families for which we observe cousins
from more than two family units) with an unhealthy member(s), but no history of the con-
dition of interest. In these cases, if at least two family units within the extended family had
healthy sibling pairs, the healthy sibling pairs from that extended family were included in
the comparison group.
17
5 Results
Table 4 shows OLS estimates for the effects of sibling poor health,19 specifically develop-
mental disability (Panel A) and externalizing behavior (Panel B), on our measures of human
capital accumulation with varying sets of controls. The first column shows estimates with
the baseline set of controls, the second column shows estimates with a rich set of controls
for family background, and the third column shows estimates with a set of potentially en-
dogenous family mediators: family income, family size, and family structure.
Our baseline results suggest that chronic conditions during childhood have detrimental
effects not only on the early educational outcomes of the child directly affected but also on
the human capital accumulation of other children in the household. We find evidence that
having a sibling in poor health, either a sibling with developmental disability or a sibling with
externalizing behavior, may be associated with an increased risk of ever having repeated a
grade. In the case of externalizing behavior, we find that a sibling’s poor health is associated
with lower scores on the Woodcock-Johnson (WJ-R) Applied Problems, Letter-Word, and
Passage Comprehension tests. We estimate even larger sibling health spillovers on measured
math and language achievement in the case of developmental disability. In particular, our
results suggest that children with a developmentally disabled sibling may be expected to score
3.8 (Passage Comprehension) to 5.8 (Letter-Word) points lower on the WJ-R achievement
tests. Score reductions of this magnitude represent 1/4 to 1/3 of a standard deviation. The
inclusion of a rich set of controls for family background (Column 2) has very little effect on
the estimated effects of sibling health spillovers.
The specifications in Columns 1 and 2 estimate an “overall” effect of sibling poor health on
measures of human capital accumulation. These specifications do not control for potentially
endogenous mediators. Prior research suggests that a child’s poor health may affect the
financial resources, fertility decisions, and structure of households. That is, if a family has
19In the case of grade repetition, a binary outcome measure, we estimate a linear probability model;however, our results are robust to probit estimation (Table 5).
18
a child with a developmental disability or externalizing behavior, parents may reduce labor
force participation in order to care for the child and thus have reduced incomes. Similarly,
the stress associated with raising a child with one of these conditions may lead to parental
separation or divorce as well as influence parents’ desired (and actual) number of children.
It is possible that children’s responses to a sibling’s developmental disability or externalizing
behavior may be the result of effects on family income, family size, and family structure. We
begin to explore these mediators with our estimates in Column 3. As one might expect, the
point estimates for the effect of a sibling’s poor health are reduced, suggesting a role for family
income, family size, and family structure. Point estimates of sibling health spillovers are
reduced by an average of 18% and 9% in the case of externalizing behavior and developmental
disability, respectively. Qualitatively, our core results are unchanged.
The coefficients on the other control variables are generally consistent with expectations
from the related literatures.20 For example, the higher education of a child’s mother or
primary caregiver is highly predictive of improved outcomes across all four of our measures of
human capital accumulation. Children of mothers who were living in urban areas or married
at the time of their first birth tend to outperform their peers. In addition, the achievement
gap is reflected in significantly worse outcomes associated with a child’s minority status.
Even with controls for a rich set of observable family characteristics, it is still possible
that families with a child with a developmental disability or externalizing behavior may differ
from families with healthy children in many unobserved ways. By introducing extended
family or cousin fixed effects, we are able to control for unobserved time-invariant family
characteristics that may bias our OLS estimates. These characteristics might include shared
genetics and common grandparent’s SES and culture, diet and norms.
Table 6 shows fixed effects estimates for the influence of sibling poor health on our
measures of child human capital accumulation. Once we adjust for time-invariant unobserved
family characteristics, the results suggest that there may not be a significant influence of
20In the interest of economizing on space, we present point estimates only for our coefficients of interest.Tables with a full set of coefficients are available upon request.
19
sibling externalizing behavior on these outcomes (Panel B). We find that the estimated effect
diminishes in magnitude across all four of our outcome measures when compared to our OLS
estimates. None of the estimates are statistically significant at conventional levels.
The estimates for the effects of sibling developmental disability (Panel A), however, are
largely robust to the inclusion of extended family fixed effects. Having a sibling with a
developmental disability is associated with important reductions in measured language and
math achievement. On average, a child with a developmentally disabled sibling may be
expected to score four to six points, or 1/3 of a standard deviation,21 lower on Woodcock-
Johnson (WJ-R) tests of achievement when compared to children with healthy siblings.
These findings suggest a very strong influence of having a sibling with a developmental
disability on one’s own human capital.
6 Results by Characteristics of Sibship
Up to this point in our analysis, we have implicitly assumed that a sibling’s poor health
affects all children equally. However, research in the psychology literature might lead us to
expect heterogeneity in sibling spillovers according to specific characteristics of the sibship.
Prior evidence suggests that females experience greater intimacy in the sibling relationship
compared to males. We may therefore expect that a sibling’s poor health may have an
increased influence among sisters. In addition, we might expect younger siblings to be
especially vulnerable to sibling health spillovers. A child born into a household facing the
stresses tied to an older sibling’s chronic condition may experience reduced investments and
parental attention from the earliest years of life. Additionally, older children often serve as
role models and therefore may exert a greater influence on their siblings. Over-identification,
where a child may adopt some of the behaviors of a disabled sibling, is more likely to occur if
the typically-developing child is younger than the affected sibling (Meyer and Vadasy, 2007).
Children born right after a sibling with a disability may feel additional parental pressure to
21Scores on the WJ-R assessments are standardized with a mean of 100 and standard deviation of 15
20
achieve. While some children will have the intellectual capacity and personality to live up
to these elevated expectations, for other children the additional demands may be too much
emotionally or intellectually (Siegel and Silverstein, 1994).
The results of an examination of potential heterogeneity in sibling health spillovers by
the child’s gender and relative age are presented in Table 7. The results suggest that when
children’s human capital accumulation is measured through Woodcock-Johnson assessments,
females are more negatively affected by a sibling’s poor health. This disparity is especially
pronounced in the case of developmental disability. Among females, having a developmen-
tally disabled sibling is associated with significant (on the order of 1/3 to 1/2 of a standard
deviation) reductions in measured math and language ability. These large effects are not
seen among males. While some of the gender-based differences are imprecisely estimated
(only the difference in WJ-R Applied Problems scores is significant at conventional levels),
the estimated effect sizes are large across all three sections of the Woodcock-Johnson.
We then divide the sample according to the child’s relative age. The “older” group
includes those children who were born prior to their sample sibling. The results of Panel B
suggest that in the case of externalizing behavior, younger siblings tend to be more negatively
affected by a sibling’s poor health. Among siblings of a child with externalizing behavior,
younger siblings can be expected on average to score 3 to 5 points (or 1/5 to 1/3 of a standard
deviation) lower on Woodcock-Johnson tests when compared to children born prior to their
affected sibling. In the case of developmental disability, the results are less clear. There is
some evidence to suggest that younger siblings may fare worse in terms of grade repetition
and performance on the WJ-R Passage Comprehension test, but this pattern is not consistent
across the remaining WJ-R measures.
21
7 Discussion and Conclusions
Although there is high-quality research examining how the immediate circumstances faced
during childhood may affect child development and achievement, the influence of siblings
remains an area of relatively limited large scale research. With this study, we have begun to
address this gap by analyzing one particular aspect of the sibling relationship: the influence
of sibling health status on children’s human capital accumulation.
We show that childhood chronic health conditions, specifically developmental disability
and externalizing behavior, not only negatively affect the early educational outcomes of the
individual directly affected but may also influence the human capital accumulation of other
children in the household. We find that having a sibling with a developmental disability or
externalizing behavior is associated with reductions in measured math and language achieve-
ment. There is also some evidence to suggest an increased risk of grade repetition. Estimated
sibling health spillovers for developmental disability, in particular, are large. We find that,
on average, siblings of children with a developmental disability may be expected to score
roughly 1/3 of a standard deviation lower on WJ-R tests of achievement. These results are
robust to our attempts to control for potentially confounding family factors.
We also show, consistent with the psychology literature, that the influence of siblings
may vary according to characteristics of the sibship. We find evidence of heterogeneity
in sibling health spillovers according to the child’s gender and relative age. Specifically,
when human capital accumulation is measured through WJ-R assessments, sisters appear to
be more negatively affected by a sibling’s poor health. This gender-based heterogeneity is
especially pronounced among siblings of children with developmental disability. In the case of
externalizing behavior, we also find evidence of heterogeneous spillovers by the child’s relative
age, with the human capital accumulation of younger siblings more negatively influenced by
a sibling’s behavioral problems.
A potential concern with our analysis is that estimates of sibling health spillovers may be
biased due to confounding family factors. Families with an unhealthy child may differ from
22
families with healthy children along many observed and unobserved dimensions. We explore
the potential importance of this issue by examining the observable family correlates of having
a child affected by each of our conditions of interest. We find that many observed family and
individual characteristics are unrelated to having a child with a developmental disability
or externalizing behavior. Nevertheless, there may be additional unobserved differences
between families with and without a child in poor health, including genetics. This is an area
where our data poses some limitations on the potential analyses. We are unable to conduct
a sibling-level fixed effects analysis; our sample consists solely of sibling pairs and we are
interested in chronic conditions that do not vary with time. In our analysis we take a unique
approach to this issue. We exploit the genealogical design of the PSID in order to construct
extended family, or cousin, fixed effects. One caveat to this fixed effects approach, however,
is that we are only able to control for unobserved factors on one side of a child’s family.
Overall, our results suggest an important influence of sibling health status on children’s
early educational outcomes. Our analysis of the PSID-CDS sample, however, does not
allow us to comment as to whether there may be longer term effects. Future work should
consider whether sibling health status influences human capital accumulation, along with
associated socioeconomic outcomes, into young adulthood and beyond. Further, future work
should explore the potential mechanisms that could explain the link between sibling health
and children’s outcomes. Potential pathways of interest include (1) direct effects of having
a sibling with an illness, such as behavioral spillovers that interfere with the well child’s
development, (2) income effects, i.e. those due to the need to finance medical expenditures
or a parent’s reduction in labor force participation, that stem from the sibling’s illness and
may then spillover onto the well child, and (3) substitution effects, such as those stemming
from parents’ efforts to either reinforce or offset differences in the health endowments of their
children, that could affect the level of time and financial investments made in the well child.
Our results have several important implications. First, they suggest a need to broaden
theoretical and empirical models of human capital determinants to include a wider set of
23
family factors with an emphasis on the importance of siblings. Second, the results suggest
there may be uncounted benefits of improving the health of children on the outcomes of
their family members. For example, reducing the hyperactive symptoms of a child through
medication or behavioral therapy can benefit the outcomes of the treated child, as well as the
child’s family members, especially siblings. The magnitude of these spillovers are large and
complement other results in the literature suggesting spillovers in addressing poor health
in children on their classmates’ school performance (Aizer, 2008; Fletcher, 2010). These
spillover effects are not currently included as a part of cost-benefit calculations when evalu-
ating programs that aim to improve children’s health, but our results combined with others
in the literature suggest current calculations of the effects of health improving programs are
(potentially severely) underestimated.
24
References
Aizer, Anna. 2008. “Peer Effects and Human Capital Accumulation: the Externalities ofADD.” NBER Working Paper No. 14354.
Altonji, Joseph G., Todd E. Elder, and Christopher R. Taber. 2005. “Selectionon Observed and Unobserved Variables: Assessing the Effectiveness of Catholic Schools.”Journal of Political Economy, 113(1): 151–184.
Arnold, J. E., A. G Levine, and J. R Patterson. 1975. “Changes in sibling behaviorfollowing family intervention.” Journal of Consulting and Clinical Psychology, 43: 683–688.
Becker, Gary S., and H. Gregg Lewis. 1973. “On the Interaction between the Quantityand Quality of Children.” Journal of Political Economy, 81(2): S279–S288.
Becker, Gary S, and Nigel Tomes. 1976. “Child Endowments and the Quantity andQuality of Children.” Journal of Political Economy, 84(4): S143–62.
Behrman, Jere R., and Paul Taubman. 1986. “Birth order, schooling, and earnings.”Journal of Labor Economics, 4: S121–45.
Behrman, Jere R, Mark R Rosenzweig, and Paul Taubman. 1994. “Endowmentsand the Allocation of Schooling in the Family and in the Marriage Market: The TwinsExperiment.” Journal of Political Economy, 102(6): 1131–74.
Behrman, Jere R, Robert A Pollak, and Paul Taubman. 1982. “Parental Preferencesand Provision for Progeny.” Journal of Political Economy, 90(1): 52–73.
Bischoff, L. B., and D. H Tingstrom. 1991. “Siblings of children with disabil-ities:Psychological and behavioral characteristics.” Counseling Psychology Quarterly,4(4): 311–322.
Boyle, Coleen A., Sheree Boulet, Laura A. Schieve, Robin A. Cohen, Stephen J.Blumberg, Marshalyn Yeargin-Allsopp, Susanna Visser, and Michael D. Ko-gan. 2011. “Trends in the Prevalence of Developmental Disabilities in US Children, 1997-2008.” Pediatrics, 127(6): 1034–1042.
Breslau, N., M. Weitzman, and K. Messenger. 1981. “Psychologic functioning ofsiblings of disabled children.” Pediatrics, 67(3): 344–353.
Burton, P., and S. Phipps. 2009. “Economic Costs of Caring for Children with Disabili-ties.” Journal of Political Economy, 81(2): S279S288.
Butcher, Kristin E., and Anne Case. 1994. “The effect of sibling sex composition onwomen’s education and earnings.” Quarterly Journal of Economics, 109: 531–63.
Currie, Janet, and Mark Stabile. 2006. “Child mental health and human capital accu-mulation: The case of ADHD.” Journal of Health Economics, 25(6): 1094 – 1118.
25
Dellve, L, L. Cernerud, and L.R. & Hallberg. 2000. “Harmonizing dilemmas. Siblingsof children with DAMP and Asperger syndromes experiences of coping with their lifesituations.” Scandinavian Journal of Caring Science, 14(3): 172–178.
Derouin, D., and P. O. Jessee. 1996. “Impact of a chronic illness in childhood: siblings’perceptions.” Issues in Comprehensive Pediatric Nursing, 19(2): 135–147.
Dodd, L. W. 2004. “Supporting the siblings of young children with disabilities.” BritishJournal of Special Education, 21(1): 41–49.
Dunn, J. 1992. “Siblings and development.” Current Directions in Psychological Science,1(1): 6–9.
Eget, Leslie. 2009. “Siblings of those with developmental disabilities: career exploration andlikelihood of choosing a helping profession.” PhD diss. Indiana University of Pennsylvania.
Fletcher, J. 2010. “Spillover effects of inclusion of classmates with emotional problemson test scores in early elementary school.” Journal of Policy Analysis and Management,29(1): 69–83.
Fletcher, Jason, and Barbara Wolfe. 2008. “Child mental health and human capitalaccumulation: The case of ADHD revisited.” Journal of Health Economics, 27(3): 794 –800.
Gaviria, Alejandro, and Steven Raphael. 2001. “School-Based peer effects and juvenilebehavior.” Review of Economics and Statistics, 83(2): 257–268.
Gould, Elise. 2004. “Decomposing the effects of children’s health on mother’s labor supply:is it time or money?” Health Economics, 13(6): 525–541.
Greene, Ross W. Ph.D.and Biederman, Joseph M.D, Michael C. B.A. Faraone,Stephen V. Ph.D.and Monuteaux, Eric Sci.D. Mick, Emily P. B.A. DuPre,Catherine S. B.A. Fine, and Jennifer C. B.A. Goring. 2011. “Social Impairmentin Girls With ADHD: Patterns, Gender Comparisons, and Correlates.” Journal of theAmerican Academy of Child & Adolescent Psychiatry, 40(6): 704–710.
Hanushek, Eric A. 1992. “The trade-off between child quantity and quality.” Journal ofPolitical Economy, 100: 84–117.
Hanushek, Eric A., Kain John F. Markman Jacob M., and Steven G. Rivkin.2003. “Does peer ability affect student achievement?” Journal of Applied Econometrics,18(5): 527–544.
Hauser, R.M., and R. Wong. 1989. “Sibling Resemblance and Inter-Sibling Effects inEducational Attainment.” Sociology of Education, 62: 149–71.
Haynie, Dana L., and Suzanne McHugh. 2003. “Sibling deviance: In the shadows ofmutual and unique friendship effects?” Criminology, 41(2): 35592.
26
Hsin, Amy. 2013. “Is Biology Destiny? Birth Weight and Differential Parental Treatment.”Demography, Forthcoming.
Kaestner, Robert. 1997. “Are brothers really better? Sibling sex composition and educa-tional achievement revisited.” Journal of Human Resources, 32: 250–84.
Mash, E. J., and C. Johnston. 1983. “Sibling interactions of hyperactive and normalchildren and their relationship to reports of maternal stress and self-esteem.” Journal ofClinical Child Psychology, 12: 91–99.
Meyer, D. J., and P. F. Vadasy. 2007. Sibshops: Workshops for siblings of children withspecial needs. Baltimore, MD: Paul H. Brookes.
Mikami, A.Y., and L. J. Pfiffner. 2008. “Sibling relationships among children withADHD.” Journal of Attention Disorders, 11(4): 482–492.
Milberger, S, J. Biederman, S. V. Faraone, T. Wilens, and M. P Chu. 1997.“Associations between ADHD and psychoactive substance use disorders: Findings from alongitudinal study of high-risk siblings of ADHD children.” American Journal on Addic-tions, 6(4): 318–329.
Oettinger, Gerald S. 2000. “Sibling similarity in high school graduation outcomes: Causalinterdependency or unobserved heterogeneity?” Southern Economic Journal, 66(3): 631–48.
Opperman, S., and E. Alant. 2003. “The coping responses of the adolescent siblings ofchildren with severe disabilities.” Disability and Rehabilitation, 25(9): 441–454.
Ouyang, Lijing. 2004. “Sibling effects on teen risky behaviors.” Duke University WorkingPaper.
Parish, S. L., and J. M. Cloud. 2006. “Financial well-being of young children withdisabilities and their families.” Social Work, 51(3): 223–232.
Pilowsky, T., N. Yirmiya, O. Doppelt, V. Gross-Tsur, and R. S. Shalev. 2004.“Social and emotional adjustment of siblings of children with autism.” Journal of ChildPsychology and Psychiatry, 45(4): 855–865.
Pitt, Mark M, Mark R Rosenzweig, and Md Nazmul Hassan. 1990. “Productiv-ity, Health, and Inequality in the Intrahousehold Distribution of Food in Low-IncomeCountries.” American Economic Review, 80(5): 1139–56.
Powers, E.T. 2004. “Children’s health and maternal work activity: Estimates under alter-native disability de?nitions.” The Journal of Human Resources, 38(3): 522556.
Rosenzweig, Mark R., and Junsen Zhang. 2009. “Do Population Control Policies In-duce More Human Capital Investment? Twins, Birth Weight and China’s One-ChildPolicy.” Review of Economic Studies, 76(3): 1149 – 1174.
27
Rosenzweig, Mark R., and Kenneth I. Wolpin. 1988. “Heterogeneity, IntrafamilyDistribution, and Child Health.” Journal of Human Resources, 23(4): 437–461.
Rossiter, L., and D. (2001) Sharpe. 2001. “The siblings of individuals with mentalretardation: A quantitative integration of the literature.” Journal of Child and FamilyStudies, 10(1): 65–84.
SA, Russ, Larson K, and Halfon N. 2012. “A national profile of childhood epilepsy andseizure disorder.” Pediatrics, 129(2): 256–64.
Sharpe, D., and L. Rossiter. 2002. “Siblings of children with a chronic illness: A meta-analysis.” Journal of Pediatric Psychology, 27: 699710.
Siegel, Bryna, and Stuart Silverstein. 1994. What About Me? Growing Up with aDevelopmentally Disabled Sibling. Da Capo Press.
Smith, A. J., R. T. Brown, V. Bunke, R. L. Blount, and E. Christophersen.2002. “Psychosicial adjustment and peer competence of siblings of children with attention-deficit/hyperactivity disorder.” Journal of Attention Disorders, 5(3): 165–177.
Stoneman, Z. 1998. “Handbook of Mental Retardation and Development.” , ed. R. M.Hodapp & E. Zigler J. A. Burack, Chapter Research on siblings of children with men-tal retardation: Contributions of developmental theory and etiology, 669692. Cambridge:Cambridge University Press.
Stoneman, Z. 2001. “Supporting positive sibling relationships during childhood.” MentRetard Dev Disabil Res Rev, 7: 134142.
Stoneman, Z. 2005. “Siblings of children with disabilities: research themes.” Ment Retard,43: 339350.
Stoneman, Z., and G. H Brody. 1993. “The effects of mental retardation, disability,and illness on sibling relationships.” , ed. Z. Stoneman & P. W. Berman, Chapter Siblingrelations in the family context, 3–30. Baltimore: Brookes.
Widmer, Eric. 1997. “Influence of older siblings on initiation of sexual intercourse.” Journalof Marriage and the Family, 59(4): 928–938.
Williams, Phoebe Dauz, Arthur R. Williams, J. Carolyn Graff, Sandra Han-son, Anne Stanton, Carol Hafeman, Adrienne Liebergen, Karla Leuenberg,Robyn Karlin Setter, Lavonne Ridder, Heather Curry, Martha Barnard, andSusan Sanders. 2002. “Interrelationships Among Variables Affecting Well Siblings andMothers in Families of Children with a Chronic Illness or Disability.” Journal of BehavioralMedicine, 25(5): 411 – 424.
28
8 Tables
Table 1: Demographic and Socioeconomic Characteristics Acrossthe Full psid-cds and the Siblings and Cousins Subsamples
(1) (2) (3)PSID-CDS CDS Siblings CDS Cousins
A. Basic Descriptive DataAge 9.79 9.68 10.0‡
Male 0.50 0.51 0.50Black (non-Hisp.) 0.16 0.15 0.20†‡
Hispanic 0.13 0.14 0.05†‡
Birth order 2.03 2.14† 2.20†
PCG Education (=12 yrs) 0.36 0.36 0.39PCG Education (>12 yrs) 0.49 0.48 0.50Mother Age at Birth (<20 yrs) 0.08 0.08 0.10†‡
Mother Age at Birth (≥40 yrs) 0.02 0.01† 0.01†
Urban (at birth) 0.69 0.70 0.68Mother Married at First Birth 0.66 0.67 0.64Family Income Prior to First Birth1 50,553 49,858 48,726Mother’s Family Poor 0.29 0.28 0.27Father’s Family Poor 0.33 0.33 0.31Family Income2 72,586 73,054 75,244Two Biological Parents in HH 0.65 0.69† 0.67Members of Family Unit 4.36 4.70† 4.69†
B. Human Capital OutcomesGrade Repetition 0.119 0.109 0.121WJ-R Applied Problems 103.1 104.0 103.6WJ-R Letter-Word 102.5 102.6 101.1†‡
WJ-R Passage Comprehension 101.9 102.1 101.6
C. Childhood Chronic ConditionsDevelopmental Disability 0.048 0.045 0.049Externalizing Behavior 0.100 0.109 0.112Low Birth Weight 0.086 0.084 0.070†‡
Difficulty Hearing/Deaf 0.029 0.030 0.029Difficulty Seeing/Blind 0.050 0.048 0.056Emotional Disturbance 0.030 0.031 0.036Hyperactive/ADHD 0.261 0.256 0.255Dev. Delay/Learning Disab. 0.082 0.077 0.085Speech Impairment 0.094 0.098 0.110†
Heart Condition 0.011 0.009 0.010Diabetes 0.004 0.004 0.004Asthma 0.164 0.159 0.164Allergies 0.176 0.166 0.168
Notes: The full CDS sample includes 3,447 unique children with non-missing information onbaseline demographic measures. The subsample of CDS sibling pairs consists of 2,206 uniquechildren. The subsample of cousins includes 982 unique children from 209 distinct extendedfamilies. † Difference from full PSID-CDS statistically significant at p = 0.05. ‡Difference fromCDS-Siblings statistically significant at p = 0.05. Means weighted using sampling weights.1 Average income measured over five years prior to mother’s first birth. 2 Total family incomeaveraged over previous five years.
29

Table 2: Predictors of Developmental DisabilityProbit
dydx SEBirth order -0.000213 (0.00445)Male(d) 0.0178** (0.00893)Black (non-Hisp.)(d) -0.0162 (0.0127)PCG Educ 12 years(d) -0.0284** (0.0119)PCG Educ> 12 years(d) -0.0333** (0.0159)Family Income Prior to First Birth -0.0154** (0.00784)High-risk Birth(d) -0.00664 (0.0145)Urban (at birth)(d) -0.000149 (0.00938)Mother Married at First Birth(d) 0.0263** (0.0123)Mother’s Family Poor(d) -0.00945 (0.0102)Father’s Family Poor(d) -0.0130 (0.0101)History Childhood Psych./Emotional Problems(d) 0.0510 (0.0574)Catholic(d) -0.00100 (0.0147)Protestant(d) -0.0132 (0.0141)No Religion(d) -0.00489 (0.0191)Observations 1277Log-likelihood Value -186.6Pseudo R2 0.058
Notes: Marginal effects estimated at sample means except in the case of binary covariates(d),
in which case marginal effects estimated as discrete change in dummy variable from 0 to 1. Standard
errors are in parentheses. Family Income averaged over five years prior to mother’s first birth.
High-risk birth measure is an indicator for births to mothers < 20 years or ≥ 40 years
* p < 0.10, ** p < 0.05
30
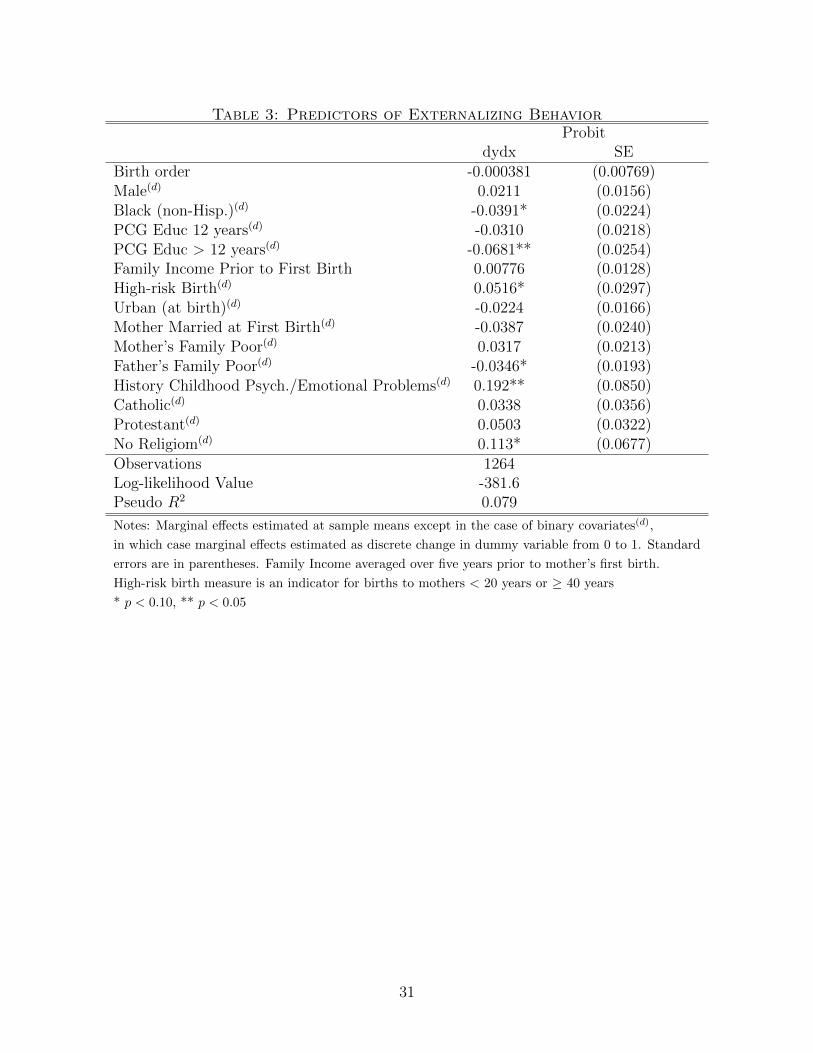
Table 3: Predictors of Externalizing BehaviorProbit
dydx SEBirth order -0.000381 (0.00769)Male(d) 0.0211 (0.0156)Black (non-Hisp.)(d) -0.0391* (0.0224)PCG Educ 12 years(d) -0.0310 (0.0218)PCG Educ > 12 years(d) -0.0681** (0.0254)Family Income Prior to First Birth 0.00776 (0.0128)High-risk Birth(d) 0.0516* (0.0297)Urban (at birth)(d) -0.0224 (0.0166)Mother Married at First Birth(d) -0.0387 (0.0240)Mother’s Family Poor(d) 0.0317 (0.0213)Father’s Family Poor(d) -0.0346* (0.0193)History Childhood Psych./Emotional Problems(d) 0.192** (0.0850)Catholic(d) 0.0338 (0.0356)Protestant(d) 0.0503 (0.0322)No Religiom(d) 0.113* (0.0677)Observations 1264Log-likelihood Value -381.6Pseudo R2 0.079
Notes: Marginal effects estimated at sample means except in the case of binary covariates(d),
in which case marginal effects estimated as discrete change in dummy variable from 0 to 1. Standard
errors are in parentheses. Family Income averaged over five years prior to mother’s first birth.
High-risk birth measure is an indicator for births to mothers < 20 years or ≥ 40 years
* p < 0.10, ** p < 0.05
31
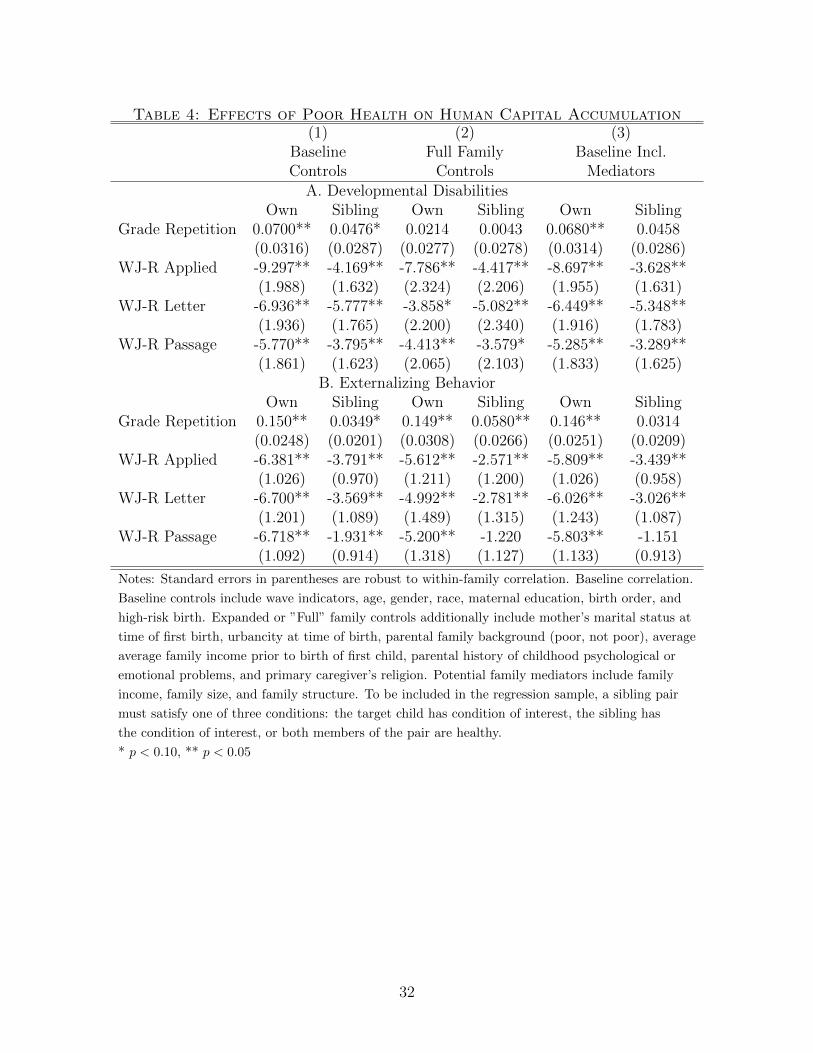
Table 4: Effects of Poor Health on Human Capital Accumulation(1) (2) (3)
Baseline Full Family Baseline Incl.Controls Controls Mediators
A. Developmental DisabilitiesOwn Sibling Own Sibling Own Sibling
Grade Repetition 0.0700** 0.0476* 0.0214 0.0043 0.0680** 0.0458(0.0316) (0.0287) (0.0277) (0.0278) (0.0314) (0.0286)
WJ-R Applied -9.297** -4.169** -7.786** -4.417** -8.697** -3.628**(1.988) (1.632) (2.324) (2.206) (1.955) (1.631)
WJ-R Letter -6.936** -5.777** -3.858* -5.082** -6.449** -5.348**(1.936) (1.765) (2.200) (2.340) (1.916) (1.783)
WJ-R Passage -5.770** -3.795** -4.413** -3.579* -5.285** -3.289**(1.861) (1.623) (2.065) (2.103) (1.833) (1.625)
B. Externalizing BehaviorOwn Sibling Own Sibling Own Sibling
Grade Repetition 0.150** 0.0349* 0.149** 0.0580** 0.146** 0.0314(0.0248) (0.0201) (0.0308) (0.0266) (0.0251) (0.0209)
WJ-R Applied -6.381** -3.791** -5.612** -2.571** -5.809** -3.439**(1.026) (0.970) (1.211) (1.200) (1.026) (0.958)
WJ-R Letter -6.700** -3.569** -4.992** -2.781** -6.026** -3.026**(1.201) (1.089) (1.489) (1.315) (1.243) (1.087)
WJ-R Passage -6.718** -1.931** -5.200** -1.220 -5.803** -1.151(1.092) (0.914) (1.318) (1.127) (1.133) (0.913)
Notes: Standard errors in parentheses are robust to within-family correlation. Baseline correlation.
Baseline controls include wave indicators, age, gender, race, maternal education, birth order, and
high-risk birth. Expanded or ”Full” family controls additionally include mother’s marital status at
time of first birth, urbancity at time of birth, parental family background (poor, not poor), average
average family income prior to birth of first child, parental history of childhood psychological or
emotional problems, and primary caregiver’s religion. Potential family mediators include family
income, family size, and family structure. To be included in the regression sample, a sibling pair
must satisfy one of three conditions: the target child has condition of interest, the sibling has
the condition of interest, or both members of the pair are healthy.
* p < 0.10, ** p < 0.05
32
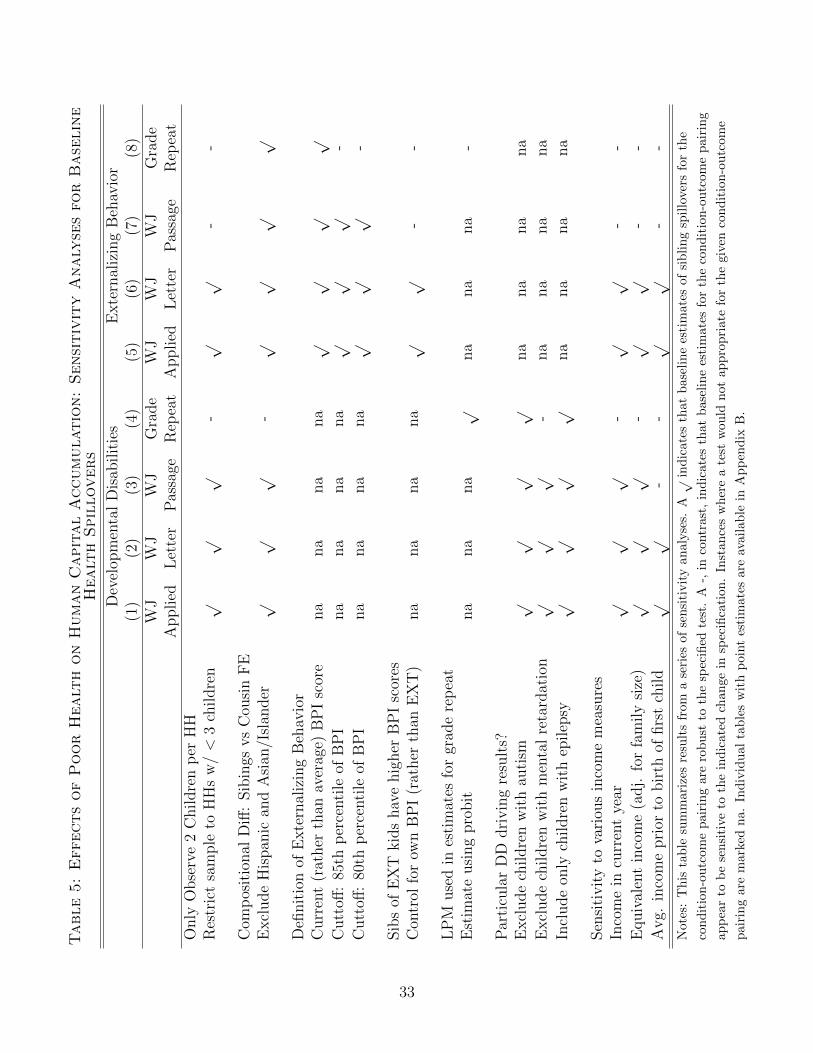
Table5:EffectsofPoorHealt
honHumanCapitalAccumulation:SensitivityAnaly
sesforBase
line
Healt
hSpillovers
Dev
elop
men
tal
Dis
abilit
ies
Exte
rnal
izin
gB
ehav
ior
(1)
(2)
(3)
(4)
(5)
(6)
(7)
(8)
WJ
WJ
WJ
Gra
de
WJ
WJ
WJ
Gra
de
Applied
Let
ter
Pas
sage
Rep
eat
Applied
Let
ter
Pas
sage
Rep
eat
Only
Obse
rve
2C
hildre
np
erH
HR
estr
ict
sam
ple
toH
Hs
w/<
3ch
ildre
n√
√√
-√
√-
-
Com
pos
itio
nal
Diff
:Sib
ings
vs
Cou
sin
FE
Excl
ude
His
pan
ican
dA
sian
/Isl
ander
√√
√-
√√
√√
Defi
nit
ion
ofE
xte
rnal
izin
gB
ehav
ior
Curr
ent
(rat
her
than
aver
age)
BP
Isc
ore
na
na
na
na
√√
√√
Cutt
off:
85th
per
centi
leof
BP
Ina
na
na
na
√√
√-
Cutt
off:
80th
per
centi
leof
BP
Ina
na
na
na
√√
√-
Sib
sof
EX
Tkid
shav
ehig
her
BP
Isc
ores
Con
trol
for
own
BP
I(r
ather
than
EX
T)
na
na
na
na
√√
--
LP
Muse
din
esti
mat
esfo
rgr
ade
rep
eat
Est
imat
eusi
ng
pro
bit
na
na
na
√na
na
na
-
Par
ticu
lar
DD
dri
vin
gre
sult
s?E
xcl
ude
childre
nw
ith
auti
sm√
√√
√na
na
na
na
Excl
ude
childre
nw
ith
men
tal
reta
rdat
ion
√√
√-
na
na
na
na
Incl
ude
only
childre
nw
ith
epilep
sy√
√√
√na
na
na
na
Sen
siti
vit
yto
vari
ous
inco
me
mea
sure
sIn
com
ein
curr
ent
year
√√
√-
√√
--
Equiv
alen
tin
com
e(a
dj.
for
fam
ily
size
)√
√√
-√
√-
-
Avg.
inco
me
pri
orto
bir
thof
firs
tch
ild
√√
--
√√
--
Not
es:
This
tab
lesu
mm
ariz
esre
sult
sfr
oma
seri
esof
sensi
tivit
yan
alyse
s.A√
ind
icat
esth
atb
asel
ine
esti
mat
esof
sib
lin
gsp
illo
vers
for
the
con
dit
ion
-ou
tcom
ep
airi
ng
are
rob
ust
toth
esp
ecifi
edte
st.
A-,
inco
ntr
ast,
ind
icat
esth
atb
asel
ine
esti
mat
esfo
rth
eco
nd
itio
n-o
utc
ome
pair
ing
app
ear
tob
ese
nsi
tive
toth
ein
dic
ated
chan
gein
spec
ifica
tion
.In
stan
ces
wh
ere
ate
stw
ould
not
app
rop
riat
efo
rth
egi
ven
con
dit
ion
-ou
tcom
e
pai
rin
gar
em
arke
dn
a.In
div
idu
al
tab
les
wit
hp
oint
esti
mat
esar
eav
aila
ble
inA
pp
end
ixB
.
33
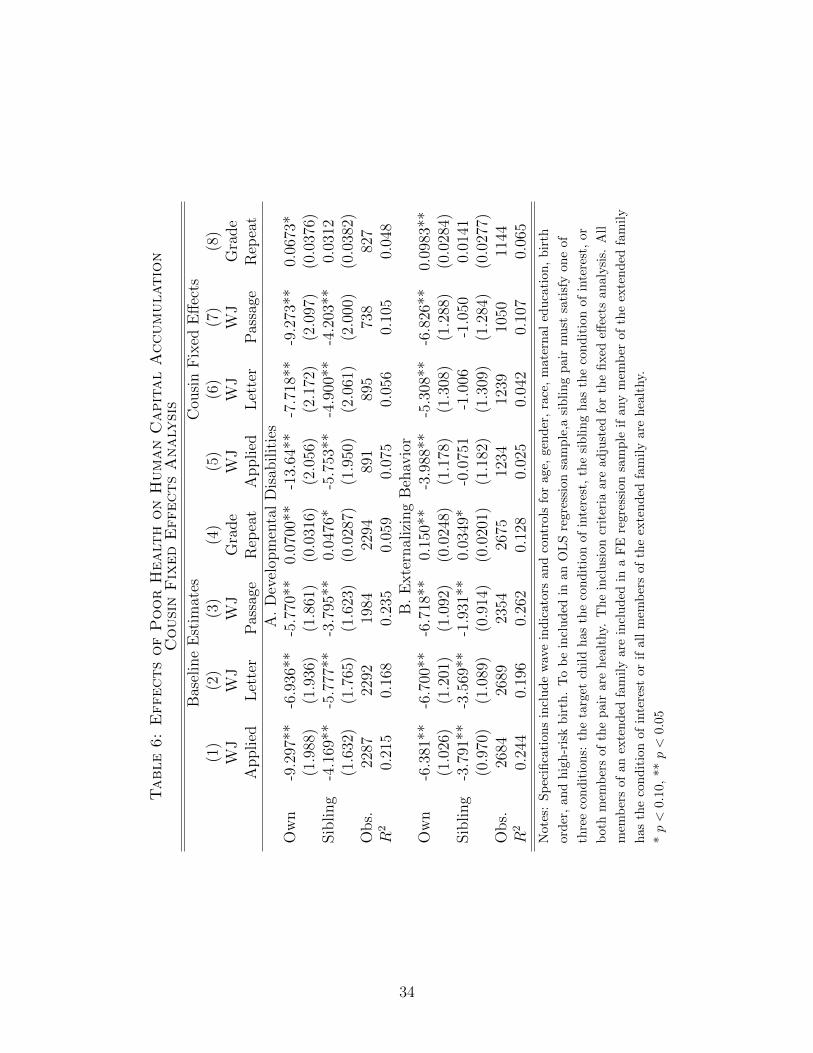
Table6:EffectsofPoorHealt
honHumanCapitalAccumulation
CousinFixed
EffectsAnaly
sis
Bas
elin
eE
stim
ates
Cou
sin
Fix
edE
ffec
ts(1
)(2
)(3
)(4
)(5
)(6
)(7
)(8
)W
JW
JW
JG
rade
WJ
WJ
WJ
Gra
de
Applied
Let
ter
Pas
sage
Rep
eat
Applied
Let
ter
Pas
sage
Rep
eat
A.
Dev
elop
men
tal
Dis
abilit
ies
Ow
n-9
.297
**-6
.936
**-5
.770
**0.
0700
**-1
3.64
**-7
.718
**-9
.273
**0.
0673
*(1
.988
)(1
.936
)(1
.861
)(0
.031
6)(2
.056
)(2
.172
)(2
.097
)(0
.037
6)Sib
ling
-4.1
69**
-5.7
77**
-3.7
95**
0.04
76*
-5.7
53**
-4.9
00**
-4.2
03**
0.03
12(1
.632
)(1
.765
)(1
.623
)(0
.028
7)(1
.950
)(2
.061
)(2
.000
)(0
.038
2)O
bs.
2287
2292
1984
2294
891
895
738
827
R2
0.21
50.
168
0.23
50.
059
0.07
50.
056
0.10
50.
048
B.
Exte
rnal
izin
gB
ehav
ior
Ow
n-6
.381
**-6
.700
**-6
.718
**0.
150*
*-3
.988
**-5
.308
**-6
.826
**0.
0983
**(1
.026
)(1
.201
)(1
.092
)(0
.024
8)(1
.178
)(1
.308
)(1
.288
)(0
.028
4)Sib
ling
-3.7
91**
-3.5
69**
-1.9
31**
0.03
49*
-0.0
751
-1.0
06-1
.050
0.01
41(0
.970
)(1
.089
)(0
.914
)(0
.020
1)(1
.182
)(1
.309
)(1
.284
)(0
.027
7)O
bs.
2684
2689
2354
2675
1234
1239
1050
1144
R2
0.24
40.
196
0.26
20.
128
0.02
50.
042
0.10
70.
065
Not
es:
Sp
ecifi
cati
on
sin
clu
de
wav
ein
dic
ator
san
dco
ntr
ols
for
age,
gen
der
,ra
ce,
mat
ern
aled
uca
tion
,b
irth
ord
er,
an
dhig
h-r
isk
bir
th.
To
be
incl
ud
edin
anO
LS
regr
essi
onsa
mp
le,a
sib
lin
gp
air
mu
stsa
tisf
yon
eof
thre
eco
nd
itio
ns:
the
targ
etch
ild
has
the
con
dit
ion
ofin
tere
st,
the
sib
lin
gh
asth
eco
nd
itio
nof
inte
rest
,or
both
mem
ber
sof
the
pai
rare
hea
lthy.
Th
ein
clu
sion
crit
eria
are
adju
sted
for
the
fixed
effec
tsan
alysi
s.A
ll
mem
ber
sof
anex
ten
ded
fam
ily
are
incl
ud
edin
aF
Ere
gres
sion
sam
ple
ifan
ym
emb
erof
the
exte
nd
edfa
mil
y
has
the
con
dit
ion
of
inte
rest
orif
all
mem
ber
sof
the
exte
nd
edfa
mil
yar
eh
ealt
hy.
*p<
0.10
,**
p<
0.05
34
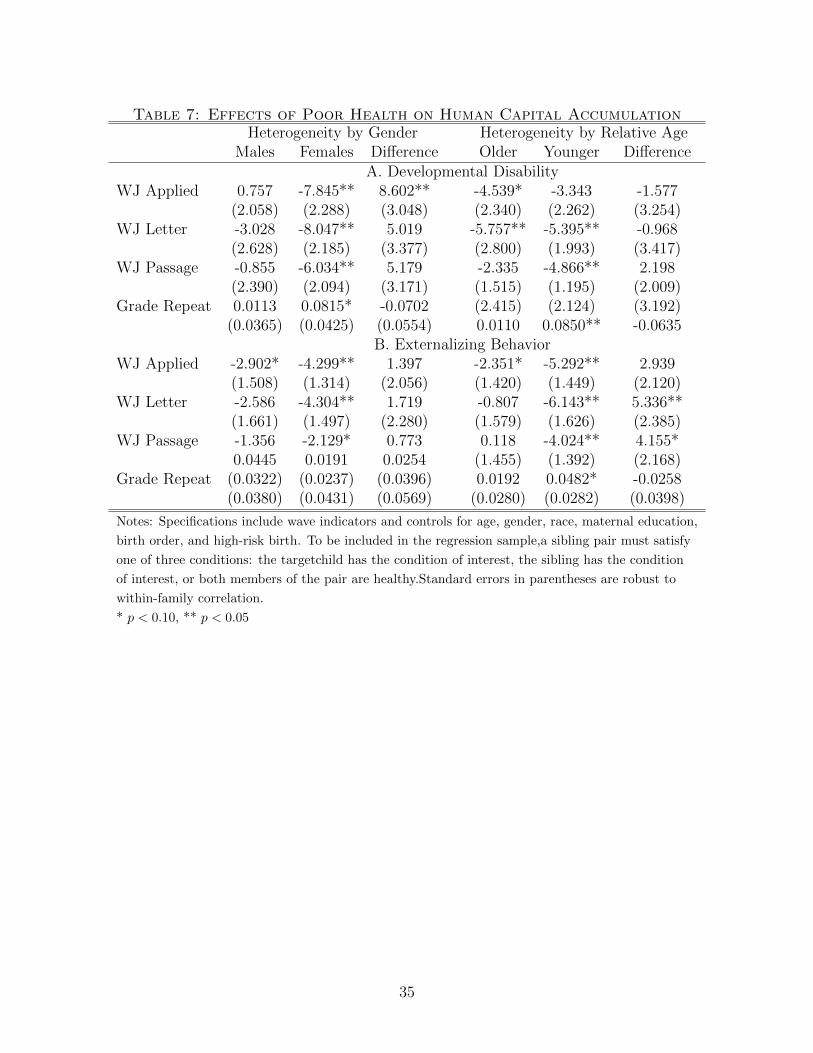
Table 7: Effects of Poor Health on Human Capital AccumulationHeterogeneity by Gender Heterogeneity by Relative Age
Males Females Difference Older Younger DifferenceA. Developmental Disability
WJ Applied 0.757 -7.845** 8.602** -4.539* -3.343 -1.577(2.058) (2.288) (3.048) (2.340) (2.262) (3.254)
WJ Letter -3.028 -8.047** 5.019 -5.757** -5.395** -0.968(2.628) (2.185) (3.377) (2.800) (1.993) (3.417)
WJ Passage -0.855 -6.034** 5.179 -2.335 -4.866** 2.198(2.390) (2.094) (3.171) (1.515) (1.195) (2.009)
Grade Repeat 0.0113 0.0815* -0.0702 (2.415) (2.124) (3.192)(0.0365) (0.0425) (0.0554) 0.0110 0.0850** -0.0635
B. Externalizing BehaviorWJ Applied -2.902* -4.299** 1.397 -2.351* -5.292** 2.939
(1.508) (1.314) (2.056) (1.420) (1.449) (2.120)WJ Letter -2.586 -4.304** 1.719 -0.807 -6.143** 5.336**
(1.661) (1.497) (2.280) (1.579) (1.626) (2.385)WJ Passage -1.356 -2.129* 0.773 0.118 -4.024** 4.155*
0.0445 0.0191 0.0254 (1.455) (1.392) (2.168)Grade Repeat (0.0322) (0.0237) (0.0396) 0.0192 0.0482* -0.0258
(0.0380) (0.0431) (0.0569) (0.0280) (0.0282) (0.0398)
Notes: Specifications include wave indicators and controls for age, gender, race, maternal education,
birth order, and high-risk birth. To be included in the regression sample,a sibling pair must satisfy
one of three conditions: the targetchild has the condition of interest, the sibling has the condition
of interest, or both members of the pair are healthy.Standard errors in parentheses are robust to
within-family correlation.
* p < 0.10, ** p < 0.05
35
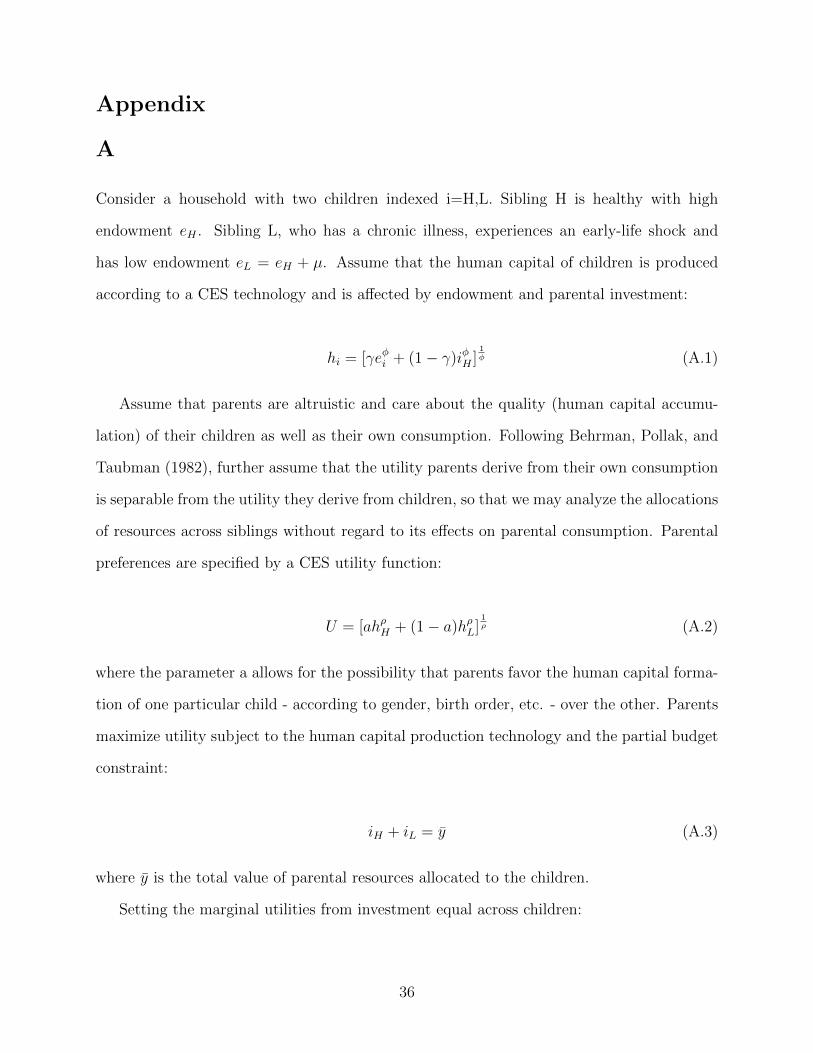
Appendix
A
Consider a household with two children indexed i=H,L. Sibling H is healthy with high
endowment eH . Sibling L, who has a chronic illness, experiences an early-life shock and
has low endowment eL = eH + µ. Assume that the human capital of children is produced
according to a CES technology and is affected by endowment and parental investment:
hi = [γeφi + (1− γ)iφH ]1φ (A.1)
Assume that parents are altruistic and care about the quality (human capital accumu-
lation) of their children as well as their own consumption. Following Behrman, Pollak, and
Taubman (1982), further assume that the utility parents derive from their own consumption
is separable from the utility they derive from children, so that we may analyze the allocations
of resources across siblings without regard to its effects on parental consumption. Parental
preferences are specified by a CES utility function:
U = [ahρH + (1− a)hρL]1ρ (A.2)
where the parameter a allows for the possibility that parents favor the human capital forma-
tion of one particular child - according to gender, birth order, etc. - over the other. Parents
maximize utility subject to the human capital production technology and the partial budget
constraint:
iH + iL = y (A.3)
where y is the total value of parental resources allocated to the children.
Setting the marginal utilities from investment equal across children:
36
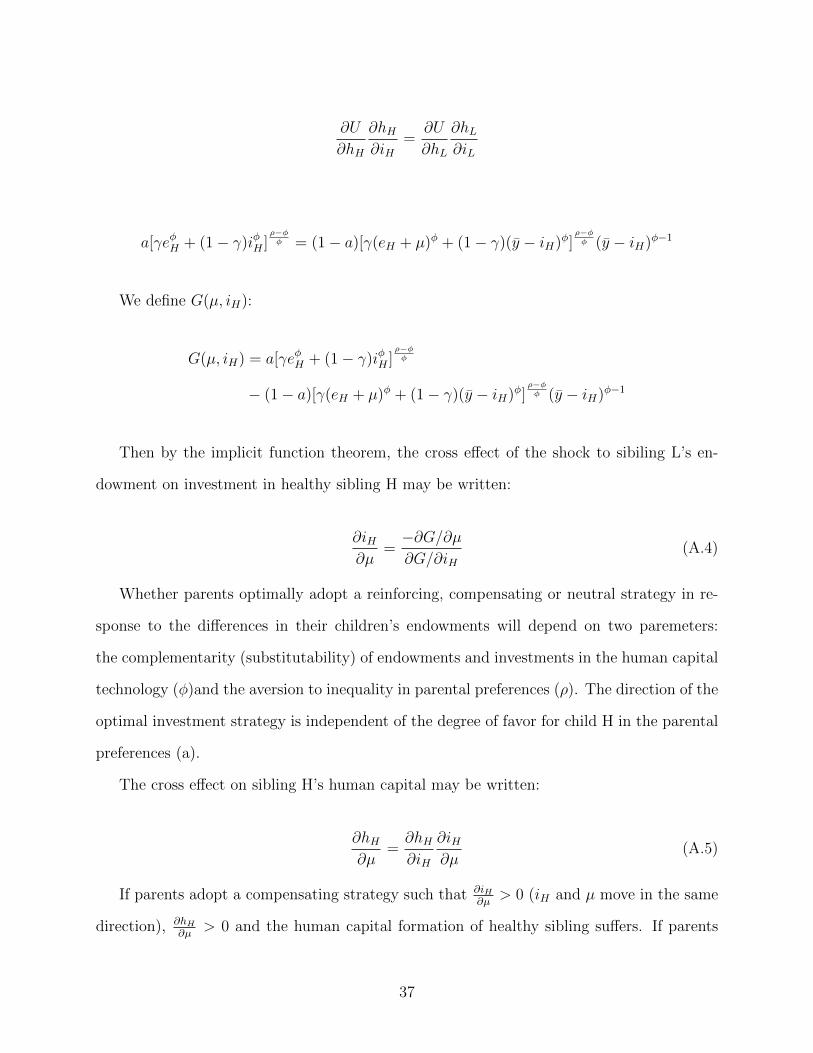
∂U
∂hH
∂hH∂iH
=∂U
∂hL
∂hL∂iL
a[γeφH + (1− γ)iφH ]ρ−φφ = (1− a)[γ(eH + µ)φ + (1− γ)(y − iH)φ]
ρ−φφ (y − iH)φ−1
We define G(µ, iH):
G(µ, iH) = a[γeφH + (1− γ)iφH ]ρ−φφ
− (1− a)[γ(eH + µ)φ + (1− γ)(y − iH)φ]ρ−φφ (y − iH)φ−1
Then by the implicit function theorem, the cross effect of the shock to sibiling L’s en-
dowment on investment in healthy sibling H may be written:
∂iH∂µ
=−∂G/∂µ∂G/∂iH
(A.4)
Whether parents optimally adopt a reinforcing, compensating or neutral strategy in re-
sponse to the differences in their children’s endowments will depend on two paremeters:
the complementarity (substitutability) of endowments and investments in the human capital
technology (φ)and the aversion to inequality in parental preferences (ρ). The direction of the
optimal investment strategy is independent of the degree of favor for child H in the parental
preferences (a).
The cross effect on sibling H’s human capital may be written:
∂hH∂µ
=∂hH∂iH
∂iH∂µ
(A.5)
If parents adopt a compensating strategy such that ∂iH∂µ
> 0 (iH and µ move in the same
direction), ∂hH∂µ
> 0 and the human capital formation of healthy sibling suffers. If parents
37
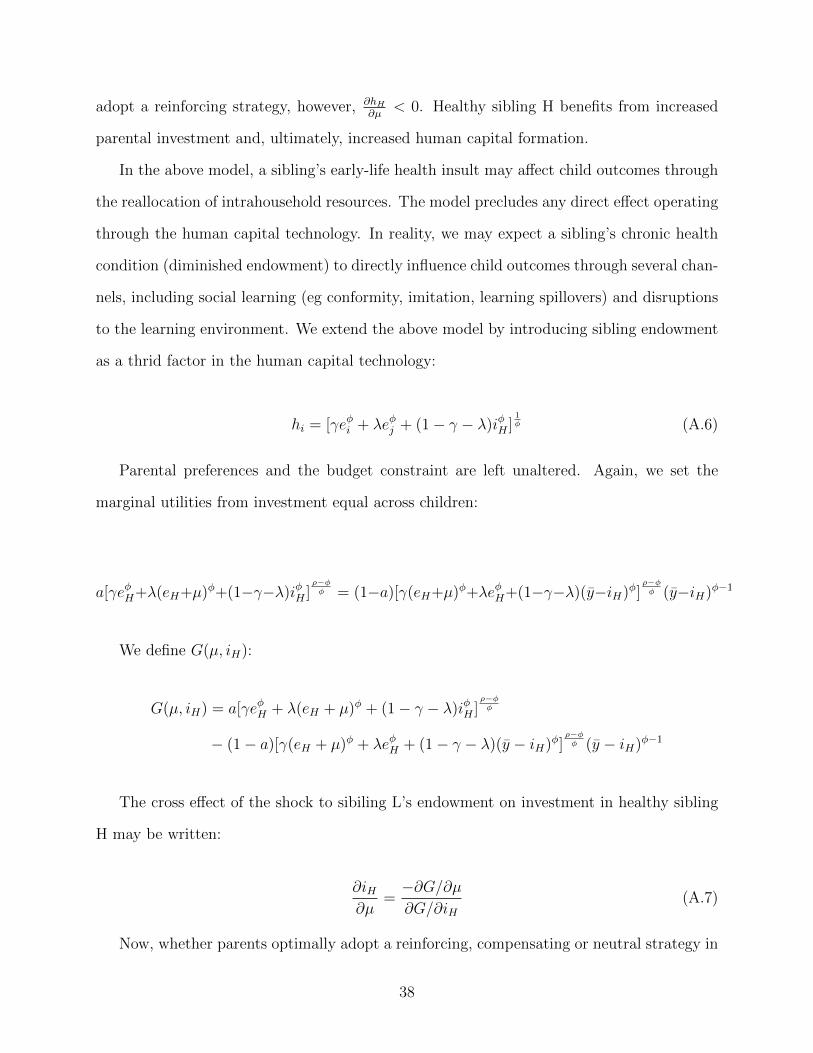
adopt a reinforcing strategy, however, ∂hH∂µ
< 0. Healthy sibling H benefits from increased
parental investment and, ultimately, increased human capital formation.
In the above model, a sibling’s early-life health insult may affect child outcomes through
the reallocation of intrahousehold resources. The model precludes any direct effect operating
through the human capital technology. In reality, we may expect a sibling’s chronic health
condition (diminished endowment) to directly influence child outcomes through several chan-
nels, including social learning (eg conformity, imitation, learning spillovers) and disruptions
to the learning environment. We extend the above model by introducing sibling endowment
as a thrid factor in the human capital technology:
hi = [γeφi + λeφj + (1− γ − λ)iφH ]1φ (A.6)
Parental preferences and the budget constraint are left unaltered. Again, we set the
marginal utilities from investment equal across children:
a[γeφH+λ(eH+µ)φ+(1−γ−λ)iφH ]ρ−φφ = (1−a)[γ(eH+µ)φ+λeφH+(1−γ−λ)(y−iH)φ]
ρ−φφ (y−iH)φ−1
We define G(µ, iH):
G(µ, iH) = a[γeφH + λ(eH + µ)φ + (1− γ − λ)iφH ]ρ−φφ
− (1− a)[γ(eH + µ)φ + λeφH + (1− γ − λ)(y − iH)φ]ρ−φφ (y − iH)φ−1
The cross effect of the shock to sibiling L’s endowment on investment in healthy sibling
H may be written:
∂iH∂µ
=−∂G/∂µ∂G/∂iH
(A.7)
Now, whether parents optimally adopt a reinforcing, compensating or neutral strategy in
38
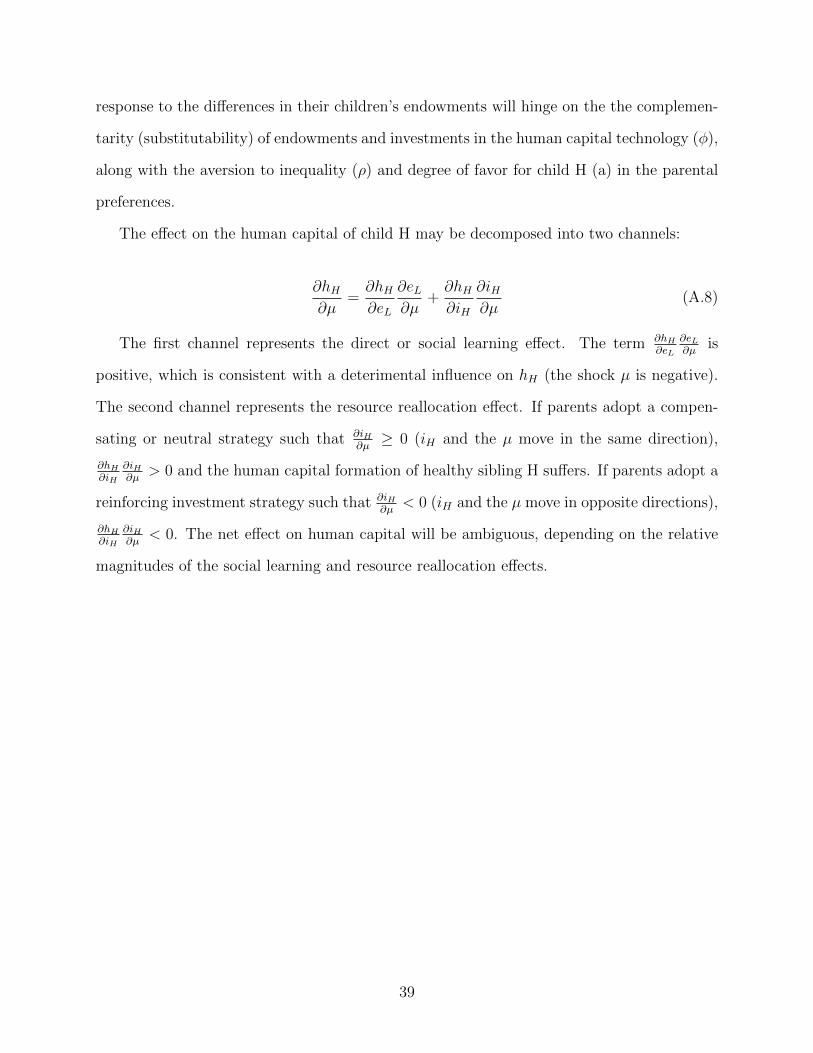
response to the differences in their children’s endowments will hinge on the the complemen-
tarity (substitutability) of endowments and investments in the human capital technology (φ),
along with the aversion to inequality (ρ) and degree of favor for child H (a) in the parental
preferences.
The effect on the human capital of child H may be decomposed into two channels:
∂hH∂µ
=∂hH∂eL
∂eL∂µ
+∂hH∂iH
∂iH∂µ
(A.8)
The first channel represents the direct or social learning effect. The term ∂hH∂eL
∂eL∂µ
is
positive, which is consistent with a deterimental influence on hH (the shock µ is negative).
The second channel represents the resource reallocation effect. If parents adopt a compen-
sating or neutral strategy such that ∂iH∂µ≥ 0 (iH and the µ move in the same direction),
∂hH∂iH
∂iH∂µ
> 0 and the human capital formation of healthy sibling H suffers. If parents adopt a
reinforcing investment strategy such that ∂iH∂µ
< 0 (iH and the µ move in opposite directions),
∂hH∂iH
∂iH∂µ
< 0. The net effect on human capital will be ambiguous, depending on the relative
magnitudes of the social learning and resource reallocation effects.
39
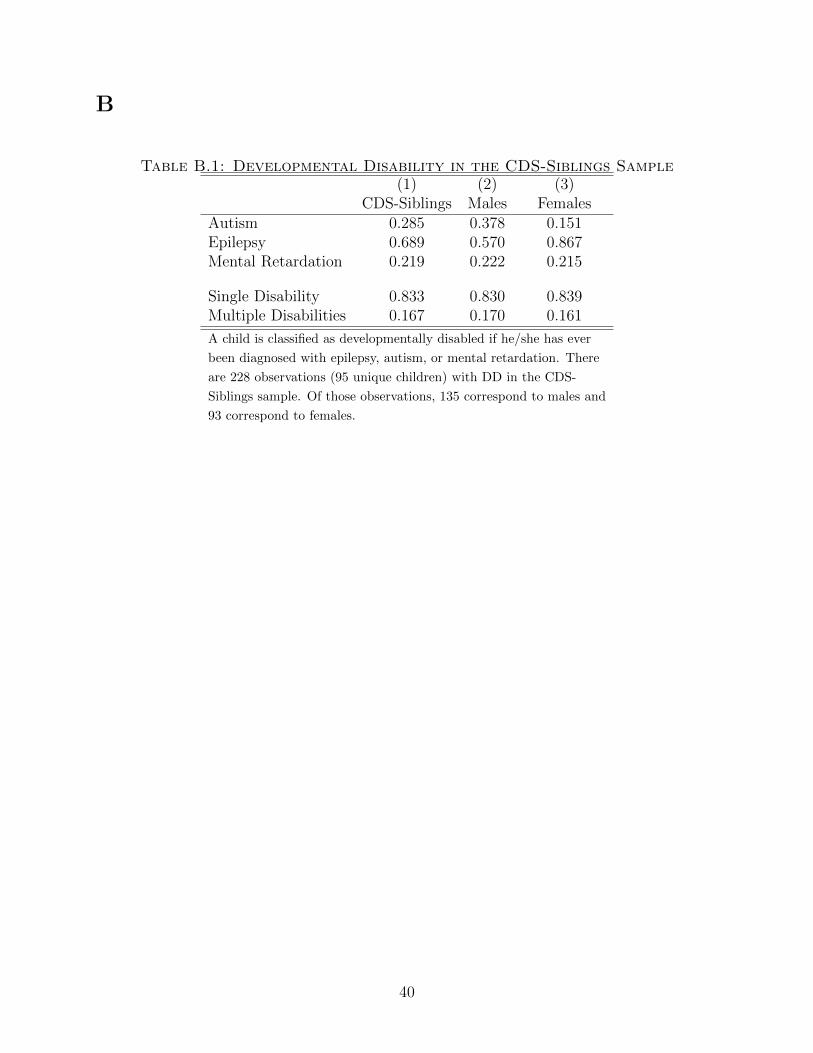
B
Table B.1: Developmental Disability in the CDS-Siblings Sample(1) (2) (3)
CDS-Siblings Males FemalesAutism 0.285 0.378 0.151Epilepsy 0.689 0.570 0.867Mental Retardation 0.219 0.222 0.215
Single Disability 0.833 0.830 0.839Multiple Disabilities 0.167 0.170 0.161
A child is classified as developmentally disabled if he/she has ever
been diagnosed with epilepsy, autism, or mental retardation. There
are 228 observations (95 unique children) with DD in the CDS-
Siblings sample. Of those observations, 135 correspond to males and
93 correspond to females.
40
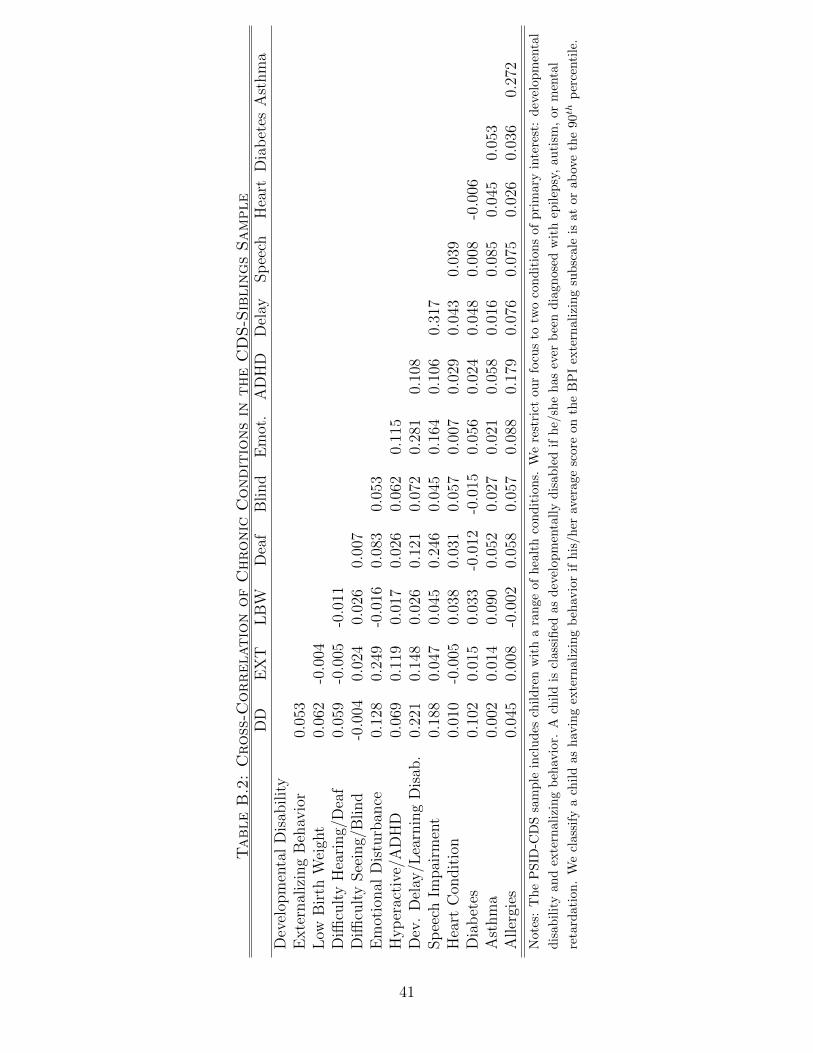
TableB.2:Cross-C
orrelationofChronic
Conditionsin
theCDS-SiblingsSample
DD
EX
TL
BW
Dea
fB
lind
Em
ot.
AD
HD
Del
aySp
eech
Hea
rtD
iab
etes
Ast
hm
aD
evel
opm
enta
lD
isab
ilit
yE
xte
rnal
izin
gB
ehav
ior
0.05
3L
owB
irth
Wei
ght
0.06
2-0
.004
Diffi
cult
yH
eari
ng/
Dea
f0.
059
-0.0
05-0
.011
Diffi
cult
ySee
ing/
Blind
-0.0
040.
024
0.02
60.
007
Em
otio
nal
Dis
turb
ance
0.12
80.
249
-0.0
160.
083
0.05
3H
yp
erac
tive
/AD
HD
0.06
90.
119
0.01
70.
026
0.06
20.
115
Dev
.D
elay
/Lea
rnin
gD
isab
.0.
221
0.14
80.
026
0.12
10.
072
0.28
10.
108
Sp
eech
Impai
rmen
t0.
188
0.04
70.
045
0.24
60.
045
0.16
40.
106
0.31
7H
eart
Con
dit
ion
0.01
0-0
.005
0.03
80.
031
0.05
70.
007
0.02
90.
043
0.03
9D
iab
etes
0.10
20.
015
0.03
3-0
.012
-0.0
150.
056
0.02
40.
048
0.00
8-0
.006
Ast
hm
a0.
002
0.01
40.
090
0.05
20.
027
0.02
10.
058
0.01
60.
085
0.04
50.
053
Aller
gies
0.04
50.
008
-0.0
020.
058
0.05
70.
088
0.17
90.
076
0.07
50.
026
0.03
60.
272
Not
es:
Th
eP
SID
-CD
Ssa
mp
lein
clu
des
chil
dre
nw
ith
ara
nge
ofhea
lth
con
dit
ion
s.W
ere
stri
ctou
rfo
cus
totw
oco
nd
itio
ns
ofp
rim
ary
inte
rest
:dev
elop
men
tal
dis
abil
ity
and
exte
rnal
izin
gb
ehav
ior.
Ach
ild
iscl
assi
fied
asd
evel
opm
enta
lly
dis
able
dif
he/
she
has
ever
bee
nd
iagn
osed
wit
hep
ilep
sy,
au
tism
,or
men
tal
reta
rdat
ion
.W
ecl
assi
fya
chil
das
hav
ing
exte
rnal
izin
gb
ehav
ior
ifh
is/h
erav
erag
esc
ore
onth
eB
PI
exte
rnal
izin
gsu
bsc
ale
isat
orab
ove
the
90t
hp
erce
nti
le.
41
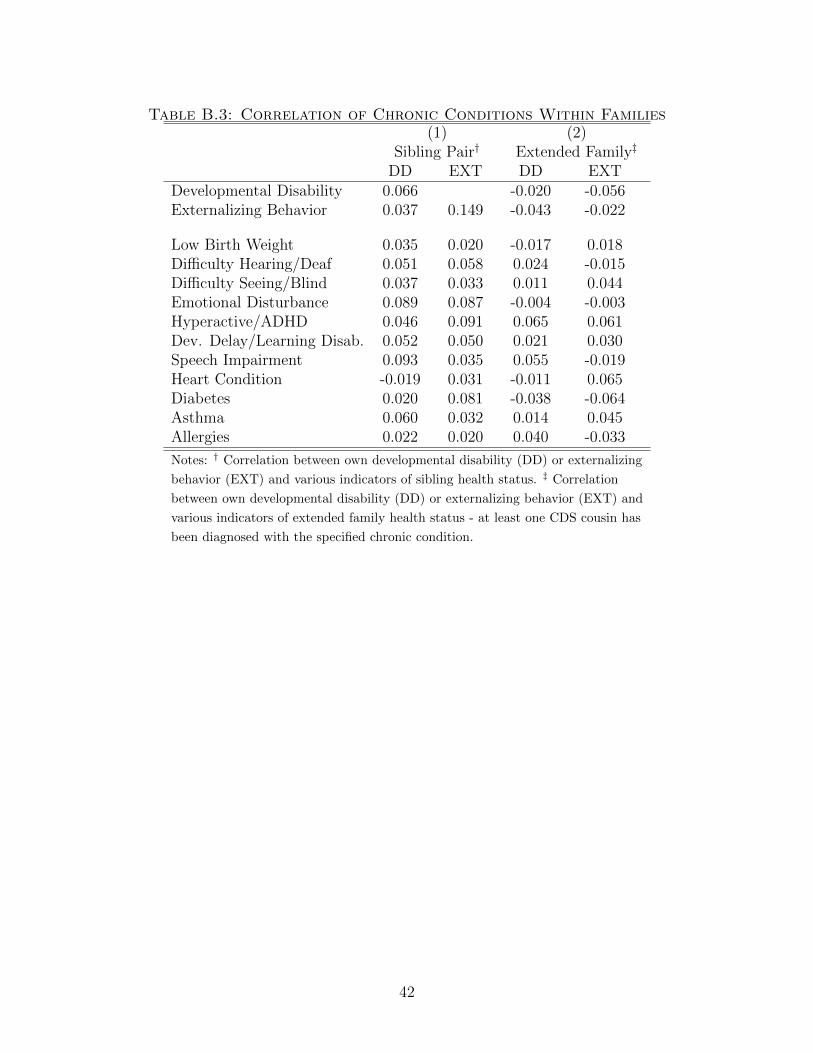
Table B.3: Correlation of Chronic Conditions Within Families(1) (2)
Sibling Pair† Extended Family‡
DD EXT DD EXTDevelopmental Disability 0.066 -0.020 -0.056Externalizing Behavior 0.037 0.149 -0.043 -0.022
Low Birth Weight 0.035 0.020 -0.017 0.018Difficulty Hearing/Deaf 0.051 0.058 0.024 -0.015Difficulty Seeing/Blind 0.037 0.033 0.011 0.044Emotional Disturbance 0.089 0.087 -0.004 -0.003Hyperactive/ADHD 0.046 0.091 0.065 0.061Dev. Delay/Learning Disab. 0.052 0.050 0.021 0.030Speech Impairment 0.093 0.035 0.055 -0.019Heart Condition -0.019 0.031 -0.011 0.065Diabetes 0.020 0.081 -0.038 -0.064Asthma 0.060 0.032 0.014 0.045Allergies 0.022 0.020 0.040 -0.033
Notes: † Correlation between own developmental disability (DD) or externalizing
behavior (EXT) and various indicators of sibling health status. ‡ Correlation
between own developmental disability (DD) or externalizing behavior (EXT) and
various indicators of extended family health status - at least one CDS cousin has
been diagnosed with the specified chronic condition.
42
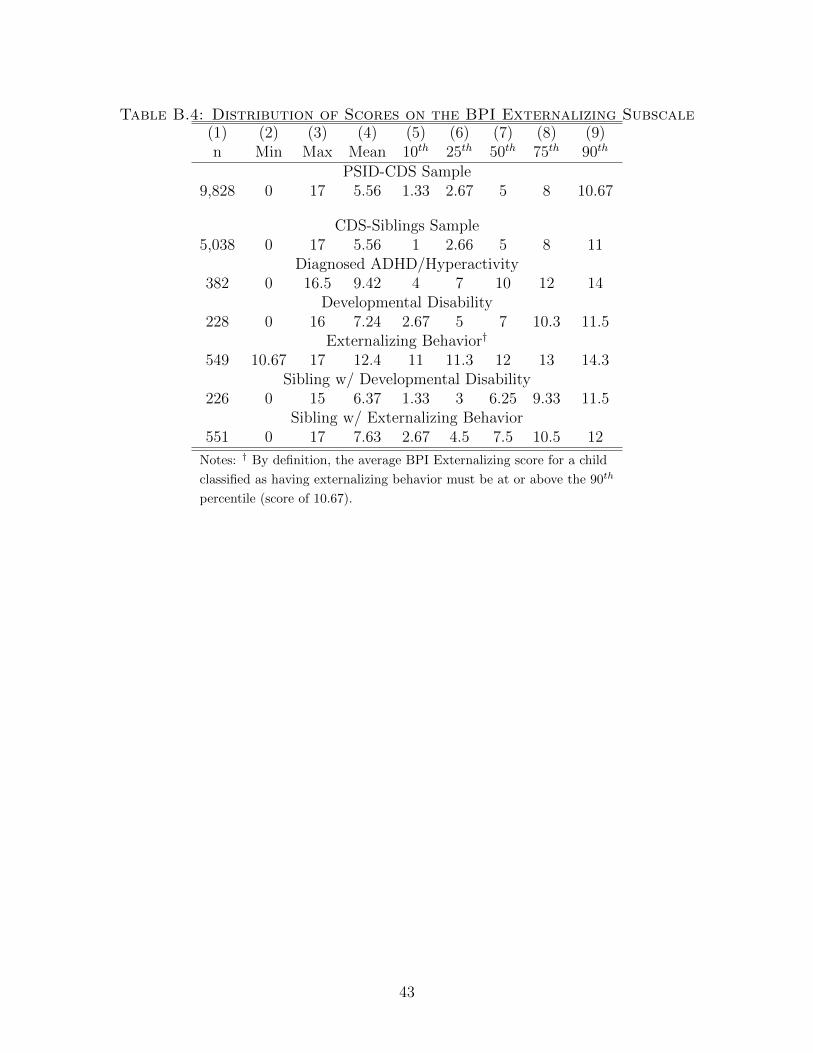
Table B.4: Distribution of Scores on the BPI Externalizing Subscale(1) (2) (3) (4) (5) (6) (7) (8) (9)n Min Max Mean 10th 25th 50th 75th 90th
PSID-CDS Sample9,828 0 17 5.56 1.33 2.67 5 8 10.67
CDS-Siblings Sample5,038 0 17 5.56 1 2.66 5 8 11
Diagnosed ADHD/Hyperactivity382 0 16.5 9.42 4 7 10 12 14
Developmental Disability228 0 16 7.24 2.67 5 7 10.3 11.5
Externalizing Behavior†
549 10.67 17 12.4 11 11.3 12 13 14.3Sibling w/ Developmental Disability
226 0 15 6.37 1.33 3 6.25 9.33 11.5Sibling w/ Externalizing Behavior
551 0 17 7.63 2.67 4.5 7.5 10.5 12
Notes: † By definition, the average BPI Externalizing score for a child
classified as having externalizing behavior must be at or above the 90th
percentile (score of 10.67).
43
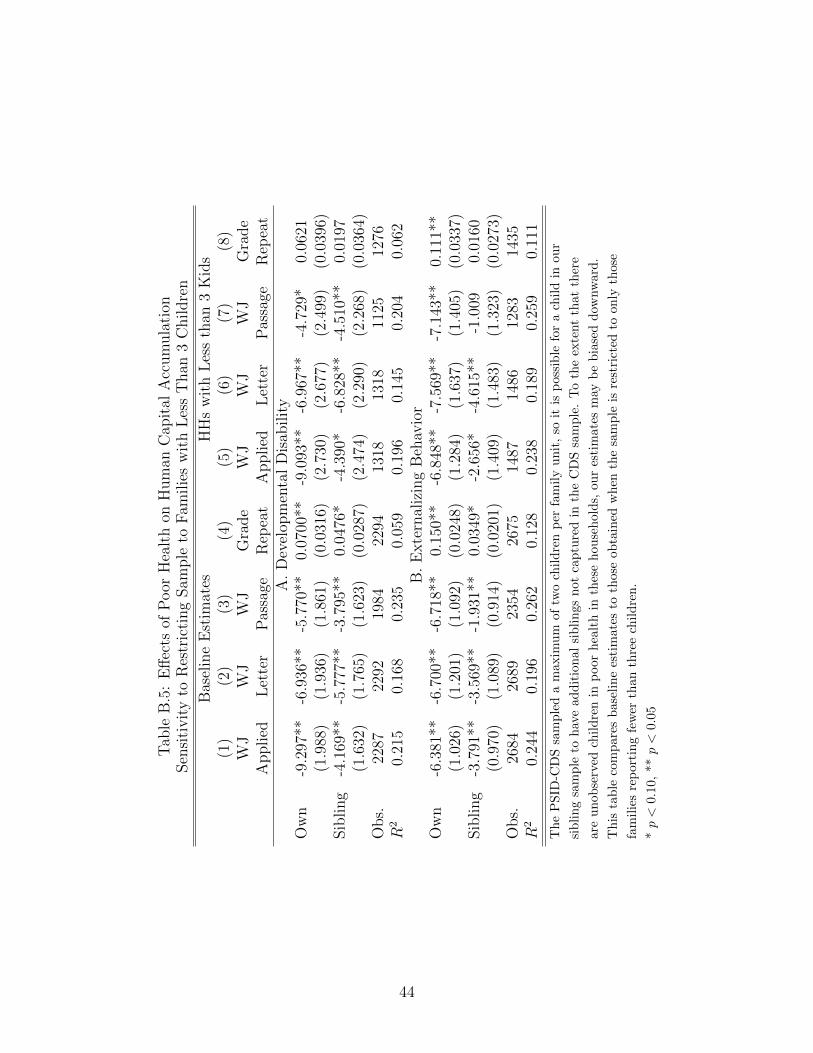
Tab
leB
.5:
Eff
ects
ofP
oor
Hea
lth
onH
um
anC
apit
alA
ccum
ula
tion
Sen
siti
vit
yto
Res
tric
ting
Sam
ple
toF
amilie
sw
ith
Les
sT
han
3C
hildre
n
Bas
elin
eE
stim
ates
HH
sw
ith
Les
sth
an3
Kid
s(1
)(2
)(3
)(4
)(5
)(6
)(7
)(8
)W
JW
JW
JG
rade
WJ
WJ
WJ
Gra
de
Applied
Let
ter
Pas
sage
Rep
eat
Applied
Let
ter
Pas
sage
Rep
eat
A.
Dev
elop
men
tal
Dis
abilit
yO
wn
-9.2
97**
-6.9
36**
-5.7
70**
0.07
00**
-9.0
93**
-6.9
67**
-4.7
29*
0.06
21(1
.988
)(1
.936
)(1
.861
)(0
.031
6)(2
.730
)(2
.677
)(2
.499
)(0
.039
6)Sib
ling
-4.1
69**
-5.7
77**
-3.7
95**
0.04
76*
-4.3
90*
-6.8
28**
-4.5
10**
0.01
97(1
.632
)(1
.765
)(1
.623
)(0
.028
7)(2
.474
)(2
.290
)(2
.268
)(0
.036
4)O
bs.
2287
2292
1984
2294
1318
1318
1125
1276
R2
0.21
50.
168
0.23
50.
059
0.19
60.
145
0.20
40.
062
B.
Exte
rnal
izin
gB
ehav
ior
Ow
n-6
.381
**-6
.700
**-6
.718
**0.
150*
*-6
.848
**-7
.569
**-7
.143
**0.
111*
*(1
.026
)(1
.201
)(1
.092
)(0
.024
8)(1
.284
)(1
.637
)(1
.405
)(0
.033
7)Sib
ling
-3.7
91**
-3.5
69**
-1.9
31**
0.03
49*
-2.6
56*
-4.6
15**
-1.0
090.
0160
(0.9
70)
(1.0
89)
(0.9
14)
(0.0
201)
(1.4
09)
(1.4
83)
(1.3
23)
(0.0
273)
Obs.
2684
2689
2354
2675
1487
1486
1283
1435
R2
0.24
40.
196
0.26
20.
128
0.23
80.
189
0.25
90.
111
Th
eP
SID
-CD
Ssa
mp
led
am
axim
um
oftw
och
ild
ren
per
fam
ily
un
it,
soit
isp
ossi
ble
for
ach
ild
inou
r
sib
lin
gsa
mp
leto
hav
ead
dit
ion
alsi
bli
ngs
not
cap
ture
din
the
CD
Ssa
mp
le.
To
the
exte
nt
that
ther
e
are
un
ob
serv
edch
ild
ren
inp
oor
hea
lth
inth
ese
hou
seh
old
s,ou
res
tim
ates
may
be
bia
sed
dow
nw
ard
.
Th
ista
ble
com
par
esb
asel
ine
esti
mat
esto
thos
eob
tain
edw
hen
the
sam
ple
isre
stri
cted
toon
lyth
ose
fam
ilie
sre
port
ing
few
erth
an
thre
ech
ild
ren
.
*p<
0.10,
**p<
0.05
44
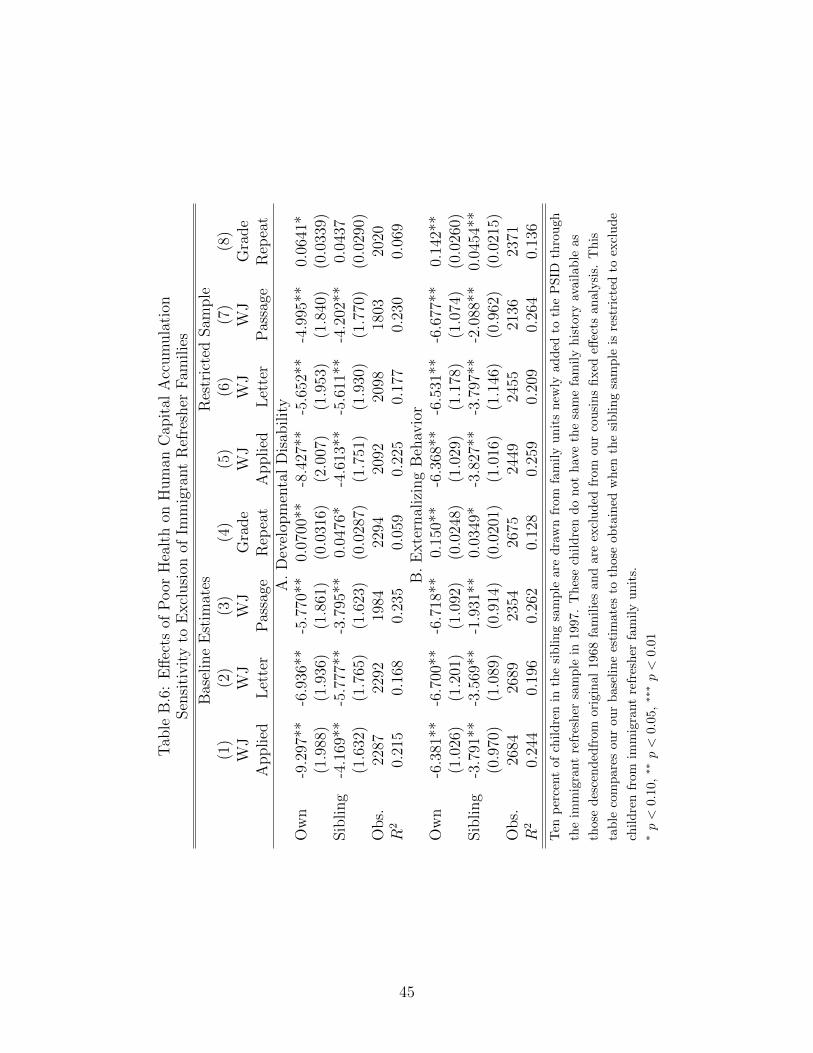
Tab
leB
.6:
Eff
ects
ofP
oor
Hea
lth
onH
um
anC
apit
alA
ccum
ula
tion
Sen
siti
vit
yto
Excl
usi
onof
Imm
igra
nt
Ref
resh
erF
amilie
s
Bas
elin
eE
stim
ates
Res
tric
ted
Sam
ple
(1)
(2)
(3)
(4)
(5)
(6)
(7)
(8)
WJ
WJ
WJ
Gra
de
WJ
WJ
WJ
Gra
de
Applied
Let
ter
Pas
sage
Rep
eat
Applied
Let
ter
Pas
sage
Rep
eat
A.
Dev
elop
men
tal
Dis
abilit
yO
wn
-9.2
97**
-6.9
36**
-5.7
70**
0.07
00**
-8.4
27**
-5.6
52**
-4.9
95**
0.06
41*
(1.9
88)
(1.9
36)
(1.8
61)
(0.0
316)
(2.0
07)
(1.9
53)
(1.8
40)
(0.0
339)
Sib
ling
-4.1
69**
-5.7
77**
-3.7
95**
0.04
76*
-4.6
13**
-5.6
11**
-4.2
02**
0.04
37(1
.632
)(1
.765
)(1
.623
)(0
.028
7)(1
.751
)(1
.930
)(1
.770
)(0
.029
0)O
bs.
2287
2292
1984
2294
2092
2098
1803
2020
R2
0.21
50.
168
0.23
50.
059
0.22
50.
177
0.23
00.
069
B.
Exte
rnal
izin
gB
ehav
ior
Ow
n-6
.381
**-6
.700
**-6
.718
**0.
150*
*-6
.368
**-6
.531
**-6
.677
**0.
142*
*(1
.026
)(1
.201
)(1
.092
)(0
.024
8)(1
.029
)(1
.178
)(1
.074
)(0
.026
0)Sib
ling
-3.7
91**
-3.5
69**
-1.9
31**
0.03
49*
-3.8
27**
-3.7
97**
-2.0
88**
0.04
54**
(0.9
70)
(1.0
89)
(0.9
14)
(0.0
201)
(1.0
16)
(1.1
46)
(0.9
62)
(0.0
215)
Obs.
2684
2689
2354
2675
2449
2455
2136
2371
R2
0.24
40.
196
0.26
20.
128
0.25
90.
209
0.26
40.
136
Ten
per
cent
of
chil
dre
nin
the
sib
lin
gsa
mp
lear
ed
raw
nfr
omfa
mily
un
its
new
lyad
ded
toth
eP
SID
thro
ugh
the
imm
igra
nt
refr
esh
ersa
mp
lein
1997
.T
hes
ech
ild
ren
do
not
hav
eth
esa
me
fam
ily
his
tory
avai
lable
as
thos
ed
esce
nd
edfr
omor
igin
al19
68fa
mil
ies
and
are
excl
ud
edfr
omou
rco
usi
ns
fixed
effec
tsan
alysi
s.T
his
tab
leco
mp
ares
our
our
bas
elin
ees
tim
ates
toth
ose
obta
ined
wh
enth
esi
bli
ng
sam
ple
isre
stri
cted
toex
clud
e
chil
dre
nfr
omim
mig
rant
refr
esh
erfa
mil
yu
nit
s.∗p<
0.10
,∗∗
p<
0.05
,∗∗∗p<
0.01
45
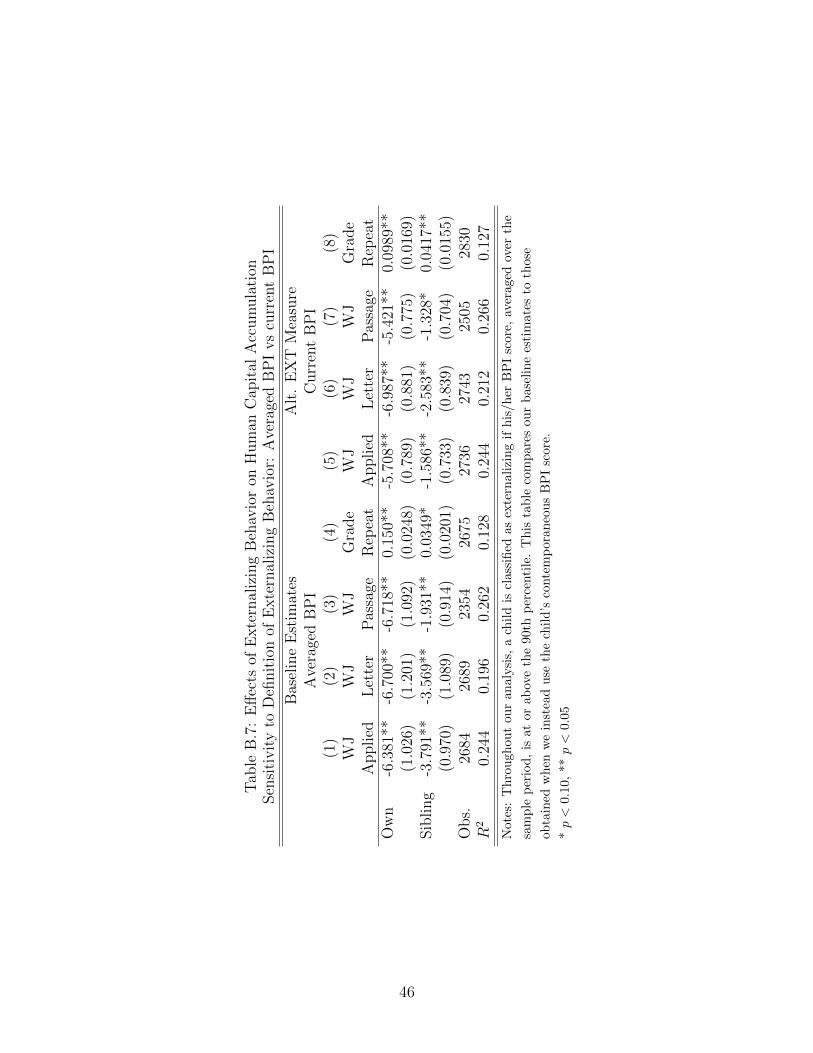
Tab
leB
.7:
Eff
ects
ofE
xte
rnal
izin
gB
ehav
ior
onH
um
anC
apit
alA
ccum
ula
tion
Sen
siti
vit
yto
Defi
nit
ion
ofE
xte
rnal
izin
gB
ehav
ior:
Ave
rage
dB
PI
vs
curr
ent
BP
I
Bas
elin
eE
stim
ates
Alt
.E
XT
Mea
sure
Ave
rage
dB
PI
Curr
ent
BP
I(1
)(2
)(3
)(4
)(5
)(6
)(7
)(8
)W
JW
JW
JG
rade
WJ
WJ
WJ
Gra
de
Applied
Let
ter
Pas
sage
Rep
eat
Applied
Let
ter
Pas
sage
Rep
eat
Ow
n-6
.381
**-6
.700
**-6
.718
**0.
150*
*-5
.708
**-6
.987
**-5
.421
**0.
0989
**(1
.026
)(1
.201
)(1
.092
)(0
.024
8)(0
.789
)(0
.881
)(0
.775
)(0
.016
9)Sib
ling
-3.7
91**
-3.5
69**
-1.9
31**
0.03
49*
-1.5
86**
-2.5
83**
-1.3
28*
0.04
17**
(0.9
70)
(1.0
89)
(0.9
14)
(0.0
201)
(0.7
33)
(0.8
39)
(0.7
04)
(0.0
155)
Obs.
2684
2689
2354
2675
2736
2743
2505
2830
R2
0.24
40.
196
0.26
20.
128
0.24
40.
212
0.26
60.
127
Not
es:
Thro
ugh
out
our
an
alysi
s,a
chil
dis
clas
sifi
edas
exte
rnal
izin
gif
his
/her
BP
Isc
ore,
aver
aged
over
the
sam
ple
per
iod
,is
ator
abov
eth
e90
thp
erce
nti
le.
Th
ista
ble
com
par
esou
rb
asel
ine
esti
mat
esto
thos
e
obta
ined
wh
enw
ein
stea
du
seth
ech
ild
’sco
nte
mp
oran
eou
sB
PI
scor
e.
*p<
0.10,
**p<
0.05
46
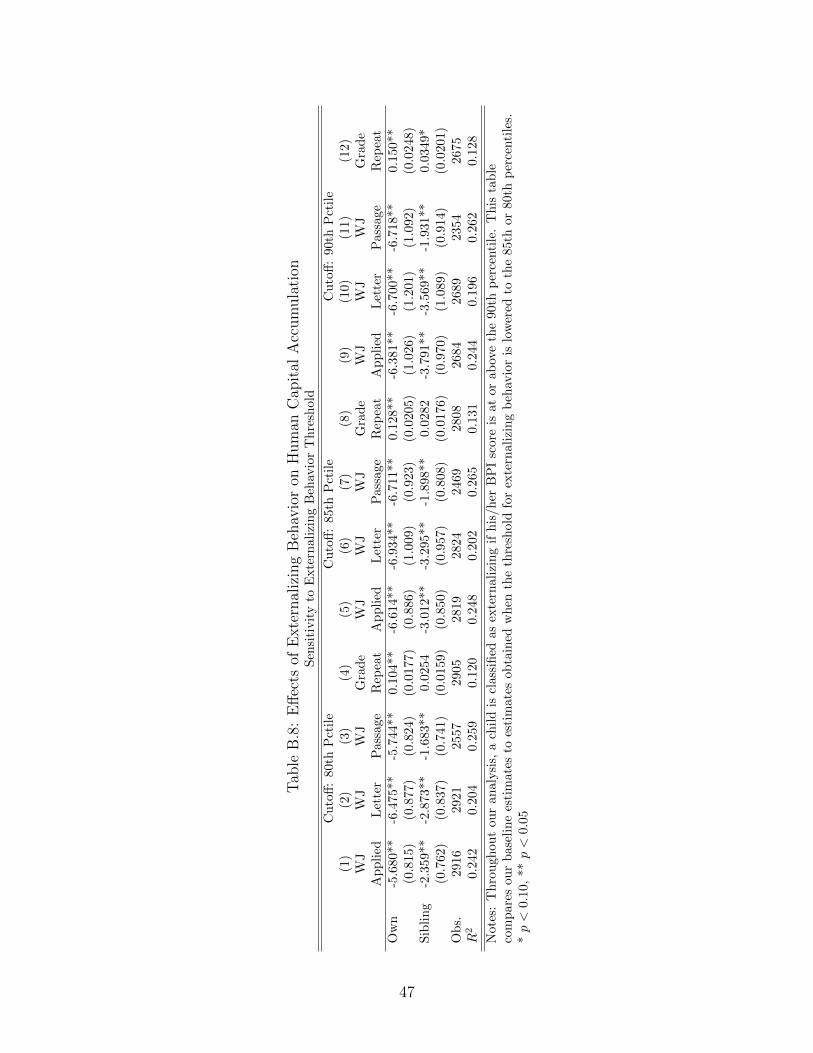
Tab
leB
.8:
Eff
ects
ofE
xte
rnal
izin
gB
ehav
ior
onH
um
anC
apit
alA
ccum
ula
tion
Sen
siti
vit
yto
Exte
rnal
izin
gB
ehav
ior
Th
resh
old
Cu
toff
:80t
hP
ctil
eC
uto
ff:
85th
Pct
ile
Cu
toff
:90
thP
ctil
e(1
)(2
)(3
)(4
)(5
)(6
)(7
)(8
)(9
)(1
0)(1
1)(1
2)
WJ
WJ
WJ
Gra
de
WJ
WJ
WJ
Gra
de
WJ
WJ
WJ
Gra
de
Ap
pli
edL
ette
rP
assa
geR
epea
tA
pp
lied
Let
ter
Pas
sage
Rep
eat
Ap
pli
edL
ette
rP
assa
geR
epea
tO
wn
-5.6
80**
-6.4
75*
*-5
.744
**0.
104
**-6
.614
**-6
.934
**-6
.711
**0.
128*
*-6
.381
**-6
.700
**-6
.718
**0.1
50**
(0.8
15)
(0.8
77)
(0.8
24)
(0.0
177)
(0.8
86)
(1.0
09)
(0.9
23)
(0.0
205)
(1.0
26)
(1.2
01)
(1.0
92)
(0.0
248)
Sib
lin
g-2
.359
**-2
.873
**-1
.683
**0.0
254
-3.0
12**
-3.2
95**
-1.8
98**
0.02
82-3
.791
**-3
.569
**-1
.931
**0.0
349*
(0.7
62)
(0.8
37)
(0.7
41)
(0.0
159)
(0.8
50)
(0.9
57)
(0.8
08)
(0.0
176)
(0.9
70)
(1.0
89)
(0.9
14)
(0.0
201)
Ob
s.29
1629
2125
5729
0528
1928
2424
6928
0826
8426
8923
542675
R2
0.2
420.
204
0.25
90.
120
0.24
80.
202
0.26
50.
131
0.24
40.
196
0.26
20.1
28
Not
es:
Th
rou
ghou
tou
ran
alysi
s,a
chil
dis
clas
sifi
edas
exte
rnal
izin
gif
his
/her
BP
Isc
ore
isat
orab
ove
the
90th
per
centi
le.
Th
ista
ble
com
par
esou
rb
asel
ine
esti
mat
esto
esti
mate
sob
tain
edw
hen
the
thre
shol
dfo
rex
tern
aliz
ing
beh
avio
ris
low
ered
toth
e85
thor
80th
per
centi
les.
*p<
0.10
,**
p<
0.05
47
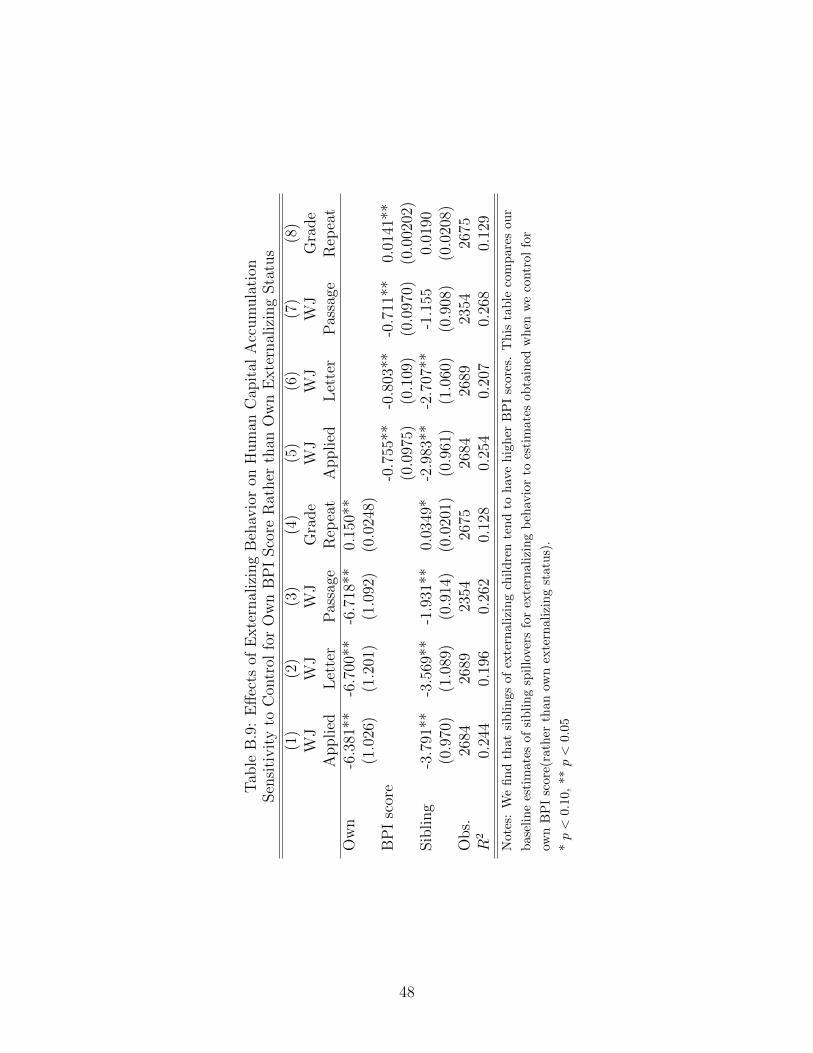
Tab
leB
.9:
Eff
ects
ofE
xte
rnal
izin
gB
ehav
ior
onH
um
anC
apit
alA
ccum
ula
tion
Sen
siti
vit
yto
Con
trol
for
Ow
nB
PI
Sco
reR
ather
than
Ow
nE
xte
rnal
izin
gSta
tus
(1)
(2)
(3)
(4)
(5)
(6)
(7)
(8)
WJ
WJ
WJ
Gra
de
WJ
WJ
WJ
Gra
de
Applied
Let
ter
Pas
sage
Rep
eat
Applied
Let
ter
Pas
sage
Rep
eat
Ow
n-6
.381
**-6
.700
**-6
.718
**0.
150*
*(1
.026
)(1
.201
)(1
.092
)(0
.024
8)B
PI
scor
e-0
.755
**-0
.803
**-0
.711
**0.
0141
**(0
.097
5)(0
.109
)(0
.097
0)(0
.002
02)
Sib
ling
-3.7
91**
-3.5
69**
-1.9
31**
0.03
49*
-2.9
83**
-2.7
07**
-1.1
550.
0190
(0.9
70)
(1.0
89)
(0.9
14)
(0.0
201)
(0.9
61)
(1.0
60)
(0.9
08)
(0.0
208)
Obs.
2684
2689
2354
2675
2684
2689
2354
2675
R2
0.24
40.
196
0.26
20.
128
0.25
40.
207
0.26
80.
129
Not
es:
We
find
that
sib
lin
gsof
exte
rnal
izin
gch
ild
ren
ten
dto
hav
eh
igh
erB
PI
scor
es.
Th
ista
ble
com
par
esou
r
bas
elin
ees
tim
ates
ofsi
bli
ng
spil
love
rsfo
rex
tern
aliz
ing
beh
avio
rto
esti
mat
esob
tain
edw
hen
we
contr
olfo
r
own
BP
Isc
ore(
rath
erth
anow
nex
tern
aliz
ing
stat
us)
.
*p<
0.1
0,**
p<
0.05
48
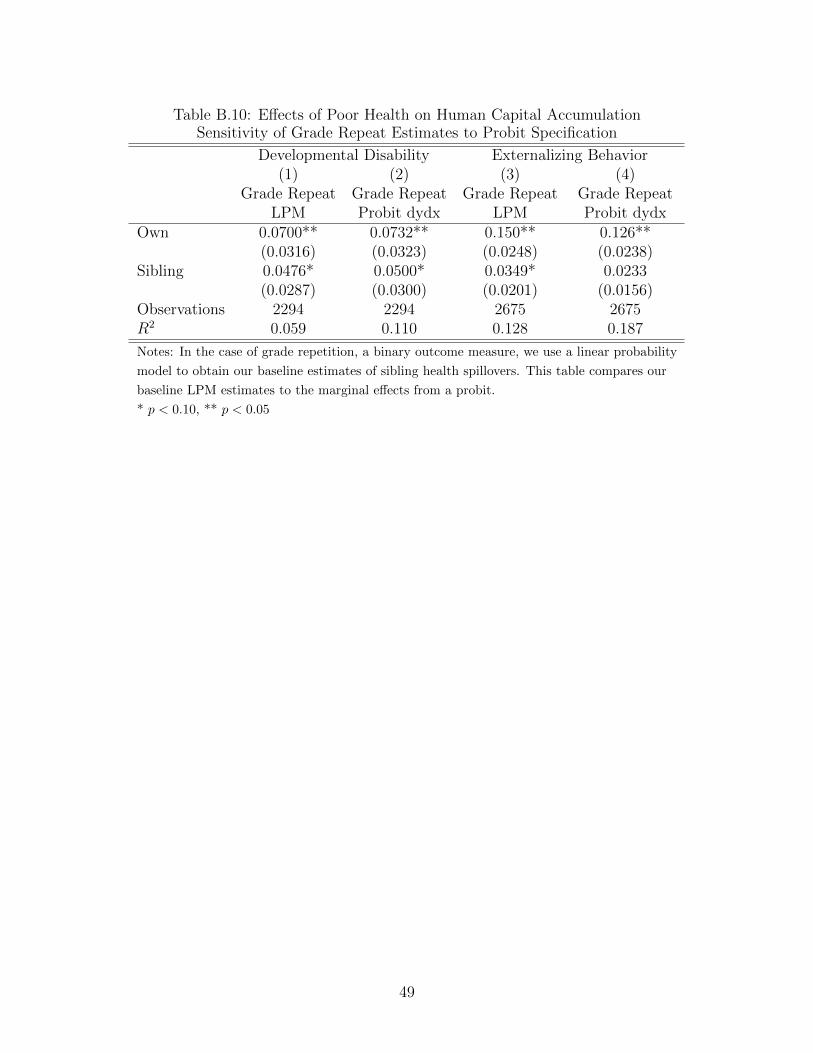
Table B.10: Effects of Poor Health on Human Capital AccumulationSensitivity of Grade Repeat Estimates to Probit Specification
Developmental Disability Externalizing Behavior(1) (2) (3) (4)
Grade Repeat Grade Repeat Grade Repeat Grade RepeatLPM Probit dydx LPM Probit dydx
Own 0.0700** 0.0732** 0.150** 0.126**(0.0316) (0.0323) (0.0248) (0.0238)
Sibling 0.0476* 0.0500* 0.0349* 0.0233(0.0287) (0.0300) (0.0201) (0.0156)
Observations 2294 2294 2675 2675R2 0.059 0.110 0.128 0.187
Notes: In the case of grade repetition, a binary outcome measure, we use a linear probability
model to obtain our baseline estimates of sibling health spillovers. This table compares our
baseline LPM estimates to the marginal effects from a probit.
* p < 0.10, ** p < 0.05
49

Tab
leB
.11:
Eff
ects
ofD
evel
opm
enta
lD
isab
ilit
yon
Hum
anC
apit
alA
ccum
ula
tion
Sen
siti
vit
yto
Excl
usi
onof
Auti
smfr
omD
DC
ateg
ory
Bas
elin
eR
esult
sE
xcl
.A
uti
sm(1
)(2
)(3
)(4
)(5
)(6
)(7
)(8
)W
JW
JW
JG
rade
WJ
WJ
WJ
Gra
de
Applied
Let
ter
Pas
sage
Rep
eat
Applied
Let
ter
Pas
sage
Rep
eat
Ow
n-9
.297
**-6
.936
**-5
.770
**0.
0700
**-8
.418
**-7
.842
**-5
.877
**0.
0682
*(1
.988
)(1
.936
)(1
.861
)(0
.031
6)(2
.249
)(2
.261
)(2
.198
)(0
.036
0)Sib
ling
-4.1
69**
-5.7
77**
-3.7
95**
0.04
76*
-5.2
83**
-6.0
68**
-3.8
26**
0.07
64**
(1.6
32)
(1.7
65)
(1.6
23)
(0.0
287)
(1.8
50)
(2.0
63)
(1.9
27)
(0.0
360)
Obse
rvat
ions
2287
2292
1984
2294
2212
2216
1918
2212
R2
0.21
50.
168
0.23
50.
059
0.22
30.
175
0.24
10.
065
Not
es:
Th
rou
ghou
tou
ran
aly
sis,
ach
ild
iscl
assi
fied
asd
evel
opm
enta
lly
dis
able
dif
he/
she
has
ever
bee
nd
iagn
osed
wit
hep
ilep
sy,
auti
sm,
orm
enta
lre
tard
atio
n.
To
add
ress
con
cern
sth
ata
sin
gle
DD
con
dit
ion
may
be
dri
vin
gou
r
resu
lts,
we
com
par
eou
rb
ase
lin
ees
tim
ates
ofsi
bli
ng
hea
lth
spil
lover
sto
esti
mat
esob
tain
edw
hen
the
DD
cate
gory
isre
stri
cted
toex
clu
de
thos
ech
ild
ren
wit
hau
tism
.
*p<
0.10
,**
p<
0.05
50
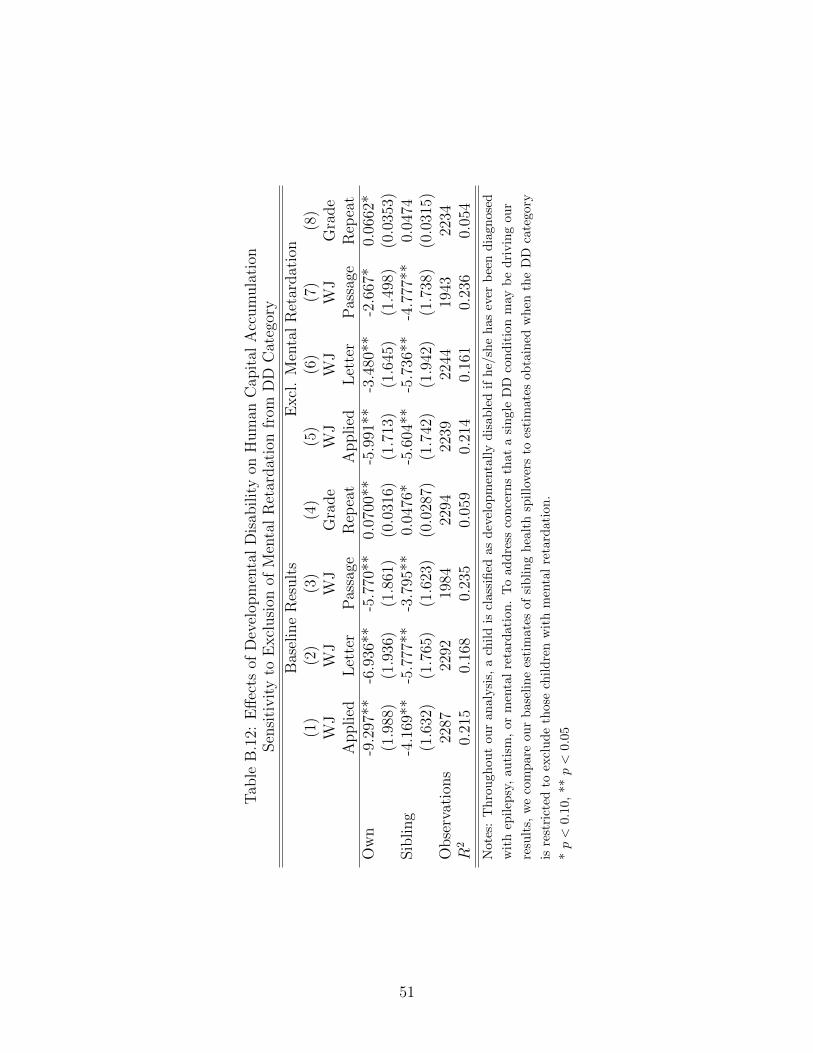
Tab
leB
.12:
Eff
ects
ofD
evel
opm
enta
lD
isab
ilit
yon
Hum
anC
apit
alA
ccum
ula
tion
Sen
siti
vit
yto
Excl
usi
onof
Men
tal
Ret
ardat
ion
from
DD
Cat
egor
y
Bas
elin
eR
esult
sE
xcl
.M
enta
lR
etar
dat
ion
(1)
(2)
(3)
(4)
(5)
(6)
(7)
(8)
WJ
WJ
WJ
Gra
de
WJ
WJ
WJ
Gra
de
Applied
Let
ter
Pas
sage
Rep
eat
Applied
Let
ter
Pas
sage
Rep
eat
Ow
n-9
.297
**-6
.936
**-5
.770
**0.
0700
**-5
.991
**-3
.480
**-2
.667
*0.
0662
*(1
.988
)(1
.936
)(1
.861
)(0
.031
6)(1
.713
)(1
.645
)(1
.498
)(0
.035
3)Sib
ling
-4.1
69**
-5.7
77**
-3.7
95**
0.04
76*
-5.6
04**
-5.7
36**
-4.7
77**
0.04
74(1
.632
)(1
.765
)(1
.623
)(0
.028
7)(1
.742
)(1
.942
)(1
.738
)(0
.031
5)O
bse
rvat
ions
2287
2292
1984
2294
2239
2244
1943
2234
R2
0.21
50.
168
0.23
50.
059
0.21
40.
161
0.23
60.
054
Note
s:T
hro
ugh
out
our
analy
sis,
ach
ild
iscl
assi
fied
asd
evel
opm
enta
lly
dis
able
dif
he/
she
has
ever
bee
nd
iagn
osed
wit
hep
ilep
sy,
auti
sm,
orm
enta
lre
tard
atio
n.
To
add
ress
con
cern
sth
ata
sin
gle
DD
con
dit
ion
may
be
dri
vin
gou
r
resu
lts,
we
com
par
eou
rb
asel
ine
esti
mat
esof
sib
lin
gh
ealt
hsp
illo
vers
toes
tim
ates
obta
ined
wh
enth
eD
Dca
tego
ry
isre
stri
cted
toex
clu
de
thos
ech
ild
ren
wit
hm
enta
lre
tard
atio
n.
*p<
0.10
,**
p<
0.05
51
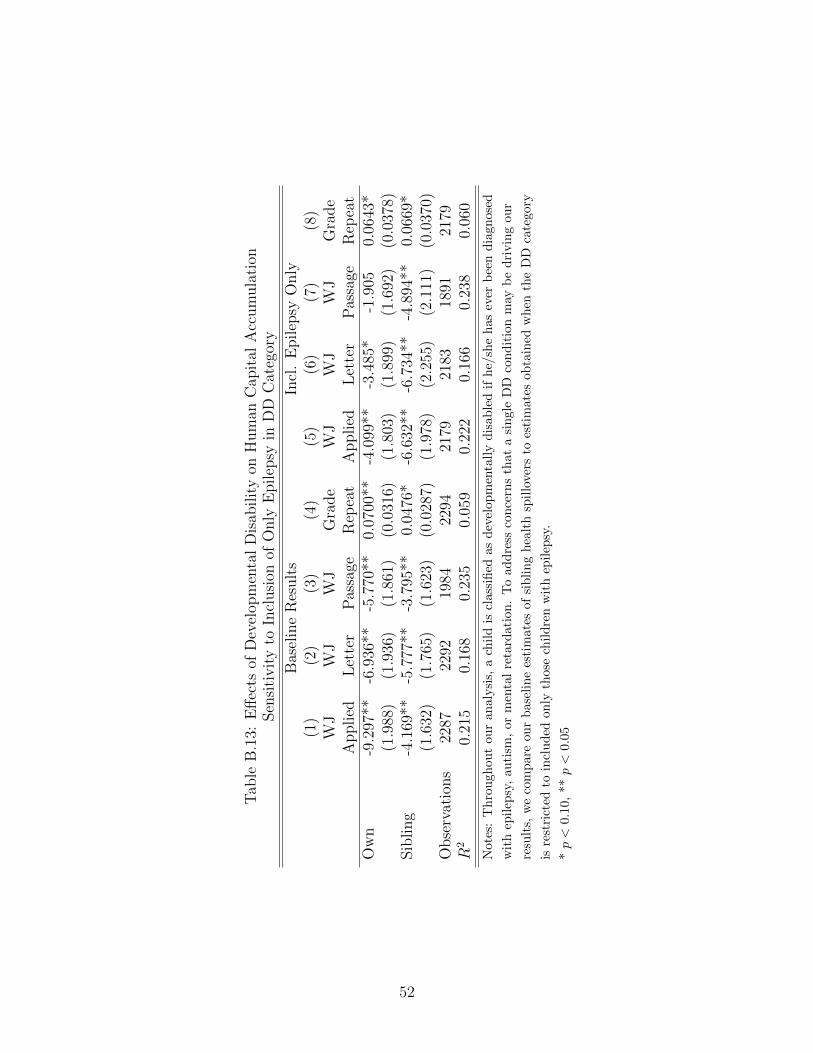
Tab
leB
.13:
Eff
ects
ofD
evel
opm
enta
lD
isab
ilit
yon
Hum
anC
apit
alA
ccum
ula
tion
Sen
siti
vit
yto
Incl
usi
onof
Only
Epilep
syin
DD
Cat
egor
y
Bas
elin
eR
esult
sIn
cl.
Epilep
syO
nly
(1)
(2)
(3)
(4)
(5)
(6)
(7)
(8)
WJ
WJ
WJ
Gra
de
WJ
WJ
WJ
Gra
de
Applied
Let
ter
Pas
sage
Rep
eat
Applied
Let
ter
Pas
sage
Rep
eat
Ow
n-9
.297
**-6
.936
**-5
.770
**0.
0700
**-4
.099
**-3
.485
*-1
.905
0.06
43*
(1.9
88)
(1.9
36)
(1.8
61)
(0.0
316)
(1.8
03)
(1.8
99)
(1.6
92)
(0.0
378)
Sib
ling
-4.1
69**
-5.7
77**
-3.7
95**
0.04
76*
-6.6
32**
-6.7
34**
-4.8
94**
0.06
69*
(1.6
32)
(1.7
65)
(1.6
23)
(0.0
287)
(1.9
78)
(2.2
55)
(2.1
11)
(0.0
370)
Obse
rvat
ions
2287
2292
1984
2294
2179
2183
1891
2179
R2
0.21
50.
168
0.23
50.
059
0.22
20.
166
0.23
80.
060
Note
s:T
hro
ugh
out
our
analy
sis,
ach
ild
iscl
assi
fied
asd
evel
opm
enta
lly
dis
able
dif
he/
she
has
ever
bee
nd
iagn
osed
wit
hep
ilep
sy,
auti
sm,
orm
enta
lre
tard
atio
n.
To
add
ress
con
cern
sth
ata
sin
gle
DD
con
dit
ion
may
be
dri
vin
gou
r
resu
lts,
we
com
par
eou
rb
asel
ine
esti
mat
esof
sib
lin
gh
ealt
hsp
illo
vers
toes
tim
ates
obta
ined
wh
enth
eD
Dca
tego
ry
isre
stri
cted
toin
clu
ded
only
thos
ech
ild
ren
wit
hep
ilep
sy.
*p<
0.10
,**
p<
0.05
52
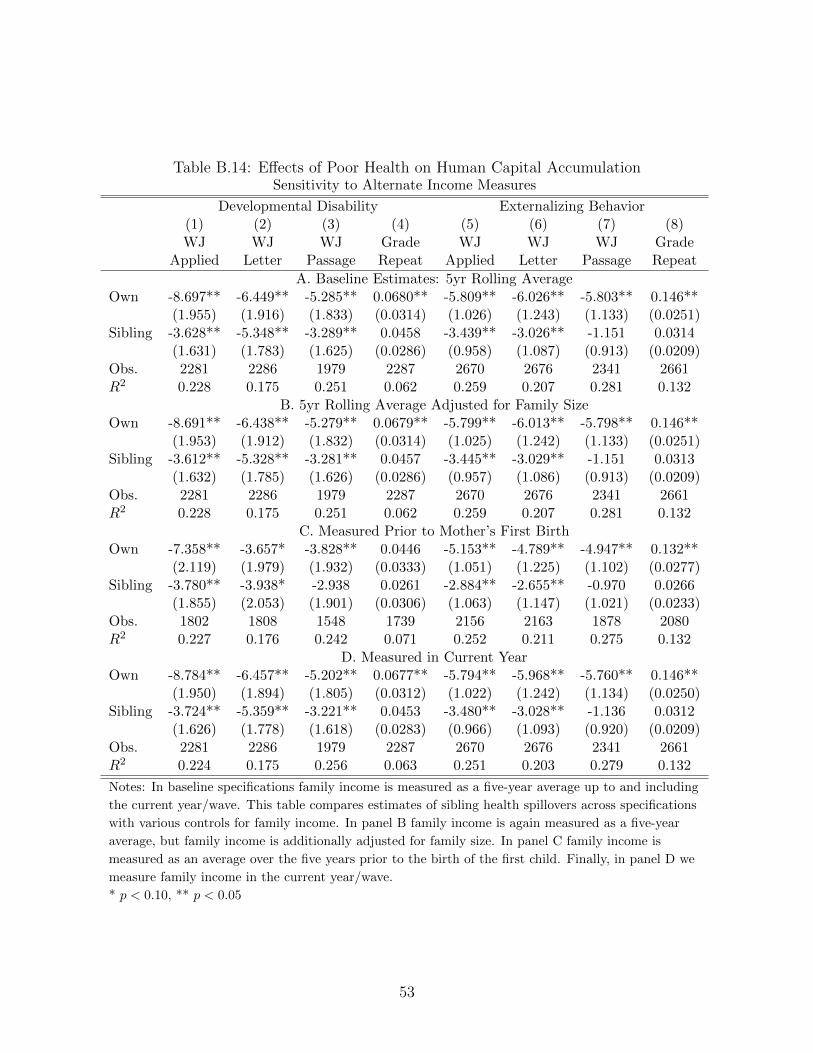
Table B.14: Effects of Poor Health on Human Capital AccumulationSensitivity to Alternate Income Measures
Developmental Disability Externalizing Behavior(1) (2) (3) (4) (5) (6) (7) (8)WJ WJ WJ Grade WJ WJ WJ Grade
Applied Letter Passage Repeat Applied Letter Passage Repeat
A. Baseline Estimates: 5yr Rolling AverageOwn -8.697** -6.449** -5.285** 0.0680** -5.809** -6.026** -5.803** 0.146**
(1.955) (1.916) (1.833) (0.0314) (1.026) (1.243) (1.133) (0.0251)Sibling -3.628** -5.348** -3.289** 0.0458 -3.439** -3.026** -1.151 0.0314
(1.631) (1.783) (1.625) (0.0286) (0.958) (1.087) (0.913) (0.0209)Obs. 2281 2286 1979 2287 2670 2676 2341 2661R2 0.228 0.175 0.251 0.062 0.259 0.207 0.281 0.132
B. 5yr Rolling Average Adjusted for Family SizeOwn -8.691** -6.438** -5.279** 0.0679** -5.799** -6.013** -5.798** 0.146**
(1.953) (1.912) (1.832) (0.0314) (1.025) (1.242) (1.133) (0.0251)Sibling -3.612** -5.328** -3.281** 0.0457 -3.445** -3.029** -1.151 0.0313
(1.632) (1.785) (1.626) (0.0286) (0.957) (1.086) (0.913) (0.0209)Obs. 2281 2286 1979 2287 2670 2676 2341 2661R2 0.228 0.175 0.251 0.062 0.259 0.207 0.281 0.132
C. Measured Prior to Mother’s First BirthOwn -7.358** -3.657* -3.828** 0.0446 -5.153** -4.789** -4.947** 0.132**
(2.119) (1.979) (1.932) (0.0333) (1.051) (1.225) (1.102) (0.0277)Sibling -3.780** -3.938* -2.938 0.0261 -2.884** -2.655** -0.970 0.0266
(1.855) (2.053) (1.901) (0.0306) (1.063) (1.147) (1.021) (0.0233)Obs. 1802 1808 1548 1739 2156 2163 1878 2080R2 0.227 0.176 0.242 0.071 0.252 0.211 0.275 0.132
D. Measured in Current YearOwn -8.784** -6.457** -5.202** 0.0677** -5.794** -5.968** -5.760** 0.146**
(1.950) (1.894) (1.805) (0.0312) (1.022) (1.242) (1.134) (0.0250)Sibling -3.724** -5.359** -3.221** 0.0453 -3.480** -3.028** -1.136 0.0312
(1.626) (1.778) (1.618) (0.0283) (0.966) (1.093) (0.920) (0.0209)Obs. 2281 2286 1979 2287 2670 2676 2341 2661R2 0.224 0.175 0.256 0.063 0.251 0.203 0.279 0.132
Notes: In baseline specifications family income is measured as a five-year average up to and including
the current year/wave. This table compares estimates of sibling health spillovers across specifications
with various controls for family income. In panel B family income is again measured as a five-year
average, but family income is additionally adjusted for family size. In panel C family income is
measured as an average over the five years prior to the birth of the first child. Finally, in panel D we
measure family income in the current year/wave.
* p < 0.10, ** p < 0.05
53