altman z-score model of bankruptcy rlsk analysis of
TRANSCRIPT
ALTMAN Z-SCORE MODEL OF BANKRUPTCY RlSK ANALYSIS OF PROPERTY SECTOR COMPANIES IN
INDONESIA STOCK EXCHANGE1
Tanti lrawati Muchlis and Kurniasari Dian Jayanti Widyatama .. , University, Indonesia
ABSTRACT C
Early warning system for financial problem that threatened the operation of industry is needed to anficipates financial difficulty to company. One prediction model commonly used is Altman Z-score which analyze combination of financial ratios on financial statement to see the different between bankrupt and non-bankrupt companies. In this model, there are 5 financial ratios indicators that combined to differentiate between bankrupt and non-bankrupt companies, i.e. Working Capital to Total Assets, Retained Eamings to Total Assets, Eaming Before Income Tax to Total Assets, Market Value of Equity to Book Value of Liabilities and Sales to Total Assets. These financial ratios represent liquidity, profitability, solvability and activity aspects of the company. The original work of Altman is applied to publicly held manufactures companies. In this study, we use Altman Z-score to property sector in Indonesia. We analyzed bankruptcy risk of property companies listed at lndonesian Stock Exchange (IDX) on period of 2004-2008 using Altman Z-score prediction model on their audited financial statements. The result of study of 19 listed property companies show that for 5 (five) consecutive years based on Altman Z-score, only 2 (two) companies, LPCK and JRPT are fit into healthy companies category. While only one company, BMSR is fit into bankrupt company categov for 5 (five) consecutive years and one company, LPKR is fit into grey area.
Keywords: Bankrupt Company, Bankruptcy, Financial Ratio, Altman Z-Score, lndonesian Stock Exchange, Property Company
BACKGROUND The world economy has experienced another global financial crisis that started as financial crisis in USA caused by property sector that spread to other countries. This crisis has significant impact to business sectors that otherwise is in a growth. This crisis has threatened business sectors and forced them to run business more effective and efficient to survive otherwise they could go bankrupt.
In property sector, bankruptcy risk becomes more urgent to be predicted. This industry needs an early warning system to detect financial problems that threaten the industry. With early warning of the industry condition it is possible to take precautions and preventive action to prevent financial crisis.
I This paper is a revised version from the paper with the title 'BANKRUPTCY RlSK ANALYSIS of PROPERTY SECTOR LISTED . COMPANIES in INDONESIA STOCK EXCHANGE USING ALTMAN Z-SCORE" that presented at and published in the proceeding of the Academic Conference - March 2009, hosted by lntelectbase International Consortium.
S. 3. Aiu&& and JL B. Jayanli . .. JjA3S.C - Va(wne 3,Jaaue 6
One of popular prediction model is Bankruptcy Model that developed by Professor Edward I Altman in 1968, who was, at the time, an Assistant Professor of Finance at New York University. The formula known as Altman Z-Score may be used to predict the probability that a firm will go into bankruptcy within two years. The Z-score uses multiple corporate income and balance sheet values to measure the financial health of a company. The Z-score is a linear combination of four or five common business ratios (http:llen.wikipedia.orglwikilZ-Score~Financial~Analysis~Tool)
This study is conducted to analyze bankruptcy risk using Altman Z-score model of property sector company listed in Indonesia Stock Exchange (IDX; formerly Jakarta Stock exchangelJSX) in the period of 2004-2008
RESEARCH QUESTIONS 7. What is the condition of financial ratios of property sector companies listed in IDX in the period
2004-2008 ? 2. What is the value of Altman Z-score of property sector companies listed in IDX in the period 2004-
2008 ?
LITERATURE REVIEW
Financial Ratios One of the most important tool for assessing a.'company's financial condition or organization in the industry is through its financial reports. Financial report shows the position of the resources owned by the company during a period of time. In addition, the financial report also highlighted the company's financial performance is shown with the ability to generate revenue in the company with the resources owned by the company. Financial reports are assessed and analyzed through the financial analysis. Financial information contained in the financial statements contain historical data and forecasts in the assessment of investment analysis. There are many financial ratios that can indicate a company's financial performance. Among them is the liquidity ratios, activity ratios, profitability ratios and solvency ratios.
Financial ratios simplify the information that describes the relationship between specific post with another post. Financial ratios are very important in analyzing a company's financial condition. According to Harahap (2004:297) financial ratios are as follows:
"Financial ratio is the number obtained from cornparation of one post of financial reports with the other post that has relevant and significant relation"
Types of Financial Ratios According to Lyn M Fraser and Aileen Ormiston (2008:21) and R. Agus Sartono (2001:114) financial ratio analysis can be divided into:
1. Liquidity Ratio: the ratio measures a company's ability to meet cash needs to meet short-term financial obligations
2. Activity ratio of activity: the ratio measures the liquidity of certain assets and efficiency in managing assets to obtain loans.
3. Solvability ratio: the ratio measures the extent of company's debt financing relative to equity and the ability to pay interest and other obligation. The ratio show company's capacity to meet the obligations both short and long term.
4. Ratios Profitability: the ratio measures company's overall performance and efficiency in managing assets, liabilities and equity; The ratio measure company's ability to generate profit in relation of sales, assets and their own capital.
Bankruptcy Knowing the company's financial condition is very important for investors and creditors in making investment and credit decisions. Problems of financial distress always raise the risk of company's bankruptcy. Rahmat Triaji (1999), states that bankruptcy is the financial distress so severe that the company is not able to run the operations properly. While financial distress is a financial or liquidity difficulty that may be the beginning of bankruptcy. According to Ross, Westerfield, and Jaffe quoted by Lesmana, Rico, and Rudi Su janto (2003:173) the definition of Financial Distress is:
"Financial distress is a situation where a firm's operating cash flows are not sufficient to satis@ current obligations (such as trade credits or herest expenses) and the firm is forced out to take corrective action. "
The notions of the financial difficulties expressed by the Brigham and Gapenski quoted by Rahmat Triaji (1 999) are as follows:
1. Economic Failure: means that corporate earnings cannot cover the total cost including the cost of capital. Businesses that suffered economic failure can continue operating as long as the creditor intends to provide additional capital and the owner can receive a rate of return below market interest rate.
2. Business Failure: the term was used by Dun & Bradstreet which is the main proposer of failure statistic, to define business that ceased operations and cause losses to creditors. Thus a business can be classified as a failure, although not through the normal bankruptcy. Also a business can shut down its operation but is not considered as a failure
3. Technical Insolvency: a company can be considered bankrupt if it does not meet its due liabilities. Technical insolvency may indicate a shortage of temporary liquidity at a time where companies can raise money to meet its obligations and remain alive. On the other hand, if this is the technical insolvency of the early symptoms of economic failure, then this is a sign to the financial disaster
4. Insolvency in bankruptcy a firm is considered as bankruptcy insolvency when the book value of total liabilities exceed the market value of company assets. This is a more serious condition when compared with the technical insolvency, because in general this is a sign of economic failure that led to the liquidation of a business. Companies that experienced insolvency in bankruptcy do not need to go through bankruptcy legal process.
5.5'. Mu&% and 3C 9. Jayanci . -
5'JXTSE - Vathne 3 , 3 4 5 ~ 6 . .. . . .
5. Legal bankruptcy The term bankrupt is used for every company that fails. A company cannot be said to be a bankrupt by law, unless officially filed charges with the law.
According Sunarto (2006:37) bankruptcy is:
"Bankruptcy or insolvency is a business failure occurs when the duty / corporate debts greater than the fair market value of assets-assets. "
According Muliaman (2003:lO) definition .bankruptcy in Indonesia refers to Act No.1 of 1998 on amendments to the Bankruptcy Law, which states:
I. Debtors who have two or more creditors, or not paying at least one debt which has due and cannot be charged, is declared bankrupt by a competent court, either on his own petition, or request one or more creditors.
2. The application as referred to above, can also be submiffed for the public interest. Bankruptcy law basically states how to resolve disputes that arise when one company cannot meet debt obligations, as well as how to handle disputes between individuals relating to the business in the run. There are several important criteria: a. The accounting must be clear. Valuation of assets should be transparent and recognized by
the public (international standard). b. gradation level based on the dependents debts determine who should take precedence in
resolving the debt problem for example: a bankrupt company, who is entitled to payment in advance and who later.
c. The civil law regulate who is concerned, the regulator of bankruptcy, where a competent court and how, or processes that must be done to resolve this case.
d. Sanctions authorized by the court if one party said does not meet some actual promise given to a company that was able to seftle his debts.
, e. Even if declared bankrupt, the company would still be able to continue while in this case must stipulated requirements and who should oversee the process. A company that is declared bankrupt need not immediately stop all its activities, they should be given the opportunity to settle financial and other activities for the sake of the debt collector.
f. Disputes can be seffle through arbitration. g. The Company declared to be insolvent or bankrupt if within a certain period cannot make
payments of principal and or interest. Bankruptcy can also prompted by business owners as well as by the debt collectors.
From the above explanation can be concluded that bankruptcy in lndonesia is the inability of a firm in continuing operations due to financial conditions that have experienced a decline and has an obligation or debt that are greater than the value of its assets. Thus declared bankrupt by a competent court, either on his own petition, or request one or more creditors.
Causes of Bankruptcy In general, the causes of bankruptcy, according Darsono and Ashari (2004:102) can be divided into two, namely the internal factors and external factors. The internal factor is the factor. that comes from the internal part of corporate management. While external factors are factors from 'outside that are directly related to the company's operations or macro economic factors.
Internal factors that could cause the bankruptcy of the company include: 1
7. Management is not efficient -1 1 This will result in continuing losses that eventually led to the company unable to pay its 4
obligations. 2. Unbalance capital owned by the number of debt-owned receivables
Debt that is too large will result in large interest cost, thus reduce profits could even cause harm. , Receivables that are too large will also be detrimental because the asset is idle too much, so do not generate revenue.
3. Moral hazard by management . , Fraud committed by corporate management can result in bankruptcy. This suspicion would lead to ; losses for companies that ultimately bankrupted the company. This fraud can take the form of . corrupt management, or providing false information to shareholders or investors.
External factors that can lead to bankruptcy include:
7. Changes in the customer's demand was not anticipated by the company This results in loss of customers, resulting in a decrease in income. To survive the company must always anticipate customer needs by creating products that match customer needs.
2. The difficulty because suppliers could no longer supply the raw materials used for production activities. To anticipate this company should always be in a good relationship with suppliers and does not rely on single supplier materials so that the risk of raw material shortage can be overcome.
3. Debtor is cheating by avoiding debt payment Too many accounts given to the debtor's loan term in long period causes many idle assets that do not provide income, resulting in huge losses for the company. To anticipate this, companies should always monitor the receivables and condition of the debtor in order to conduct early protection against corporate assets.
4. Relationships are not in harmony with creditors can also be fatal to the company's sunlival In Law No.4 of 1998, creditors can propose to bankrupt company. To anticipate this, companies must be able to manage their debts well, and also maintain good relations with creditors.
5. Competition is increasing tight business This requires the company to always improve themselves, so they can compete with other companies in meeting customer needs. The more intense competition requires companies to keep improving products, providing value to grow better for customers.
6. The condition of global economy It is also to be anticipated by the company, so as not to lose competitiveness with other countries.
Bankruptcy Prediction Model Analysis of financial difficulties will help making the decision to determine attitudes toward companies that experienced financial difficulties. Bankruptcy is a serious problem and costly, therefore it is vital to anticipate the emergence of financial difficulties that could lead to bankruptcy. The prediction model of companies that experienced financial difficulties and possible bankruptcy is become important. Business bankruptcy prediction model will provide guidance to the parties involved about whether the company's financial performance will experience financial difficulties or are not in the future.. Management may make improvements needed as early as possible to avoid bankruptcy when li has developed a system that can provide early warning.
An indicator that can be used to assess the company's corporate bankruptcy is a formula coined by Edward Altman (1968) called Altman Z-score. This formula uses the components in the financial statements as a possible predictor of whether or not the company went bankrupt. Altman was the first person to successfully implement Multiple Discriminant Analysis (MDA) to develop a prediction model with a high degree of accuracy.
Altman initially use 66 manufacturing firms sample of 35 bankrupt companies and 35 companies that are not bankrupt. Furthermore he also selected 22 variables (financial ratio) is the potential to be evaluated and grouped into 5 groups, namely liquidity, profitability, leverage, solvency, and activity. After his study, from 22 variables only 5. were selected which are he considered as the best combination to predict bankruptcy. Using the sample firms and 5 ratio he formed discriminant function which is also called the ~ l t m a n Z-Score as follows:
i
Where:
XI = Working capital / Total Assefs X2 = Retained Eaming / Total Assets X3 = Earning Before Interest and Taxes / Total Assets Xq = Market Value Equity / Book Value of Total Debt Xg = Sales / Total Assets .-
Z = Overall Index
The cut-off value for the calculated value of Original Z-score, as follows:
bankruptcy (the company faced a serious threat of bankruptcy).
Gray area (if the company does not make significant improvement in management and financial structure, firms may be in danger of bankruptcy within one or two years).
No bankruptcy (the company does not experience any problems with the financial conditions).
The ratio of Working Capital to Total Assefs used to measure the liquidity of corporate assets relative to total capitalization. Altman (2000) said the net working capitalltotal assets ratio, frequently found in studies of corporate problems, is a measure of the net liquid assets of the firm relative to the total capitalization. Working capital is defined as the difference between current assets and current liabilities. Ordinarily, a firm experiencing consistent operating losses will have shrinking current assets in relation to total assets. Working capital to total assets measures a company's ability to meet short term obligations. Indicators that can be used to detect any problems at the company's liquidity levels are internal indicators such as lack of cash, debt swells trade, declining capital utilizafion, the addition of uncontrolled debt and some other indicators
Ahan Z S w J(6rke a,! 3lanIhf% Rid6 %a&ib 49'~apedg Sedan Campaniw in 9&ia StacR &danp
Retained Earnings Ratio to Total Assets used to measure the cumulative profitability. Altman (2000) said retained earnings is the account which reports the total amount of reinvested earnings andlor losses of a firm over its entire life. Retained earnings to total assets used to measured cumulative profitability during company operations life. A relatively young firm will probably show a low ratio because it has not had time to build up its cumulative profits.
The ratio of EBlT to Total Assets used to measure the actual productivity of the assets of the company. Earnings before interest and taxes to total assets ratio is a measure of the true productivity of the firm's assets, independent of any tax or leverage factors. . Ratio measures the ability of the company in generating profits from the assets used. This ratio is the largest contributor of the model.
Market Value Ratios Equity to Bobk value of Total Debt is used to measure how much asset a company can decline in value before the amount owed is greater than its assets and the company became insolvent.
While last ratio, Sales to Total Assets or the capital-turnover ratio is a standard financial ratio illustrating the sales generating ability of the firm's assets. It is used to measure management's capacity in dealing with competitive conditions.
In 1983, Altman developed two models namely Model A Z-score and Model B Z-score. Model A Z-score was developed for manufacturing companies closed (private manufacturer), with variable X4 at this function uses the book value of stockholder's equity'because it does not have a market value of eqity. While model B Z-score is developed to predict the bankruptcy of companies such as non-manufacturing small businesses, retail, sales, wholesaler, and the service sector. This B Z-score model does .not calculate the value of X 5 (sales to total assets) because the constantly changing significantly in the industry.
Rahmat Triaji (1999; 9) said Z-score model is very effective to predict bankruptcy 2 years before the actual occurrence of bankruptcy and in some cases Z-score models can predict the bankruptcy of 4 or 5 years earlier. Besides bankruptcy can predict the exact manufacturing company 2 years before the actual bankrupt, Z-score can also be used for:
1. Recheck candidates company that would be acquired by suppliers and other companies to detect the financial problems arising from these companies are likely to affect our business.
. 2. Measuring levels of a company's financial health through information obtained from financial statements.
Factors Led to the Bankruptcy Not easy to determine with certainty the factors that led to bankruptcy of a company. Often a company's bankruptcy is the result of a combination of many factors, which resulted in the emergence of a new factor that accelerates the process of bankruptcy. It is difficult to determine a fundamental factor that leads to bankruptcy.
However companies must be able to read the signs of the possibility of failing companies in business that could result in financial distress and possible bankruptcy. Rapid changes between competitors and unstable economic conditions, companies must pay attention to indicators of difficulties. According to
Rico (2003:183) there are some indicators that could drive a company into difficulties in their business and experiencing financial distress include:
1. Sales or income decreased significantly 2. The decrease earnings or cash flow from operations 3. Stock market prices fell significantly 4. The decrease total assets 5. The high possibility of failure in the high risk industries 6. Young companies generally prone difficulty in the early years of operation, so if it is not supported
by strong capital resources it could be !acing serious financial distress and end up in bankruptcy. 7. Cutting a significant dividend.
One of the important aspects of the analysis on the financial statements of each company is useful for predicting survival. Predict the company's survival is the most important aspect of all aspects of usability analysis conducted by almost all stakeholders in the company. Because before determining the objectives other than that conducted the analysis, it would have to be guaranteed or at least there is hope that a company is still able to maintain his life. Predict the importance of the company's survival because the fact is, there is no party in the company would expect the occurrence of bankruptcy or the company should be closed.
On the other hand for any reason, the company could face the situation where the company had declared bankruptcy and was not allowed tocontinue his efforts. Therefore it would be better if the symptoms and signs of bankruptcy is known much earlier, so that they can immediately find a solution.
OBJECT AND STUDY METHODS
Object of Study Objects of this study is companies in the property sector that have been going public and listed on the Indonesia Stock ExchangellDX (formerly known as Jakarta Stock ExchangelJSX) in period of 2004- 2008.Based on the Indonesian Capital Market Directory (ICMD) in 2008 there are 39 property companies listed in IDX, but only 19 companies of 39 registered from 2004 to 2008, which we used as research samples.
Study Methods In this study, we use descriptive method aimed at making description, illustration or picturse systematically and accurately about the facts, natures and relationship between the phenomena investigated. According to Nazir (2005:89), definition of the descriptive method is:
"A method in studying the status of a group of people, an object, a set of condition, a system of thought, or a class of event at present time"
Research using descriptive method of analysis, because this study was conducted to obtain a clear picture of a problem, then analyzes it to get a conclusion. This is done by examining and processing of secondary data which is combined between the data time series and cross sectional, then in the analysis to a conclusion in accordance with the purpose of research.
)e and Source of Data
Iata Type data used in this study is quantitative data in the form of a ratio, i.e. the data expressed in figures show the value of the variable quantity it represents. The data are a combination of time series and
:S sectional.
3 used in this research is secondary data. Secondary data is data collected at a particular time :h can describe the situation or activity at this time. Secondary data used in this research is audited ncial statement listed property companies in the IDX period 2004-2008. . . Source Data lrces of data from this study is from the Indonesian Capifal Market Directory, JSX annual report, ;e data have been published by the BE1 (Bursa Efek Indonesia or lndonesia Stock Exchange) 'ugh letters of reference-IDX Capital Market. Apart from the IDX, supporting data was also obtained I ITB JSE comer, and a website (www.isx.co.id. i~~v/r,~~ba~epan~.qo,id, www.bi.qo.id etc.).
rlariable Operationalization etermining the variables studied, the authors distinguish between two variables, namely:
. lndependent Variable (X) or (Independent Variable) lndependent variables are variables that independently'affect the other dependent variables. In other words, the independent variable is a variable that exists or occurs before the dependent variable. lndependent variables used in this study consisted of 5 financial ratios calculated from the financial reports on industrial property. lndependent variables in this study are:
X 1 = Working capital / Total Assets X 2 = Earning Retained / Total Assets X 3 = Earning Before Interest and Taxes / Total Assets X 4 = Market Value Equity /Book Value of Total Debt X 5 = Sales / Total Assets
1. Dependent Variable Dependent variables are the variable that is affected by other variables or which become due because of the independent variables. Dependent variables used in this study are the Z-score which is the total score from the operation of the independent variables that describe the financial health of the company.
Data Analysis his study, original model Z-score is used to because the object are property sector companies which ?ady go public (listed in IDX).
alysis of data in this study conducted quantitatively using descriptive analysis. Stage of this analysis : as follows:
3. Calculate the ratio of each company use data taken from the balance sheet and income statement using formula as follow: Working Capital to Total Assets (XI) = (Current Assets - Current Liabilities) / Total Assets x 100%
Retained Earnings to Total Assets (XZ) = Retained Earnings / Total Assets x 100% EBlT to Total Assets (X3) = EBIT/ Total Assets x 100% Market Value of Equity to Book Value of Liabilities (X4) = Market Value of Equity / Book Value of Liab. x 100% Sales to Total Assets (X5) = Total Sales / Total Assets ~ 1 0 0 %
b. Calculate the Z-Score of each company in a given year with a model Altman Z-Score using formula as follow: Z = 7,2 X1+7,4Xz+3,3X3+0,6Xq+ 7,O X5
c. The next step is to conduct a compari;on and analysis between the results of calculations with the criteria that if the bankruptcy is interpreted as follows 1) Z-Score 2,67
The Company does not experience any problems with the financial condition or it can be said is safe from bankruptcy
2) 1,8 < Z-Score < 2,67 Gray area (if the company does not make significant improvement in management and financial structure, firms may be in danger of bankruptcy within one or two years)
3) Z-Score5 1,8 The Company facing a serious threat of bankruptcy
STUDY RESULTS AND DISCUSSIOhl
1. Condition Working Capital to Total Assets of Listed Property Companies in IDX 2004-2008
Study result for value of Working Capital to Total Assets is shown in Table 1. Negative sign on the value of Working Capital to Total Assets means that the company has negative net working capital (current debt value is greater than current assets). This means that potentially can not repay debts maturing smooth using smooth property companies and companies experiencing difficulties working capital. While a positive sign means that there is excess of current assets after paying current debts that have matured for% of total assets. Excess these assets will be used as working capital for company operations.
Based on shown data at the tablel, can be seen that the movement of the variable values Working Capital to Total Assets at each company is different, there are rise trend companies and also decline trend companies. However, during these 5 years was stable value. Companies that value trend to increase among others SMDM. While the company whose value rises with the very significant, namely DVTI. While the value tend to fall is BMSR, and companies tend to be stable in value is BIPP, CTRA, CTRS, DART, GMTD, OMRE, JRPT, KIJA, LPCK, LPKR, MDLN, PWON, PWSI, RBMS, SMRA, and SMDM
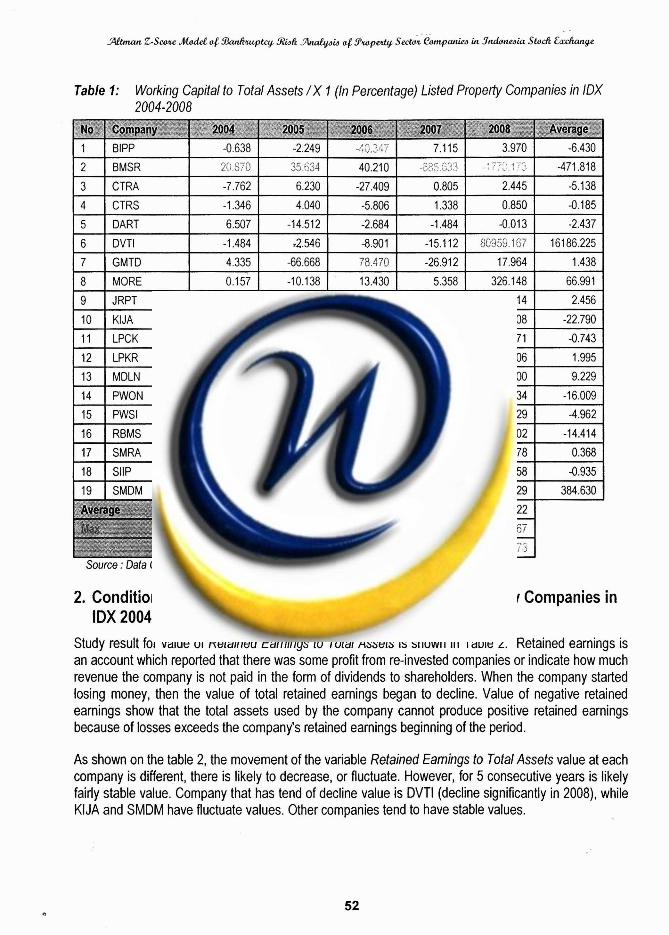
Table 1: Working Capital to Total Assets / X 1 (In Percentage) Listed Property Companies in IDX 2004-2008
1
2
3
4
BlPP
BMSR
5
6
7
CTRA I -7.762
CTRS -1.346
8
9
-0.638
2.:.;.679
DART
DVTl
GMTD
10
11
6.230
4.040
MORE
JRPT
12
13
14
-2.249
33.733 C l r ..C
6.507
-1.484
4.335
KlJA
LPCK
15
16
1 19 1 SMDM I 1.785 1 -42.840 1 -0.572 1 249.746 1 1715.029 1 384.630 1
-27.409
-5.806
0.157
6.880
LPKR
MDLN
PWON
17
18
Source : Data Calculation
-14.512
72.546
-66.668
11 552
5.61 5
PWSl
RBMS
2. Condition Retained Earnings to Total Assets of Listed Property Companies in IDX 2004-2008
- A ? u ,,,,.' . . ,. .\ . . ,: ..
40.210
0.805
1.338
-10.138
-1.209
0.304
4.773 -2;i~ \,.. .';(;.9, b ,,
SMRA
SllP
Study result for value of Retained Earnings to Total Assets is shown in Table 2. Retained earnings is an account which reported that there was some profit from re-invested companies or indicate how much revenue the company is not paid in the form of dividends to shareholders. When the company started losing money, then the value of total retained earnings began to decline. Value of negative retained earnings show that the total assets used by the company cannot produce positive retained earnings because of losses exceeds the company's retained earnings beginning of the period.
3.970
; , '
7.115
";, ..... k.L. . 2 ; .:, :2 ", 2
-2.684
8.901
78.470
< . b 4 : \ --
.. c i .a22
-6.832
-3.896
-25.131
As shown on the table 2, the movement of the variable Retained Earnings to Total Assets value at each company is different, there is likely to decrease, or fluctuate. However, for 5 consecutive years is likely fairly stable value. Company that has tend of decline value is DVTl (decline significantly in 2008), while KIJA and SMDM have fluctuate values. Other companies tend to have stable values.
-6.430
-471.818
2.445
0.850
13.430
-1.251
7.105
10.414
-31.972
-3.967
-12.415
-5.138
-0.185
-1.484
-15.1 12
-26.912
-2.705
15.356
1.521
4.898
5.358
-0.653
0.448
-0.969
-1.657
2.094
1.043
-0.013
S093.167
17.964
-7.510
-3.982
5.432
-32.457
-2.437
16186.225
1.438
326.148
8.514
0.313
4.028
2.916
-0.581
3.239
66.991
2.456
6.608
-1 3.871
0.962
-18.277
-22.790
-0.743
1.806
27.900
-0.934
-0.386
-3.600
1.995
9.229
-16.009
-28.829
-1.102
-4.962
-14.414
4.678
7.058
0.368
-0.935
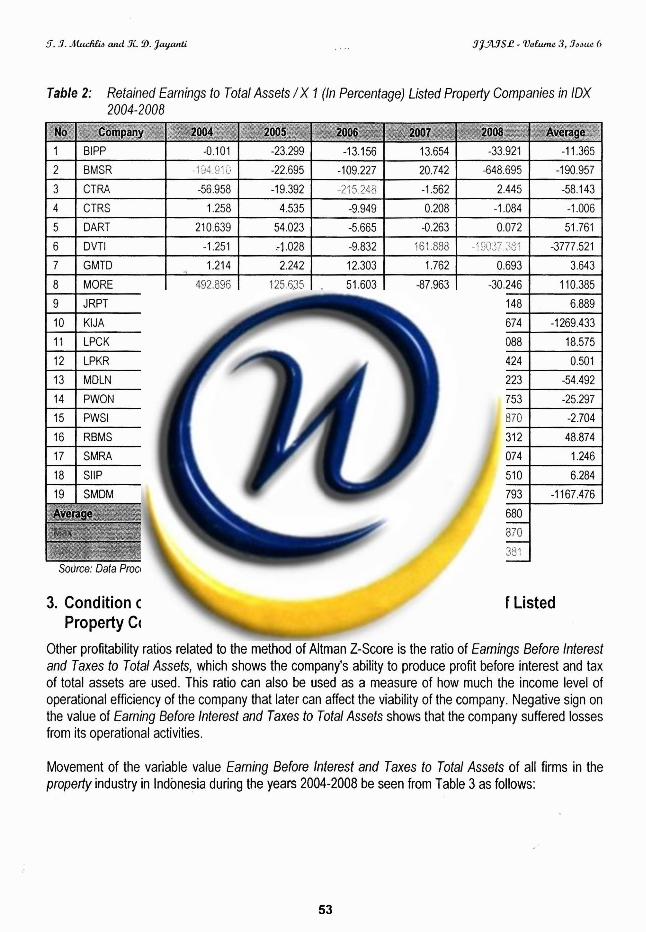
Table 2: Retained Earnings to Total Assets / X I (In Percentage) Listed Property Companies in IDX 2004-2008
1
2
3
4 1 CTRS
5 ( DART
BlPP
BMSR
CTRA
6
7
8
1.258
210.639
9
10
-0.101
q ~~4 ,<,j" ~.:
-56.958
DVTl
GMTD
MORE
11
12
4.535
54.023
JRPT
KlJA
13
14
15
3. Condition of Earning Before lnterest and Taxes to Total Assets of Listed Property Companies in IDX 2004-2008
-23.299
-22.695
-19.392
-1.251
1.214
49'2.896
LPCK
LPKR
16
17
Other profitability ratios related to the method of Altman Z-Score is the ratio of Earnings Before lnterest and Taxes to Total Assets, which shows the company's ability to produce profit before interest and tax of total assets are used. This ratio can also be used as a measure of how much the income level of operational efficiency of the company that later can affect the viability of the company. Negative sign on the value of Earning Before lnterest and Taxes to Total Assets shows that the company suffered losses from its operational activities.
-9.949
-5.665
14.321
-20.1 49
MDLN
PWON
PWSl
Movement of the variable value Earning Before lnterest and Taxes to Total Assets of all firms in the propedy industry in Indonesia during the years 2004-2008 be seen from Table 3 as follows:
-13.156
-109.227
-2; .5 246
.-I ,028
2.242
125.635
18.912
0.133
RBMS
SMRA
0.208
-0.263
14.109
. !;333,;2$
49.027
63.266
3.105
13.654
20.742
-1.562
-9.832
12.303
. 51.603
50.935
1.852
-3.528 I 85.1,87
7.684 1 0.109
-1.084
0.072
1.555
20.619
-9.384
-176.643
-8.847
-33.921
-648.695
2.445
-1.006
51.761
161 383
1.762
-87.963
-2.679
-0.263
116.110
0.637
-1 1.365
-190.957
-58.1 43
2.312
-0.532
-7.994
-1.088
1.504
-: : - . , L C , <:i; ?? .A; ':Q< :
0.693
-30.246
22.617
0.360
46.91 3
-0.129
-3777.521
3.643
1 10.385
2.148
-16.674
-286.884
-4.268
-8.944
6.889
-1269.433
3.088
0.424
-0.312
-2.074
18.575
0.501
-17.223
-7.753
7.870
48.874
1.246
-54.492
-25.297
-2.704
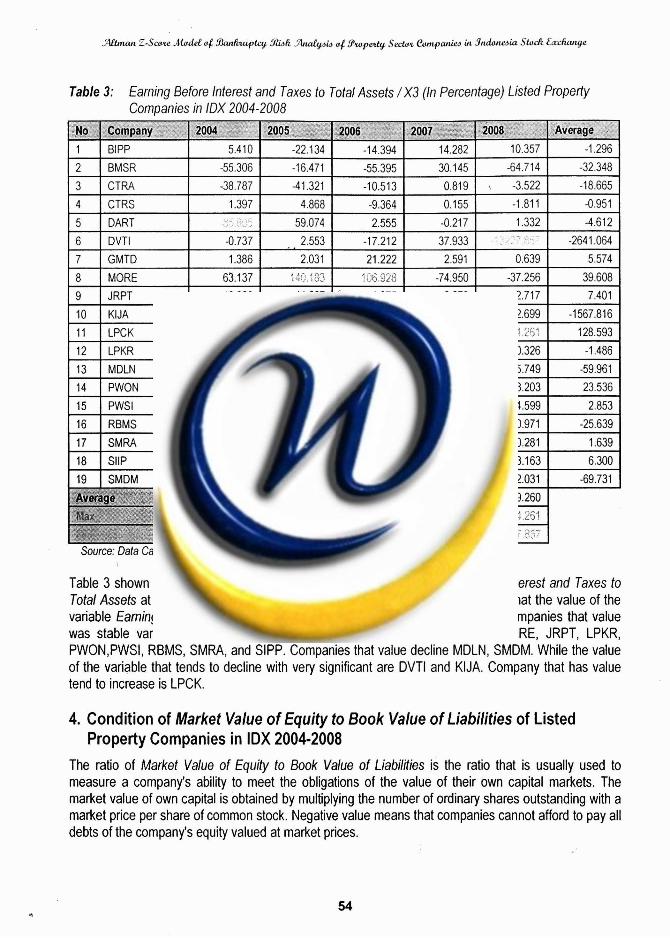
Table 3: Earning Before lnterest and Taxes to Total Assets /X3 (In Percentage) Listed Property Companies in IDX 2004-2008
No 1 Company 1 2004 1 2005 1 2006 ' 1 2007 I 2008 ( Average
BlPP I 5.410 1 -22.134 1 -14.394 1 14.282 1 10.357
BMSR -55 306 -16.471 -55 395 30 145 -64.714
CTRA -38 787 -41.321 -10 513 0 819 -3.522
CTRS 1.397 4.868 -9 364 0.155 -1.81 1
DART 59.074 2 555 -0.217 1.332
DVTl -0.737 . 2.553 -17.212 37.933
GMTD I 1.386 I 2.031 1 21.222 1 2.591 1 0.639
MORE 1 63.137 1 1Gi.193 1 lii6.928 1 -74.950 1 -37.256
JRPT 18.828 11.207 ' 1.975 2.278 2.717
KlJA -19.543 -,., - . :,& 20.316 -0.762 12.699 ., ,\ ,- < ..,. ,% ,,, . . ,
LPCK 34.657 49.068 -20.5071 3 z'ir ,..,u. :.~5 < ,4 ,:-. 1 -i.Lij i
LPKR -0.007 -6.91 1 -0.367 0.181 -0.326
MDLN 1 80.110 1 -8.803 1 -18.325 1 1 -5.749
PWON 1 63.747 1 49.219 1 5.381 1 -3.869 1 3.203 I
PWSl -5.130 -2.637 6.679 0.755 14.599
RBMS -3.504 -1 1.223 ~. * : ' 16.965 0 971
SMRA 7.515 1 0.123 1.- 0.601 I 0.239 1 -0.281
SMDM I 127.210 1 56.724 1 46.643 1 -337.100 1 -222.031
ce: Data Calculation
Table 3 shown can be seen that the movement of the variable Earnings Before lnterest and Taxes to Total Assets at every company is different. For 5 consecutive years can be seen that the value of the variable Earnings Before lnterest and Taxes to Total Assets tend to be stable. Companies that value was stable variables such as BIPP, BMSR, CTRA, CTRS, DART, GMTD, OMRE, JRPT, LPKR, PWON,PWSI, RBMS, SMRA, and SIPP. Companies that value decline MDLN, SMDM. While the value of the variable that tends to decline with very significant are DVTl and KIJA. Company that has value tend to increase is LPCK.
4. Condition of Market Value of Equity to Book Value of Liabilities of Listed Property Companies in IDX 2004-2008
The ratio of Market Value of Equity to Book Value of Liabilities is the ratio that is usually used to measure a company's ability to meet the obligations of the value of their own capital markets. The market value of own capital is obtained by multiplying the number of ordinary shares outstanding with a market price per share of common stock. Negative value means that companies cannot afford to pay all debts of the company's equity valued at market prices.
5. .7. ~ t t d i e b and .9L B. Jayanli 9jYWSb - V*, 3,.7mue 6
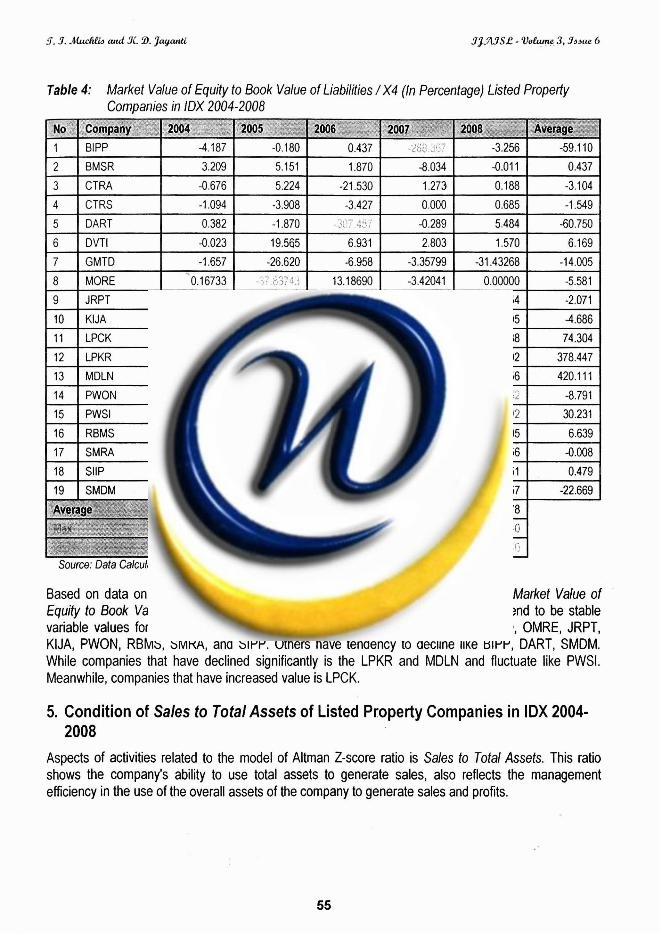
Table 4: Market Value of Equity to Book Value of Liabilities /X4 (In Percentage) Listed Property Companies in IDX 2004-2008
BlPP -4.187 -0.180 0.437 / ,. -3.256 -59.1 10
BMSR 3.209 5.151 1.870 -8.034 -0.01 1 0.437
CTRA -0.676 5.224 -21 530 1.273 0.188 -3.104
CTRS -1.094 -3.908 -3.427 0.000 0.685 -1.549
DART 0.382 -1.870 . -2% - c; - -0.289 5.484 -60.750
DVTl -0.023 19.565 6.931 2.803 1.570 6.169
GMTD -1.657 -26.620 -6.958 -3.35799 -31.43268 -14.005
MORE 0.16733 > 2 13.18690 -3.42041 0.00000 -5.581 - , A * -.
JRPT -7.220 -0.205 -1.756 -0.921 -0.254 -2.071
KIJA * n ( . ., +* -0.104 -0.072 0.212 0.605 4.686
LPCK 24.393 12.997 337 CtjS -7.962 5.038 74.304
LPKR 1887.750 0.432 4.731 0.712 -1.392 378.447
MDLN 2077.975 7.239 0.149 19.751 -3.656 420.1 1 1
PWON -12.968 0.669 12.614 -2.736 "< ,5;;2 -8.791
PWSl 1.71891 62.2~532 9.83105 67.39.703 9.93992 30.231
RBMS -0.259 -2.297 0.205 35.953 -0.405 6.639
SMRA 0.461 1.500 0.855 0.000 -2.856 -0.008
SllP -0.691 0.604 1.082 -0.053 1.451 0.479
SMDM 1 11.082 1 -0.867 1 -121.277 1 0.176 1 -2.457 1 -22.669 1
ce: Data Calculafion
Based on data on table 4, it can be seen that the movement value of the variable Market Value of Equity to Book Value of Liabilities in each company is different. Some companies tend to be stable variable values for 5 consecutive years such as BMSR, CTRA, CTRS, DIVI, GMTD, OMRE, JRPT, KIJA, PWON, RBMS, SMRA, and SIPP. Others have tendency to decline like BIPP, DART, SMDM. While companies that have declined significantly is the LPKR and MDLN and fluctuate like PWSI. Meanwhile, companies that have increased value is LPCK.
5. Condition of Sales to Total Assets of Listed Property Companies in IDX 2004- 2008
Aspects of activities related to the model of Altman Z-score ratio is Sales to Total Assets. This ratio shows the company's ability to use total assets to generate sales, also reflects the management efficiency in the use of the overall assets of the company to generate sales and profits.
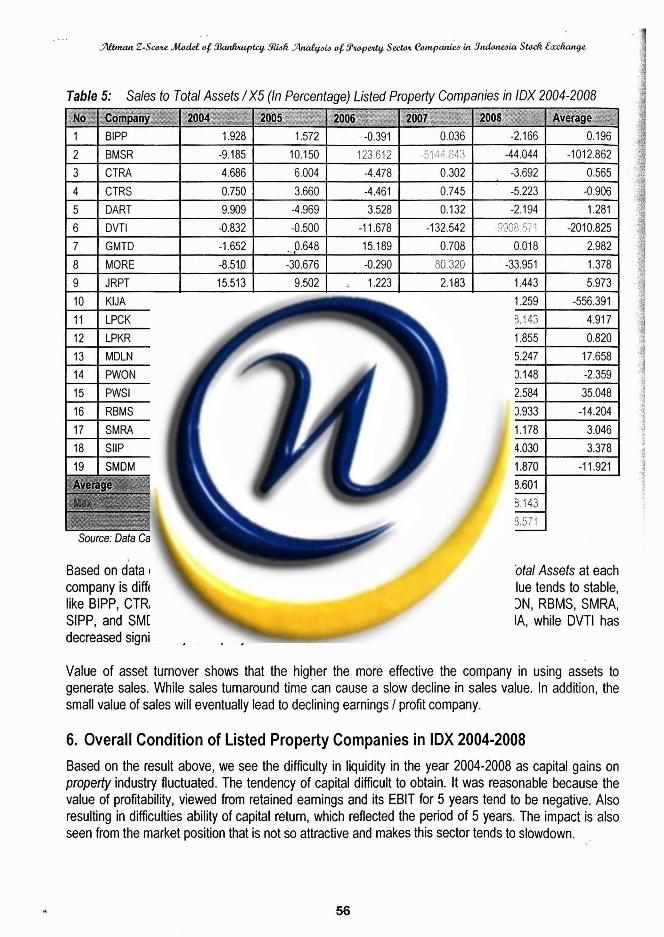
Table 5: Sales to Total Assets /X5 (In Percentage) Listed Property Companies in IDX 2004-2008
I 1 I BlPP 1.928 1 1.5727 -0 391 1 0.036 1 -2.166 1 0.196 ~ - . ..
2 BMSR -9.185 10.150 123,1312 .z.;:::.: -, : ,!;,!:,; -44.044 -101 2.862
3 CTRA 4.686 6.004 -4.478 0.302 -3.692 0.565
4 CTRS 0.750 3.660 -4.461 0.745 -5.223 -0.906
5 1 DART I 9.909 1 -4.969 1 3.528 1 0.132 1 -2.194 1 1.281
7 GMTD -1.652 P.648 15.189 0.708 0.01 8 2.982
8 MORE -8.510 -30.676 -0.290 50.320 -33.951 1.378
9 JRPT 15.513 9.502 1.223 2.183 1.443 5.973 10 KlJA
,.- --, r -7 . * .. 12.306 .-L;;L+. !4:j 6.900 -0.407 1.259 -556.391
11 LPCK 1.985 14.544 -3.076 2.988 8.143 4.917
12 1 LPKR I 0.346 1 1.632 1 -0.137 1 0.404 1 1.855 1 0.820 13 MDLN 9.412 32.448 -5.836 57.515 -5.247 17.658 14 PWON -8.800 -4.224 0.159 0.921 0.148 -2.359 15 PWSl 143.41 1 -6.823 81.355 45.289 2.584 35.048
16 RBMS 3.492 -24.846 ..53.527 5.926 0.933 -14.204
17 1 SMRA I 11.684 1 1.003 1 , 1.196 ) 0.168 1 1.178 1 3.046
Source: Data Calculafion
Based on data on table 5, can be seen that movement value of variable Sales to Total Assets at each company is different. However, for 5 consecutive years a lot of companies have value tends to stable, like BIPP, CTRA, CTRS, DART, GMTD, OMRE, JRPT, LPCK, LPKR, MDLN, PWON, RBMS, SMRA, SIPP, and SMDM. Companies that have tendency to decline are BMSR and KIJA, while DVTl has decreased significantly. Company with fluctuate value is PWSI.
Value of asset turnover shows that the higher the more effective the company in using assets to generate sales. While sales turnaround time can cause a slow decline in sales value. In addition, the small value of sales will eventually lead to declining earnings I profit company.
6. Overall Condition of Listed Property Companies in IDX 2004-2008 Based on the result above, we see the difficulty in liquidity in the year 2004-2008 as capital gains on properfy industry fluctuated. The tendency of capital difficult to obtain. It was reasonable because the value of profitability, viewed from retained earnings and its EBlT for 5 years tend to be negative. Also resulting in difficulties ability of capital return, which reflected the period of 5 years. The impact is also seen from the market position that is not so attractive and makes this sector tends to slowdown.
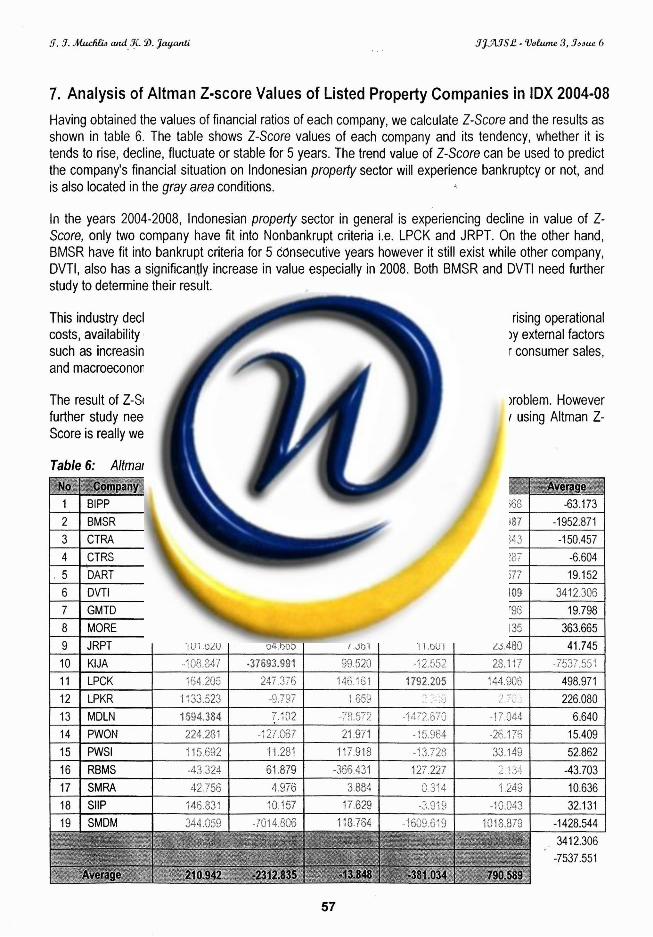
7. Analysis of Altman Z-score Values of Listed Property Companies in IDX 2004-08 Having obtained the values of financial ratios of each company, we calculate Z-Score and the results as shown in table 6. The table shows Z-Score values of each company and its tendency, whether it is tends to rise, decline, fluctuate or stable for 5 years. The trend value of Z-Score can be used to predict the company's financial situation on lndonesian property sector will experience bankruptcy or not, and is also located in the gray area conditions.
In the years 2004-2008, lndonesian property sector in general is experiencing decline in value of Z- Score, only two company have fit into Nonbankrupt criteria i.e. LPCK and JRPT. On the other hand, BMSR have fit into bankrupt criteria for 5 cdnsecutive years however it still exist while other company, DVTI, also has a significantly increase in value especially in 2008. Both BMSR and DVTI need further study to determine their result.
This industry decline can be influenced by many things, both internal factors such as rising operational costs, availability of raw materials, lack of qualified human resources, and influenced by external factors such as increasing corporate competition, instability of political conditions, low power consumer sales, and macroeconomic instability finance, and so on.
The result of Z-Score can be use to determined which company is having financial problem. However further study needed to conclude whether companies that fit into bankrupt category using Altman Z- Score is really went bankrupt, with the lndonesian condition and law.
Table 6: Altman Z-Score /Z Listed Property Companies in IDX 2004-2008
1 1 BlPP
15 PWSl 11 i 1.281 117.918 - + i.... 7 7-0 ~ i ; 33.149 52.862
16 RBMS -33.324 61.879 -.YLQ, G3 I & . .,> ;?< . L, . -43.703 -,.n 127.2'57
17 SMRA 42.75'6 i: - . 314 A I ,A+:; <- j., 10.636 --- ---. 18 SllP 146.831 3.157 17.629 :i l x . C G:C; :. ..10,043 32.131
12
13 14
3 i j ~
2 1 BMSR
LPKR
MDLN PWON
- i d J . \,~,, ' 'y: ?,:\ 7
-437,598 1 .?<I \,.,, ; . 25 1 -192.TSS 1 -5843.905 1 -3289.937 1 -1952.871 * -
1 .i 33.523 1594.384
224.287
1 .% :: ~5::
-\I I C -73: . , / . . : I
7.102
- i r .,jo? 3 27 ".-'
., ., . , "' 220
1,659 . .... d:% 7$( C--' ..: . .
21.971
: >..<g -63.173
'> ' ',. . . . . .>'
-1.1.72.570
- :.,..!e4 <> : "
.> - . ~ I . . .. .,7 7,344
-26.176
226.080
6.640 15.409
CONCLUSIONS AND RECOMMENDATIONS
Conclusions 1. Condition of financial ratios of property sector companies listed in IDX in the period 2004-2008 :
a. The average value of variables Working Capital to Total Assets of the years 2004-2008 fluctuates each year. The company that have maximum and minimum values of this variables is varies.
b. The average value of the variable Retained Earnings to Total Assets of the years 2004-2008 fluctuate each year. The company that have maximum and minimum values of this variables is varies.
Max Min
2004 BMSR PWON :
Max Min
d. The Average value of the variable Market Value of Equity to Book Value of Liabilities from years 2004-2008 tended to fluctuate each year. The company PWSl can maintain its position as
2008 DVTl BMSR
2005 BMSR XIJA
c. The average value of the variable EBlT to Total Assets of the years 2004-2008 tended to decrease each year. This means that the sector have decrease its capacity to produce profits from its operations. The company MORE which have 2 years as number one, has decline in the last two years and replace by LPCK that overall have good value of this variable. While thecompanies that has minimum value is varies.
number one on this variable. While thecompanies that has minimum value is varies. 2004 1 2005 1 2006 1 2007 1 2008 1
2004 MORE BMSR
I Max I MDLN I PWSl I LPCK I PWSl I PWSl I
2006 GMTD BlPP
Max Min
I Min I KlJA I MORE I DART I BlPP I PWON I
2007 SMDM BMSR
2005 MORE KlJA
2004 SMDM DART
2005 MORE KlJA
e. The average value of the variable Sales to Total Assets of the years 2004-2008 tended to fluctuate each year. The company that have maximum and minimum values of this variables is varies.
2006 RBMS CTRA
2006 MORE RBMS
2. The average value of Altman Z-score of property sector companies listed in IDX in the period 2004- 2008 is experiencing decline. Only two companies have fit into Nonbankrupt criteria i.e. LPCK and JRPT. On the other hand, BMSR have fit into bankrupt criteria for for 5 consecutive years. LPKR is tit into grey area. The result of Z-Score can be use to determined which company is having financial
2007 DVTl
SMDM
2007 LPCK MDLN
Max Min
2008 PWSl DVTl
2008 LPCK DVTl
2004 PWSl KlJA
2005 MDLN KlJA
2006 BMSR RBMS
2007 MORE BMSR
2008 LPCK DVTl
5.3. AucApid and 3C 3. anyanti 3 w S k - V h 3, .%due 6
problem. However further study needed to conclude whether companies that fit into bankrupt category using Altrnan Z-Score is really went bankrupt, with the lndonesian condition and law.
Suggestions 1. The result of Z-Score can be use to determined which company is having financial problem. 2. Further study needed to conclude whether companies that fit into bankrupt category using Altrnan
Z-Score is really went bankrupt, with the lndonesian condition and law.
BIBLIOGRAPHY . . Altrnan, Edward I., 2000. Predicting Financial Distress of Companies. Revisiting The Z-Score and Zeta
Models. www.Default Risk.com Brigharn F, Eugene. Ehrhardt C, Michael. 2002.' Financial Management (Theory and Practice). Tenth
Edition. Thomson Learning Inc. Darsono dan Ashari. 2005. Pedoman Prakfis Memahami Laporan Keuangan. Sernarang: ANDI. Dedhy Sulistiawan, Liliana, 2007. Analisis Teknikal Modern pada Perdagangan Sekuritas. CV. Andi
Offset, Yogyakarta. Gitrnan, Lawrence J. 2006. Principle of Managerial Finance. 8th ed, addison Wesley. Printed in The US. Hadad, Muliarnan, Murnboh Santoso dan Ita Rulina. 2003. lndikator Kepailitan di Indonesia. Jakarta;
Bank Indonesia Husnan, Suad. 2001. Dasar-Dasar Teori Portofolio dan Analisa Sekuritas Edisi Kedua. UPP AMP
YKPN, Yogyakarta Husnan, Suad. Enny Pudjiastuti. 2004. Dasar-Dasar Manajemen Keuangan. Edisi Keernpat. Cetakan
Pertarna. UPP AMP YKPN, Yogyakarta lkatan Akuntan Indonesia. 2002. Standar Akuntansi Keuangan, per 1 April 2002. Jakarta: Salernba
Ernpat. lkatan Akuntan Indonesia. 2004. Standar Akuntansi Keuangan, per 1 Oktober 2004. Jakarta: Salernba
Ernpat. Lesrnana, Rico, Rudy Surjanto. 2004. Financial Performance Analyzing. Jakarta: PT. Eek Media
Komputing Grarnedia Martono dan Agus Harjito. 2002. Manajemen Keuangan. Yogyakarta: Ekonisisa. Munawir, S. 2002. Analisis Laporan Keuangan. Edisi Keernpat. Yogyakarta: Liberty Nazir, Moharnrnad. 2003. Metode Penelitian. Jakarta: Ghalia Indonesia. Nazir, Moharnrnad. 2005. Metode Penelitian. Jakarta: Ghalia Indonesia. Nur lndrianto dan Barnbang Suporno. 1999. Metodologi Penelitian Bisnis, Edisi Pertama. Yogyakarta.:
BPFE. Rahrnat Triaji. 1999. Penerapan Z-Score Untuk Memprediksi Kesulitan Keuangan dan Kebangkrutan
Perbankan Indonesia. . . Ridwan S. Sundjaja, lnge Barlian. 2002. Manajemen Keuangan I. Edisi Kelirna. Cetakan Kedua.
Literata Lintas Media, Jakarta Sofyan, Syafri. 2004. Analisis Kritis Afas Laporan Keuangan. Edisi 1-5. Jakarta: PT. Raja Grafindo
Persada Sofyan, Syafri. 2006. Analisis Kritis Atas Laporan Keuangan. Edisi 1-5. Jakarta: PT. Raja Grafindo
Persada Sugiyarso. 2006. Manajemen Keuangan. Yogyakarta : Media Pressindo WWW. bapepam.qo.id tf~ww. bi.ao.id

dCcman ZSaw Atadd a,! 3Iadhqlfy %R Aa&iis a,! &apez& Sec&a Civnpanics in 3 A i a Stodl Earlfanjlc
www.qm1e.com www.idx.co.id www.inilah.com www. kornpas.com www.vivanew~.corn www.~ahoo.comlfinance http:liwww.bankcruptcyaction.com!insolart1 .htrn, http:ilwww.ventureline.comiqlossary.htm. http:llen.wikipedia.orqlwiki/Z-Score . Financial Analysis Tool