alternatives to slash and burn in indonesia: facilitating ... · alternatives to slash and burn in...
TRANSCRIPT


Alternatives to Slash and Burn in Indonesia: Facilitating the
development of agroforestry systems
Phase 3 Synthesis and Summary Report
Editors:
Fahmuddin Agus and Meine van Noordwijk
W O R L D A G R O F O R E S T R Y C E N T R E ( I C R A F )

Correct citation:
Fahmuddin Agus and Meine van Noordwijk (Editors). 2005. Alternatives to Slash and Burn inIndonesia: Facilitating the development of agroforestry systems: Phase 3 Synthesis and SummaryReport. World Agroforestry Centre, Southeast Asia, Bogor, Indonesia.
Dr. Fahmuddin Agus is the head of Soil Research Institute, Jln. Juanda 98, Bogor 16123, Indonesia andthe National coordinator of the Alternative to Slash an Burn.
Dr. Meine van Noordwijk is the Southeast Asia Regional Coordinator of World Agroforestry Centre;ICRAF, PO Box 161, Bogor 16001, Indonesia.
Disclaimer and Copyright
ICRAF holds the copyright to its publications and web pages but encourages duplication, withoutalteration, for non-commercial purposes. Proper citation is required in all instances. Information ownedby other providers and requiring permission is marked as such. Website links provided by our site willhave their own policies that must be honoured. The information provided by ICRAF is, to the best ofour knowledge, accurate although we do not warranty the information nor are we liable for anydamages arising from use of the information. ICRAF maintains a database of users although thisinformation is not distributed and is used only to measure the usefulness of our information. Withoutrestriction, please add a link to our website www.worldagroforestrycentre.org/sea on your website orpublication.
World Agroforestry Centre (ICRAF)Transforming Lives and Landscapes International Centre for Research in Agroforestry Southeast Asia Regional Office Jl. CIFOR, Situ Gede, Sindang Barang, Bogor 16680 PO Box 161, Bogor 16001, Indonesia Tel: +62 251 625415; fax: +62 251 625416; Email: [email protected] http://www.icraf.cgiar.org/sea or http://www.worldagroforestrycentre.org/sea
ISBN 979-3198-18-4
Cover photo:
A complex landscape of Sumberjaya, Lampung; Flowering coffee; Coffee with Arachis pintoi covercrop; Multistrata coffee system (Photographs by: F. Agus)
Design: Dwiati Novita Rini
Table of Contents
TABLE OF CONTENTS i
I. SUMMARY OF ALTERNATIVE TO SLASH AND BURN (ASB), PHASE 3: FACILITATING THE DEVELOPMENT OF AGROFORESTRY SYSTEMS 1Background and objectives 1Results 3Implications and Benefits of Research 4Likely Direction of Future Research and Development 5Collaborating Research Institutions 5Publications Based on ASB3 Research in Indonesia 6
II. TREES THAT PRODUCE MULCH LAYERS WHICH REDUCE RUN-OFF AND SOIL LOSS IN COFFEE MULTISTRATA SYSTEMS 9Abstract 9Introduction 10Research Approach 12The Expected Output 13Part I. Tree Diversity and Litter Thickness Under Different Land Use Systems Related
to Population Density of Earthworm, and Soil Physical Improvements 13Introduction 13Methods 14Result and Discussion 17Part 2. Overland Flow and Soil Loss Under Different Land Use Systems 26Introductions 26Methods 26Results 27Conclusions 28References 29
III. CONSERVATION MEASURES AND VARIATION IN SOIL SUSCEPTIBILITY TO EROSION 31Abstract 31Introduction 31Materials and Methods 32Result and Discussion 33
Soil loss and runoff under different soil conservation measures 33Relationship between Soil Characteristics and Soil Loss on Coffee Base Farming
System in Sumberjaya 34Conclusion 37References 38
i

IV. PARTICIPATORY TRIALS FOR THE REFINEMENT OF CONSERVATION PRACTICES 39Abstract 39Introduction 39Material and Methods 40Result and Discussions 41Conclusions 45References 46
V. DELINEATION OF EROSION PRONE AREAS IN SUMBERJAYA, WEST LAMPUNG 47Abstract 47Introduction 47Materials and Methods 48Results and Discussion 51
Landform 51Parent materials and Soil Classification 53Soil properties 57Land Cover 57Erosion susceptibility map 58
Conclusions 60References 60
VI. RUNOFF AND SEDIMENT YIELD FROM COFFEE MICRO-CATCHMENT UNDER HUMID TROPICAL CLIMATE OF LAMPUNG, INDONESIA 63Abstract 63Introduction 63Materials and Methods 64
Description of the study area 64Rainfall and streamflow 66Sediment yield 67
Results and Discussion 67Rainfall 67Sediment yield 68Hydrograph component 69Water budget 69
Conclusions 70Acknowledgement 70References 70
VII. MULTISTRATA COFFEE SYSTEM AS AN ALTERNATIVE TO SUSTAINSUMBERJAYA ECOLOGICAL SYSTEM 73
Abstract 73Introduction 73Materials and Methods 73
ii

Result and Discussion 74Canopy coverage and tree strata 74Net rainfall 76Potential evaporation 77Actual evaporation 77Coffee growth and production 79
Conclusions 81References 81
iii


I. Summary Alternative to Slash and Burn (ASB), phase 3:Facilitating the development of agroforestry
systems
Fahmuddin Agus1) and Meine van Noordwijk2)
1) Soil Research Institute, Jln. Juanda 98, Bogor 16123, Indonesia2) International Centre for Research in Agroforestry, Southeast Asia Regional Office, Jl. CIFOR,
Situ Gede, Sindang Barang, Bogor 16680, PO Box 161, Bogor 16001, Indonesia
Background and objectives
Conversion of tropical rain forest to other land uses is a major concern at global level. Lossof globally unique biodiversity, release of large amounts of stored carbon to the atmosphere,immediate health and visibility problems caused by the haze during forest conversion areonly part of the story. The loss of forests as a regulator of water flows and as provider oflocal income are a concern at more local scales. The 'Alternatives to Slash and Burn' (ASB)program was started to test ways to reduce the loss of tropical forests, by enhancing theintensity of agricultural use in already converted lands, and/or to reduce the loss of 'forestfunctions' in land uses that qualify as 'modified' or 'domesticated' forests. The first approachcame to be known as a 'segregate' approach (intensive agriculture + forest), the second as an'integrate' pathway of development. The ASB program started activities in Indonesia in 1993and first embarked on a diagnostic phase, to characterize land use and the type of problemsthat are perceived by various stakeholders. In the second phase a more detailed analysis wasmade of the trade-offs between local and global concerns. In between local stakeholdersconcerns (income, food security) and global concerns (biodiversity, carbon stocks), a 'missingmiddle' was identified: impacts on what is broadly called 'watershed functions'.
In phase 1 and 2 of the Alternatives to Slash and Burn program in Indonesia a number offarmer-developed land use practices were described and analyzed for benchmark areas inLampung and Jambi that developed as alternative to annual-crop-based agriculture. Thesesystems, broadly indicated as 'agroforests' provide income from domesticated forest and treesystems, with returns to labour exceeding those for upland annual crops, and withenvironmental values (carbon stocks, biodiversity) that are superior to short rotationcrop/fallow systems. In the research, however, little attention was given to the broad categoryof 'watershed functions', while the main emphasis was on the lowland peneplain and lowerfoothills where erosion is not a major issue. To complement the Phase 1 and 2 results, afurther effort was made to better understand the relationship between forests and derivedland uses and these watershed functions - aiming again for a combination of a diagnosticphase ('what if any are the real problems?') and one aimed at practical solutions at farmlevel, in the context of existing policies for the forest-agriculture interface.
1
As part of the agenda for phase 3 a new benchmark area in the mountain zone ofSumatra was selected (in Sumberjaya, West Lampung Province, Indonesia) where conflictsbetween farmers and state forestry officials had led to large scale evictions. After the politicalchange ('reformasi') farmers returned to the area. As the conflicts had been articulated on thebasis of concerns over watershed functions of conversion to coffee-based production systems,the main issue was to analyze the relationship between land use and watershed functions.The research approach chosen for the area is based on a 'negotiation support' system (NSS),that combines tools for predicting the impacts of land use and landscape configuration onmultistakeholder criteria and quantifiable indicators, with a process of negotiation betweenstakeholders of spatial land use plans and generic regulation and incentive systems.
The research reported here focuses on the options farmers have for improving their farmsand recovering forest functions, by enhancing 'landscape filters' and increasing agrodiversity.Land use practices and technologies that generate income as well as manage the naturalresources are needed. The Sumberjaya site has a complex settlement history, with phases ofactive government involvement in settling farmers (as a demobilization site for the army ofIndonesias struggle for independence), phases of spontaneous migration and phases ofeviction of 'squatters' from state forest lands. While some of this historical context is uniqueto the site, the ambivalent views of government on agricultural development in former forestareas are widespread - and reflect the problem of providing income opportunities for a largepopulation, along with maintenance of essential environmental services such as water flowsand the opportunities to use hydro-power. The situation in Sumberjaya reached an openconflict stage in the early 1990's, when the government started a forceful eviction programaffecting farmers (a mix of spontaneous migrants from densely populated Java and officialsettlement programs) and uprooting their well-developed coffee trees to replace them withCalliandra shrubs for 'reforestation'. A substantial part of the land in Sumberjaya is classifiedas 'protection forest' zone, and the perception was that reforestation would secure waterflows that the coffee gardens could not provide.
Coffee has been a primary agricultural product of Sumberjaya farmers for nearly acentury. The success of coffee plantation in this area is indicated by the expansion ofcultivated land for coffee. In 1970, about 60% of the area coverage was still natural forest.But by the early 1990's only some 15% of forest cover was left, at the start of the evictionperiod. Much of the later coffee expansion occurred on land registered as protection forest.The shift in utilization from forest to coffee-based farming systems has raised concern amongmany stakeholders that it may create serious impact to the deterioration of forest functions,declining of soil productivity, land degradation, and severe soil erosion. The government thatholds the land title evicted people who farmed and lived in the protection forest toneighboring sub-districts (the infertile lowland peneplain of the northern Lampung ASBbenchmark area or the swamp forest zone where land clearing fires cause intensivesmoke/haze issues.
After the political transition from the New Order Government in 1997 to the'Reformation' period, resettled farmers returned to Sumberjaya and reclaimed their right touse the land, replanting the areas with new coffee trees and/or grafted the still active stumpsof the old coffee. In the new political reality and after a substantial devolution of governmentauthority to the district level, an approach based on negotiation and accommodation ofmultiple perspectives was needed.
In the context of the new forestry law, a Ministerial Decree of the Ministrer of Forestry(No. 31, issued in February 2001) on Community Forest created the option of grantingfarmers semi permanent (could be as long as 25-30 years) land title to utilize forest land
2
provided that they can propose and implement judicious land management systems forrestoring the forest function. This decree provided an excellent basis for the negotiations inSumberjaya to operate, although special permission was needed to apply this process ondegraded 'protection forest' lands.
The Sumberjaya case this became an example of how the lack of negotiation amongstakeholders in the tropics led to conflicts over land use in the past, and how new approachescould lead to a 'win-win' for environment and development, relative to that low baseline.ICRAF Southeast Asia, in collaboration with National Agricultural Research Services(NARS) and Non Government Organizations (NGOs), facilitated the negotiations in both thetechnical and institutional aspects, and the research reported here is part of that largerprocess of understanding the options and consequences of land use decisions.
This research was designed to address the following objectives:
(i) evaluation of promising management practices that meet farmers' preferences whilelowering soil loss to tolerable level,
(ii) validation and refinement of the management practices considered in the first objective,
(iii) evaluation of the role of litter layers, as generated from different stages and systems ofcoffee farm, on soil structure, run-off and soil loss, and
(iv) delineation of areas in the Way Besai Watershed based on the levels of susceptibility toerosion.
This series of research was conducted in Way Besai watershed, with borders that almostcoincide with that of Sumberjaya Sub district, West Lampung District, Lampung Province,Indonesia (4°45' to 5°15' S and 104°15' to 104°45' E). The elevation of Sumberjaya rangesfrom 700 to 1,700 m asl, but our research was conducted in the sites with 750 to 900 m aslelevation. Soils were predominated by Inceptisols (Humitropepts, Dystropepts, Dystrandepts,and Tropaquepts) and to a lessor extent, Ultisols (Hapludults) and Entisols (Troporthents).This research includes plot and micro catchment scale erosion measurement, evaluation oftree contribution to litter and soil fertility rejuvenation, and farmer-led test of soilconservation treatments in coffee-based farming systems.
Results
Results show that coffee trees can make a significant contribution to controlling erosion. Itseffectiveness is maximized when the coffee is planted in combination with other trees in amultistrata system because of a complex canopy architecture that protects soil surface againstheavy raindrops and the formation of tree litter on the floor of the garden or when additionalconservation measures such as cover crops are used on young coffee farms.
Agroforestry/soil conservation options articles and booklets and the map of soil erosionsusceptibility are among the key deliverables that this research can offer in the negotiation.Moreover, several research papers have been and will be contributing to agroforestry-relatedliteratures.
Activity A (Table 1) has summarized background information of the case study site andprovided a range of conservation options in coffee based agroforestry systems which are verycentral in the NSS. Farmers will know wider options than what they have been exposed toand practicing in their localities while the local forestry and agricultural services will alsohave reference of wider conservation options that can provide environmental services.
3

Plot and micro catchment scales measurements (activities B and C3) have producedconvincing relationship of the effects of different stages of coffee growth and different soilconservation treatments on soil erosion and runoff. Soil loss in the Bodong site was thehighest (about 85 t ha-1 yr-1) under 1 year old coffee and sharply dropped as coffee canopydeveloped (coffee gets older). Under 5 year or older coffee, soil loss was basically within thetolerable level and multistrata coffee tended to be more protective against soil loss thanmonoculture coffee. Under 12 years old or multistrata coffee (which generally also coincideswith 8 years or older coffee), soil loss was basically as low as that under forest. Thusadditional soil conservation measures do not reduce soil loss any further.
Equally important, these activities have given information of how wide the variation ofsoil properties was and how important it was in influencing soil susceptibility to erosion. Forinstance, under 3 to 4 year coffee stand and about 500 mm of rainfall in 3 to 3,5 monthsperiod of measurement, soil loss was negligible (<2 t ha-1) in Tepus and Laksana sites, but itwas about 37 t ha-1 in Bodong site. This difference was attributed to distinct differences insoil structure. Drainage pore for 0 to 20 cm soil layer, for example, was between 6 to 12 %(v/v) in Bodong and about 23 to 32 % in Tepus and Laksana sites.
Because of the variation, we developed a map of soil susceptibility to erosion (ActivityB.2.1.a, Table 1). This map can support the local government in prioritizing areas forimplementing soil conservation.
Under Activity C3 we have learned the importance of tree litters produced by old and/ormultistrata coffee in protecting soil surface against soil loss, reducing runoff, increasing soilorganic carbon and increasing soil macropores. These qualities are close to that provided bythe natural forest, suggesting that facilitating the local farmers to maintain tree based,multistrata land use system on the steep forest margin, is a judicious option and this willspeed up the recovery of forest functions.
Implications and Benefits of Research
These findings implied that the intervention made by the government in mid 1990s byeviction of the farmers and replacement of coffee to Calliandra callothirsus was out of focusand only harmed the farmers, because, they in general, had almost no choice to earn a livingin other sectors. Erosion and runoff reduction, the two forest functions most commonlyvoiced by the government have been clearly reduced as coffee (and other trees in themultistrata system) canopy and litter on the coffee floor develop. Additional conservationintervention is necessary only for selected sites with low infiltration capacity/low porosity.Multistrata coffee system is the closest to forest in its performance and in providingenvironmental services. Facilitation of the development of multistrata systems appears to bethe wisest way the government should do forward.
This research also suggest that there are options of two-pronged soil conservation optionsthat not only provide services to the public, but also promise private benefits important forfarmers such as improvement or sustainability of soil fertility. These options include the useof cover crops, the use of shade legume trees and multistrata coffee systems. Both communityand government efforts should prioritize in facilitation of these two-pronged interventions forsmoother negotiation.
At the end of this three year implementation, this research has delivered not only scientificexplanations for getting to grips with some of the deeprooted myths about forests and water,
4

but also provided a range of wider options in soil conservation as well as delineation of the'hot spots' in the watershed where extra efforts for soil conservation are actually needed.
Likely Direction of Future Research and Development
The most logical follow-up of the current research findings is integration these finding intoexisting development projects such as the GNRHL (Gerakan Nasional Rehabilitasi Hutandan Lahan; the national level watershed management program, focused on reforestation andconservation) and HKm (Hutan Kemasyarakatan; Community Forest Program); both areunder the Ministry of Forestry. This integration should be using the farmer-led approach, inwhich farmers and the rest of the community, with facilitation from researchers and localextension and NGO, will take initiatives in voicing the local natural resource problems,develop alternatives of problem solving, implement and evaluate the performance of naturalresource management. The results of research presented in this report (erosion susceptibilitymap and technology options) could be used to assist farmers in their selection of technologyand the facilitating agencies (government and non-government) in assisting the farmers. Thisapproach, if successful, will revamp the current, mostly blanket recommendationimplemented in the two programs.
Furthermore, valuation of environmental services from different management systems, andformulation of reward mechanisms for the service providers, will also be a very importantaspect to study.
Collaborating Research Institutions
This research is implemented by NARS under the coordination of ASB-Indonesia (ICRAF SEAsia). The collaborating NARS and the research topics undertaken are listed in Table 1.
Table 1. Activities and implementing institutions.
Remarks: SRI = Soil Research Institute, Bogor; Unibraw = University of Brawijaya, Malang, East Java ;Unila = Universitas Lampung, Bandar Lampung.
5
Title Implementing Institution/evolution
Identification and selection of profitable and environmentally-benign conservation measures.
ICRAF (2001). The results was published in a booklet, Agus, Gintings and van Noordwijk (eds.) (2002).
Validation and refinement of conservation/agroforestry practices
Paired plot farmer participatory trials SRI (Aug’01-Aug 04) Validation of soil erosion prediction and refinement of conservation measures
Plot scale soil erosion measurement under different conservation systems
SRI (Aug’01-Aug. ’03)
Delineation of erosion prone areas in Sumberjaya SRI (Aug’03-Aug ’04) Micro-catchment scale soil loss as affected by soil conservation practices
Unila (Aug’01-July 04)
Evaluation of resource use, sustainability, and profitability of tree crop production systems
Village-level production of quality planting material Tree domestication program, conducted by under ICRAF-Winrock collaboration
Interaction of tree crops with existing crops Unila (Aug’01-July 02) Tree diversity in the resilience of multi-strata agroforestry systems (litter function under different coffee systems)
Unibraw (Aug’01-Aug’04)

Publications Based on ASB3 Research in Indonesia:
Proceedings
Agus F, and van Noordwijk M (eds.). 2005. Alternatives to Slash and Burn in Indonesia:Facilitating the development of agroforestry systems, Phase 3 Synthesis and SummaryReport. Proceedings of a Workshop held in Bogor, Indonesia 16 August 2004. WorldAgroforestry Centre, Southeast Asia. Bogor, Indonesia. (This volume).
Scientific Article
Ai Dariah. 2004. Erosi dan Aliran Permukaan pada Lahan Pertanian berbasis Kopi diSumberjaya, Lampung Barat (Erosion and Runoff in Coffee Based System inSumberjaya, West Lampung. PhD Dissertation. Bogor Agricultural University, Indonesia.(In Indonesian with English Summary).
Ai Dariah, Agus F, Arsyad S, Sudarsono, and Maswar, 2004. Erosi dan aliran permukaanpada lahan pertanian berbasis tanaman kopi di Sumberjaya, Lampung Barat (Soil lossand runoff on coffee based farmland in Sumberjaya, West Lampung). Agrivita 26(1):52-60. (In Indonesian)
Hairiah K, Suprayogo, D, Widianto, Berlian, Suhara, Mardiastuning A, Widodo RH,Prayogo C, and Rahayu S. 2004. Alih guna lahan hutan menjadi lahan agroforestriberbasis kopi: ketebalan seresah, populasi cacing tanah dan makroporositas tanah (Landuse conversion from forest to coffee based agroforestry: litter thickness, earth wormpopulation, and soil macroporosity). Agrivita 26(1):68-80. (In Indonesian)
Hairiah K , Suprayogo D, Widianto, Widodo R H, Van Noordwijk M, 2004. 'Conversion offorest to coffee-based Agroforestry in Sumberjaya, West Lampung, Indonesia: Litterlayer, population density of earthworm and soil macroporosity'. Paper presented in aworkshop of the International Union of Forest Research Organizations (IUFRO). Forestsand Water in Warm, Humid Asia. July 10-12, 2004, Kota Kinabalu, Sabah, Malaysia.
Hairiah K, Sulistyani H, Suprayogo D, Widianto, Purnomosidhi P, Widodo R H, and VanNoordwijk M, 2004. Litter layer residence time in forest and coffee agroforestry systemsin Sumberjaya, West Lampung. Forest Ecology and Management (Submitted to ForestEcology and Management).
Suprayogo D, Widianto, Purnomosidi P, Widodo RH, Rusiana F, Aini ZZ, Khasanah N, andKusuma Z. 2004. Degradasi sifat fisik tanah sebagai akibat alih guna lahan hutanmenjadi sistem kopi monokultur: kajian perubahan makroporositas tanah (Degradationof soil physical properties as caused by land use conversion from forest to monoculturecoffee farm: a macroporosity study). Agrivita 26(1):60-68. (In Indonesian).
Widianto, Suprayogo D, Noveras D , Widodo R H, Purnomosidhi P dan Van Noordwijk M,2004. Alih guna lahan hutan menjadi lahan pertanian : Apakah fungsi hidrologis hutandapat digantikan sistem kopi monokultur? (Land use coversion from forest to coffeefarm: Can monoculture coffee restore the forest functions?) Agrivita 26 (1) : 47-52. (InIndonesian)
6

Booklet
Agus F, Gintings ANg dan van Noordwijk M. 2002. Pilihan teknologi Agroforestri/konservasi tanah untuk areal pertanian berbasis kopi di Sumberjaya, Lampung Barat(Agroforestry/soil conservation technology options for coffee based farming area inSumberjaya,Lampung). International Centre for Research in Agroforestry, SoutheastAsia Regional Research Programme, Bogor. (www.worldagroforestrycentre.org/sea ). (InIndonesian).
Hairiah K, Widianto, Suprayogo D, Widodo, RH, Purnomosidhi P, Rahayu S, and vanNoordwijk M. 2004. Ketebalan Seresah sebagai Indikator Daerah Aliran Sungai (DAS)Sehat (Litter thickness as an indicator of healthy watershed). 41 p. World AgroforestryCentre, South East Asia, Bogor. Indonesia. (www.worldagroforestrycentre.org/sea ). (InIndonesian)
Related Proceedings
Agus F, van Noordwijk M, and Farida. 2004. Hydrological Impact of Forest, Agroforestryand Upland Cropping as a Basis for Rewarding Environmental Service Providers,Proceedings, Roundtable Discussion in Padang and Field Trip to the catchments ofSingkarak and Maninjau Lakes, West Sumatra, Indonesia, 26-28 February 2004. WorldAgroforestry Centre, South East Asia, Bogor, Indonesia.
Agus F, van Noordwijk M, and Farida. 2004. Dampak Hidrologis Hutan, Agroforestri, danPertanian Lahan Kering sebagai Dasar Pemberian Imbalan kepada Penghasil JasaLingkungan. Prosiding Lokakarya di Padang/Singkarak, Sumatera Barat, Indonesia, 25-28 Pebruari 2004. World Agroforestry Centre, South East Asia, Bogor, Indonesia.(Indonesian version).
7

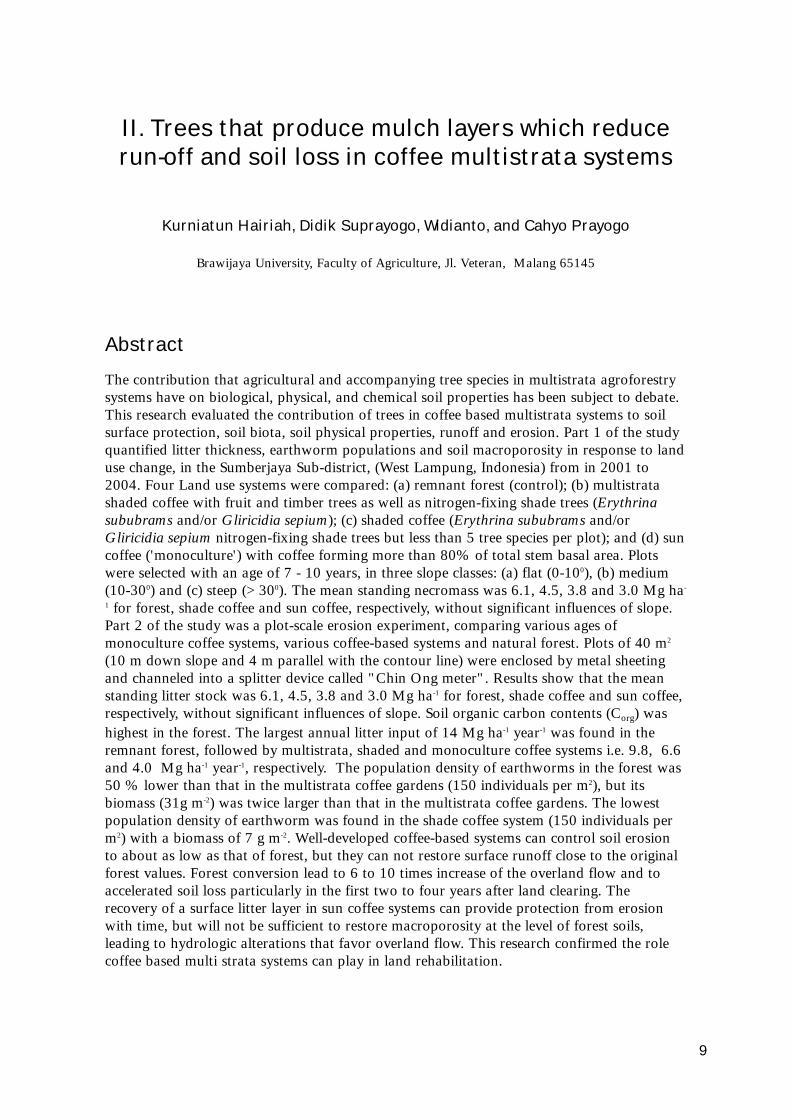
II. Trees that produce mulch layers which reduce run-off and soil loss in coffee multistrata systems
Kurniatun Hairiah, Didik Suprayogo, Widianto, and Cahyo Prayogo
Brawijaya University, Faculty of Agriculture, Jl. Veteran, Malang 65145
Abstract
The contribution that agricultural and accompanying tree species in multistrata agroforestrysystems have on biological, physical, and chemical soil properties has been subject to debate.This research evaluated the contribution of trees in coffee based multistrata systems to soilsurface protection, soil biota, soil physical properties, runoff and erosion. Part 1 of the studyquantified litter thickness, earthworm populations and soil macroporosity in response to landuse change, in the Sumberjaya Sub-district, (West Lampung, Indonesia) from in 2001 to2004. Four Land use systems were compared: (a) remnant forest (control); (b) multistratashaded coffee with fruit and timber trees as well as nitrogen-fixing shade trees (Erythrinasububrams and/or Gliricidia sepium); (c) shaded coffee (Erythrina sububrams and/orGliricidia sepium nitrogen-fixing shade trees but less than 5 tree species per plot); and (d) suncoffee ('monoculture') with coffee forming more than 80% of total stem basal area. Plotswere selected with an age of 7 - 10 years, in three slope classes: (a) flat (0-100), (b) medium(10-300) and (c) steep (> 300). The mean standing necromass was 6.1, 4.5, 3.8 and 3.0 Mg ha-
1 for forest, shade coffee and sun coffee, respectively, without significant influences of slope.Part 2 of the study was a plot-scale erosion experiment, comparing various ages ofmonoculture coffee systems, various coffee-based systems and natural forest. Plots of 40 m2
(10 m down slope and 4 m parallel with the contour line) were enclosed by metal sheetingand channeled into a splitter device called "Chin Ong meter". Results show that the meanstanding litter stock was 6.1, 4.5, 3.8 and 3.0 Mg ha-1 for forest, shade coffee and sun coffee,respectively, without significant influences of slope. Soil organic carbon contents (Corg) washighest in the forest. The largest annual litter input of 14 Mg ha-1 year-1 was found in theremnant forest, followed by multistrata, shaded and monoculture coffee systems i.e. 9.8, 6.6and 4.0 Mg ha-1 year-1, respectively. The population density of earthworms in the forest was50 % lower than that in the multistrata coffee gardens (150 individuals per m2), but itsbiomass (31g m-2) was twice larger than that in the multistrata coffee gardens. The lowestpopulation density of earthworm was found in the shade coffee system (150 individuals perm2) with a biomass of 7 g m-2. Well-developed coffee-based systems can control soil erosionto about as low as that of forest, but they can not restore surface runoff close to the originalforest values. Forest conversion lead to 6 to 10 times increase of the overland flow and toaccelerated soil loss particularly in the first two to four years after land clearing. Therecovery of a surface litter layer in sun coffee systems can provide protection from erosionwith time, but will not be sufficient to restore macroporosity at the level of forest soils,leading to hydrologic alterations that favor overland flow. This research confirmed the rolecoffee based multi strata systems can play in land rehabilitation.
9

Introduction
About 70 years ago Sumberjaya was almost completely covered by forest. Around 1990 theforest was converted into agricultural land by Semendo farmers (Verbist, 2001). They mostlypracticed a shifting cultivation form of coffee production. Later this system developed intointensive and permanent coffee systems, mainly by migrants from Java causing a higherpressure on land (Budidarsono, 2000). Expansion of coffee systems into the steeper landscreated a more serious soil erosion problem, especially where intensive coffee systems withintensive weeding were involved. Forest cover remained only on very steep slopes (steeperthan 60%) and was by law declared as watershed protection forest by the state. Expulsion ofcoffee farmers from the protection forest zone was followed by attempts to reforestation withCalliandra calothyrsus, a fast growing leguminous tree species in mid 1990s. Growing needfor agricultural land causes frequent re-opening of these Calliandra bush lands, especiallyafter the 'reformasi' period in 1998, where the state institutions lost most of their control onland. But a situation of conflict between the State Forest Agency and farmers led touncertainty among farmers in managing the land properly. Currently, a process of'negotiation' and 'community forest management' look at multistrata coffee systems as abasis for compromise, allowing economically attractive opportunities for production, whilemaintaining the watershed protection functions of the protection zone.
According to the available data, conversion of mono-culture coffee into multistratasystems was a trend under conditions of secure land tenure. Economic analysis indicates longterm benefits of these systems that exceeds the short term gains of monoculture coffee. Mostmultistrata coffee systems are using various legumes as shading trees such as Gliricidiasepium, Erythrina orientalis, or Leucaena leucocephala. These systems have also beenpracticed widely for decades in Java, the lowland peneplain of Lampung around Kotabumi,and other places in Indonesia. In many areas, this simple agroforestry systems evolved into amore complex system by planting more fruit tree species such as Artocarpus heterophyllus(jack fruit), Nephelium lappaceum (rambutan), Gnetum gnemon (Gnetum) and other multi-purpose tree species (MPTS). The positive effect of the complex agroforestry systems to theenvironment are mainly maintaining soil organic matter content, replenishing soil nutrientsthrough tree contribution of litter and decayed roots, and reducing run-off and erosionthrough a better soil structure.
On sloping land, ground cover provided by plant litter ('mulch') improves water storage,regulates the microclimate, provides food for the soil organisms that improve soil structureand infiltration, and protects the soil surface against raindrop impact (splash) which causesthe breakdown of aggregates to transportable sizes. This mulch-based strategy of erosioncontrol may work when two required conditions are provided i.e. sufficient inputs of organicmatter, and a sufficiently long residence time of litter on the soil surface, together ensuringthat the soil is protected all the time, especially during high intensity rains. The degree ofprotection of the soil surface by litter depends on its residence time (inversely related to itsdecomposition rate and hence to its 'quality'), and its position on the slope (see schematicdiagram in Figure 1).
Aspects of plant litter quality which play clear roles in governing the rates ofdecomposition, and particularly of N mineralization, are the concentration of N (or C/Nratio), lignin and polyphenols. Organic matter with a low C/N ratio (<25), and lowconcentration of lignin (<15%) and polyphenolics (<3%) (Palm and Sanchez, 1991) isconsidered as a high-quality i.e. the materials decompose and release nutrients rapidly.Leguminous trees such as Gliricidia and Leucaena mostly decompose rapidly (Handayanto
10

11
et al., 1994). Peltophorum dassyrachis, Calliandra calothyrsus and Erythrina orientalisdecomposed more slowly over a period of 16 weeks (Handayanto et al., 1992). For Erythrinathe decomposition apparently slows down when about 20 % of the original amount is left,and for Calliandra when it was 45% and Peltophorum when it was 70 % left. Most of nonlegume trees either timber trees or fruit trees showed a lower quality than legume trees,mostly have a lignin concentration > 20 % (Hairiah et al., 1996).
The tested general hypotheses are:
1. The multi strata coffee-based cropping system provides a better protection to the soilerosion than mono-culture coffee systems.
2. Trees that produce low 'quality' litter provide a better protection against erosion than treeswith high quality litter, due to the longer residence time on the soil surface,
3. The size and shape of leaves influences the degree of contact cover during decompositionand trees with small or composite leaves are more effective than those with large and stiffleaves.
In combination, these hypotheses, if confirmed, may point to a maximum effectiveness oftrees with small leaves of low quality, that provide a high degree of contact cover for a longtime. That low quality alone is not always desirable is indicated by the observation of manyfarmers in Pakuan Ratu, N. Lampung who reported that teak (Tectona grandis) with its largeleaves slowly decompose and easily burns during a dry season as it dries up and has littlecontact with the soil.
The quality of litter input may affect the abundance and diversity of "soil engineers" (soilorganisms which modify soil structure). Most of soil biota are responding to litter quality,e.g. termites respond more to low quality material, ants respond to high quality, while theresponse of earthworms to litter quality is not yet clear, but they seem to prefer a higher litterquality as food. Earthworms play an important role in improving soil bulk density, soilporosity and water infiltration. Their role in reducing soil erosion varies, however, dependingon cast type (Lavelle et al., 1995). Figure 2 shows schematic links between land use changes,soil organic matter status, and soil biodiversity.
Figure 1. Schematiclink between litterinput and soil erosion

12
In the context of the Sumberjaya, our research focus was on the options available to achievebetter erosion control under coffee multistrata systems through the choice of tree species andthe density at which they are planted. This research was aimed to determine:
1. The percentage of surface cover required throughout the year to efficiently reduce runoffand soil loss,
2. The amount of organic material needed of various 'quality' levels to maintain this degreeof surface cover, the tree density needed at plot level to provide this amount of litter.
Research approach
To answer the above research questions some measurements based on survey on farmers plotand measurement on permanent plot were carried out in Sumberjaya. The flow chart ofresearch approach is presented in Figure 3.
Figure 2. Schematic links betweenland use changes, thickness of litterlayer and run off and erosion.
Figure 3. Flow chart ofresearch approach andtheir main relationships.
Expected output
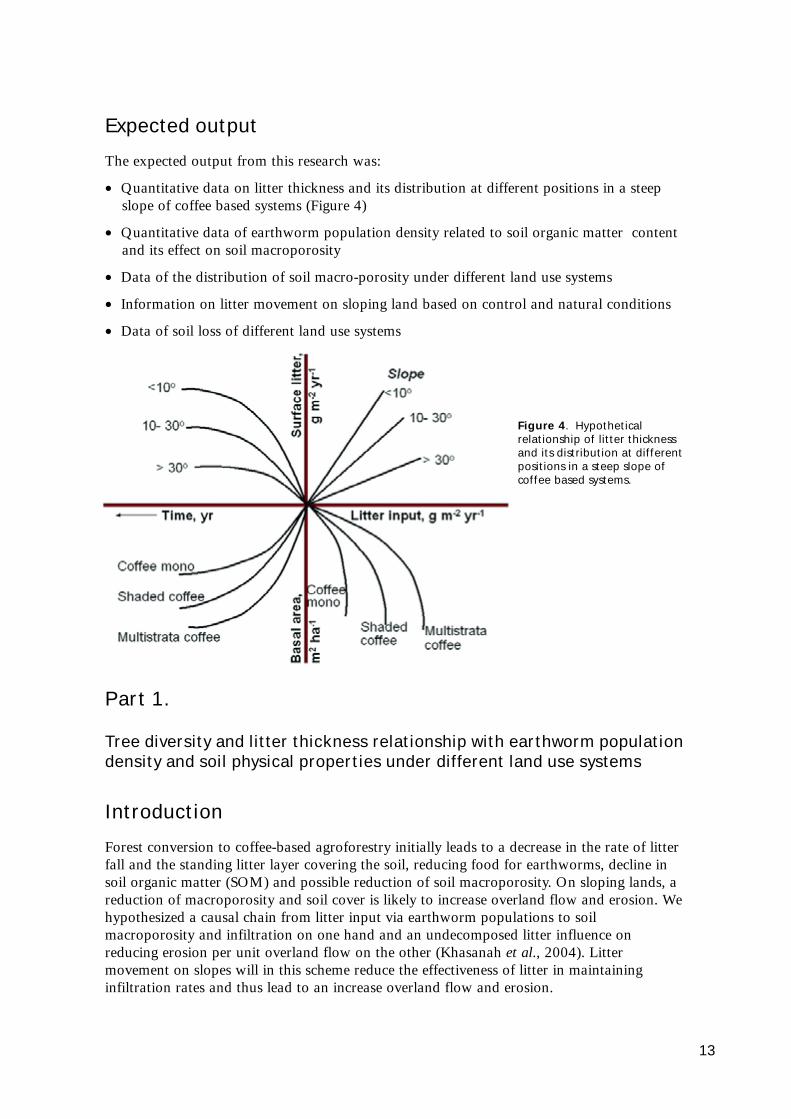
The expected output from this research was:
• Quantitative data on litter thickness and its distribution at different positions in a steepslope of coffee based systems (Figure 4)
• Quantitative data of earthworm population density related to soil organic matter contentand its effect on soil macroporosity
• Data of the distribution of soil macro-porosity under different land use systems
• Information on litter movement on sloping land based on control and natural conditions
• Data of soil loss of different land use systems
Part 1.
Tree diversity and litter thickness relationship with earthworm populationdensity and soil physical properties under different land use systems
Introduction
Forest conversion to coffee-based agroforestry initially leads to a decrease in the rate of litterfall and the standing litter layer covering the soil, reducing food for earthworms, decline insoil organic matter (SOM) and possible reduction of soil macroporosity. On sloping lands, areduction of macroporosity and soil cover is likely to increase overland flow and erosion. Wehypothesized a causal chain from litter input via earthworm populations to soilmacroporosity and infiltration on one hand and an undecomposed litter influence onreducing erosion per unit overland flow on the other (Khasanah et al., 2004). Littermovement on slopes will in this scheme reduce the effectiveness of litter in maintaininginfiltration rates and thus lead to an increase overland flow and erosion.
13
Figure 4. Hypotheticalrelationship of litter thicknessand its distribution at differentpositions in a steep slope ofcoffee based systems.

The central hypotheses in this study are that (1) forest and multi-strata coffee basedsystems will produce the highest litter thickness due to diversity and density of theirvegetation, (2) forest and multi-strata coffee based systems will stimulate higher populationdensity of earthworm and, in consequent, higher macro porosity and soil infiltration thancoffee monoculture. Therefore, the objectives of this study were to evaluate the relationshipbetween soil surface cover by tree litter and tree canopy and population density ofearthworm, macro pores, and soil infiltration under coffee based agroforestry systems.
Methods
The study was conducted in Way Besai watershed, West Lampung. The coffee based systemswere selected from farmers plots in three villages i.e. South Bodong, North Bodong andSimpangsari, Tribudisukur (104025'46.50" - 104026'51.40 E, 5001'29.88" - 5002'34.20 S;with mean rainfall of 2500 mm year-1). The soil properties of the study area are presented inTable 1.
Four land use systems were compared (a) forest as control, (b) multistrata coffee withfruit, timber trees and nitrogen-fixing shade trees (Erythrina sububrams and/or Gliricidiasepium), (c) shaded coffee with Erythrina sububrams and/or Gliricidia sepium as shade trees,(d) monoculture (sun) coffee.
The study was done in two steps:
(a) Measuring the litter thickness under forest and established coffee based systems (>7 years)and their effect on population density of earthworm, macroporosity and soil infiltration,in November 2001-June 2002
(b) Measuring the litter thickness under young coffee based systems (< 3 years and 3-7 years),in February-August 2003
Table 1. Soil properties of the studied area in Sumberjaya
14
Land use system
Soil depth
cm
pH (H2O)
pH (KCl)
Tot.C %
Tot.N %
C/N Sand Silt Clay %
Forest 4.93 3.97 3.84 0.35 10.88 17.5 38.1 44.4
Multistrata 5.17 4.05 1.76 0.23 7.81 15.0 33.6 51.4
Shaded 5.20 4.08 1.49 0.21 7.42 14.4 34.3 51.4
Monoculture 5.01 3.96 1.46 0.24 6.93 13.5 31.7 54.8
s.e.d 0.17 0.20 0.22 0.03 0.63 2.05 2.57 3.96
Forest 0-5 4.87 3.98 4.99 0.44 11.45 16.8 41.2 42.1
5-15 4.99 3.96 2.69 0.27 10.32 18.2 35.0 46.8
Multistrata 0-5 5.18 4.08 1.98 0.26 7.82 15.6 35.3 49.1
5-15 5.16 4.02 1.54 0.20 7.81 14.4 31.9 53.7
Shaded 0-5 5.22 4.12 1.76 0.24 7.88 15.3 35.3 49.4
5-15 5.17 4.04 1.22 0.19 6.96 13.5 33.2 53.3
Monoculture 0-5 4.98 3.94 1.65 0.27 7.02 14.1 34.1 51.8
5-15 5.05 3.97 1.28 0.20 6.85 12.9 29.3 57.7
s.e.d 0.18 0.20 0.23 0.03 0.65 2.08 2.72 4.07

Note: The plot age was based on time after forest conversion, not on the age of coffee treesas the formers is more directly related to the litter thickness within the plot.
Measurements
Trees diversity
The survey was conducted in established agroforestry coffee based systems. To distinguishbetween the two coffee based systems, criteria have been developed based on trees diversityper area and its basal area. The multistrata coffee based system should have trees species > 5and basal area 80%
(Basal area (%) = ( Dcoffee2) / ( Dcoffee
2 + Dnon-coffee2) x 100)
where,
D = tree diameter at breast height (dbh, 1.3 m above soil surface)
Tree biomass and canopy distribution
Methods for quantifying tree biomass were used as specified in the ASB protocol (Palm et al.,1996). Sampling of vegetation was done within a 40 x 5 m2 transect on uphill (top) anddownhill (bottom), see Figure 5. The uphill transect was made at certain distance from thetop of hill (about 10% of slope length); all transects were made along the contour.
Tree position and canopy distribution within plot were copied on a fine-grid paper. Dataon canopy width (m) were collected by measuring the edge of canopy from two sides.
All tree diameters at breast height (>5 cm) were measured, and data were converted intoaboveground biomass with an allometric equations as presented in Table 2.
15
Figure 5. Position of sub plot(transect) in a slope (top) andschematic of litter, understoreyand soil sampling (bottom).

Table 2. Allometric equation used for estimating tree biomass in Agroforestry system (Y= tree biomass(kg tree-1); ρ = wood density, g cm-3; D = tree diameter, cm)
0.62 is mid medium value of wood density in secondary forest Sumberjaya (Van Noordwijk et al, 2002)
Biomass of understorey, litter and soil sampling
Understorey branches and twigs was sampled from ten 0.25 m2 sampling rectangles withinthe 40 * 5 m2 transect. Samples were oven dried at 800C for 48 hours and weighed. At thesame point, litter was collected from the same sampling rectangles at the soil surface. Soilparticles and clods was removed by light washing before drying the samples in an oven at800C for 48 hours. The litter was separated into 2 classes i.e. coarse (>5 mm) and fine litter(<0.5 mm).
A composite soil samples were collected underneath the litter from each sampling point at0-5 and 5-15 cm depths, analyzed for its organic C (Corg), clay and silt contents, and soil pH.Corg were compared to the reference value (Cref) for soils of the similar texture, pH andelevation, based on a large Sumatran data set (Van Noordwijk et al., 1997).
Earthworm population
The earthworm population density was determined from soil monolith at five points ofmeasurements in each transect, at three soil depths (0-10 cm, 10-20 cm, and 20-30 cm)(Susilo, 2000). Earthworm sample was collected by hand sorting and classified based on itsecological function i.e. ecosystem engineer (anesic + endogeic) and the decomposer (epigeic),and weighed for its biomass measurement.
Soil Physical condition
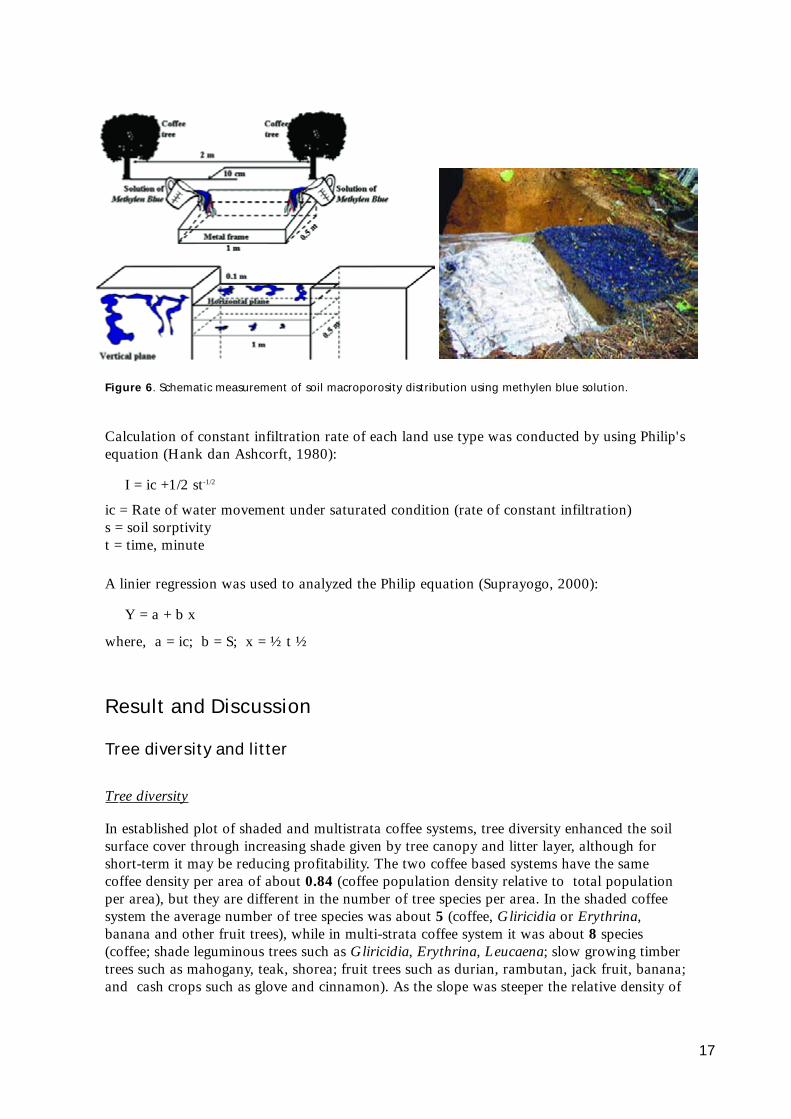
Soil physical properties were measured from each land use on a steep and flat slopes. Soilporosity was measured using a methylen-blue (0.05 g/l) solution, by pouring the solutionwithin a metal frame of 1 * 0.5 m2 and leaving it to infiltrate overnight. The distribution ofmethylen blue in the soil profile was copied to transparent plastic sheets (Figure 6).
The rate of water infiltration (cm day-1) was measured on a plot with a high litter layer(lower slope position) and low litter layer (upper slope position) using a 625 cm2 RainfallSimulator. Rainfall simulator was placed randomly between trees. To quantify the effect oflitter on water infiltration, the measurement was performed on the soil with and withoutlitter. The rate of water infiltration was calculated as follows:
I = P - R
Where : I = infiltration per 30 second, mmP = Constant rainfall per 30 second, mmR = Volume of rainfall collected in rainfall simulator, mm
16
Tree type Equations Reference
Coffee Y = 0.2811 D2.0635
Arifin (2000)
Banana Y = 0.030 D 2.13 Arifin (2000) Other trees in Agroforestry system Y = 0.11 ρ D2.62
(ρ=0.62, g cm-3) Ketterings et al. (2000)
Paraserianthes falcataria Y =0.0272 ρ D2.831
Sugiarto (2002)
Calculation of constant infiltration rate of each land use type was conducted by using Philip'sequation (Hank dan Ashcorft, 1980):
I = ic +1/2 st-1/2
ic = Rate of water movement under saturated condition (rate of constant infiltration)s = soil sorptivityt = time, minute
A linier regression was used to analyzed the Philip equation (Suprayogo, 2000):
Y = a + b x
where, a = ic; b = S; x = ½ t ½
Result and Discussion
Tree diversity and litter
Tree diversity
In established plot of shaded and multistrata coffee systems, tree diversity enhanced the soilsurface cover through increasing shade given by tree canopy and litter layer, although forshort-term it may be reducing profitability. The two coffee based systems have the samecoffee density per area of about 0.84 (coffee population density relative to total populationper area), but they are different in the number of tree species per area. In the shaded coffeesystem the average number of tree species was about 5 (coffee, Gliricidia or Erythrina,banana and other fruit trees), while in multi-strata coffee system it was about 8 species(coffee; shade leguminous trees such as Gliricidia, Erythrina, Leucaena; slow growing timbertrees such as mahogany, teak, shorea; fruit trees such as durian, rambutan, jack fruit, banana;and cash crops such as glove and cinnamon). As the slope was steeper the relative density of
17
Figure 6. Schematic measurement of soil macroporosity distribution using methylen blue solution.

18
coffee in multi-strata system decreased from 0.88 to 0.78, reflecting farmers' preference toplant more fruit or timber trees than coffee in the steeper slopes (Figure 7).
Tree biomass
Conversion of forest to agricultural land dramatically reduced tree biomass, but the biomassgradually increased over time as the coffee and other tree canopy develop (Figure 8). Aftermore than seven years, tree biomass in monoculture coffee system increased about 38 %already, although it remains very low; while under agroforestry system the increment ishigher due to the existence of non-coffee shade trees. If the condition is right, within 40 -340 years agroforestry coffee based system may have similar amount of tree biomass as in
Figure 7. Relative density ofcoffee trees at differentsteepness of slope
Figure 8. Tree biomass of monoculture and agroforestry coffee based system at different age of coffee treeson flat and steep slope land with tree biomass under forest system as a reference.

forest (470 Mg ha-1), although in reality for Sumberjaya condition it is unlikely to happen.Normally farmers will replant coffee trees after 30-40 years and non coffee trees after amaximum of 100 year period.
In the period more than sevenyears, no significant effect of slopeto tree biomass was found (Figure9). Tree biomass under coffee basedsystem of about 50 - 75 Mg ha-1
was significantly (p<0.05) lowerthan in the forest of 434 Mg ha-1,Biomass under monoculture coffeewas much lower (as high as 16 Mgha-1).
Soil surface cover
Surface litter layer, vegetation (trees and understorey) have a direct protective role in reducing'splash' effects of raindrops that could otherwise lead to a dispersal of soil aggregates.Depending on soil texture, splash impacts can lead to a sealing of the soil surface and, inturn, blocking of water entry into the soil, as well as to the entrainment of soil particles intooverland flow. The protective function of surface litter is positively related to its resistance todecomposition.
19
Figure 9. Tree biomass in the forestand in the mature (> 7 years) coffeebased systems
Figure 10. Thickness of litter layer under coffee based systems on flat and steep slopes at various age ofcoffee trees.
Thickness of litter layer
Conversion of forest to coffee based system reduced thickness of litter layer significantly(p<0.05), with time it increased gradually (Figure 10). The litter thickness varied betweenslope and land use types. Under mature (> 7 years) coffee multistrata system the thickness oflitter layer was 30 % lower than in the forest of 22.8 mm. To gain similar litter layerthickness as in the forest, shaded coffee system and multistrata system may need 15-37 yearswhich is a shorter time than needed by monoculture system of 60 years.
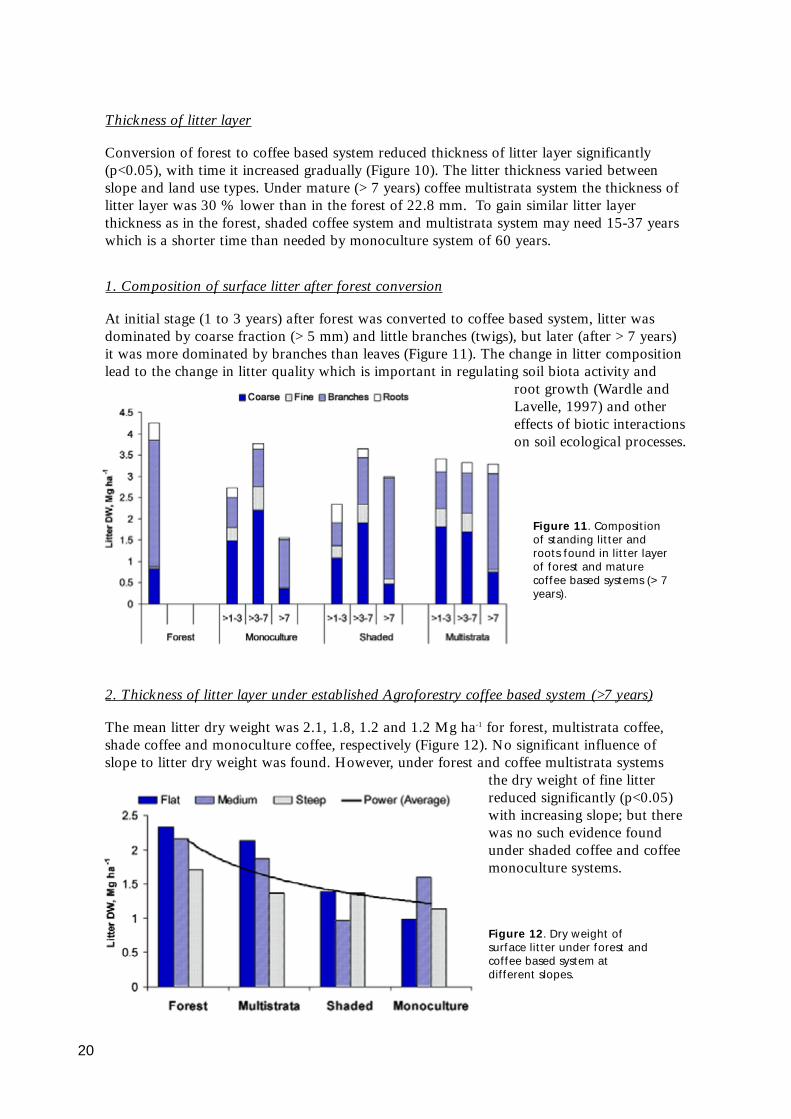
1. Composition of surface litter after forest conversion
At initial stage (1 to 3 years) after forest was converted to coffee based system, litter wasdominated by coarse fraction (> 5 mm) and little branches (twigs), but later (after > 7 years)it was more dominated by branches than leaves (Figure 11). The change in litter compositionlead to the change in litter quality which is important in regulating soil biota activity and
root growth (Wardle andLavelle, 1997) and othereffects of biotic interactionson soil ecological processes.
2. Thickness of litter layer under established Agroforestry coffee based system (>7 years)
The mean litter dry weight was 2.1, 1.8, 1.2 and 1.2 Mg ha-1 for forest, multistrata coffee,shade coffee and monoculture coffee, respectively (Figure 12). No significant influence ofslope to litter dry weight was found. However, under forest and coffee multistrata systems
the dry weight of fine litterreduced significantly (p<0.05)with increasing slope; but therewas no such evidence foundunder shaded coffee and coffeemonoculture systems.
20
Figure 11. Compositionof standing litter androots found in litter layerof forest and maturecoffee based systems (> 7years).
Figure 12. Dry weight ofsurface litter under forest andcoffee based system atdifferent slopes.

Soil surface cover
1. Tree canopy
Forest soil surface become more open after cut and clearing of vegetation leading to morevulnerability to run off and erosion. Soil cover by tree canopy increased with time (Figure13), but lower relative to that of forest.
2. Basal area
The amount of land occupied by tree trunk (basal area) which is reliable for biomassindicator, is shown in Figure 14. The basal area slowly increased over time and agroforestrycoffee based system has a higher basal area than monoculture coffee system. The highestbasal area was found under coffee multistrata system (with 20 year old coffee) on flat land,but it still 60-70 % lower than in the forest.
3. Understorey
Distribution of tree canopy may affect the density of understorey plants under forest systemor weed under agriculture system. One strategy to control weed under agricultural system inthe tropics is by reducing light incidence on soil surface. In general weed reduced cropsproduction, but it plays an important role on soil surface protection from rain drop leadingto reduction of soil erosion.
Understorey dry weight of monoculture coffee system is higher than under agroforestrycoffee based system (Figure 15) due to less cover provided by coffee tree canopy (Figure 13).Understorey dry weight in agroforestry coffee based system on flat land was relativelyconstant with time, but on steep slope it tended to reduce with time. Reduction onunderstorey population may improve crop yield, however, it may increase run off anderosion.
Earthworm density of different land use systems
The disturbance such as conversion of natural forest to agricultural systems will alterpopulation density of earthworm due to changes on (a) microclimate, (b) amount of litterinput, (c) litter quality (Tian et al., 1997).
1. Earthworm population density
The population density of earthworm is presented in Table 3, with the highest populationdensity in multistrata coffee system (149 individuals or head m-2) followed by coffeemonoculture (88 ind m-2), shaded coffee (83 ind m-2) and forest (75 ind m-2). However, thesize of earthworm under multistrata coffee system is smaller than under forest. The averageearthworm biomass under multistrata coffee system was about 0.12 g per individualcompared to 0.41 g per individual under forest.
In the classification of earthworms based on main ecological groups, we found that moreecosystem engineers (anesic + endogeic) than decomposer (epigeic) were found under naturalforest, which may lead to a higher formation of soil macropores, increase water infiltrationand reduced surface run-off. Similar results were found under multistrata coffee basedsystem, while in monoculture coffee system more decomposer earthworm was found.
21

22
Figure 13. Area covered by tree canopy of Agroforestry systems and monoculture coffee based systemrelative to canopy cover under forest 100 %.
Figure 14. Tree basal area of Agroforestry systems and monoculture coffee based system compared toremnant forest

23
2.Cast production
A higher soil organic matter content in the natural forest increased the earthworm activity asshown by a high cast production of about 339 g m-2 or 3.4 Mg ha-1, while the lowest wasfound under shaded coffee system it was about 55 g m-2 or 0.55 Mg ha-1.
Table 3. Earthworm population density and its classification based on ecological type where theecosystem engineer = (Anesic + Endogeic) / Total population.
1) Different letters after number in the same column indicate significant differences as tested by theLSD at p<0.05)
Figure 15. Understorey (weed) dry weight under forest and coffee based system
Ecological Type
Land Use Population density (P), Indiv. m-2
Biomass, (B) g m-2
B/P g per indiv.
Epigeic (EP), Indiv. m-2
Anecic (A), Indiv. m-2
Endogeic (En), Indiv. m-2
(A+En)/P, %
Remnant Forest
75 a1) 31 c 0.41 5 a 36 a 34 a 93
Multistrata Coffee
149 b 18 b 0.12 14 a 77 b 59 b 91
Shaded coffee
83 a 7 a 0.08 7 a 38 a 38 ab 92
Monoculture coffee
88 a 12 ab 0.14 11 a 51 ab 25 a 87

Soil Physical measurements
1. Macropore Distribution
The distribution of Methylen blue in the soil profile indicated the distribution of soilmacropores, the larger the colored area indicates higher macro pores formed either by root orbiota activities or decomposition of soil organic matter. The highest macropore distributionwas found under forest condition, followed by shaded, multistrata and monoculture coffee
systems (Figure 16). Quantitativemeasurement on soil macropore on thevertical plane showed that coffee basedagroforestry system was 70 % in thetotal macroposes compared to thatfound in the forest soil (Figure 17).
The measurement on the horizontal plane showed that conversion of forest to coffeebased systems on the flat slope reduced about 70 % of the soil macropores especially at thetop layer of 0-5 cm, however, no reduction was found on the steep slope (Figure 18).
2. Water infiltration rate
The results of our measurements showed that soil infiltration pattern for all systems are thesame, except for forest which was high and more constant overtime. Overall waterinfiltration on flat land is higher than on steep sloping land, with the average value of about2.74 and 2.59 mm min-1.
Litter on soil surface play an important role on maintaining soil macropore and waterinfiltration. On flat slope, addition of litter did not significantly affect water infiltration. Theaverage water infiltration rate of forest soil was about 4.9 mm min-1, while of multistrata,shaded and monoculture coffee systems was about 2.2, 1.8 and 2.1 mm min-1, respectively
24
Figure 17. The averagenumber of soil macropore onvertical plane under forestand coffee based systems
Figure 16. The distribution of the flow ofMethylen Blue through soil profile asindication of the distribution of soil macro-pore in different land use systems (Forest=Natural Forest, Multi-strata = multi-stratacoffee system, Shaded = shaded coffeesystem and Monoculture = monoculturecoffee system).

25
(Figure 19A and B). Apparently, in our condition, surface litter is important in maintainingsoil infiltration on steep slope land only.
Figure 18. Distribution of soil macropore on horizontal plane of soil profile on (A) steep slope and (B) gentleslope (of forest and coffee based systems
Figure 19. Water infiltration (mm minute-1) of different land use types on flat land without and with litter(A and B) and on steep slope land (C and D).

On a steep slope, infiltration rate of forest soil reduced with time but it was still higherthan coffee based systems (Figure 19C and D). Surprisingly the average of water infiltrationrate of forest soil was similar to monoculture coffee system of about 3.0 mm min-1, while ofmultistrata and shaded coffee systems they were about 1.3, and 2.65 mm min-1.
A high water infiltration rate under monoculture system as found in this study might beexplained by a high intensity of weeding and surface roughness created by farmer e.g.making a small sediment pit known as 'rorak' to reduce surface run-off (Agus et al., 2002)and also for making compost in situ with green materials from pruning and weed. Furtherdetail study, however, is still needed to explain this phenomenon.
Part 2.
Overland flow and soil loss under different land use systems
Introductions
Forest conversion leads to increase the overland flow as well as soil erosion. Tremendousincrease of runoff and soil erosion was recorded at the experimental sites in Sumberjaya atthe early years after forest cutting (Widianto et al., 2004). Coffee-based systems seem to beable to reduce runoff and soil erosion only after several years (more than 5 years) afterconversion.
Direct exposure of soil due to the absence of canopy cover at the early stage of conversionaccelerate the degradation of physical and hydrological properties of particularly top soilsand simultaneously increase the water run off.
Planting trees will gradually provide soil cover by both their canopy and litter. In longterm it will improve soil properties and at the same time it is able to intercept more portionof the rain. These will increase infiltration capacity of the soil and hence reduce runoff aswell as soil erosion.
The important factors to be considered in the selection of trees are (a) growth rate interms of producing biomass (for canopy cover and litter production), and (b) quality of litter(affects the improvement of soil quality).
Purpose of this study was to evaluate the effects of canopy cover (as a function of the ageof trees) and litter quality (as represented by various trees species) on overland flow anderosion as well as soil properties and water balance at plot level.
Methods
Two series of erosion experiments were carried out since 2000 in Sumberjaya, WestLampung. Surface runoff and soil loss was measured from erosion plots of various land coveron a daily basis. The first experiment was started in 2000/2001 on various ages ofmonoculture coffee systems, while the second was started one year later on various coffeebased systems. Both series were compared to erosion plot under natural forest.
26

The first series consisted five treatments of monoculture coffee plots of 1, 3, 7 and 10years after coffee planting (in 2000/2001), as well as under natural forest. The second seriesconsisted of five land uses i.e. monoculture coffee, single-species shaded coffee, multistratashaded coffee systems, and natural forest. The shade-tree species selected in the shaded coffeesystems are Gliricidia sp and Erythrina sp The coffee species was 15 years old (in2001/2002).
An area of 40 m2 is enclosed by a strip of metal sheeting, called as an erosion plot, withguttering installed on the lower boundary of the plot to channel runoff into a splitter devicecalled as "Chin Ong-meter". The volume of water collected after each runoff event as well asits sediment concentration were measured. One liter of water sample from the runoffcollector was filtered to determine the sediment load. This report covers the period of threeyears (2000/2001 to 2002/2003).
Results
a. Effects of time after forest conversion into monoculture coffee system on the overland flow(surface run-off) and soil loss (erosion) The results of measurement as a function of time after forest conversion are given inFigure 20 and 21.
The surface runoff and erosion from natural forest land is very small as many people believedso far. When the forest is cleared for conversion to agricultural uses, the overland flow anderosion increased tremendously. Soil loss is stimulated by the exposure of the soil surfacebecause of removal of canopy cover as indicated by the highest sediment concentration in thesurface runoff or the erosion and runoff ratio in the 1st year after coffee planting. With time,runoff and erosion tended to decrease. It seems erodibility decreased with the growth ofcoffee as it provides more shade and litter.
Soil loss from natural forest was less than 1 Mg ha-1 yr-1 and it increased to nearly 70 Mgha-1 yr-1 when the forest was cleared. At the same time, surface runoff also increased but onlyabout 6 times bigger than under natural forest. The soil loss declined on the following yearsand after 5 years under coffee, soil loss was way below 15 Mg ha-1. Under 12 years or oldercoffee, or under multistrata coffee, soil loss was way below 5 Mg ha-1.
27
Figure 20. Surfacerunoff, erosion atvarious ages ofmonoculture coffeesystems after forestconversion

b. Effects of coffee based agroforestry systems after forest conversion on the runoff anderosion
The measurement of surface runoff and soil loss from erosion plots under various coffeebased agroforestry systems at 10 to 12 years old showed that those systems are able toreduce runoff and soil loss although it they were still above those of natural forest (Table 4and Figure 21). The lowest surface runoff was measured under the Paraserianthes shadedcoffee plot, while the Gliricidia shaded coffee gave the highest overland flow. On the otherhand, the highest soil loss was collected from monoculture coffee plot. Multistrata andshaded coffee systems were able to protect soil surface and improve better than themonoculture coffee system, through their canopy and litter production.
Erosion to runoff ratio of multistrata and shaded coffee systems were very small ascompare to the monoculture coffee. This indicates the important roles of tree species for the
soil surfaceimprovements,particularly thecontribution to litterproduction andprotection of soilsurface by canopy.
Table 4. Surface runoff, erosion at various coffee-based systems at 10 to 12 years after forestconversion
Conclusions
Following forest clearing, perennial tree crop like coffee, can reduce erosion and runoffsignificantly in the steep slope area with mostly Inceptisols soils order in the humid tropic ofLampung, Sumatra, Indonesia. Inclusion of trees into coffee-based systems can reduced soilloss but not surface runoff as compared to monoculture coffee system. Coffee-basedagroforestry systems provide better protection to soil surface since their tree canopy cancover more than 60 % and also produce more litter per unit of area of soil surface while themonoculture coffee system covers less than 50 % of the surface.
28
Runoff Erosion E/R ratio No Landuse system mm Mm mm/mm
1 Forest 37.6 0.08 0.0021 2 Multistrata 253.9 0.28 0.0011 3 Shaded by Gliricidia 273.4 0.15 0.0005 4 Shaded by Paraserianthes 114.6 0.12 0.0011 5 Monoculture 209.5 0.81 0.0038 Total rainfall 1,589 mm and bulk density of soils is ((ρρββ) 1,200 kg m-3
Figure 21. Erosion/runoffratio at various ages ofmonoculture coffee systemsafter forest conversion

Well-developed coffee-based systems can control soil erosion as low as forest, but it is notable to restore surface runoff close to the original forest condition.
Forest conversion will lead to increase of the overland flow to about 6 to 10 times higher,and accelerate soil loss particularly in the first two to four years after land clearing.
References
Albrecht A, Cadisch G, Blanchart E, Sitompul SM and van Lauwe B. 2004. Below-groundinputs: Relationships with soil quality, soil C storage and soil structure. In: vanNoordwijk M, Ong C M, Cadisch G (eds.): Below-ground interactions in TropicalAgroecosystems. Concepts and models with multiple component. CABI Publ.,Wallingford, UK. ISBN 0-85199-673-6. p 193-207.
Anderson J and Ingram J. 1993. Tropical soil biology and fertility. A hand book of methods.Second edition: CABI, UK. 221 p.
Afandi, Rosadi B, Manik T K, Senge M, Oki Y, and Adachi T. 1999. The dynamics of soilwater pressure under coffee tree with different weed management in hilly area ofLampung, Indonesia. p. 387-394. In Proceedings, International Seminar TowardSustainable Agriculture in Humid Tropics Facing 21st Century. Bandar Lampung, Sept27-28, 1999. University of Lampung.
Agus F, Gintings AN and van Noordwijk M. 2002. Pilihan TeknologiAgroforestri/Konservasi Tanah untuk Areal Pertanian Berbasis Kopi di Sumberjaya,Lampung Barat. International Centre for Research in Agroforestry. Southeast AsiaRegional Office. Bogor. Indonesia.
Giller K E, 2000. View Point translating science into action for agricultural development inthe tropics: an example from decomposition studies. Applied Soil Ecology 14 (2000) 1-3.
Hairiah K, Adawiyah R, Widyaningsih J. 1996. Amelioration of Aluminium toxicity withorganic matter: Selection of organic matter based on its total cation concentration.AGRIVITA, 19 (4): 158-164.
29
Figure 22. Surface runoffand Erosion to surface runoffratio from various coffee-based agroforestry systems

Handayanto, Nuraini Y, Purnomosidhi P, Hanegraaf M, Agterberg G, Hassink J and vanNoordwijk M. 1992. Decomposition rates of legume residues and N mineralization inan Ultisol in Lampung, AGRIVITA, 15 (1): 75-86.
Handayanto E. 1994. Nitrogen mineralization from legume tree prunings of different quality.PhD thesis University of London, 230 p.
Khasanah K, Lusiana B, Farida and Van Noordwijk M, 2004. Simulasi LimpasanPermukaan dan Kehilangan Tanah pada Berbagai Umur Kebun Kopi: Studi Kasus diSumberjaya, Lampung Barat. Agrivita 26 (1): 89-98.
Morgan R P C. 1986. Soil erosion and soil conservation. Longman Sci.& Tech., New York,298 pp.
Nill D and Nill E. 1993. The efficient use of mulch layers to reduce runoff and soil loss. In: KMulongoy and R Merckx (eds.) Soil organic matter dynamics and sustainability oftropical agriculture. John Wiley & Sons, Chichester - New York - Brisbane- Toronto -Singapore. 331-339 p.
Palm CA and Sanchez PA. 1991. Nitrogen release from some tropical legumes as affected bylignin and polyphenol contents. Soil Biology and Biochemistry 23:83-88.
Tian G, Brussard L, Kang BT and Swift M, 1997. Soil fauna-mediated decomposition ofplant residues under constrained environmental and residue quality conditions. In:Cadisch, G. and K. Giller (eds.) Driven by nature: Plant litter quality anddecomposition. CABI, UK. p 125-134.
Vanlauwe B, Diels J, Sanginga N and Merckx R. 1997. Residue quality and decomposition:An unsteady relationship? In: Cadisch G and Giller K (eds.) Driven by nature: Plantlitter quality and decomposition. CABI, UK. p 157-166.
Van Noordwijk M, Woomer P, Cerri Bernoux CM, and Nugroho K. 1997. Soil carbon in thehumid tropical forest zone. Geoderma 79: 187-225.
Van Noordwijk M, Rahayu S, Williams S E, Hairiah K, Khasanah N and Schroth G. 2004.Crop and tree root-system dynamics. In: Van Noordwijk M, Ong C M, Cadisch G(eds.): Below-ground interactions in Tropical Agroecosystems. Consepts and modelswith multiple component. CABI Publ., Wallingford, UK. ISBN 0-85199-673-6. p 83-108.
White RE. 1997. Principles and practice of soil science. The soil as a natural resource. PressAustralia, Australia.
Wardle D and Lavelle P. 1997. Linkages between soil biota, plant litter quality anddecomposition. In: Cadisch G and Giller K(eds.) Driven by nature: Plant litter qualityand decomposition. CABI, UK. p 107-124.
Widianto, Suprayogo D, Noveras D , Widodo R H, Purnomosidhi P dan Van Noordwijk M.2004. Alih guna lahan hutan menjadi lahan pertanian: Apakah fungsi hidrologis hutandapat digantikan sistem kopi monokultur? Agrivita 26 (1) : 47-52
30
III. Conservation Measures and Variation in SoilSusceptibility to Erosion
Ai Dariah, Sutono, and Maswar
Soil Research Institute, Jln. Juanda 98, Bogor 16123, Indonesia
Abstract
Agricultural land uses, such as coffee based farming, have been perceived by policy makers ashaving a high erosion and being a major source of sedimentation. This research was aimed attesting the level of soil loss on 3 year old coffee farm treated with different soil conservationtreatments. The research was conducted on land with slopes ranging from 50 to 60% atLaksana and Tepus sites of Sumberjaya Sub-district, West Lampung province from November2001 to July 2003. Erosion measurement was conducted at plot scale (15 m long and 8 mwide), for testing treatments: (1) Sun coffee (monoculture coffee), (2) Coffee+Gliricidia asshade tree, (3) coffee+ Gliricidia as shade tree +dead end trench (rorak), (4) Coffee+Gliricidiaas shade tree + hedgerows of natural vegetation, and (5) Coffee+Gliricidia as shade tree +ridging. All treatments were replicated four times and arranged in a completely randomizedblock design. Data from this study were compared with those of similar study in the area,and analysis of key soil physical properties were used to explain variation in soil loss. Resultsshow that soil bulk density, drainage pore, total pore space and saturated hydraulicconductivity were dominant factors in determining the level of soil loss in the study sites.Erosion on the 3 year old coffee farm with porous soil structure was very low (< 2 Mg ha-1
yr-1) and thus soil conservation treatments had no significant effects on soil loss, run-off, andsoil organic matter and nutrient losses. Similar study in Bodong village with similar landscapeand farming system, but much less porous soil, indicated an erosion level of 37 t ha-1 withinthree month period under 830 mm of rainfall. These results call for the importance ofdelineation of soil susceptibility to erosion as a guide to prioritization of conservationintervention.
Key words: erosion, run-off, soil quality, coffee, soil resistance
Introduction
Conversion of forest to agricultural land in the tropics and intensive and non conservativeuse of agricultural lands lead to natural resource degradation. Previous studies showed thatconversion of forest to agricultural land resulted in an increase in the amount of run-off andsoil loss (Lal, 1985), significant changes in soil organic matter (Juo, et al, 1995), reduction ofthe concentration of exchangeable Ca2+, Mg2+ , K+, (Obara et al., 1995) and an increase intemperature due to the increase of solar radiation reaching the ground surface (Udarbe, 1994).
Despite these environmental threats following forest conversion, the pressure ofpopulation living in the outskirts of forest is equally an important aspect to be taken into
31

consideration. When the pressure to intensify the utilization of forestland is unavoidable,approaches to convert human activities from a threat to actively taking the lead in judiciousconservation of the land must be made.
Smallholder coffee plantation is the dominant form of farming system in the protectionforest areas of Sumberjaya Sub-district, Lampung Province. The soil is perceived by localstakeholders as prone to erosion owing to the exposure of soil surface to rain dropsespecially on newly cleared forest, undulating to hilly physiography, high intensity and highamount of rainfall areas.
Farmers have farmed both on the public and private lands for decades for coffee, but inmid 1990s the government evicted those farmers utilizing the public lands because ofperception that the rate of soil loss would be multiplied. Coffee were replaced withCalliandra calothyrsus and it rapidly covered the land, but the evicted farmers lose their main(only) source of income. The people returned to the land in 1997 after the fall of the NewOrder Government. They cleared the Calliandra bush and grafted the remaining coffeestumps and replanted sparsely populated areas with new coffee trees.
With still insecure tenure, there is anxiety among farmers that they could be evicted againand as such they can not taking active participation in soil conservation efforts. A new'community forest' scheme, fortunately, was introduced by the following government inwhich the farmers can obtain long term land use right as long as they implement or willing toimplement conservation as shown by the community land management proposal.
The objectives of this research was to evaluate the effects of alternative agroforestrytechnology in coffee-based farming system on soil loss and soil fertility changes. This resultswere expected to be among the input in the community forest proposal.
Materials and methods
This research was conducted from August 2001 to August 2002 on 3 year old farmers' coffeefarm having 50 to 65% land slopes in Tepus and Laksana Sub Villages of SimpangsariVillage, and in Bodong village, Sumberjaya Sub-district, Lampung Province, Indonesia (4045'-5015' S and 104015'-104045'E). The soil was classified as Oxic Dystrudept in Tepus andLaksana and Typic Paleudults in Bodong village.
Treatments tested included:
T.1 Open field sun coffee, typical treatment on young (<4 years) coffee farm
T.2 Shade coffee using Gliricidia sepium as shade tree. The distance between Gliricidia treewas 1.50-1.75 cm.
T.3 T2 + dead-end trench or "rorak" of 0.4 m wide, 0.3 m depth and 1 m longperpendicular to the slope direction and spaced at about 3 m downslope and 3 mparallel to slope in a 'zigzag' order.
T.4 T2 + partial weeding i.e. leaving natural vegetative strip of 0.25 m wide, perpendicularto the slope direction, at 3 m longitudinal distance.
T.5 T2 + contour ridging of about 20 cm tall, with 3 m longitudinal distance.
32

Plot size is 15 m long down slope and 8 m wide along the contour line. The upper andside borders of the plots were installed with 30 cm wide GI-sheet; 15-cm of the sheet wasburied vertically into the ground and the remaining 15 cm protrude on the soil surface toprotect run-on and runoff into and out of the plots. The lower parts of each plot wereequipped with gutter for collecting bed load. Runoff water from the gutter was channeled to"Chin Ong" meter or subsequently called Chin Ong meter" (Khan 1998; see also Hairiah atal., this volume).
Surface soils (0-10cm) and sub soils (10-20cm) were sampled from upper, midle and lowerplots in November 2002 to determine its property. Six manual rain gauges were installedbesides the plots i.e., three each in Tepus and Laksana sites to measure daily rainfall. Theamount of rainfall reaching the plot was corrected by multiplying with the cosine degree ofslope. The plots were manually weeded using sickle every two months. Fertilizers Urea, SP-36and KCl at the rates of 75, 50, and 50 g per plant, respectively were broadcast within thediameter of 50 cm around each coffee tree twice a year, in Nov 2001 and June 2002.
As this research developed, we found a great variation in soil loss between Bodong(Hairiah et al., this volume) and Tepus and Laksana sites. Therefore we developed additionalactivity aiming to study dominant soil characteristics that determine the level of erosion oncoffee farm. The descriptive observations were carried out by evaluation of soil morphology.Quantitative observations were conducted by analyzing physical properties including bulkdensity, soil porosity, soil permeability, and soil aggregate stability and soil organic mattercontent. The soil samples were collected from three soil depths namely 0-10, 10-20 and 20-40 cm.
Results and discussion
Soil loss and runoff under different soil conservation measures
Soil loss on 3 years coffee farming area in Laksana dan Tepus was very low. With or withoutconservation technique, the average soil loss was 1.1 - 1.5 Mg ha-1 yr-1 and run-off coefficientwas 2.1 - 2.5%. As such, the conservation treatments did not give significant effects onrunoff and soil loss (Table 1). The conservation measures also had no significant differenceon total organic C and nutrient loss (Table 2), as well as nutrient enrichment ratio (Table 3).Nutrient enrichment ratio is the ratio of nutrient in the deposited sediment and the nutrientcontent of original 0-10 cm surface soil layer.
Table 1. Effect of conservation techniques on run off and soil loss as observed from November 2001 toOctober 2002.
† Mean in the same column followed by common letter are not significantly different as tested usingthe LSD at 5% level.
33
Treament Run off (mm)
Run off Coeff. (%)
Soil loss (Mg ha-1)
T1 = Sun coffee T2 = Kopi + Gliricidia as shade tree T3 = T2 + rorak T4 = T2 + partial weeding T5 = T2 + ridging
53,25 a† 46,36 a 49,27 a 60,71 a 55,58 a
2,3 a 2,0 a 2,1 a 2,5 a 2,4 a
1,50 a 1,29 a 1,24 a 1,28 a 1,14 a

Table 2. Nutrient content in run off and sediment
†Mean in the same column followed by common letter are not significantly different as tested by theLSD at 5% level. In runoff water, measured N in the NH4
+ and NO3- forms, P in PO4-3 , and K in K+ forms.
Table 3. The enrichment ratio for each treatment
†Mean in the same column followed by common letter are not significantly different as tested by theLSD at 5% level.
Relationship between Soil Characteristics and Soil Loss on Coffee BasedFarming System in Sumberjaya
Data showed that soil loss in Bodong was significantly high while in Tepus and Laksana itwas negligible (Table 4). The erosion plots in the three sub-villages were established similarslope, rainfall and coffee age.
Soil Morphology
Soil morphology at each research site is given in Table 5. Properties of each soil layerdetermine the rate of water infiltration into soil that finally will affect the amount of runoff.On the average, the soil solum depth at the three locations is > 100 cm. However, there issignificant difference in soil layer properties. The existence of clay illuviated horizon (Bt) atBodong indicates a low water infiltration. Laksana site has a more permeable soil layer thatcharacterized by friable to very friable soil condition up to 160 cm depth (Table 5).
The distinct contrasts in soil characteristics between sites seemed to be dominant factor thatdetermined erosion level at the 3 locations.
34
Sediment Runoff Treatment C-org Total N P2O5 K2O N P K
kg ha-1 T1 = Sun coffee T2 = coffee+ Gliricidia as shade tree T3 = T2 + rorak T4 = T2 + partial weeding T5 = T2 + ridging
47 a† 35 a 30 a 36 a 29 a
3.5 a 2.9 a 2.6 a 2,9 a 2.6 a
0.3 a 0.2 a 0.2 a 0.2 a 0.1 a
0.2 a 0.2 a 0.2 a 0.2 a 0.2 a
1.7 a 2.5 a 1.3 a 3.3 a 2.0 a
0.001 a 0.006 a 0.001 a 0.001 a 0.001 a
5.7 a 3.7 a 2.2 a 3.2 a 4.0 a
Treatment C-Org N P K
T1 = Sun coffee T2 = Coffee+ Gliricidia as shade tree T3 = T2 + rorak T4 = T2 + partial weeding T5 = T2 + ridging
1,09 a† 1,11 a 0,93 a 1,03 a 1,02 a
1,46 a 1,34 a 1,30 a 1,33 a 1,27 a
0,72 a 0,55 a 0,66 a 0,54 a 0,45 a
1,90 a 1,67 a 1,74 a 1,97 a 2,22 a

Table 4. Slope, rainfall and soil loss at three sites in Sumberjaya under 3 year old sun coffee system.
* Observation periods: Bodong (May - July 2001), Tepus and Laksana (May-July 2002).** Source: Widianto et al. (2002).
Table 5. Soil morphology at the 3 research sites.
†AB= angular blocky, SAB=sub-angular blocky
Physical properties and soil organic matter
The result of descriptive observation as shown in Table 9 is supported by the results of soilphysical and organic matter analyses. Laksana dan Tepus had a higher total porosity andlower soil bulk density, higher permeability and drainage pore in the 3 soil depths comparedto Bodong (Figure 1 and 2).
Organic C content affects several soil physical properties, such as water holding capacityand aggregate formation and stability. Organic-C content in Laksana was higher than that ofTepus and that of Tepus was higher than that of Bodong (Figure 25).
35
Sites Slope (%)
Rainfall (mm)
Soil loss (ton ha-1)
Bodong Tepus Laksana
60-70 57-66 56-68
458 434 571
37.21** 0.42 0.02
Location Altitude
Horizon Depth (cm)
Color Aggregate Consistency Texture
Bodong 830m
AP Bt1 Bt2 Bt3
0-22 22-65 65-89 89-153
Brown Light brown Light brown Light brown
AB† AB AB AB
Firm Slightly firm Friable Friable
Clay Clay Clay Clay
Laksana 820m
Ap Bw1 Bw2 Bw3 Bw4
0-23/40 23/40-63 63-99 99-138
Dark brown Yellowish red Red Red red
SAB SAB SAB SAB AB
Friable Friable Very Friable Very Friable Very Friable
Clay Clay Clay Clay Clay
Tepus 820m
Ap Bw1 Bw2 BC C
0-22 22-63 63-105 104-144 >144
Dark brown Strong brown Strong brown Reddish yellow Reddish yellow
SAB AB AB AB -
Slightly firm Friable Friable Very firm -
Clay Clay Clay Clay

Figure 1. Total porosity and bulk density of 3 different soil depths of soils at Tepus, Laksana, and Bodongsites.
Figure 2. Soil permeability and drainage pore at 3 different soil depths at three research sites (Tepus,Laksana, Bodong)
Figure 3. Organic C content at 3 different soil depths at Tepus, Laksana, and Bodong research sites
36
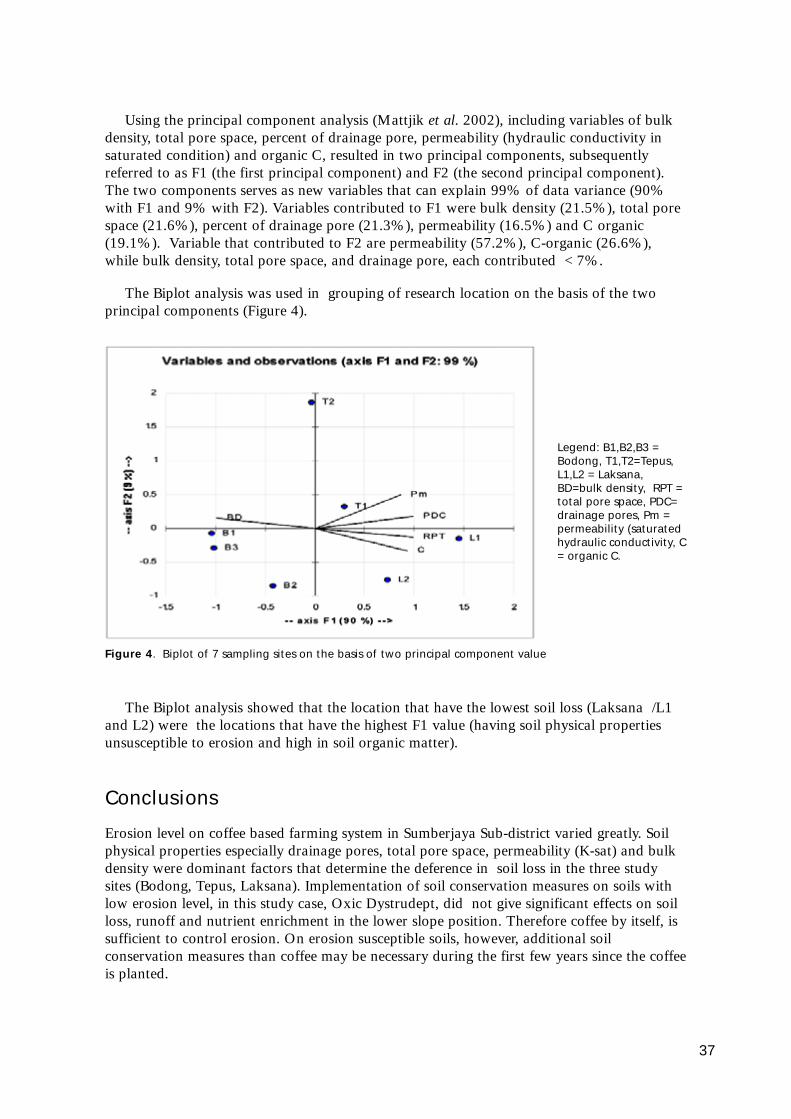
Using the principal component analysis (Mattjik et al. 2002), including variables of bulkdensity, total pore space, percent of drainage pore, permeability (hydraulic conductivity insaturated condition) and organic C, resulted in two principal components, subsequentlyreferred to as F1 (the first principal component) and F2 (the second principal component).The two components serves as new variables that can explain 99% of data variance (90%with F1 and 9% with F2). Variables contributed to F1 were bulk density (21.5%), total porespace (21.6%), percent of drainage pore (21.3%), permeability (16.5%) and C organic(19.1%). Variable that contributed to F2 are permeability (57.2%), C-organic (26.6%),while bulk density, total pore space, and drainage pore, each contributed < 7%.
The Biplot analysis was used in grouping of research location on the basis of the twoprincipal components (Figure 4).
Legend: B1,B2,B3 =Bodong, T1,T2=Tepus,L1,L2 = Laksana,BD=bulk density, RPT =total pore space, PDC=drainage pores, Pm =permeability (saturatedhydraulic conductivity, C= organic C.
Figure 4. Biplot of 7 sampling sites on the basis of two principal component value
The Biplot analysis showed that the location that have the lowest soil loss (Laksana /L1and L2) were the locations that have the highest F1 value (having soil physical propertiesunsusceptible to erosion and high in soil organic matter).
Conclusions
Erosion level on coffee based farming system in Sumberjaya Sub-district varied greatly. Soilphysical properties especially drainage pores, total pore space, permeability (K-sat) and bulkdensity were dominant factors that determine the deference in soil loss in the three studysites (Bodong, Tepus, Laksana). Implementation of soil conservation measures on soils withlow erosion level, in this study case, Oxic Dystrudept, did not give significant effects on soilloss, runoff and nutrient enrichment in the lower slope position. Therefore coffee by itself, issufficient to control erosion. On erosion susceptible soils, however, additional soilconservation measures than coffee may be necessary during the first few years since the coffeeis planted.
37

References
Afandi, Manik TK, Rosadi B, Utomo M, Senge M, Adachi T and Oki Y. 2002. SoilErosion under Coffee Trees with different weed management in Humid Tropical HillyArea of Lampung, South Sumatera, Indonesia. J. Jpn. Soc. Soil Phys. No. 91:13-14.
Hartobudoyo, D. 1979. Pemangkasan kopi. Balai Penelitian Perkebunan, Sub BalaiPenelitian Budidaya, Jember.
Juo ASR, Frannz Luebbers K, Dabiri A, and Ikhile B. 1995. Changes in soil properties duringlong-term fallow and continous cultivation after forest clearing in Nigeria. AgriculturalEcology and Environment. 56: 9-18.
Khan AAH. 2000. Design, calibration, use and production of a simple, robust, low cost pipesamples for measuring soil and water loss in catchment. Consultant's report, ICRAF(Unpublished).
Lal R. 1985. Need for, Approaches to, and consequences of land clearing and development inthe tropics. Pages 15-27 In Tropical Land Clearing for Sustainable Agriculture.Proceeding of an IBSRAM Inaugural Workshop.
Mattjik AA., Sumertajaya IM, Indahwati, Kurnia, Sartono B. 2002. Analisis Peubah Ganda.Jurusan Statistika, Fakultas Matematika dan IPA. PKSDM, DIKTI, DEPDIKNAS,Jakarta, Indonesia.
Lumbanraja J, Syam T, Sarno, and Wada S. 1999. Soil mineralogy consideration forsustainability of the catchment Area of Besai River in Sumatra. p. 218-225 InProceedings International Seminar Toward Sustainable Agriculture in Humid TropicsFacing 21st Century. Bandar Lampung, Sept. 27-28, 1999. University of Lampung.
Obara H, Mitsuchi M, Hamazaki T, and Kato T. 1995. Study on the effect of changes oftropical forests on soil environments, the changes of soils after deforestation in thenortheast plateau of Thailand. Proceedings of the International Workshop on TheChanges of Tropical Forest Ecosystems by El Nino and Others. Kanchanaburi,Thailand, 7-10 February.
Udarbe MP. 1994. The impact of tropical forest degradation on the environment. JIRCASInternational Symposium. Series 1: 21-26
Widianto, Noveras H, Suprayogo D, Purnomosidhi P dan van Noordwijk M. 2002.Konversi hutan menjadi lahan pertanian: 'Apakah fungsi hidrologi hutan dapatdigantikan agroforestry berbasis kopi ?'. ICRAF South East Asia, Bogor. Indonesia.
38

IV. Participatory Trials for the Refinement ofConservation Practices
Maswar, Sutono, Sidik H. Tala'ohu
Soil Research Institute, Jln Juanda 98, Bogor 16123, Indonesia
Abstract
Farmer-led research is believed to be effective in testing and, at the same time, disseminatingresearch results. We facilitated farmers in cross visits to inspect practices of conservation fortree-based farming and in conducting research on small plots on their farm. Fifty farmers,representing several farmer groups participated in the study in Sumberjaya Sub-district, WestLampung District, Lampung Province, Indonesia. The objectives were to test the effectivenessof Arachis pintoi cover crop in controlling erosion and improving soil fertility under theiryoung (3-5 year old) coffee in 2001-2004. Results showed that farmers, in general, werecurious in testing the techniques they newly came across. A. pintoi adapted quite well underrelatively good soil conditions and it tolerated shading. Weeding in the first few months wasimportant for this legume establishment. A. pintoi increased C and N concentrations in thesoil. Soil loss was very low in the study site and the use of the cover crop decreased soil lossseveral folds. After one or more years of testing in small plot of 10 m by 10 m, a few farmersexpanded the planting of A. pintoi on larger areas of their land. Other farmers, however,expressed that the cover crop caused difficulty in coffee harvest as the dropped cherriesbecome unseen in A. pintoi mat. Farmers recognized several indicators such as slope degree,soil texture, infiltration, water holding capacity, color, organic matter and compaction, usingtheir terminology, to describe soil fertility and erodibility. Despite some difficulty in harvest,the use of cover crop promises benefits for coffee and other tree crops and weedingtechniques, such as ring weeding at 1.5 m diameter around coffee trees, may untangle theharvesting problem.
Introduction
Because of exposure of most of soil surface to rain drops in the first few years after coffeeplanting, there is a possibility of high soil loss. Therefore, it is necessary among farmers aswell as policy makers to recognize such problem and find possible rectifying measures.
Several conservation techniques, such as sediment pit and contour bund, have beenimplemented by some farmers and the use of shade trees, especially Gliricidia sepium, hasbeen adopted by the majority of farmers (Agus et al., 2002).
In the pepper (Pepper nigrum) plantation, some farmers use Arachis pintoi as cover crop.To avoid competition between the cover crop and pepper ring weeding (weeding in 1.5 mdiameter area around the pepper hill) has been practiced. The technique was worth tryingfor coffee area with mostly steep slope.
39

In many cases, especially for conservation technique, voluntary adoption of the testedtechnologies is rather difficult. This is partly due to lack of ownership among farmersbecause of lack of their involvement during technology generation and adaptation. Therefore,the technique of farmer-led research is suggested (Agus and Widianto, 2004).
The objectives of this research were to (i) evaluate the effects of alternative conservationtechnology (in this case the use of Arachis pintoi leguminous cover crop) in coffee-basedfarming system on soil loss, soil fertility changes, coffee production and profits generatedfrom the coffee farms and (ii) appraise farmer's method of evaluating soil quality andsusceptibility to erosion.
Material and Methods
This research was conducted in Sumberjaya Sub-district, West Lampung District, Indonesiafrom July 2001 to June 2004. We facilitated several farmer's group included Sumbersari,Tritunggal, Laksana Jaya and Mekarsari groups to test the treatments of their choice.
We initiated this research by exposure to farmers several conservation techniques during across visit. The farmers then were given opportunity to test the technique of their interest.Fifty farmers, representing the four groups expressed their willingness to test Arachis pintoias a cover crop of coffee farm.
The plots were scattered on several farmers field. Each farmer was comparing the use ofthe cover crop with the conventional practice, i.e. no cover crop on plots 10 m x 10 m inarea. Pairs of treatments from different farmers were tested using the pair t-test for coffeeyield, profits (from labor allocation, investment for supplies, farm gate revenue), soil loss andsoil properties.
Monitoring included soil fertility, financial analysis, coffee yield and, for selected plots,soil loss. Undisturbed core samples of surface soil were taken by copper rings with a diameterof 76 mm and height of 40 mm to analyze physical properties such as saturated hydraulicconductivity, bulk density and soil moisture characteristics. Composite soil samples weretaken to analyze soil carbon, nitrogen, potassium, calcium, magnesium, sodium, cationexchange capacity and pH. In addition, farmers' practices of applying fertilizers, pests anddiseases control, etc. were recorded. Changes of soil properties were monitored every year.
Amount of investment in terms of labor, material, fertilizer, seedlings etc. and coffee yieldand farm price were recorded and converted to the monetary value for estimating profits ofeach technique. Farmer's evaluation to alternative agroforestry systems were assessedthroughout the course of this study. Farm record keeping method was used as much aspossible.
For selected plots (7 pairs of plots), sides and upper plot borders were bordered withearthen bund and sediment collectors were installed at the lower border. Participating farmerswere trained how to weigh, collect and store sediment samples every fortnightly for furtherwater content and chemical analysis.
Farmers suggested that the research topic be expanded to soil fertility aspects as related tocombination of practices that would increase coffee yield, reduce erosion and improve soilfertility. Therefore, for the 2nd year study, the farmers tested three treatments: 1) coffee withcurrent farmer practices, 2) coffee with Arachis pintoi and 3) coffee + Arachis pintoi +
40
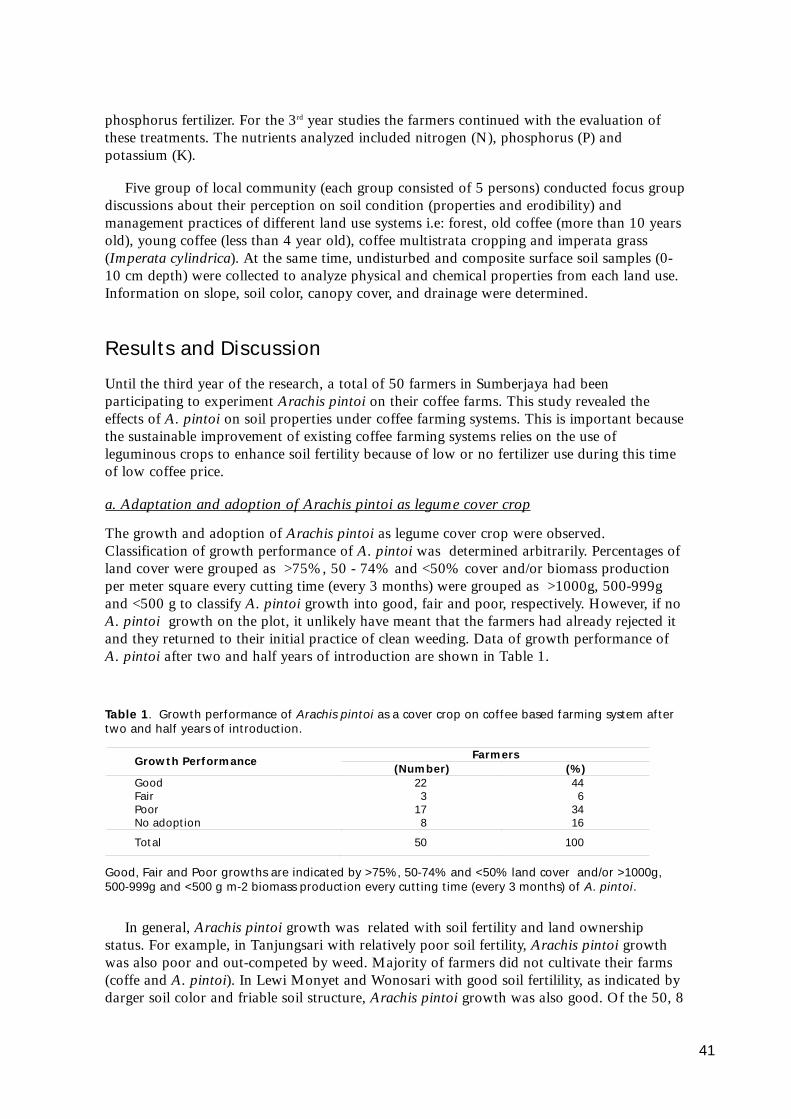
phosphorus fertilizer. For the 3rd year studies the farmers continued with the evaluation ofthese treatments. The nutrients analyzed included nitrogen (N), phosphorus (P) andpotassium (K).
Five group of local community (each group consisted of 5 persons) conducted focus groupdiscussions about their perception on soil condition (properties and erodibility) andmanagement practices of different land use systems i.e: forest, old coffee (more than 10 yearsold), young coffee (less than 4 year old), coffee multistrata cropping and imperata grass(Imperata cylindrica). At the same time, undisturbed and composite surface soil samples (0-10 cm depth) were collected to analyze physical and chemical properties from each land use.Information on slope, soil color, canopy cover, and drainage were determined.
Results and Discussion
Until the third year of the research, a total of 50 farmers in Sumberjaya had beenparticipating to experiment Arachis pintoi on their coffee farms. This study revealed theeffects of A. pintoi on soil properties under coffee farming systems. This is important becausethe sustainable improvement of existing coffee farming systems relies on the use ofleguminous crops to enhance soil fertility because of low or no fertilizer use during this timeof low coffee price.
a. Adaptation and adoption of Arachis pintoi as legume cover crop
The growth and adoption of Arachis pintoi as legume cover crop were observed.Classification of growth performance of A. pintoi was determined arbitrarily. Percentages ofland cover were grouped as >75%, 50 - 74% and <50% cover and/or biomass productionper meter square every cutting time (every 3 months) were grouped as >1000g, 500-999gand <500 g to classify A. pintoi growth into good, fair and poor, respectively. However, if noA. pintoi growth on the plot, it unlikely have meant that the farmers had already rejected itand they returned to their initial practice of clean weeding. Data of growth performance ofA. pintoi after two and half years of introduction are shown in Table 1.
Table 1. Growth performance of Arachis pintoi as a cover crop on coffee based farming system aftertwo and half years of introduction.
Good, Fair and Poor growths are indicated by >75%, 50-74% and <50% land cover and/or >1000g,500-999g and <500 g m-2 biomass production every cutting time (every 3 months) of A. pintoi.
In general, Arachis pintoi growth was related with soil fertility and land ownershipstatus. For example, in Tanjungsari with relatively poor soil fertility, Arachis pintoi growthwas also poor and out-competed by weed. Majority of farmers did not cultivate their farms(coffe and A. pintoi). In Lewi Monyet and Wonosari with good soil fertilility, as indicated bydarger soil color and friable soil structure, Arachis pintoi growth was also good. Of the 50, 8
41
Farmers Growth Performance (Number) (%)
Good 22 44 Fair 3 6 Poor 17 34 No adoption 8 16
Total 50 100

farmers did not adopt A. pintoi at their experimental plots because of various reasons; 1farmer due to change of land use to non agriculture, 3 farmers due to the change in landholders, and 4 farmers explained that they had difficulties in weeding and coffee harvestingthus returned to the practice of clean weeding.
A couple of farmers expanded their A. pintoi to larger plots and they donated the cuttingto other farmers who were interested in planting the legume. There were farmers in Wonosarisite planting A. pintoi around their home after they saw good performance of Arachis pintoion farmers' plot experiment. In this case they planted A. pintoi for ornament and ruminantfodder.
There were several in A. pintoi introduction: 1) in general, at the early growth of A. pintoiwas competed by weeds and it required hand weeding for best performance which was timeconsuming. If the weed included imperata grass, the weeding problem was more serious, 2) itrequires fairly good soil fertility to start and it seems the application of P fertilizer improvedthe growth, 3) a number of farmers expressed difficulties of coffee harvest, because thedropped berries within A. pintoi covered area were difficult to find.
b. Biomass and nutrient contribution
The contribution of A. pintoi to produce biomass and nutrients on coffee-based farmingsystems are shown in Table 2. The fertilizer contribution (recycling) equivalent is given inTable 3. Annual fresh biomass production ranged from 14 to 59 Mg ha-1 or equivalent with 3to 13 Mg ha-1 dry biomass. It contained 54 - 234 kg, 4 - 17 kg, and 18 - 79 kg per hectareper year N, P and K, respectively if its biomass recycled as mulch or incorporated in surfacesoil layer. These amount equivalent with 30 - 127 kg, 6 - 27 kg and 15 - 63 kg urea, SP36and KCl fertilizers respectively. The results indicated that the legume A. pintoi had a goodprospect to improve soil fertility under coffee based farming system. A. pintoi seemed to fixsignificant amount of nitrogen, enough to supply coffee need for N.
Table 2. Biomass production and nutrient contents of Arachis pintoi cuttings in coffee based farmingsystem in Sumberjaya.
A. pintoi have been used as animal fodder, particularly for cattle and goats, inSumberjaya. A. pintoi potentially produces 38 to 162 kg ha-1 day-1 fresh biomass. Thisamount can be contributing to 8 - 36 heads of cattle for fodder mix, based on assumptionthat A. pintoi can compose 15% (4.5 kg) of daily fodder need of approximately 30 kg perhead of cattle. This reflected direct benefit that A. pintoi can promise. The use of the cuttingfor fodder, however, will need higher nutrient replacement (especially of P, K, Ca, and Mg) in
42
Production Parameters Minimum
(poor growth) Maximum
(good growth) Mean
(Fair growth) Fresh Biomass (t ha-1 yr-1) 14 59 32
Dry Biomass (kg ha-1 yr-1) 3 13 7
C (kg ha-1 yr-1) 1.4 6.0 3.3
N (kg ha-1 yr-1) 54 234 126
P (kg ha-1 yr-1) 4 17 9
K (kg ha-1 yr-1) 18 79 43
Ca (kg ha-1 yr-1) 15 66 36
Mg (kg ha-1 yr-1) 10 44 24

the form of manure and/or fertilizers as cut and carry practices means transporting of thesenutrients out of the coffee farms.
Based on field observation, this legume often appears more vigorous under shading tree(coffee multistrata system) and good soil fertility than in open area (monoculture coffee).Under open area (full sunlight), which often coincides with poorer soil fertility, its growthwas suppressed and it had yellow leaves.
Table 3. Average N, P, and K fertilizer equivalent produced/recycled in A. pintoi cutting.
Low coffee production, expensive fertilizer price and low coffee price were among themain farmer's problems in Sumberjaya causing farmers unable to maintain (fertilization andweeding) their farms. Therefore A. pintoi have a good potential to overcome the soil fertilityproblems.
c. The effects of A. pintoi on soil properties
Soil under A. pintoi tended to have a higher C and consistently higher N contents than thecontrol plots (Figure 1). The accumulations of nitrogen via N2 fixation is important toalleviate N fertilization.
d. The effects of A. pintoi on soil loss
Coffee farming system on moderate to steep slopes can lead to high rates of soil loss.Introduced Arachis pintoi as a cover crop is a possible practical means to decrease erosionand increase coffee yields because it's stems and roots form a dense mat that protect the soilfrom high-intensity rainfall. Comparison in soil loss between Arachis pintoi and control plotsfrom November 2003 to June 2004 measurement is shown in Figure 2.
e. Participatory analysis of soil properties
Farmes' identification of several parameters of soil properties are shown in Table 4. Farmersused a variety of criteria to classify soil fertility such as: slope, texture, infiltration, waterholding capacity, color, organic matter and hardness/compaction. Of the five type of landuses (forest, old coffee, young coffee and, multistrata coffee), forest area is considered byfarmers to have the highest fertility followed by multistrata system, old coffee, young coffeeand Imperata grass. Farmer were also used the same indicators (as soil fertility) to classifysoil erodibility. The farmers' ranking of soil erodibility from highest to lowest of the five-types of land use were young coffee followed by imperata grass, old coffee, mix coffee andforest.
43
Fertilizer equivalent (kg ha-1 yr-1) Growth Condition
Urea SP36 KCl
Monetary Value (Rp)
Min (poor) 30 6 15 71,700
Max (good) 127 27 63 305,400
Mean 69 15 34 165,900

Figure 2 shown that the difference in soil loss between the Arachis pintoi and control plotswas very significant. But as has shown by Dariah et al., (2005, this volume) soil loss in thisresearch site was very low.
44
Figure 2. Comparisonin soil loss between A.pintoi and control plotstwo years afterintroducing A. pintoion coffee farm, basedon Nov. 2003 to June2004 measurement.
Figure 1. The changes in soil properties of top soil (0 - 10cm) of Arachis pintoi and control plot from year2002 to 2004.

Tabel 4. Farmers' evaluation of soil fertility and erodibility.
Conclusions
• The present study showed that the use of Arachis pintoi as a cover crop for (young) coffeewas able to improve soil C and N contents and reduce erosion. Despite a need tosomewhat intensive weeding in the early stage of its growth, and perhaps a need toimprove soil P status for less fertile soils, it can be easily integrated into coffee farms; onceit is established it is adapted quite well under the high (800 m asl) elevation area likeSumberjaya, and it tolerates shading and cutting.
• Farmers were interested to test Arachis pintoi for improving their coffee farms because ofmultifunctions it promises such as: erosion control, soil fertility, fodder and/or organicmatter source. It has a great potential as a cover crop and for some tree crops like coffee,it requires adaptation in weeding/cutting technique; for instance by practicing ring cuttingtechnique prior to coffee harvest.
45
Parameters Indicators Fertility Erodibility
1. Slope
• Steep > 70% Poor Higher • Gentle <70% Fertile Lower
2. Texture
• Coarse Soils with more sand Poor Higher
• Fine Soils containing high loam and silt, little sand
Fertile Lower
3. Infiltration
• Fast Soils with aggregates and many pipes Fertile Lower • Slow Fine and compact soils Poor Higher
4. Water holding capacity
• Greater More organic matter Fertile Lower • Lower Little organic matter Poor Higher
5. Color
• Black High organic matter and litter, friable, porous and easy to cultivate.
Fertile Lower
• Brown Similar with black color, but organic matters (humus) already integrated with the soil
Fertile Lower
• Yellow Dry, granular/loose particles because of low cementing agents
Poor Higher
• Red Dry, low water holding capacity, sticky wet, compacted in dry season..
Poor Higher
• White/Pale Low water holding capacity and easily cause landslide.
Poor Higher
6. Organic matter
• Higher Black soil, more earthworm, good tilth, and greater water holding capacity.
Fertile Lower
• Lower Soil color red or yellow, low water holding capacity and easily compacted Poor Higher
7. Hardness
• Compact Sticky soils, low water infiltration, soil color red or yellow, in dry season soils become broken
Poor Higher
• Loose Soil color black, greater infiltration rate Fertile Lower

• Several soil indicators, such as slope degree, texture, infiltration, water holding capacity,color, organic matter and compaction could be used by local farmers to describe their soilfertility and erodibility.
References
Agus F, Gintings AN and van Noordwijk M. 2002. Pilihan TeknologiAgroforestri/Konservasi Tanah untuk Areal Pertanian Berbasis Kopi di Sumberjaya,Lampung Barat. International Centre for Research in Agroforestry. Southeast AsiaRegional Office. Bogor. Indonesia (In Indonesian).
Agus, F dan Widianto. 2004. Petunjuk Praktis Konservasi Tanah Lahan Kering. WorldAgroforestry Centre. Bogor. 102 pp.
46

V. Delineation of Erosion Prone Areas inSumberjaya, Lampung, Indonesia
Kasdi Subagyono, Setiari Marwanto, Cendy Tafakresno, and Ai Dariah
Soil Research Institute, Jln. Juanda 98, Bogor 16123, Indonesia
Abstract
In developing soil conservation measures under several conservation projects, criteria fortargeting the erosion prone areas have been based on slope gradient and the nature of cropcover. Research in Sumberjaya, Lampung, Indonesia, under coffee based farming systems hasrevealed that soil physical properties are also of prime importance in determining soilsusceptibility to erosion. Although in many of the popular erosion prediction models this hasbeen understood, but this factor has not been fully exercised. As such, recommendation haslead to unnecessary overly interventions on some parts of landscape and negligence on otherparts where interventions are really necessary. This research was aimed at providinginformation of 'hot spots' where attention for soil conservation interventions is necessary inthe form of 'erosion prone' map under coffee-based farming systems in Sumberjaya, WestLampung, Indonesia. Previous study showed that some physical soil properties such asdrainage pores and saturated hydraulic conductivity (K-sat) strongly affected soil erodibility.This provides insights to simplify assessment approach of soil susceptibility to erosion. Thisdelineation activity included observation of mini pits and characterization of soil physicalproperties within land units that have been defined using topographic map, land form map,and soil map. Using existing slope and land use maps, as well as observation on soil depth,erosion prone map was developed. This map will be used for targeting priority areas forconservation; a product necessary in the on-going negotiation support system in the researcharea under the Community Forest (Hutan Kemasyarakatan, HKm) scheme.
Introduction
Many methods have been used for predicting plot scale soil loss. These include the empirical,famous and popular model of Universal Soil Loss Equation/USLE (Wischmeier and Smith,1978) and the physical process-based model such as Griffith University Erosion SystemTemplate/GUEST (Rose et al., 1997). Several models have also been developed to predict soilloss under catchment scale such as Areal Non-point Sources Watershed EnvironmentResponse Simulation/ANSWERS and Agricultural Non-Point Source Pollution Model/AGNPS. However, it is often that those methods are not practicable due to many parametersinvolved that can not be fulfilled in most development projects. This is one of the mostchallenging tasks when the budget is limited or due to lack of sufficient number of trainedpersonal in (Srinivasan, 2003). Many others studies have recently been conducted by someauthors concerning erosion prediction model for ungauged watershed (for example, Sharmaand Sharma, 2003; Aksoy, 2003; Santos et al., 2003).
47

A simple method to delineate erosion hazard has been developed, which is based on therelationship between pedogenetic processes and erosion. Slope length and gradient, cropcover and management level, rainfall erosivity, and soil erodibility have long been understoodby many authors as important factors in soil erosion, but recommendation at field levelmostly considered slope gradient and, to a lesser extent, tree cover (Agus, 2001) because it isreadily observable and the data are relatively easily available.
Soil property spatial data that enable one to calculate soil erodibility and subsequently soilerosion hazard are rare, and without this data, targeting of area for soil conservation will beinappropriate in a way that there are areas that receive too much attention while other areasthat may actually need intervention are neglected.
In area of Sumberjaya, many studies have been conducted involving methods to predicterosion in both plot and catchment scales under the coffee based cropping system. Previousresearch results as cited by Agus et al. (2002) and Agus (2002) showed that coffee trees afterthree years old, by themselves, serve as effective soil conservation measures especially if theywere planted in association with other trees in a multi-strata architecture. Furthermore, otherresearch showed that the level of soil loss under coffee based cropping system is very sitespecific. Under 3 year cropping soil loss ranged from around 1 t ha-1 yr-1 to 37 t ha-1 yr-1
(Dariah et al., this volume; Khairiah et al., this volume). This comparison, based onexperiment conducted under similar coffee system and slope gradient, explained that thesetwo factors were not the most important determinant of soil erosion. Thus, soil physicalproperties at the research sites were evaluated and the data convincingly suggested that theseproperties have strong correlation with soil loss (Dariah et al., this volume).
The objectives of this research were to:
a. develop acceptable approach to estimate erosion hazard through characterizing propertiesof the soil
b. correlate selected soil properties with potential soil loss
c. provide soil erosion prone map for Sumberjaya Sub-district as a guide for soil conservationmeasures and to assist the local farmers and forestry services in negotiating where andwhat technology intervention to be implemented.
Materials and Methods
a. The Watershed Setting
This research was located in Way Besai Watershed which shares almost coincident borderswith the Sub-district of Sumberjaya, West Lampung District, Lampung Province, Indonesia(4045' - 5015' S and 104015' - 104045' E). The area map is given in Figure 1. The altitude ofthis area ranges from 700 to 1,700 m asl. The study area, the Way Besay Watershed, of47,800 ha is surrounded by the mountains of Subhanallah (1,623 m asl) in the north,Sekincau (1,718 m asl) in the west, Tangkit Tebak (2,115 m asl) in the east and TangkitBegelung (1,213 m asl) in the south.
Landscape of the study area is formed during the eruption of part of the mountainousarea of Bukit Barisan. As reported by Van Bemmelen (1949), this area was situated in theignimbrite eruption area which was called the Tuff of Lampung. The eruption occurred in
48
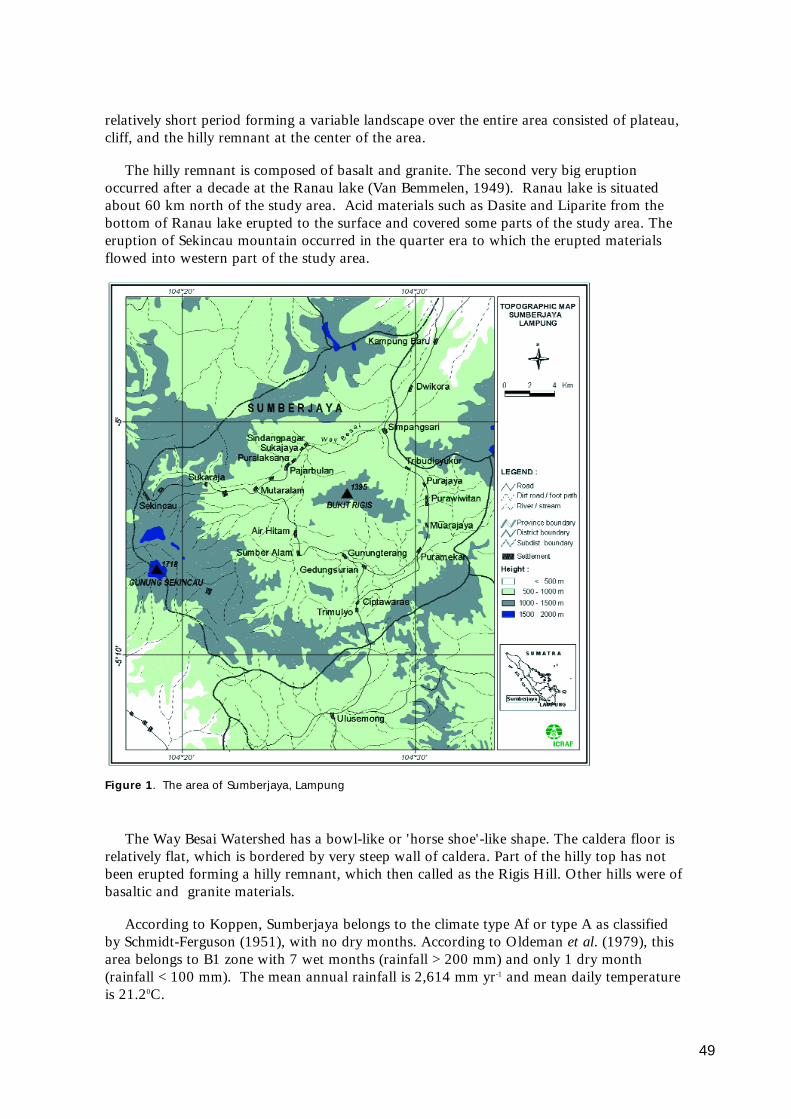
relatively short period forming a variable landscape over the entire area consisted of plateau,cliff, and the hilly remnant at the center of the area.
The hilly remnant is composed of basalt and granite. The second very big eruptionoccurred after a decade at the Ranau lake (Van Bemmelen, 1949). Ranau lake is situatedabout 60 km north of the study area. Acid materials such as Dasite and Liparite from thebottom of Ranau lake erupted to the surface and covered some parts of the study area. Theeruption of Sekincau mountain occurred in the quarter era to which the erupted materialsflowed into western part of the study area.
Figure 1. The area of Sumberjaya, Lampung
The Way Besai Watershed has a bowl-like or 'horse shoe'-like shape. The caldera floor isrelatively flat, which is bordered by very steep wall of caldera. Part of the hilly top has notbeen erupted forming a hilly remnant, which then called as the Rigis Hill. Other hills were ofbasaltic and granite materials.
According to Koppen, Sumberjaya belongs to the climate type Af or type A as classifiedby Schmidt-Ferguson (1951), with no dry months. According to Oldeman et al. (1979), thisarea belongs to B1 zone with 7 wet months (rainfall > 200 mm) and only 1 dry month(rainfall < 100 mm). The mean annual rainfall is 2,614 mm yr-1 and mean daily temperatureis 21.20C.
49

b. Survey and Mapping Techniques
Field survey and laboratory measurements were done to characterize soil physical propertiesand relating those to susceptibility to erosion. Four thematic maps i.e. topographic map,landform map, soil map and land cover map at uniform scale of 1 : 50,000 were used toproduce a land unit map of Sumberjaya area. A land unit map was produced based on anoverlay of the slope map and landform map as the basis for land units, and the land unitswere further subdivided into smaller land units on the basis of differences in land cover. Thetopographic maps at scale of 1: 50,000 was used to determine the slope length. Slopes wereclassified into 5 different classes (Table 1).
Table 1. Slope Classes of Sumberjaya Sub-district.
* Map scale 1:50,000 and contour interval 25 m
Landform classes were described by characteristic assemblages of slope, relief, drainagepatterns and rock types. These were obtained from soil and geological maps, and/or fieldknowledge.
The land units were used as the basis for all further assessment concerning land resourcefactors. At each different land unit, soil samples were taken at 10, 20 and 30 cm depths,including core and bulk samples. The collection of soil samples was carried out usingsystematic sampling technique.
Soil pits were dug at representative points at each land unit to characterize morphogenesisof soil, observe soil depth, and to take soil samples. Soil physical properties includingparticle size distribution, structure, and saturated hydraulic conductivity (K-sat) wereanalyzed in the laboratory using the core and bulk samples. Other analyzed soil physicalproperties such us bulk density, total soil pores, pore size distribution and aggregate stabilityindex were required to produce delineation of erosion prone areas of Sumberjaya morecomprehensively.
To choose the most determinant parameter to potential soil loss, a principal componentanalysis (PCA) was done. The variables which passed from the screening of PCA wereconsidered in the delineation of erosion prone areas. To relate the soil variables with thepotential soil loss, data of soil loss from previous study were used.
To delineate the erosion prone, most determinant soil properties and slope were overlaid.Three classes of erosion prone were introduced by considering those three parametersincluding low, medium and high levels. The overall framework to produce erosion prone mapis presented in Figure 2.
50
Slope class
Class interval (%) Description Distance between contour lines (mm)*
I
II
III
IV
V
0 - 8
8 - 15
15 - 25
25 - 40
> 40
Flat to gentle sloping
Moderately sloping
Strongly sloping
Moderately steep to steep
Very steep
> 6.2
3.3 - 6.2
2 - 3.3
1.2 - 2
< 1.2
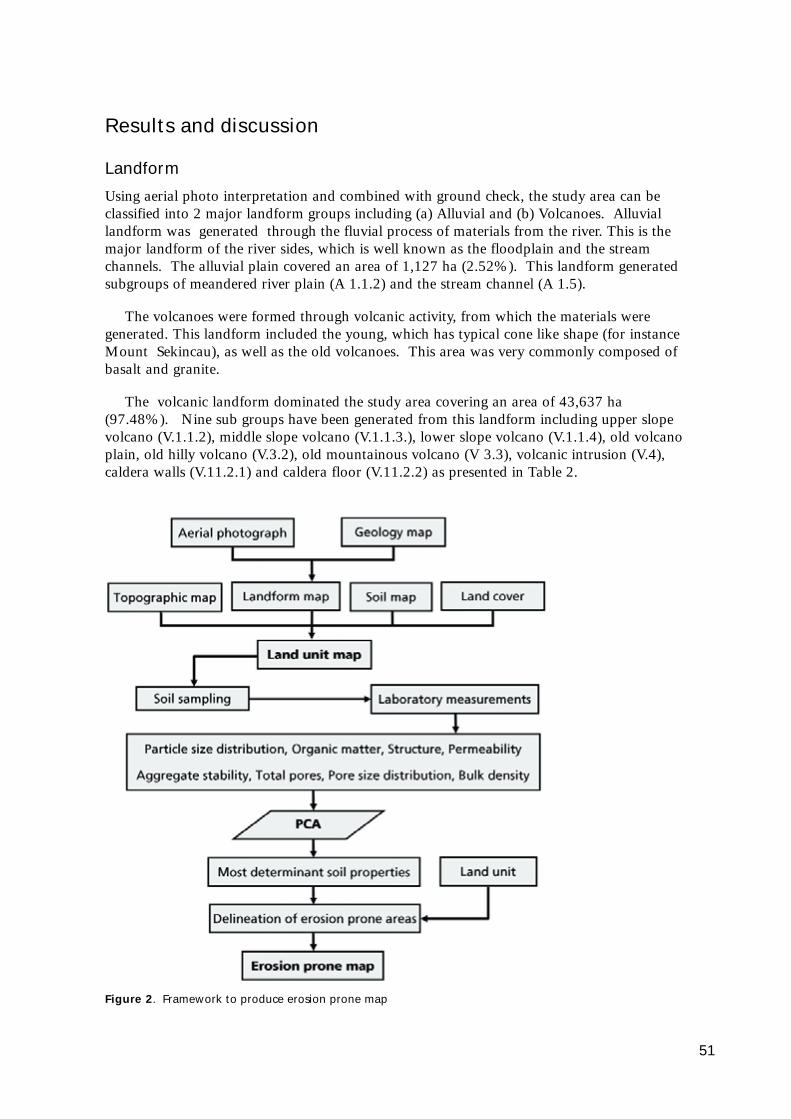
Results and discussion
Landform
Using aerial photo interpretation and combined with ground check, the study area can beclassified into 2 major landform groups including (a) Alluvial and (b) Volcanoes. Alluviallandform was generated through the fluvial process of materials from the river. This is themajor landform of the river sides, which is well known as the floodplain and the streamchannels. The alluvial plain covered an area of 1,127 ha (2.52%). This landform generatedsubgroups of meandered river plain (A 1.1.2) and the stream channel (A 1.5).
The volcanoes were formed through volcanic activity, from which the materials weregenerated. This landform included the young, which has typical cone like shape (for instanceMount Sekincau), as well as the old volcanoes. This area was very commonly composed ofbasalt and granite.
The volcanic landform dominated the study area covering an area of 43,637 ha(97.48%). Nine sub groups have been generated from this landform including upper slopevolcano (V.1.1.2), middle slope volcano (V.1.1.3.), lower slope volcano (V.1.1.4), old volcanoplain, old hilly volcano (V.3.2), old mountainous volcano (V 3.3), volcanic intrusion (V.4),caldera walls (V.11.2.1) and caldera floor (V.11.2.2) as presented in Table 2.
Figure 2. Framework to produce erosion prone map
51

Meandered floodplain, the stream channel, the caldera floor had relatively flat to gentleslopes (< 15%), while upper slope volcano, old mountainous volcano, and caldera wall arehad the steep to extremely steep slopes (> 40%). Middle slope volcano, old hilly volcano andvolcanic intrusion have moderately steep to steep slopes (15-40%). The lower slope volcanoand old volcanic plain have gentle to undulating slopes (3-15%).
As it has been indicated from the interpretation of aerial photo and Landsat TM 7 imageand field observation, the area of Sumberjaya was formed by the volcanic activities. Theprocesses involved in the formation were eruption, intrusion, and secondary geomorphicprocess, which has generated a specific landform.
As the center of eruption of Lampung tuff, the area possessed the original materials andspecific landform such as depression, cliff, hilly remnants (the Rigis Hill) and the recentformation through the subsequent eruption process. On the top of the cliff was the hilly andmountainous formation of Bukit Barisan and the recent formation of volcano activity such asmount of Sekincau.
Table 2. Landform composition in the study area
Table 3. Slope steepness of the Sumberjaya area
Landform having a single slope is dominated by the unconsolidated materials suchvolcanic ash. The light material was easily transported and deposited over the landsurface. Soils developed from volcanic ash materials formed specific characteristics such asTypic Hapludands. This soil distributed over the area of caldera floor, upper slope volcano,
52
Area Symbols Description Ha %
A.1.1.2 A.1.5 V.1.1.3 V.1.1.4 V.1.1.5 V.3.1 V.3.2 V.3.3 V.4 V.11.2.1 V.11.2.2
Meandered river plain Stream channel Upper slope volcano Middle slope volcano Lower slope volcano Old volcano plain Old hilly volcano Old mountainous volcano Volcanic intrusion Caldera walls Caldera floor
691 436 1,596 3,285 3,044 5,425 5,468 10,081 1,033 5,786 7,921
1.54 0.97 3.57 7.34 6.80
12.12 12.21 22.52
2.31 12.92 17.70
Total 44,764 100.00
Area Symbols Description Slope (%) Ha %
f n gs s ms st vst a
Flat Nearly flat Gently slope Sloping Moderately steep Steep Very steep Extremely steep, abrupt
< 1 1-3 3-8
8-15 15-25 25-40 40-75 > 75
1,105 1,808 6,561 5,046 4,690 10,258 7,911 7,385
2.47 4.04 14.66 11.27 10.48 22.92 17.67 16.50
Total 44,764 100.00

middle slope volcano and lower slope volcano including M. Sekincau and M. Subhanallah.Caldera walls with a single slope is generally dominated by consolidated materials such astuff and lava, which are locally covered by unconsolidated materials including TypicDystrudepts, Andic Dystrudepts, and Typic Hapludands.
Landform with complex slopes is dominated by consolidated materials such as tuff andlava. Landform of the Ranau tuff has a specific physical characteristic, where the soil hasrelatively high clay content with an obvious argillic horizon. This characteristics have formedTypic Hapludults and Typic Paleudults. Landform generated from tuff and lava materialscovered by thick volcanic ash and formed Andic Dystrudepts, while that covered by thinvolcanic ash formed Typic/Humic Dystrudepts and Ultic Hapludands.
Parent materials and Soil Classification
Parent material is the major factor affecting soil formation in the area of Sumberjaya.Usually, the soil characteristics can be detected from the type of parent materials from whichthe soils are formed. There were nine parent materials identified to form the soils of this area(Table 4). The tuff and volcanic materials had the largest distribution among the othermaterials, which comprise an area of 8,688 ha (19.41%). The spatial distribution of parentmaterials is presented in Figure 4.
Soil physical characteristics are very much determined by the parent materials and thetime of soil formation, which were indicated in the soil classification. The field survey ofsoil morphology and the laboratory analyses shown that there were three soil ordersincluding Inceptisols, Andisols and Ultisols, which generated 11 soil sub groups in this area(Table 4).
53
Figure 3. Topographic map of the Sumberjaya area, Lampung

a. Inceptisols
The presence of cambic horizon and the feature of soil structure are the keys to classifyingsoils into Inceptisols as it has been found as well in the area of Sumberjaya. This soil orderdistributed over various landforms of flat, hilly, volcanic intrusion and caldera walls withdominant materials of tuff and granite. The aquic regime soils are the soils of the suborderAquepts, which distributed along the river plain with dominant paddy fields. This soilincluded Typic Epiaquepts. In dry land area, most of the soils belong to the suborderUdepts, where the coffee plantation has been dominated. This suborder generated threesubgroups of soils including Andic Dystrudepts, Humic Dystrudepts, and Typic Dystrudepts.
Table 4. Parent materials of the major soils in Sumberjaya area
1. Typic Epiaquepts
This soil was developed from old tuff and volcanic materials and Ranau tuff, which hasdistributed over the area of caldera walls, old volcanic plain and old volcanic hilly. Ithas cambic horizon and having oxidation and reduction processes at the deeper horizon (>100 cm) with poor drainage condition. The soil color was grayish dark brown, silty clayloam texture, soft consistency, granular structure, and pH of 5.5-6.0. .
2. Andic Dystrudepts
This soil developed from tuff and old volcanic materials which was covered by volcanic ash(for instance Rigis). It has cambic horizon with relatively low base saturation (<25%), bulkdensity of < 1.0 g.cm-3 at one third atm, and Al + 1/2 Fe (by Ammonium oxalate) range from1 to 2 %, deep soil (>100 cm), and good drainage condition. The soil color is dark brown,silty clay loam texture, soft consistency, granular structure, and pH of 4.0-4.2.
3. Humic Dystrudepts
This soil developed from the parent materials of volcanic tuff. It was covered by volcanicash, which distributed in the area of old volcanic plain. Molic epipedon and cambic subhorizon has been used to characterize the soil to be Humic Dystrudepts and it has also beenfound in the area of Sumberjaya. The soil has low base saturation (< 25%), deep soil (> 100
54
Area Symbols Description Ha %
Al kv av(s) av(b) tr tv/av tlv(g) tl(g)/av tlv/av tlv bs gr
Alluvium Colluvium ash and volcanic tuff Volcanic ash (M. Sekincau) Volcanic ash (M. Subhanallah) Ranau tuff Volcanic tuff covered by volcanic ash Tuff and old volcanic lava (Rigis hill) Tuff and old volcanic lava (Rigis hill) covered by volcanic ash Tuff and old volcanic lava covered by volcanic ash Tuff and old volcanic Basalt Granite
1,127 7,921 5,387 2,476 2,691 3,577 3,765 648 7,451 8,688 436 597
2.52 17.70 12.03 5.53 6.01 7.99 8.41 1.45 16.64 19.41 0.97 1.33
Total 44,764 100.00

cm) and good drainage condition. The upper soil horizon (0-30 cm depth) has reddish darkbrown color, soft consistency, granular structure, and pH of 4.0-4.2, while the sub soilhorizon (30-60 cm depth) has yellowish red color, clay loam texture, slightly hardconsistency, sub angular blocky structure, and pH of 4.2-4.5.
4. Typic Dystrudepts
This soil developed from the parent materials of old volcanic tuff and lava and granite. Inthe Sumberjaya area, this soil distributed in the area of old volcanic hill, caldera walls andvolcanic intrusion. It has cambic horizon with relatively low base saturation (<25%), deepsoil (> 100 cm) and good drainage condition. The upper soil horizon (0-30 cm depth) isbrown, soft consistency, granular structure, and pH 4.0-4.2, while the sub soil horizon (30-60 cm depth) has yellowish red to red color, clay loam, slightly hard consistency, sub angularblocky structure, and pH 4.2-4.5.
b. Andisols
Andisols were developed from the parent materials rich in volcanic ash or volcanic tuff andlava, which has been characterized by andic properties of > 36 cm thickness of the 0-60 cmsoil profile. In the field, this property can be indicated by using pH NaF, volcanic glass, finetexture, and the smeary property. The upper soil horizon has dark color and the soil is thick,while the subsoil horizon has yellowish brown, very deep, silty loam, smeary, light weight,and very soft. The andic properties of soils in Sumberjaya has been characterized as having >85% phosphate retention, > 2 % of Al + 1/2Fe content (using ammonium oxalate), and bulkdensity of < 0.9 g.cm-3. The typical profile of this soil is given in Annex 1.
55
Figure 4. Parent materials map of the Sumberjaya area, Lampung
Andisols developed under the aquic regime has generated aquands suborder, whichdistributed in the area of paddy field. This suborder generated soil subgroups of TypicEpiaquands and Typic Endoaquands. In dry land this soil has been found as Udands.
1. Typic Epiaquands
In the area of Sumberjaya, this soil developed from the parent materials of alluvium andcolluvium of volcanic ash, which distributed in the stream channel area, caldera floor, middleand lower slope volcano. The oxidation and reduction processes occurred, the soil was deep(> 100 cm) and have a poor drainage condition. The upper soil horizon (0-30 cm depth)was grayish dark brown, silty clay texture, soft consistency, granular structure, and pH of4.0-4.2, while the sub soil horizon (30-60 cm depth) is grayish dark brown, clay loam,slightly hard consistency, sub angular blocky structure, and pH of 5.5-6.0.
2. Ultic Hapludands
This soil developed from the parent materials of old volcanic tuff and lava covered byvolcanic ash, which distributed in the old mountainous volcano area. It has argilic horizon,deep soil (> 100 cm) and slightly good to good drainage condition. The upper soil horizon(0-30 cm depth) was brown, silty clay loam, soft consistency, granular structure, and pH 4.0-4.2, while the sub soil horizon (30-60 cm depth) has yellowish red color, clay texture, hardconsistency, sub angular blocky structure, and pH 4.2-4.5.
3. Typic Hapludands
Typic hapludands in the Sumberjaya area developed from the materials of volcanic ash. Thissoil distributed in upper slope of volcano, middle slope volcano, lower slope volcano, andcaldera floor. It is a deep soil (> 100 cm) with good drainage condition. The upper soilhorizon (0-30 cm depth) was black to dark brown, silty clay loam, soft consistency, granularstructure, and pH 4.0-4.2, while the sub soil horizon (30-60 cm depth) was dark brown tobrown color, clay loam, slightly hard consistency, sub angular blocky structure, and pH 4.2-4.5.
c. Ultisols
The soil developed with typical characteristics of the presence of clay skin as resulted byilluviation in the B horizon (argilic horizon). This soil distributed in old plain volcano, oldhilly volcano, and old mountainous volcano. In the field, the argilic feature can be indicatedby clay skin and hard soil consistency.
Ultisols in dry land of Sumberjaya area included Humults and Udults suborder. Thesubgroup soils, generated from humults order, wasTypic Haplohumults, while Udultsgenerated Typic Paleudults and Typic Hapludults.
1. Typic Haplohumults
The soil was formed from the parent materials of old volcanic tuff and lava covered byvolcanic ash and basalt. The soil distributed in old plain volcano, old hilly volcano, oldmountainous volcano and volcanic intrusion areas. The upper soil layer (0-15 cm) has 0.9%organic C and the soil was characterized by the presence of argilic horizon. It is deep (> 100cm) with slightly good to good drainage condition. The upper soil horizon (0-30 cm depth) isdark brown, silty clay loam, soft consistency, granular structure, and pH 4.0-4.2, while thesub soil horizon (30-60 cm depth) has yellowish red to red color, clay, hard consistency, subangular blocky structure, and pH 4.2-4.5.
56

57
2. Typic Paleudults
This soil developed from the materials of the Ranau tuff, which has distributed in old hillyvolcano. Argilic horizon has been characteristic of this soil profile and it has deep profile (>150 cm) with slightly good to good drainage condition. The upper soil horizon (0-30 cmdepth) has brown color, silty clay loam, soft consistency, granular structure, and pH 4.0-4.2,while the sub soil horizon (30-60 cm depth) is reddish brown, clay, hard consistency, subangular blocky structure, and pH 4.2-4.5.
3. Typic Hapludults
Typic Hapludults of the area of Sumberjaya were developed from the parent materials of theRanau tuff and old volcano tuff and lava. As other sub group, this soil has argillic horizonand deep soil (> 100 cm) with slightly good to good drainage condition. This soil weredistributed in old hilly volcano and old mountainous volcano. The upper soil horizon (0-30cm depth) has dark brown color, silty clay loam, soft consistency, granular structure, and pHof 4.0-4.2, while the sub soil horizon (30-60 cm depth) is reddish brown, clay, hardconsistency, sub angular blocky structure, and pH of 4.2-4.5.
Soil properties
Soil properties varied with parent materials in which the soils originated from the volcanicash materials coincided with low erosion hazard, while the soils derived from the tuffmaterials mostly susceptible to erosion.
Soils derived from volcanic ash have highest C-organic (6.06%) with low bulk density(0.72 g cm-3) and high aggregate stability index of 105. Soils generated from basalts andgranite had lower aggregate stability index (86) (Table 5).
From the PCA (Figure 5) it was identified that the saturated hydraulic conductivity(permeability) was the most important soil physical variable that affected erosion pronenessin the study area. Other important soil characteristic in this respect was organic mattercontent.
Land cover
Coffee plantation is the major land use in the study area. Other land uses were also identifiedincluding forest and sawahs (lowland rice fields). The distribution of land covers over theentire area is presented in Figure 6. Land cover by crop canopy varied very widelydepanding on the level of coffee growth and the farming systems (Table 6). Land cover of25-50 % was the largest. The area having > 75 % land cover was still large reflecting goodsoil protection, in general.
As far as the erosion is concerned, land cover plays an important role to intercept rainfalland protect the surface soil aggregates from detachment of high energy rain drops. This isthe reason why the land cover is integrated into the procedure to delineate erosion proneover the study area.

Table 5. Bulk density, aggregate stability index, Permeability and C-organic of soils with differentmaterials
Erosion susceptibility map
The erosion susceptibility/erosion prone map was based on delineation of the potentialerosion into 4 classes i.e. negligible, low (< 2 Mg ha-1 yr-1), medium (2-10 Mg ha-1 yr-1) andhigh (> 10 Mg ha-1 yr-1). The classes (low, medium and high) were derived from the PCAanalysis and the analysis and interpretation of the landform (for the 'negligible' class). Thedistribution of the erosion prone area is presented in Table 7 and depicted in Figure 7.About 37% of the area is susceptible to erosion, 29% with medium erosion rate and 30%with low erosion rate. Only about 4% is the area with negligible erosion level.
58
Parent materials Bulk density (g cm-3)
Aggregate stability index
Permeability (cm hr-1)
C-organic (%)
Volcanic ash Tuff and lava Basalts Granite
0.72 0.93 1.04 0.95
105 101 102
86
12.4 7.4 8.1 6.2
6.1 3.3 2.2 2.6
Legend: Perm = permeability (saturated hydraulicconductivity); PDC = Quick drainage pores;RPT = Total pore space; BD = Bulk density;C = Organic carbon.VTi = indicate pints of observation
Figure 5. Results of principal componentanalysis of several soil properties in relation toerosion

Table 6. Distribution of land covers in the Sumberjaya, lampung.
Table 7. The distribution of erosion prone classes of Sumberjaya Sub-district, Lampung
59
Figure 6. Land cover map of the Sumberjaya area, Lampung
Area Symbols Description
Ha %
Ht Forest 5,057 11.3
K1 0-25% of land cover 1,999 4.5
K2 25-50% of land cover 13,251 29.6
K3 50-75% of land cover 12,050 26.9
K4 > 75% of land cover 10,313 23.6
Sw Sawahs 1,840 4.1
Total 44,764 100
Area Erosion rate (Mg ha-1 yr-1)
Description Ha %
0 < 2 2-10 > 10
Negligible Low Medium High
1,840 13,508 12,838 16,578
4.11 30.18 28.68 37.03
Total 44,764 100.00

60
Conclusions
• For the Sumberjaya case, it appears that the erodibility "K" could not sufficiently explainthe soil susceptibility to erosion and thus, a few key soil physical properties were selectedto meet this purpose.
• Soil physical properties are highly influenced by pedogenetic features and this knowledgeguided us for a simpler procedure to delineate erosion prone areas compared toconventional technique.
• About 37% of the Sumberjaya area has a high (> 10 Mg ha-1 yr-1), 29% medium (2-10Mg ha-1 yr-1), 30% low (< 2 Mg ha-1 yr-1) erosion rate and 4% with negligible erosionrates. This delineation could be used as a guide to set the priority areas for soilconservation intervention.
References
Agus F, Gintings AN dan Noorwidjk M. 2002. Pilihan Teknologi Agroforestri/KonservasiTanah untuk Areal Pertanian Berbasis Kopi di Sumberjaya, Lampung Barat(Agroforestry/soil conservation technology options for coffee based farming area inSumberjaya, West Lampung) International Centre for Research in Agroforestry. Bogor.60 p. (in Indonesian).
Agus F. 2002. Facilitating the Development of Conservation farming and AgroforestrySystem In Background for ACIAR Project Planning Meeting. Sumberjaya. Lampung.
Figure 7. Erosion susceptibility map of the Sumberjaya area, Lampung

Agus F. 2001. Selection of soil conservation measures in Indonesian regreening program. p.198-202 In D.E. Stott, R.H. Mohtar, and G.C. Steinhardt (eds.). Sustaining the GlobalFarm: Selected Papers from the 10th International Soil Conservation OrganizationOrganization (ISCO) Meeting held May 24-29, 1999 at Purdue University. PurdueUniversity Press. Purdue, USA.
NWMCP (National Watershed Management and Conservation Project). 1997.. TechnicalReport 31. Central Guidance Team Regreening and Reforestation, Ministry of HomeAffairs, Republic of Indonesia.
Kurnia U, Abdurachman A, and Sukmana S. 1986. Comparison of two methods in assessingthe soil erodibility factor of selected soils in Indonesia. In: Pemberitaan Penelitian Tanahdan Pupuk No.5. Pusat Penelitian Tanah, Departemen Pertanian. Bogor (In Indonesian).
Annex 1. Soil profile of Sekincau (volcanic ash, left) andLaksana (tuff and volcanic lava, right)
61
No obs. TB 2 (Sekincau)
Soil ClassificationUSDA (1999): Typic HapludandParent material: Volcanic ash of SekincauPhysiographi/Landform: Volcanic plainSlope: Moderately sloping (single slope)Drainage: Good Land Use: Coffee tree > 75% coverageVillage: Dusun Tambak Jaya
No obs. TB 5 (Laksana)
Soil ClassificationUSDA (1999): Andic DystrudeptsParent material: Tuff and old volcanic lava (Rigishill) covered by volcanic ashPhysiographi/Landform: Volkanic hillSlope: Flat to gently sloping (single slope)Drainage: Good Land Use: Coffee tree 25-50% coverageVillage: Dusun Simpangsari


VI. Runoff and Sediment Yield from Coffee Micro-Catchment Under Humid Tropical
Climate of Lampung, Indonesia
Afandi
Faculty of Agriculture, University of Lampung, Indonesia Jl. Sumantri Brojonegoro No.1 Bandar Lampung 35145, Lampung Province, Indonesia
Abstract
Anthropogenic activities such as path and road constructions, may affect the measured soilloss and sediment yield. Runoff and sediment yield from a micro-catchment dominated bycoffee (Coffea robusta) was investigated from 2001-2004. The micro- catchment is named"Saino" catchment, having an area of 1.86 ha and located in the Sumberjaya Sub-district,West Lampung District, Sumatra, Indonesia. Sediment yield increased sharply from 10 Mgha-1 to 59 Mg ha-1 in the second year, and 140 Mg ha-1 in the third year. Monthly sedimentyield data showed coincidence of sediment yield increase with farm footpath 'improvement'involving cutting of the original slope and accumulation of the loose soil clods downslope ofthe road. This path cut process exposed the unprotected and loose soil clods to the raindropsand runoff water and thus induced accelerated transport to the stream. The ratio betweenmaximum and minimum discharge was very high (>1000) due to the small size of thecatchment, very steep slope, catchment's shape and the short distance of the traveling runoffwater in the catchment. The runoff ratio which was calculated based on quick flow/effectiverainfall was about 13% on average, with the maximum value of 84%. The water budgetcalcaultion showed that the average storage capacity, i.e. percolating water that was notcaptured at the measuring flume, was 1.05 mm day-1.
Keywords: catchment, coffee, sediment yield, runoff
Introduction
The mean yearly rainfall which is around 2500 mm, soil susceptibility to erosion, as well asthe clean-weeding management in the coffee areas are considered as the main erosion factorsin the humid tropical coffee areas of West Lampung, Sumatra, Indonesia. The rapid changeof land use from forest to agriculture and from non intensive to very intensive agriculturemay accelerate soil erosion. Other activities such as road construction, especially if it is donenear the stream, may escalate the measured sediment in the stream.
In 1970 forest occupied 57% of Way Besai, a 54,000 ha watershed in which the Sainomicro-catchment exists. Forest area decreased to 21% in 1990 and to about 13% in 2000.On the other hand, small holder coffee (Coffea robusta) plantations increased from 0% in1970 to 42% in 1990 and to about 70% in 2002 (Syam et al., 1997; Dinata, 2002). This
63

process was continued, except for a small scale intercrop horticultural crop planting, due tovery low price of coffee bean since 2001.
Although the effect of forest conversion to stormflow is still a controversial issue (Bonell,1993), the change of land use and management practices may effect the outflow of sedimentyield from the catchments. Erskine et al. (2002) showed that the sediment yields fromforest/woodland increased by 1.07 times under pasture and 2.29 times under cultivation.Nelson and Booth (2002) showed that human activity in the watershed, particularly urbandevelopment, has caused an increase of nearly 50% in the annual sediment yield.
The availability of hydrological data including rainfall, streamflow and sedimentconcentration from coffee areas is rare for the humid tropics. Afandi et al. (2002) reportedthat the average soil loss from clean-weeded coffee areas, based on erosion plotmeasurement, was low, about 12 Mg ha-1 yr-1. However, it is difficult to extrapolate the resultof plot scale measurement to catchment scale owing to the very complex process of sedimenttransfer in the latter. The existence of vegetative filter as "temporary sediment sink" makesthe relationship between runoff and sediment yield and the simple descriptor of catchmentuncertain. Vegetative filter strips has been proved to effectively entrap sediment, while the"hot spot " such as bare road, footpath, land slide, serve as erosion sources. The transport ofsediment is also determined by the existence of "temporary sediment sink", such as paddyfield areas which usually located at the valley bottom. Paddy fields entrap the sediment fromthe adjacent areas temporary and may release it if there is enough energy to carry it.
Ceballos and Schnabel (1998) showed that valley bottom has great influence onhydrological response of the catchment, and made difficulty in estimating the importance ofrainfall factors, while the experiment of Braud et al. (2001) in Andes region showed difficultyin relating runoff volume and sediment yield to simple descriptors of the catchments such asthe average slope and/or the average vegetation cover.
This research emphasizes the measurement of runoff and sediment yield in micro-catchment dominated by coffee trees with paddy field at the valley bottom in Lampung,Sumatra, Indonesia.
Material and Methods
Description of the study area
The study was conducted from October 2001 until June 2004 in Bodong Jaya sub village,Sukajaya village, Sumber Jaya Sub-district, West Lampung District (Figure 1). The location isabout 187 km northwest from the capital of Lampung Province, Bandar Lampung. Thegeographic position is approximately 105026' E and 05002' S.
Runoff and sediment yield data were collected from Saino micro-catchment having anarea of 1.86 ha. The catchment is dominated by steep slope, with average of about 55%.The highest altitude in the catchment was 920 m and the lowest altitude was 864 m asl.
The length of the stream at Saino catchment was 88 m. Although the catchment is verysmall, the streamflow never dries during normal dry season. Coffee was planted about 8years prior to the initiation of this study. Paddy field was developed in January 2002 at thevalley bottom and the creek was stretching in the middle of paddy field areas. Before thepaddy field was created, the areas were fully covered by grass with no distinct channel. The
64
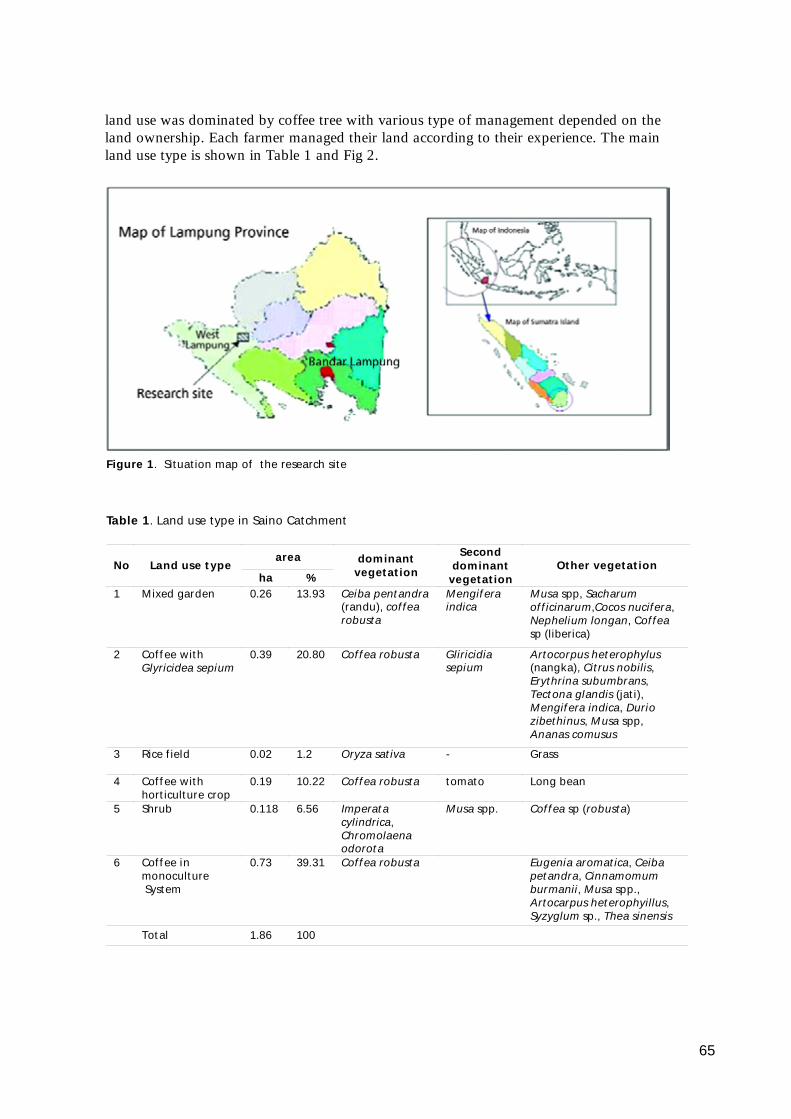
land use was dominated by coffee tree with various type of management depended on theland ownership. Each farmer managed their land according to their experience. The mainland use type is shown in Table 1 and Fig 2.
65
Figure 1. Situation map of the research site
area No Land use type
ha %
dominant vegetation
Second dominant
vegetation Other vegetation
1 Mixed garden 0.26 13.93 Ceiba pentandra (randu), coffea robusta
Mengifera indica
Musa spp, Sacharum officinarum,Cocos nucifera, Nephelium longan, Coffea sp (liberica)
2 Coffee with Glyricidea sepium
0.39 20.80 Coffea robusta Gliricidia sepium
Artocorpus heterophylus (nangka), Citrus nobilis, Erythrina subumbrans, Tectona glandis (jati), Mengifera indica, Durio zibethinus, Musa spp, Ananas comusus
3 Rice field
0.02 1.2 Oryza sativa - Grass
4 Coffee with horticulture crop
0.19 10.22 Coffea robusta tomato Long bean
5 Shrub
0.118 6.56 Imperata cylindrica, Chromolaena odorota
Musa spp. Coffea sp (robusta)
6 Coffee in monoculture System
0.73 39.31 Coffea robusta Eugenia aromatica, Ceiba petandra, Cinnamomum burmanii, Musa spp., Artocarpus heterophyillus, Syzyglum sp., Thea sinensis
Total 1.86 100
Table 1. Land use type in Saino Catchment

The monoculture coffee at Saino catchment, which occupied about 39% of the total area,was dominated by old (>8 years) coffee tree with thick litter covers on the soil surface, andthe weeding was done not so intensively because the thick litter prevented the growing of theweeds. A small landslide occurred downslope of the mixed-garden was deposited at bottomof the valley, and this areas were planted by young coffee. The clean-weeded managementwas done for the young coffee to prevent the competition between weeds and the crops,because several horticultural crops were planted among the coffee trees.
The research site was situated at Recent Volcanic Formation in the Holocene age. Thematerials of the formation consist of andesitic to basaltic breccia, lava, and tuff (Amin et al.,1994). According to the Soil Taxonomy Classification (Soil Survey Staff, 1998), the soil wasdominated by Vertic Dystrudepts. This soil is dominated by clay fraction in all depths, highexchangeable Al, medium organic carbon, acid to very acid, high (>55%) total porosity, andlow (<1.0) bulk density.
Rainfall and Streamflow
The amount of rainfall was observed using manual and automatic "pulse counter type" raingauges. The effective rainfall was considered as the amount of rainfall that occurred after thebeginning of direct runoff.
Parshall-flumes (Figure 3) were set up at the outlet of micro catchment to monitor thestreamflow leaving the cacthment. The throat width of Parshal flume was 36 cm, and thelength was 120 cm. The Parshall flume was calibrated using the floating method duringrainfall event and the volumetric method for low streamflow. The relationship between waterdepth and streamflow (discharge rating curve) was calculated using the power regression, andthe result was used as the basic of streamflow calculation. The water depth in Parshall flumewas monitored using an automatic water level recorder (AWLR, Figure 3), which wasinstalled near the Parshall flume; the chart of the AWLR was changed daily. Based on therating curve derived, the stream flow was calculated.
Figure 3. Parshall flume and automatic water level recorder
66

Sediment Yield
Water sample, about 500 ml, was taken at outlet of the Parshall flume site with the samplingtime as follows:
(1) Two times a day, around 7:00 and 17:00, if there was no rain.
(2) Several times during the rainfall or runoff event from the beginning of direct runoff untilthe streamflow receded.
The water sample was filtered using "newspaper paper" and oven dried. Calculations ofsediment yield were done by separating the water samples into samples during rainfall eventand samples during no rainfall event. In case of no rainfall event, the total sediment yield wascalculated by averaging the sediment yield taken in the morning and in the afternoon usingthe following equation:
Sy : daily sediment yield (g day-1)Sdm and Sda : sediment concentration (g l-1) taken in the morning (Sdm) and in the
afternoon (Sda)Qd : average daily streamflow (l s-1)24×3600 : time (second)
In case of rainfall event, the sediment calculation in one day was separated into three groups:before rainfall events, during direct runoff event, and after direct runoff was over. Thefollowing formula was used to estimate the sediment yield:
Sy : daily sediment yield ( g day-1)
Sdb, Sdn , Sdo, Sdn : sediment concentration which taken before runoff event (Sdb), duringrunoff (Sdn), after runoff was over (Sdo), and in the next morning (Sdn) (g l-1)
Qm,Qr,Qo : average discharge when the sediment was taken(l s-1)
n : number of sediment sampling during runoff eventt m,t,r,t,o : time (second)
Results and Discussion
Rainfall
The monthly rainfall recorded in 2001-2004 is shown in Figure 4. The highest monthlyrainfall occurred on March 2002, which was 453 mm, and the lowest rainfall occurred onOctober 2002, which was 26 mm.
The amount of rainfall during this experiment time was normal for this area. Based on 24years data (1974-1998), Afandi et al. (1999) reported that the average rainfall from the
67
Sy = (Sdm + Sda)/2 x Qd x 24 x 3600
nSy = (Sdm x Qm x tm) + S Sdn/n x Qr x tr + {(Sdo + Sdn)/2} x Qo x to
n=1

adjacent raingauge station (Pajar Bulan climate station) was around 2426 mm yr-1, and themaximum rainfall occurred in 1978 was 3540 mm yr-1.
Sediment Yield
The pattern of monthly runoff (streamflow), rainfall and sediment yield during rainy seasonat Saino catchment is shown in Figure 5.
Figure 5 shows that correlation between rainfall and sediment yield is low. Although inthe first year of the experiment the total rainfall is higher than the second and the third year,the sediment yield was the lowest. The sediment yield increased from 10 Mg ha-1 in the firstyear to 59 Mg ha-1 in the second year, and 140 Mg ha-1 in the third year. Comparing theseresults with total soil loss data from plot scale experiment in other studies in Indonesia, thesecond and third year sediment yield data as shown in Figure 5 were very high. Onvegetables steep terrace, Sinukaban et al. (194; 1998) reported soil loss of 42-75 Mg ha-1 yr-1,while on agricultural bench terrace with mixed rainfed crops, van Dijk (2002) reported soilloss of 40 Mg ha-1 yr-1.
The increase of sediment yield in 2003 was attributed to soil clods mass transport (smalllandslides) which occurred near the catchment outlet, because a foot-path was developed inFebruary 2003. The sediment yield increased sharply in April, May, and November 2003(Figure5) due to this event.
68
Figure 4. Monthlyrainfall in BodongJaya, from January2001- October 2004
Figure 5. Cumulative ofrainfall, runoff andsediment yield during therainy season in 3 yearsexperiment

69
The maximum runoff was 100 l sec-1 while the minimum was 0.08 l sec-1. The high ratiobetween maximum and minimum discharge is very high (>1000), but considered normalbecause of the small size catchment (thus short distance of traveling runoff water) and thevery steep slope of about 55%. Other factor was probably because of the high drainagedensity of about 47.3 m ha-1.
Hydrograph Component
Analysis of hydrograph components showed the runoff ratio which was calculated based onquick flow/effective rainfall of about 13% in average, with maximum value was 84%.
Table 2. Summary analysis of hydrograph component
Several micro-catchments studies in similar hydroclimatic conditions in Indonesia showedthat runoff coefficient varied, and usually the value was low. The value of runoff coefficientas much as 17% was reported y Sinukaban et al. (1994; 1998) at vegetables steep terrace,while Rijsdijk (in van Dijk, 2002) found 12%. In steep slope bench terraced agriculture withmixed-rainfed cropping system, van Dijk (2002) found 5-9% of runoff coefficient for average6 yr observation. The value of 2-6% was found by Rijsdijk (in van Dijk, 2002) for mixedplantation forest.
Water budget
In a catchment scale, a simple equation of water budget could be written as follows:
R = Q + ET + S
where, R: rainfall, Q:streamflow; ET: evapotranspiration and S: storage in soil, infiltrate intodeep layer, and transported as lateral flow but not passing the measuring gauge.
The values of R and Q could be found in this experiment. Using Penman method, Ban(2000) measured potential evapotranspiration (PET) from coffee areas at Sumber Jaya fromJanuary until August 1999, and found that the average PET was 3.8 mm day-1. This value isnot different with the measure values of pan evaporation at Sumber Jaya, which rangedfrom 3.5 to 4.9 mm day-1 (Afandi et al., 1999). If we can use these values, the water budgetof these two catchments could be calculated and the results were shown at Table 3.
Table 3. Estimation of water budget in Saino catchment during 3 years experiment
Total rainfall Total streamflow Potential Evaporation Storage
Mm
7081 2366 3695 1020
Total flow
Base flow
Direct flow
Total Rainfall
Eff Rainfall
% Eff Rainfall
Runoff ratio
Average 2.04 0.49 1.56 22.41 11.12 52.35 12.83
Max 9.97 1.76 8.84 47.50 32.50 97.78 84.09
Min 0.07 0.04 0.01 4.00 0.95 8.16 0.52

Table 3 showed that the storage (S) of the catchments was very high, 1.05 mm/day.Probably most of storage water will infiltrate into the deeper soil and flow out todownstream areas, enhance the high leaching. This high leaching was shown by the fact thatalthough the soil was located at recent volcanic areas, the soil has already been weatheredintensively, and landslide is frequently occurred during rainy season.
Conclusions
During a three years experiment from 2001-2004 in a coffee microcatchment in Lampung,Indonesia, the sediment yield recorded increased sharply year by year, from 10 Mg ha-1 in thefirst year, to 59 Mg ha-1 in the second year, and 140 Mg ha-1 in the third year. This sharpincrease was attributed to mass soil transport from footpath construction near the outlet ofthe catchment. The ratio between maximum and minimum discharge is very high (>1000)due to the very steep slope, catchment's shape and the small size catchment. The runoff ratiowhich was calculated based on quick flow/effective rainfall was about 13% on average, witha maximum value of 84%.
This research reemphasized that construction, near the stream, of road or foot paths, aswell as any other activities that causes the loosening and exposure of soil to raindrops shouldbe avoided because of its severe effect on sedimentation in the stream.
Acknowledgment
This research was supported by International Centre for Research in Agroforestry (ICRAF)South East Asia as part of the Alternative to Slash and Burn Phase 3 (ASB Phase III), inwhich the funding was originated from Australian Centre for International AgriculturalResearch (ACIAR). Our thanks is also extended to Dr. Fahmuddin Agus, from Centre forSoil and Agroclimate Research, Indonesia, as a technical supervisor of this research and toDr. Meine van Noordwijk, the Regional Coordinator of ICRAF Southeast Asia; both havegiven inputs for the research and this report.
References
Afandi, Gafur A, Swibawa IG and Purnomosidhi P. 1999. Baseline biophysical informationabout the Tulang Bawang watershed area, North Lampung. Proceeding of the Management of Agrobiodiversity in Indonesia for Sustainable Land Use and GlobalEnvironment Benefits. ASB-Indonesia Report Number 9. Bogor, Indonesia: 76-192
Afandi, Manik TK, Rosadi B, Utomo M, Senge M, Adachi T and Oki Y. Soil erosion undercoffee trees with different weed managements in humid tropical hilly area of Lampung,South Sumatra, Indonesia. J. of the Japanese Society of Soil Physics (in print).
Amin TC, Sidarto, Santoso S & Gunawan W. 1994. Geology of the Kotaagung Quadrangle,Sumatera. Scale 1:250,000, Geological Research and Development Centre, Bandung,Indonesia: 113.
Ban. 2000. Influence of weed vegetaion and soil properties to soil loss. Undergarduate thesis,Faculty of Agriculture, Gifu University: 88 (in Japanese).
70

Bonell M. 1993. Progress in understanding of runoff generation dynamics in forest. J. ofHydrology 150: 217-275.
Braud I, Vich AIJ, Zuluaga J, Fornero L and Pedrani A. 2001. Vegetation influence on runoffand sediment yield in the Andes region observation and modeling. J. of Hydrology 254:124-144.
Bruijnzeel LA. 1983. Hydrological and biogeochemical aspects of man-made forests in Southcentral Java, Indonesia, PhD thesis, Vrije Universiteit, Amsterdam: 250.
Ceballos A and Schnab S. 1998. Hydrological behaviour of a small catchment in the dehesalanduse system (Extremadura, SW Spain), J. of Hydrology, Vol. 210 (1-4): 146-160.
Erskine WD, Mahmoudzadeh A and Myers C. 2002. Land use effects on sediment yields andsoil loss rates in small basins of Triassic sandstone near Sydney, NSW, Australia.CATENA 49 (4): 271-287.
Gintings AG. 1982. Surface Run-off and Soil Erosion under Coffee Plantation and NaturalForest at Sumber Jaya-North Lampung, Forest Research Institute, Ministry ofAgriculture Indonesia, Report No.399 (in Indonesian).
Mitchell JK and Bubenzer GD. 1980. Soil loss estimation. In: Soil Erosion. Kirkby , M.J. andR.P.C. Morgan (eds), A Wiley-Interscience Publication: 17-61.
Syam T, Nishide H, Salam AK, Utomo M, Mahi AK, Lumbanraja J, Nugroho SG andKimura M. 1997. Land use change in a hilly area of south Sumatra, Indonesia (from1970 to 1990). Soil Sci. Plant Nutr., 43 (3) : 587-599.
Nelson EJ and Booth DB. 2002. Sediment Sources in an urbanizing mixed land-usewatershed. J. of Hydrology 264: 51-68.
Sinukaban N, Pawitan H, Arsyad S, Amstrong J, Nethery M. 1994. Effect of SoilConservation practices and slope length on runoff, soil loss, and yield of vegetables inWest Java, Indonesia. Australian J. of Soil and Water Conservation 7:25-29.
Sinukaban N, Pawitan H, Arsyad S and Amstrong J. 1994. Impact of soil and waterconservation practices on stream flows in Cetere catchment, West Java, Indonesia,Advances in GeoEcology 31: 1275-1280.
Soil Survey Staff. 1998. Keys to Soil Taxonomy, Eighth Ed., USDA-Natural Res. Conserv.Serv., Washington D.C.
Van Dijk AIJM. 2002. Water and Sediment Dynamics in Bench Terraced AgriculturalSteeplands in West Java, Indonesia, PhD Thesis, Vrije Universiteit, Amsterdam:378.
71

73
VII. Multistrata Coffee System as an Alternative toSustain Sumberjaya Ecological System
Tumiar K. Manik and Agus Karyanto
Faculty of Agriculture, University of Lampung, IndonesiaJl. Sumantri Brojonegoro No.1Bandar Lampung 35145, Lampung Province, Indonesia
Abstract
Multistrata tree-based systems is considered as one of the most ideal form of farming in theprotection forest margin as they promise not only environmental protection, but also supportthe people livelihood that depends on the land. The management and canopy arrangement ofthe systems, however, may affect it the microclimate and coffee growth and yield. Thisresearch compared sun (monoculture) young coffee of about three years old, youngmultistrata coffee of 4 years old and old multistrata coffee with 12 years old coffee, eachmeasured from plots of 2000 m2 area. The young monoculture and multistrata coffee hadless canopy cover and implicitly allowed more light entrance into the canopy. The oldmultistrata system may have been overshaded and thus yielded less coffee berries than theyoung multistrata. The pattern of evaporation was unclear may be due to insufficientreplication and instrumentation. Pruning of some of the shading trees or rejuvenation ofcoffee may be necessary if farmers consider coffee as the main component in the system.
Introduction
Vegetation cover influences micro-climatic and hydrological processes because of interceptionof precipitation and thus modification of the amount of precipitation delivery to the groundsurface and change in the partitioning of water between infiltration and overland flow.Different kinds of canopy modify the spatial and temporal distribution of rainfall before itreaches the ground. Tree canopies can also influence the radiation regime, temperature,humidity, and wind speed of the understorey environment. The objective of this researchwere to evaluate the effects of multistrata (agro-forestry) of coffee-based systems on (i) waterbalance (net rainfall, potential evaporation, and soil evaporation), (ii) light interception inmonoculture coffee system and some existing multistrata systems, (iii) coffee growth andproduction, and (iv) economic benefits of coffee in monoculture system and multistrata coffeesystems.
Materials and Method
This research was conducted on coffee-based farmers field in Sumberjaya, West Lampung,Sumatra, Indonesia in 2002. The selected research plots were:
a. Plot 1 : Open, clean-weeded mono culture (sun) coffee (with about 3 year old coffee)b. Plot 2 : Young existing multistara coffee system (with coffee of 4 years old)
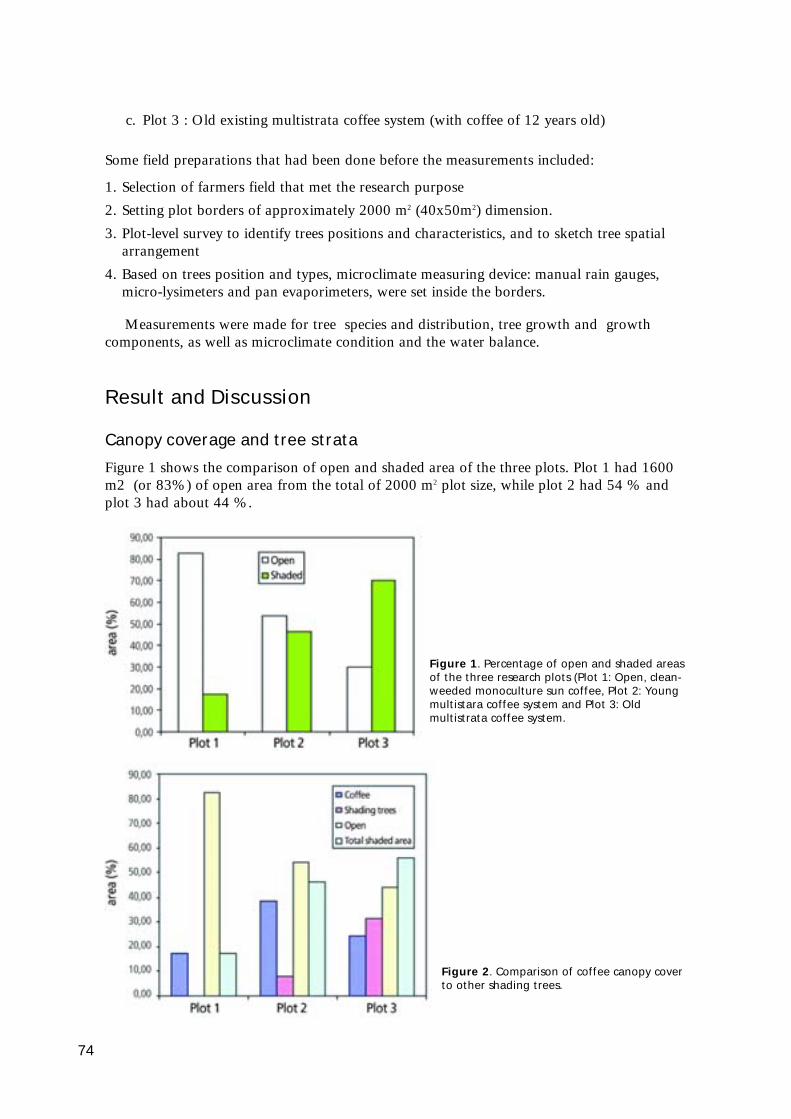
c. Plot 3 : Old existing multistrata coffee system (with coffee of 12 years old)
Some field preparations that had been done before the measurements included:
1. Selection of farmers field that met the research purpose
2. Setting plot borders of approximately 2000 m2 (40x50m2) dimension.
3. Plot-level survey to identify trees positions and characteristics, and to sketch tree spatialarrangement
4. Based on trees position and types, microclimate measuring device: manual rain gauges,micro-lysimeters and pan evaporimeters, were set inside the borders.
Measurements were made for tree species and distribution, tree growth and growthcomponents, as well as microclimate condition and the water balance.
Result and Discussion
Canopy coverage and tree strata
Figure 1 shows the comparison of open and shaded area of the three plots. Plot 1 had 1600m2 (or 83%) of open area from the total of 2000 m2 plot size, while plot 2 had 54 % andplot 3 had about 44 %.
74
Figure 1. Percentage of open and shaded areasof the three research plots (Plot 1: Open, clean-weeded monoculture sun coffee, Plot 2: Youngmultistara coffee system and Plot 3: Oldmultistrata coffee system.
Figure 2. Comparison of coffee canopy coverto other shading trees.

Figure 2 shows that the coverage for plot 1 (17%) completely came from coffee canopysince this plot is a monoculture coffee plot, plot 2 was still dominated by coffee canopy(38%) compared to other shading trees (8%), and plot 3 (with 56% coverage) and shadingtree canopy was higher than coffee ( 31% to 25%).
Figures 3 showed the spatial distribution of canopy projection area (coverage) for themultistrata plots. Plot 2 was generally covered by trees (beside coffee) with canopy areaabout 1.64 m2. Some parts of the plot were covered by trees that has larger canopy areas(3.3 to 6.6 m2). Most parts of plot 3 were covered by trees with canopy between 6.5 to 8 m2.
There were 4 strata for both Plots 2 and 3. For Plot 2, clove and pepper were at the first(lowest) stratum; coffee, sour soup and mango at the second stratum; banana in the thirdstratum and Gliricidia, sweet bark, and avocado at the fourth (highest) stratum. Coffee grewtogether in almost the same height with other trees (mango and soursop) and in some extentwere covered by other trees (Gliricidia, sweet bark, banana and avocado), but coffee canopywas dominated the coverage (8 to 38%). This condition allowed the coffee to receivedenough sunlight. However, competition for water might occur in this plot.
For Plot 3, cacao and coffee were in the lowest stratum, pepper at the second stratum;Gliricidia, jack fruit, guava, dammar, and stink bean (Parkia speciosa) at the third stratum,and then erythrina at the fourth stratum. Coffee in this plot were all covered far under othershading trees and the shading trees canopy had higher coverage than the coffee (25 to 31).This condition might reflect the amount of sun light that enter the plot which couldinfluence the growth and production of the coffee.
In general, coffee tolerates shading and root competition especially with trees in differentroot depth. Erythrina (Erythrina poeppigiana), Gliricidia (Gliricida sepium), dammar, cacao(Theobroma cacao), mango (Mangifera indica), soursop (Annona muricata), cinnamon
(Cinnamomum burmanii), banana(Musa spp.), guava (Psidiumguajava), clove (Eugenia aromatica),jack fruit (Artocarpus heterophylus)and avocado (Persea americana) aretrees that grow together with coffeein research plots. Erythrina andGliricidia were the most commonlyfound shading trees because of theirability to nitrogen in associationwith Rhyzobium root-nodulatingbacteria, being fast growing treesand easy adaptation to local soilcondition. Since they need full lightthey should be planted before thecoffee.
Figure 3. Kriging map of canopycoverage area (m2) of young multistratacoffee (top) and old multistrata coffee(bottom).
75

76
Loke coffee, cacao tolerates shading, but needs deeper soil. Mango and avocado havedeep roots and need full light, and so could function as shading trees. They probably will notcompete with coffee because of different depth of root distribution; most coffee roots aredistributed in surface soil layer. Soursop, cinnamon, guava and banana need about the samelight intensity as coffee but soursop and cinnamon have higher trunk than coffee and thuscould probably compete for light. Banana has about the same canopy height as coffee andhas deeper roots, and thus compatible with coffee. Clove grows better in lower altitude thancoffee so it is not recommended to be planted in the Sumberjaya area with elevation of about800 m asl. Jackfruit and guava have deeper root than coffee, and hence water competitionwould likely not occur.
Net rainfall
Canopy cover influences the amount of rainfall that reaches the soil surface. Figure 4 showsthe net rainfall on each plot. Plot 1 (monoculture coffee) received average net rainfall of 12mm (about 63% of rainfall of this particular event), while Plot 2 (a young multistrata)
received 12 to 13.9 mm with most ofthe plot area received 12.5 mm, andPlot 3 (old multistrata) received 7.3to 9.6 mm (most of plot area received8 mm) rainfall. It could be said thatsoil surface under more dense (68%)canopy received about 37% lessrainfall while difference canopy coverbetween 17% to 34% didn't makemuch difference in net rainfall. Therain on open area from the temporaryclimate station recorded during theresearch was about 12 mm, thatmeans canopy on Plot 1 and 2 didnot retain any rain in the canopy.
This result is higher than thatwas found by Wallace et al. (1999)in a research in Kenya that canopycover difference of about 50 %reduced net rainfall about 11 to 15%. Oke (1978) found that thecanopy of a deciduous forest canintercept 10 - 25 % while forconiferous forest can intercept 15 -40% of the total annual precipitation.The high canopy interception in thisresearch (about 37%) was because oflow intensity rainfall compared tothe result from the area of Wallace
Figure 4. Kriging map of net rainfall (mm fora 12 mm rainfall event for mono culture plot(top), young multistrata coffee (middle), andold multistrata coffee (bottom).

77
et al. (1999) study. Canopy interception depends upon the nature of the rainstorm than uponthe tree species (Oke, 1978).
Potential Evaporation
Potential evaporation reflects atmospheric demand of water from soil and leaves surface. Thisvalue is influenced by radiation interception, air temperature and humidity. Figure 5 showsthat Plot 1 evaporated from free water surface 5.5 to 6.4 mm day-1 with most of the plotevaporated 5.8 mm day-1, while Plot 2 evaporated 4.4 to 5.2 mm day-1 with most of the plotevaporated about 5 mm day-1 and Plot 3 evaporated 2.6 to 4.4 mm day-1 and most of the plotevaporated about 4 mm day-1. Little potential evaporation difference between Plots 1 and 2shows that different canopy cover between these plots didn't make much difference in airtemperature and humidity, they both had similar temperature and humidity. Air temperatureand humidity were not measured regularly in this research. Plot 3 with more dense canopycover showed lower potential evaporation. Air temperature was lower and/or air humiditywas higher below the canopy with coverage more than 50 %.
Canopy cover has a function toblock air fluctuation. Therefore,atmosphere or weather factors underdense cover will be more stable compareto the open one. Potential evaporationof Plots 1 and 2 were similar, meaningthat shading trees on Plot 2 still allowedradiation to enter the plots in about thesame distribution with that of Plot 1.Plot 3 had higher variation of potentialevaporation and lower evaporation rate(4 mm day-1) than Plots 1 and 2.
Actual Evaporation
While potential evaporation is totallyaffected by the atmosphere, actualevaporation is also affected by soil andvegetation factors. In this research,vegetation factor i.e. transpiration ratewas not measured because of difficultiesof setting up lysimeter under tree farmenvironment. In this research, actualevaporation was mainly due to soilsurface evaporation. Loss of waterfrom the soil surface throughevaporation is often a major componentin the soil water balance especially inthe area where full ground cover is notachieved (Jackson and Wallace, 1999).
Figure 5. Potential evaporation (mm day-1) formonoculture (top), young multistrata (middle)and old multistrata coffee (bottom).

Figure 6 shows that soil surfaceof Plot 1 evaporated 1 to 4.2 mmwater per day, Plot 2 3.8 to 4.5 mmday-1) and Plot 3 (0.8 to 3.7 mm day-
1) but no average value could bedrawn since the spatial distributionis "patchy". Canopy coverage hadcertain influence on actualevaporation by reducing radiationand input of rain due to canopyinterception. Therefore more coverageoften means less evaporation, andsoil condition created variability onthe actual evaporation. This can beseen in Plot 2. Although it is hasmore shading and also some litterunder the trees but it had higherevaporation than Plot 1.
Comparison of Plot 1 and Plot3 showed that canopy of Plot 3reduced evaporation by 12 - 24 %.Wallace et al. (1999) found that onan annual basis it has been shownthat on average tree canopy canreduce soil evaporation 35 %compared to completely bare soiland about 21 to 25 % for not fullyshaded (around 50%) cover.
Plot 3 which was old field has more stable and compact soil surface than the other twoplots which were new fields. Evaporation variation over this plot was greater because ofcanopy cover distribution. With clean weeded management on a hill slope and almost nolitter under the trees, soil surface at Plot 1 are easier to dry and erode. Plot 2 was alsomanaged as clean weeded but this plot had more canopy cover and started to have somelitter under the trees which caused the evaporation more stable (less varied) over the plot.
Surface coverage related to soil moisture could also be evaluated from the ratio betweenactual evaporation and potential evaporation. If the ratio is high, it means that there isenough water kept on the soil surface and this also showed that the surface has goodcoverage as to cause smaller actual evaporation than potential evaporation (Black and Ong,2000). The actual/potential evaporation ratio were 0.2 to 0.7 for Plot 1; 0.8 to 0.9 for Plot2 and 0.2 to 0.9 for Plot 3. The numbers reflect that surface of Plot 2 was the mostuniform and had a more stable moisture and that means that the canopy over this plot coversthe surface more evenly. For the other plots some parts of the area was dry or open, andother part was moist or shaded.
78
Figure 6. Actual evapotranspiration ofmono culture (top), young multistrata(middle) and old multistrata coffee(bottom).
In short, the above data reflect the water balance of the plot. For Plot 1 with input (netrainfall) of 12.6 mm and the output (actual evaporation) of 1 to 4.2 mm, the soil surfacereceived 8.4 to11.6 mm water. For plot 2 the input was 12.5 mm and the output wasbetween 3.8 and 4.5 mm and the surface retained 8 - 8.7 mm. For Plot 3 the input was 8mm and the output was 0.8 - 3.7 mm and the surface retained 4.3 - 7.2 mm. Plot 1 and 2retained almost the same amount of water; more than plot 3 since plot 3 received much lessrain because of the dense canopy. There is a possibility that water competition occurred inplot 3.
This fact is consistent with the result by Wallace et al. (1999) who found that in humidclimate, where either annual rainfall is high and/or rainfall intensities are high, losses due tointerception may be greater than savings due to reduced soil evaporation.
Approaching actual evaporation using lysimeter in this research had some weaknesses.Being a closed system, the lysimeter did not allow water to infiltrate into the soil and as theresult in rain days the lysimeter surface could be filled with water. Even though the water wasremoved before measurement took place, the wetness of soil in the lysimeter din't reflect thereal soil surface condition. There is a need to improve the design of the lysimeters to get abetter and more accurate result for this tree-based systems.
Coffee growth and production
Table 1 shows the comparison of coffee growth and production. Coffee on Plot 3 were thetallest (162 cm) and has biggest stem circumference (17.6 cm). Plots 2 and 3 had coffee withalmost the same height, but coffee on Plot 2 had better trunk, because perhaps of too muchshading in the former.
Coffee in plot 3 were not productive as reflected by the low number of productive twigs(9.0 compare to 33.6 on Plot 1 and 38.8 on Plot 2) and the non productive twigs were thehighest (13.4) for this plot. Average twigs length was highest on Plot 3 (104 cm) in compareto Plot 2 of 93 cm and Plot 1 of 62 cm. This was closely related to the number of nodes/twig.From the average number of nodes/branch and number of productive twigs, Plot 2 had thehighest yield potential (with 585 nodes), Plot 1 had 264 nodes, while plot 3 hads the lowest(135) nodes.
The average yield (berries dry weight) per plot were 192 kg in Plot 1, 349 kg in Plot 2,and 124 kg in Plot 3 (Table 1).
From this data it can be suggested that some treatments should be done for Plot 1 and 3to increase the yield. The summary of plots characteristics and all measurements on the threeplots is shown in Table 2.
In general, all farmers did not supply their field with fertilizers and pesticides, and hencemost of the expenses were assumed coming from labors. The young multistrata coffeesystem (Plot 2) gained highest income, and followed by the monoculture system (Plot 1), andthen by the old multistrata system (Plot 3).
79

Table 1. Comparison of average coffee growth and production between the three plots.
Table 2. Summary of measurement results over the research plots
80
Variable Plot 1 Plot 2 Plot 3
Plant height (cm) 92 134 162
Number of productive twigs/plant 33.6 38.8 9.1
Stem circumference (cm) 10.6 15.2 17.6
Canopy diameter (cm) 104 156 167
Number of unproductive twigs per tree 3.5 3.1 13.4
Top 8 73 89
Middle 85 96 107
Bottom 92 111 116 Twig length (cm)
Average 62 93 104
Top 2.5 9.2 14.2
Middle 9.7 16.2 15.8
Bottom 11.9 19.6 17.0 Number of nodes/twigs per tree
Average 8.0 15.0 15.7
1st harvest 19.3 69.8 18.7
2nd harvest 57.8 85.6 31.2
3rd harvest 75.1 158.9 51.1
4th harvest 40.5 34.9 23.7
Total/plot 192.6 349.2 124.6
Yields (kg per plot of 2000 m2)
Yield ha-1 yr-1 963 1746 623
Total canopy Coffee Shading trees Average tree
coverage Coverage coverage Canopy area height No Type
(%) (%) (%) (m2) (m)
Plot 1 Monoculture coffee 17 17 0 0.69 1.1
Plot 2 Young multistrata 45.9 38 7.9 1.64 0.5 - 4
Plot 3 Old multistrata 56.45 25 31.45 6.46 - 8 1.62 - 12.7
Potential Actual Coffee Berries Net rainfall Evaporation evaporation height dry weight
(mm) (mm) (mm) (cm) (g/plant)
Plot 1 Monoculture coffee 12.5 - 12.9 5.5 – 6.38 1.04 - 4.21 93 385
Plot 2 Young multistrata 12 - 13.9 4.2 – 5.16 3.84 - 4.5 134 873
Plot 3 Old multistrata 7.34 - 9.64 2.61 – 4.39 0.8 - 3.7 162 249

Conclusions
From this research it can be concluded that canopy cover affects the water balance if itshades more than 50 % of the farm area. The young multistrata plot allowed coffee to getenough light. Most of the shading trees under this study were unlikely compete with coffeefor water and light. Maintenance (pruning) of canopy may be needed for the multistratasystem to allow enough light interception so is to stimutae fruiting.
The old multistrata plot canopy was too dense and needs some pruning to allow morelight to reach the canopy to enhance fruiting. Dense canopy did not always mean that the soilsurface below the canopy would retain more water because higher canopy interceptiondecrease the net rain.
References
Jackson NA and Wallace JS. 1999. Soil evaporation measurements in an agroforestrysystem in Kenya. Agricultural and forest meteorology 94: 203-215.
Oke TR. 1978. Boundary layer climates. Methuen & Co, Ltd. London, UK.
Wallace JS. 1996. The water balance of mixed tree-crop systems. In: Ong, C.K., Huxley,P.A. (Eds). Tree-crop interactions: a physiological approach. CAB International,Wallingford, UK, pp. 189-233.
Wallace JS, Jackson NA and Ong CK. 1999. Modelling soil evaporation in an agroforestrysystem in Kenya. Agriculture and Forest Meteorology 94: 31-44.
81


