alternatives to growth-centric development
TRANSCRIPT
Global Development Policy CenterBoston University53 Bay State RoadBoston, MA 02155
bu.edu/gdp
An ECI Teaching Module on Social and Environmental Issues in Economics
By Erin Lennox and Rebecca Hollender
Alternatives to Growth-Centric Development

Economics in Context Initiative, Global Development Policy Center, Boston University, 2020.
Permission is hereby granted for instructors to copy this module for instructional purposes.
Suggested citation: Lennox, Erin and Rebecca Hollender. (2020) “Alternatives to Growth-
Centric Development.” An ECI Teaching Module on Social and Economic Issues, Economics in
Context Initiative, Global Development Policy Center, Boston University, 2020.
Students may also download the module directly from:
http://www.bu.edu/eci/education-materials/teaching-modules/
Comments and feedback from course use are welcomed:
Economics in Context Initiative
Global Development Policy Center
Boston University
53 Bay State Road
Boston, MA 02215
http://www.bu.edu/eci/
Email: [email protected]
NOTE – terms denoted in bold face are defined in the KEY TERMS AND CONCEPTS section
at the end of the module.

TABLE OF CONTENTS
1. INTRODUCTION................................................................................................................... 3
2. WHAT IS GROWTH-CENTRIC DEVELOPMENT? ....................................................... 4
3. WHY MIGHT WE NEED TO MOVE AWAY FROM GROWTH-CENTRIC
DEVELOPMENT? ................................................................................................................. 6
3.1 Exceeding the Earth’s Limits ......................................................................................................... 6
3.2 Growing Economic Inequality ....................................................................................................... 9
4. WHAT ARE THE ALTERNATIVES? .............................................................................. 14
4.1 Perspectives from the Global North ............................................................................................ 15
4.2 Perspectives from the Global South ............................................................................................ 20
5. GETTING BEYOND GROWTH .......................................................................................... 23
5.1 Measure success differently ......................................................................................................... 24
5.2 Reduce consumption and production .......................................................................................... 28
5.3 Provide social safety nets and redistribute wealth ..................................................................... 32
5.4 Change ownership structures ....................................................................................................... 35
5.5 Use communal management of natural resources ..................................................................... 37
6. CONCLUSION: PROMOTING ALTERNATIVES ........................................................... 40
KEY TERMS AND CONCEPTS .............................................................................................. 44
REFERENCES ............................................................................................................................ 49
1. INTRODUCTION
Current patterns of economic development are strongly related both to increasing carbon emissions
and other environmental impacts and to high levels of inequality. In responding to these global
problems, it may be necessary to rethink some of the fundamental assumptions underlying
economic growth. This module examines the implications of this reassessment both for economic
theory and practice.
Recent reports by the Intergovernmental Panel on Climate Change (IPCC) have virtually
eliminated any doubts that human economic activities are affecting earth’s climate. Emissions of
various greenhouse gases, particularly carbon dioxide (CO2), trap heat near the earth’s surface,
leading not only to a general warming trend but to sea-level rise, ecological disruption, and an
increase in severe weather events, such as hurricanes, floods, and droughts.1
According to the World Scientists’ Warning of a Climate Emergency, “the climate crisis is closely
linked to excessive consumption of the wealthy lifestyle. The most affluent countries are mainly
responsible for the historical GHG emissions and generally have the greatest per capita emissions.
. . Profoundly troubling signs from human activities include sustained increases in both human and
ruminant livestock populations, per capita meat production, world gross domestic product, global
tree cover loss, fossil fuel consumption, the number of air passengers carried, carbon dioxide (CO2)
emissions, and per capita CO2 emissions since 2000.”2
Though almost all countries have pledged to reduce their emissions to combat global temperature
rise by signing the global Paris Agreement,3 most still place a priority on economic growth.
Global GDP is currently greater than it has even been, with approximately 100 trillion dollars’
worth of goods and services being produced and sold around the globe each year.
At the same time, despite recent economic growth, inequality is still prevalent, with 1% of the
world’s population holding nearly half of the wealth. 11% of the global population still lives in
extreme poverty, and undernourishment has actually increased in recent years after a period of
steady decline.4 The issues of climate change and inequality are not unrelated, as a recent study
found that climate change is already increasing global income inequality, and this trend will only
get worse as climate change accelerates.5 Further, the recent increase in global undernourishment
is attributable in part to an increase in climate related disasters.6
In response to the combination of environmental issues, especially the climate crisis, and unequal
distribution of the benefits of economic development, some economists have turned away from
the mainstream idea that economic growth is the primary goal of any economy, and instead
started to examine alternatives that may be more compatible with both environmental protection
1 IPCC, 2018. 2 Ripple et al., “World Scientists’ Warning of a Climate Emergency,” BioScience, November 5, 2019. 3 The Paris Agreement is a coordinated global response to curb emissions and keep global temperature rise below
2°C. The agreement allows each country to create their own Nationally Determined Contributions (NDCs) which are
based on equity with an understanding that developing countries will take a longer time to reach peak emissions. 4 United Nations, 2018. 5 Diffenbaugh and Burke, 2019. 6 United Nations, 2018.
and equity. This module presents a brief history of growth-centric development and its
alternatives. It introduces several of the main growth-centric alternatives, by outlining some of
the key overarching principles of these various theories and providing examples of these
principles in practice in both the developed and developing world. The module concludes with
some of the main challenges these alternative approaches to development face in becoming
mainstream, and suggestions for moving forward.
2. WHAT IS GROWTH-CENTRIC DEVELOPMENT?
A growing economy is typically considered to be primary measure of the well-being of a country,
and the main goal for development. The term economic growth refers to an increase in output
(production of goods and services) over time. Economists measure output of a society using gross
domestic product (GDP). While it is widely recognized that GDP does not measure human well-
being, both economists and policy makers often assume that an increase in GDP corresponds to an
increase in welfare. Increasing economic production has always been a core concern of the
discipline of modern economics. The level of growth that is considered both desirable and feasible,
however, has varied as economics has evolved and branched out into a variety of sub-disciplines.
Classical Economics
Since the emergence of the discipline of economics in the late 1700s, scholars have raised concerns
related to whether, how long, and under what conditions the earth’s resources would be able to
sustain growing human populations. Thomas Malthus was one of the earliest economists to talk
about these limits. Malthus believed that the power of population growth was ultimately greater
than the power of the earth to produce subsistence for humans, and that as a result natural resources
would not be able to keep up with unchecked population growth. While other early economists
contributing to the field known as Classical Economics, including Adam Smith and David
Ricardo were not as concerned as Malthus, they still recognized that there was a limited amount
of fertile land suited for production and treated land as a special case of a non-substitutable factor
of production that limited growth.
While most Classical economists did focus on capitalism and the need for the growth of the
economy, many, including Smith and John Stuart Mill, believed that once a certain level of output
per capita had been attained the economy would naturally settle into a “stationary state”, with a
constant population and constant stock of capital. Mill described the stationary state as both a
natural and desirable progression of capitalism after sufficient levels of wealth were accumulated.
He also noted that even though quantitative development, in the form of production and wealth
may not increase in this stationary state, qualitative development, in the form of improved human
well-being, should still occur through educational and cultural progress.
Neoclassical Economics
With the transition from Classical Economics to Neoclassical Economics in the mid-1800s, the
concepts of the stationary state and of land as a limiting factor to growth were largely forgotten.
Many of the philosophical, sociological, and anthropological aspects of classical economics were
also left behind. The discipline instead became focused on creating universal mathematical models

and theories to describe the economy, with the primary goals of maximizing utility of the
individual by increasing consumption (in microeconomics) and maximizing output, or GDP of the
nation (in macroeconomics). In the effort to create simplified, universal models, land and natural
resources lost their role as non-substitutable limiting factors to growth. Instead they became treated
as perfectly substitutable inputs (substitutes) along with capital and labor.
A Focus on Economic Growth and Market Expansion
The focus on economic growth intensified in the late 1940s in the post-World War II era. This era,
often known as the “Golden age of capitalism” was an area of rapid growth and low unemployment
in United States as well as Western Europe and Eastern Asia. The returning labor force combined
with a strong manufacturing climate, recent developments in automation, and high government
spending on infrastructure development created substantial increases in production and
subsequently GDP.
As incomes rose, consumption increased, and the use of fossil fuels and natural resources
expanded rapidly. The end of World War II also led to the meeting of delegates from 44 allied
nations known as the Bretton Woods Convention, resulting in the formation of International
Monetary Fund (IMF) and the International Bank for Reconstruction and Development (a
member of the World Bank Group). The purpose of these organizations was to stabilize exchange
rates, while promoting international economic corporation, free trade, and to stimulate
reconstruction and economic development. In addition to promoting growth in the Global North,
this also advanced the integration of the economies of the Global South into the world economy,
promoting capitalism and modernization.
Figure 1. Total output of the world economy
(adjusted for inflation and expressed in international $ in 2011 prices) Source: World GDP – Our World in Data.

In the 1970s and 80s, neoliberalism also emerged as a primary theory of neoclassical economics,
furthering the emphasis on free trade and free markets as the best way to promote growth. The
primary concepts of neoliberalism include promoting privatization of state-owned enterprises, and
freeing businesses from government regulation. Neoliberal policies include the encouragement of
free trade, breaking up labor unions, and eliminating price controls. They also favored privatization
of public goods and reducing public expenditure on services like education and healthcare, instead
putting the focus on market incentives and individual responsibility.
Since the end of WWII, global GDP has increased 10-fold (Figure 1) and mainstream economics
remains dedicated to the primary goal of continuing this GDP growth around the globe.
3. WHY MIGHT WE NEED TO MOVE AWAY FROM GROWTH-
CENTRIC DEVELOPMENT?
Today, there are increasing signs that the biosphere as a whole is affected in its regulation of
biological and geophysical processes by the current scale of human activities. As society has
moved from a relatively “empty world” in which human activity was small relative to overall
planetary processes to a relatively “full world” in which human activity dominates the planet, an
exclusive emphasis on economic growth could produce serious, and possibly irreversible,
ecological damage.7 At the same time, overall economic growth has failed to bring wealth and
improvements in well-being to many around the globe.
3.1 Exceeding the Earth’s Limits
Ecologists have developed several approaches for assessing the overall scale of human economic
activity relative to the planetary carrying capacity. These assessment approaches consistently
show that we are living beyond the limits of our planet. Two of these approaches: The Planetary
Boundaries Approach, and Ecological Footprint Approach are introduced below.
Planetary Boundaries
The Planetary Boundaries Approach, first developed by the Stockholm Resilience Center in
2009, is a method of evaluating the earth’s limits and current capacity, considering nine earth
system processes. These include:
1. Stratospheric ozone depletion
2. Loss of biosphere integrity (biodiversity loss and extinctions)
3. Chemical pollution and the release of novel entities
4. Climate change
5. Ocean acidification
6. Freshwater consumption and the global hydrological cycle
7. Land system change
8. Nitrogen and phosphorus flows to the biosphere and oceans
7 See Daly, 1996.
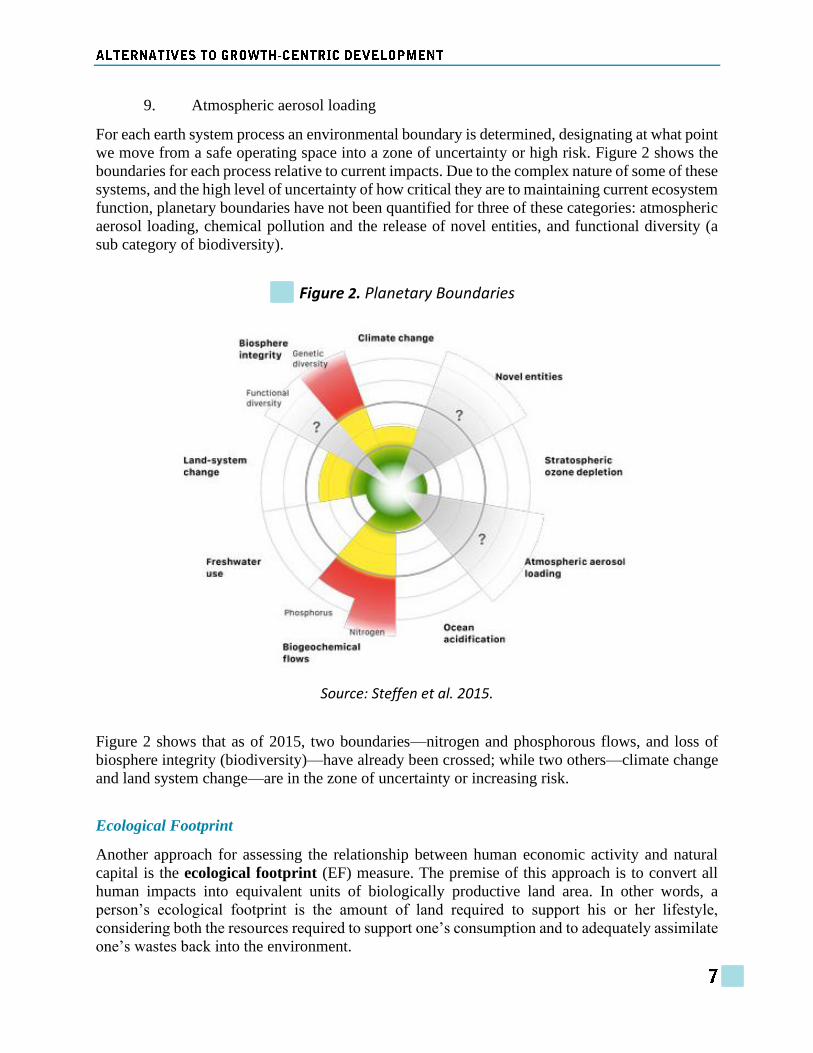
9. Atmospheric aerosol loading
For each earth system process an environmental boundary is determined, designating at what point
we move from a safe operating space into a zone of uncertainty or high risk. Figure 2 shows the
boundaries for each process relative to current impacts. Due to the complex nature of some of these
systems, and the high level of uncertainty of how critical they are to maintaining current ecosystem
function, planetary boundaries have not been quantified for three of these categories: atmospheric
aerosol loading, chemical pollution and the release of novel entities, and functional diversity (a
sub category of biodiversity).
Figure 2. Planetary Boundaries
Source: Steffen et al. 2015.
Figure 2 shows that as of 2015, two boundaries—nitrogen and phosphorous flows, and loss of
biosphere integrity (biodiversity)—have already been crossed; while two others—climate change
and land system change—are in the zone of uncertainty or increasing risk.
Ecological Footprint
Another approach for assessing the relationship between human economic activity and natural
capital is the ecological footprint (EF) measure. The premise of this approach is to convert all
human impacts into equivalent units of biologically productive land area. In other words, a
person’s ecological footprint is the amount of land required to support his or her lifestyle,
considering both the resources required to support one’s consumption and to adequately assimilate
one’s wastes back into the environment.
Some impacts convert easily to land-area footprints. For example, demand for meat converts to
pasture area needed to raise livestock. Other impacts are more difficult to translate to land-area
equivalents. For instance, carbon dioxide emissions from burning fossil fuels are accounted for in
the EF approach based on the area of vegetation that would be required to absorb the carbon
emitted. Calculation of a country’s ecological footprint requires data on more than 100 factors,
including demand for food products, timber, energy, industrial machinery, office supplies, and
vehicles.
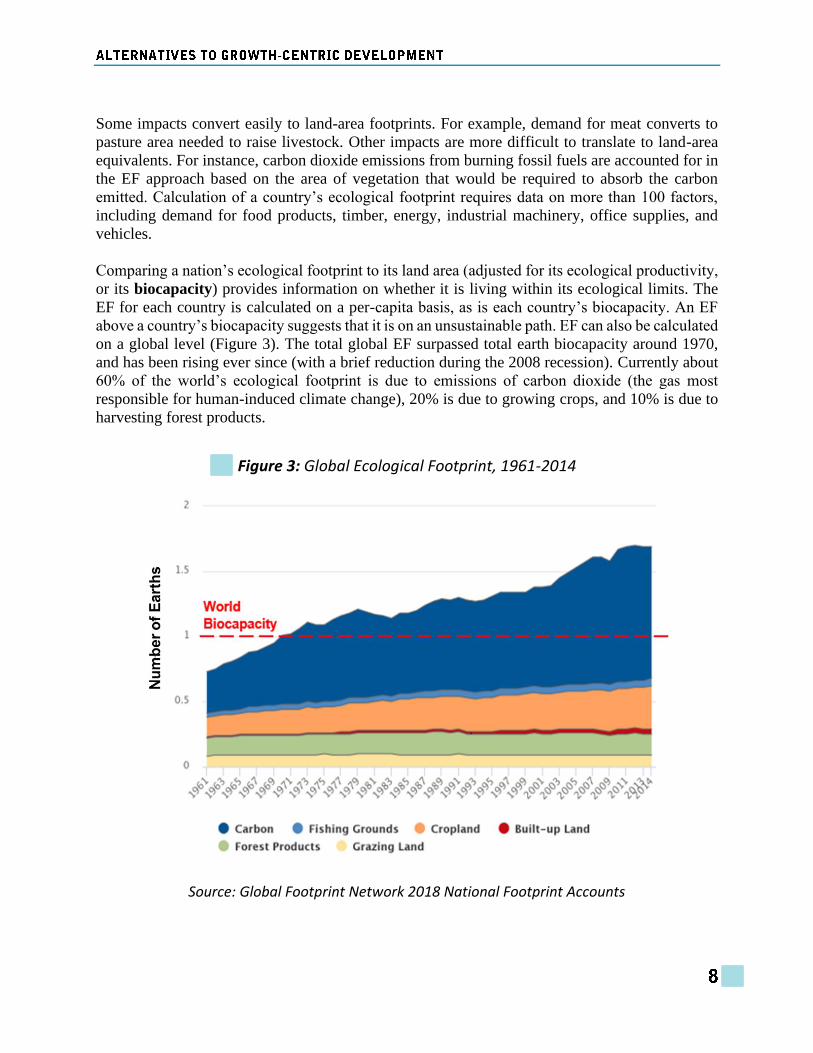
Comparing a nation’s ecological footprint to its land area (adjusted for its ecological productivity,
or its biocapacity) provides information on whether it is living within its ecological limits. The
EF for each country is calculated on a per-capita basis, as is each country’s biocapacity. An EF
above a country’s biocapacity suggests that it is on an unsustainable path. EF can also be calculated
on a global level (Figure 3). The total global EF surpassed total earth biocapacity around 1970,
and has been rising ever since (with a brief reduction during the 2008 recession). Currently about
60% of the world’s ecological footprint is due to emissions of carbon dioxide (the gas most
responsible for human-induced climate change), 20% is due to growing crops, and 10% is due to
harvesting forest products.
Figure 3: Global Ecological Footprint, 1961-2014
Source: Global Footprint Network 2018 National Footprint Accounts

3.2 Growing Economic Inequality
Despite the tremendous overall growth of the economy that has occurred over the past 75 years,
we are still failing to improve well-being for many groups. Figure 4 below shows that with the
exception of the Middle-East, Sub-Saharan Africa, and Brazil, the share of the total national
income held by richest 10% of the population has increased in most regions across the globe since
the 1980s. The Middle East, Brazil, and Africa have extraordinarily high inequality, and it appears
that other areas may be moving towards this “high-inequality frontier”.8
According to the World Inequality Report 2018, “the poorest half of the global population has seen
its income grow significantly thanks to high growth in Asia (particularly in China and India).
However, because of high and rising inequality within countries, the top 1% richest individuals in
the world captured twice as much growth as the bottom 50% of individuals since1980.”9 This
extreme inequality suggests that the current model of growth-centric development is concentrating
too much wealth at the top. A more balanced approach would focus on improving well-being by
providing human services such as education and health care, and helping people in developing
nations to protect local environments and maintain control of resources that have been exploited
for economic gain by the world’s high earners.
Figure 4: Top 10% income shares across the world, 1980–2016
Source: World Inequality Report 2018.
8 World Inequality Report, 2018, Executive Summary. 9 Ibid.
Inequality within Countries
Intra-country economic inequality (i.e. inequality within a country) can be measured by either
looking at income inequality or wealth inequality. Income refers to salaries and other incomes
earned by individuals each year, while wealth refers to the monetary value of all of an individual’s
assets (property, savings, stocks, vehicles, etc.) An individual with a lot of debt may have zero, or
negative wealth.
To measure the level of intra-country inequality, economists use a statistic called the Gini
coefficient. The Gini coefficient is a measure of income distribution within a country, with zero
representing complete equality (everyone has equal income levels) and 1 representing complete
inequality10 (one person receives all of the income). There is great variation in levels of inequality
across the globe, ranging from lower levels of inequality in many of the Slavic and Scandinavian
countries (around 0.23) to higher levels in the southern African countries (around 0.61).11
On average, countries across the globe have seen increasing levels of intra-country inequality over
the past 30 years. Growth in inequality has been especially high in higher income countries,12 while
it has actually fallen in many Latin American countries, though this region still remains the most
unequal in the world.13
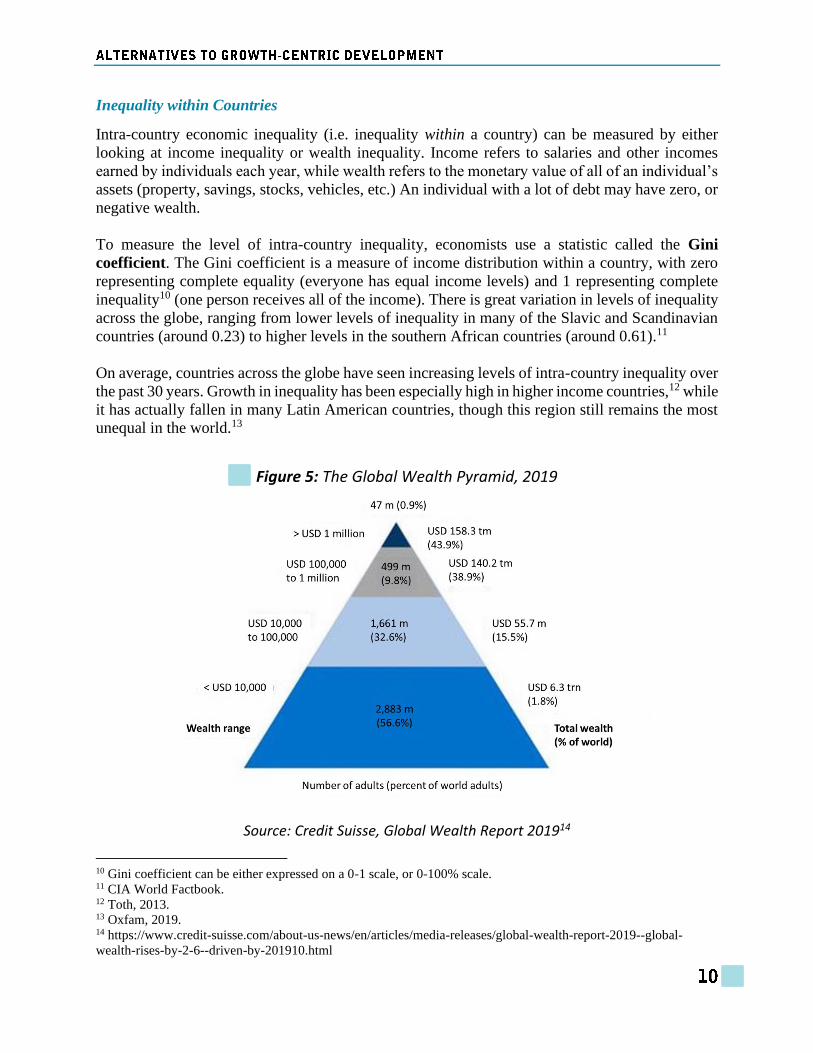
Figure 5: The Global Wealth Pyramid, 2019
Source: Credit Suisse, Global Wealth Report 201914
10 Gini coefficient can be either expressed on a 0-1 scale, or 0-100% scale. 11 CIA World Factbook. 12 Toth, 2013. 13 Oxfam, 2019. 14 https://www.credit-suisse.com/about-us-news/en/articles/media-releases/global-wealth-report-2019--global-
wealth-rises-by-2-6--driven-by-201910.html

Measures of wealth distribution generally show significantly higher inequality than income
distribution. According to the Global Wealth Report 2019, less than 1% of the global population
own 44% of the world’s wealth, while the bottom 50% own less than 2% of global wealth (see
Figure 5). In the United States,” wealth has become more concentrated since at any time since the
"Roaring" 1920s, according to economist Gabriel Zucman. The richest 1% of Americans currently
own a whopping 40% of total household wealth.”15
The growing gaps in income and wealth within countries have been driven in part by a long history
of systemic racism with policies aimed at serving only the wealthy, often white, population. The
effects of these policies have been compounded over time, with racial wealth disparity growing in
many countries. In the United States, for example, the median white family now has 41 times more
wealth than the median black family, and 22 times more wealth than the median Latino family.
Other forms of racial and ethnic income and wealth disparity are present in countries across the
globe.
Since European colonization in the 15th century, many native and indigenous peoples have lost
control of land and their natural resources, setting them behind on the development path. A national
survey of ten countries in Latin America, Asia, and Africa found that indigenous people are poorer
than non-indigenous people in all countries sampled, and that the wealth gap between indigenous
and non-indigenous groups has been growing over the past 20 years.16
Ongoing efforts to “modernize” traditional societies by encouraging them to focus on
incorporation into the global system have failed to generate economic growth for this sector of the
population, while simultaneously stripping away many aspects of culture and society that
contributed to their well-being.
Inequality between countries
Though global inequality persists, there has been some decline in inter-country inequality
(inequality between countries) in the past 20 years as gains have been made in moving people out
of absolute poverty.17 Worldwide, the number of people living in extreme poverty (less than $1.25
per day) has dropped from 1.9 billion people in 1980 to 836 million in 2015.18 The world Gini
coefficient has declined from a high of around 0.74 in 1975 to 0.63 in 2010.19 There has been a
growth in the “global middle class”, but at the same time the gains from economic growth have
failed to reach many people in rural and less developed areas. As result, the share of global income
going to the bottom 50% globally has barely changed over the last several decades, while the share
going to the top 1% has increased significantly (Figure 6).
Mainstream economic theory supports the idea that increased incorporation into the global
economy and producing for export will help countries in the Global South to achieve economic
growth, but there are a number of alternative theories that dispute this. For example, dependency
15 da Costa, 2019. 16 Hall and Patrinos eds., 2012. 17 Roser, 2016. 18 United Nations, 2017. 19 Niño-Zarazúa, Roope, and Tarp, 2017.
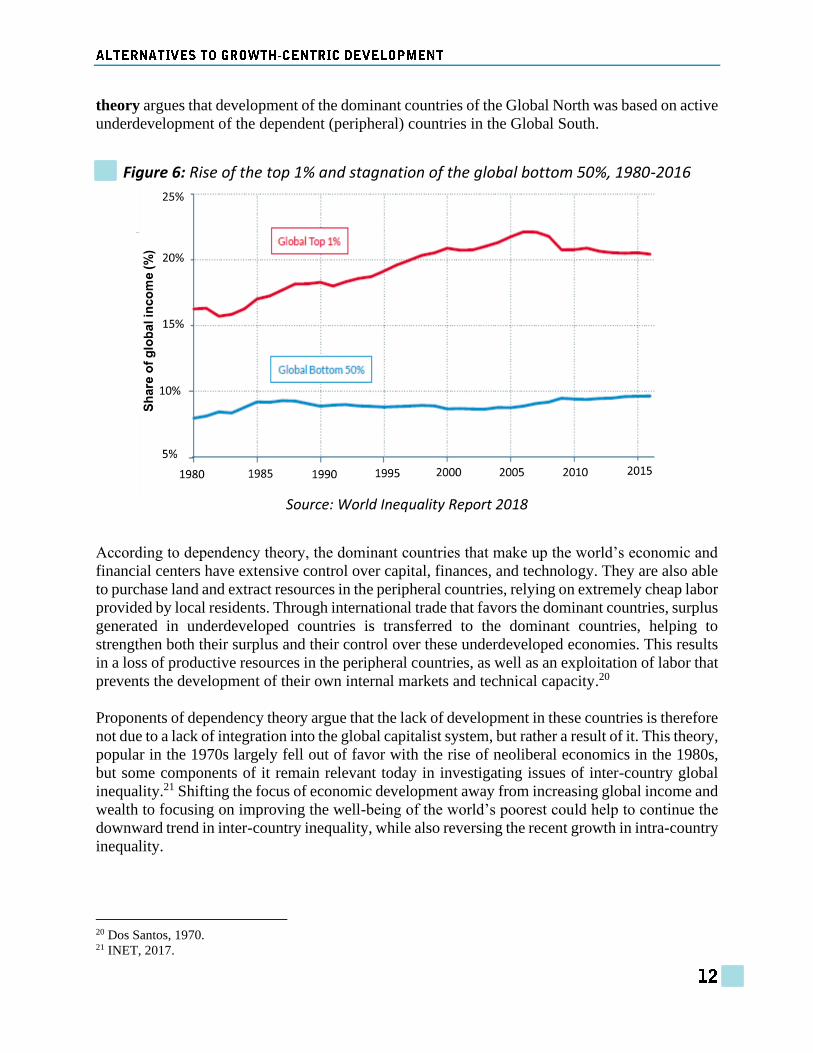
theory argues that development of the dominant countries of the Global North was based on active
underdevelopment of the dependent (peripheral) countries in the Global South.
Figure 6: Rise of the top 1% and stagnation of the global bottom 50%, 1980-2016
Source: World Inequality Report 2018
According to dependency theory, the dominant countries that make up the world’s economic and
financial centers have extensive control over capital, finances, and technology. They are also able
to purchase land and extract resources in the peripheral countries, relying on extremely cheap labor
provided by local residents. Through international trade that favors the dominant countries, surplus
generated in underdeveloped countries is transferred to the dominant countries, helping to
strengthen both their surplus and their control over these underdeveloped economies. This results
in a loss of productive resources in the peripheral countries, as well as an exploitation of labor that
prevents the development of their own internal markets and technical capacity.20
Proponents of dependency theory argue that the lack of development in these countries is therefore
not due to a lack of integration into the global capitalist system, but rather a result of it. This theory,
popular in the 1970s largely fell out of favor with the rise of neoliberal economics in the 1980s,
but some components of it remain relevant today in investigating issues of inter-country global
inequality.21 Shifting the focus of economic development away from increasing global income and
wealth to focusing on improving the well-being of the world’s poorest could help to continue the
downward trend in inter-country inequality, while also reversing the recent growth in intra-country
inequality.
20 Dos Santos, 1970. 21 INET, 2017.
Pollution inequality
It is not surprising that individuals with higher incomes make a greater contribution to global
emissions and pollution levels. Larger homes, car ownership, international travel, and higher levels
of consumption of all types of goods all contribute to a larger ecological footprint.
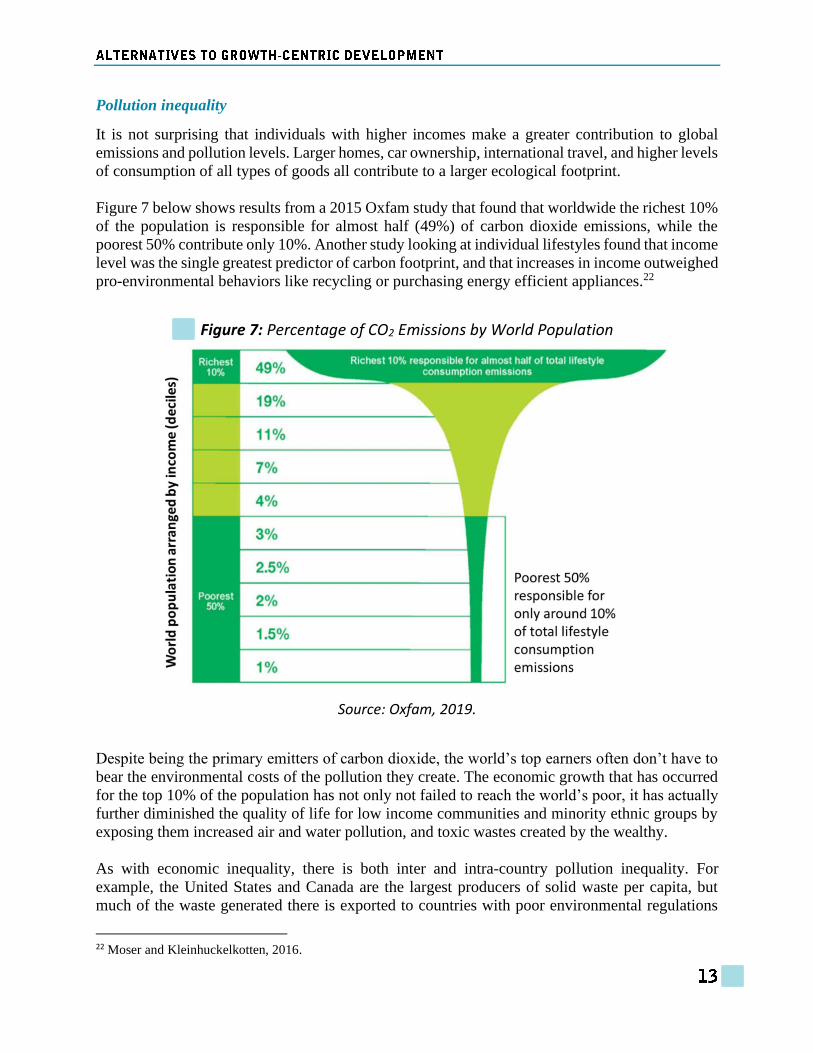
Figure 7 below shows results from a 2015 Oxfam study that found that worldwide the richest 10%
of the population is responsible for almost half (49%) of carbon dioxide emissions, while the
poorest 50% contribute only 10%. Another study looking at individual lifestyles found that income
level was the single greatest predictor of carbon footprint, and that increases in income outweighed
pro-environmental behaviors like recycling or purchasing energy efficient appliances.22
Figure 7: Percentage of CO2 Emissions by World Population
Source: Oxfam, 2019.
Despite being the primary emitters of carbon dioxide, the world’s top earners often don’t have to
bear the environmental costs of the pollution they create. The economic growth that has occurred
for the top 10% of the population has not only not failed to reach the world’s poor, it has actually
further diminished the quality of life for low income communities and minority ethnic groups by
exposing them increased air and water pollution, and toxic wastes created by the wealthy.
As with economic inequality, there is both inter and intra-country pollution inequality. For
example, the United States and Canada are the largest producers of solid waste per capita, but
much of the waste generated there is exported to countries with poor environmental regulations
22 Moser and Kleinhuckelkotten, 2016.
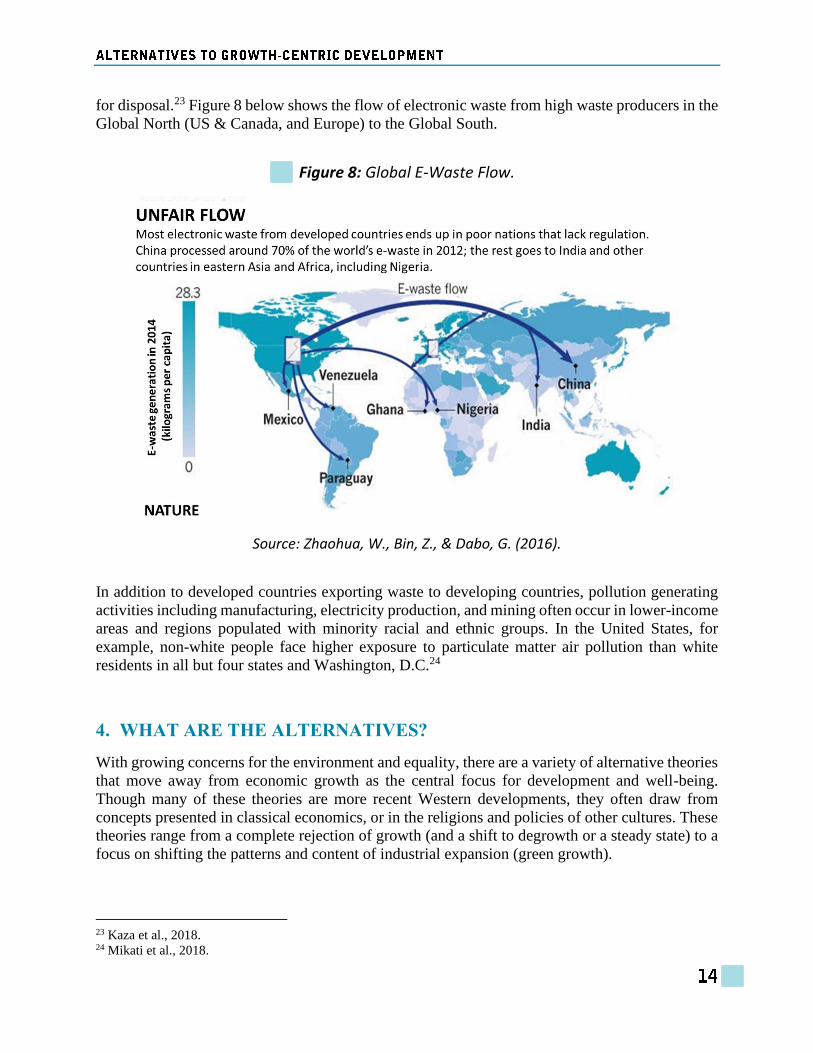
for disposal.23 Figure 8 below shows the flow of electronic waste from high waste producers in the
Global North (US & Canada, and Europe) to the Global South.
Figure 8: Global E-Waste Flow.
Source: Zhaohua, W., Bin, Z., & Dabo, G. (2016).
In addition to developed countries exporting waste to developing countries, pollution generating
activities including manufacturing, electricity production, and mining often occur in lower-income
areas and regions populated with minority racial and ethnic groups. In the United States, for
example, non-white people face higher exposure to particulate matter air pollution than white
residents in all but four states and Washington, D.C.24
4. WHAT ARE THE ALTERNATIVES?
With growing concerns for the environment and equality, there are a variety of alternative theories
that move away from economic growth as the central focus for development and well-being.
Though many of these theories are more recent Western developments, they often draw from
concepts presented in classical economics, or in the religions and policies of other cultures. These
theories range from a complete rejection of growth (and a shift to degrowth or a steady state) to a
focus on shifting the patterns and content of industrial expansion (green growth).
23 Kaza et al., 2018. 24 Mikati et al., 2018.
4.1 Perspectives from the Global North
Steady State Economy
The theory of the steady state economy suggests that once an economy reaches a size where
human needs are being met within the ecological limits of the environment, neither growth nor
degrowth in terms of the consumption of material and energy resources should occur. The concept
of the steady state economy, as noted above, goes back to classical economists such as J.S. Mill,
but was revived in the 1970s by economist Herman Daly. In Daly’s vision of a steady state
economy the stock of manufactured capital is kept constant, though GDP does not necessarily
remain constant. Economic activities that involve no resource consumption or that are
environmentally neutral or environmentally friendly, including services, arts, communication and
education activities, could grow indefinitely.
One major difference between the classical view of the stationary state and the modern steady state
is that while classical economists believed the transition to a stationary state would be a naturally
occurring process, Daly argues that major government intervention will be required to make this
transition. Daly proposes intervention in the form of redistribution of income, population
limitation, and control of capital by limiting the flow of natural resources into the economy and
the flow of wastes associated with production (he defines the combined flows as throughput of
resources and wastes).
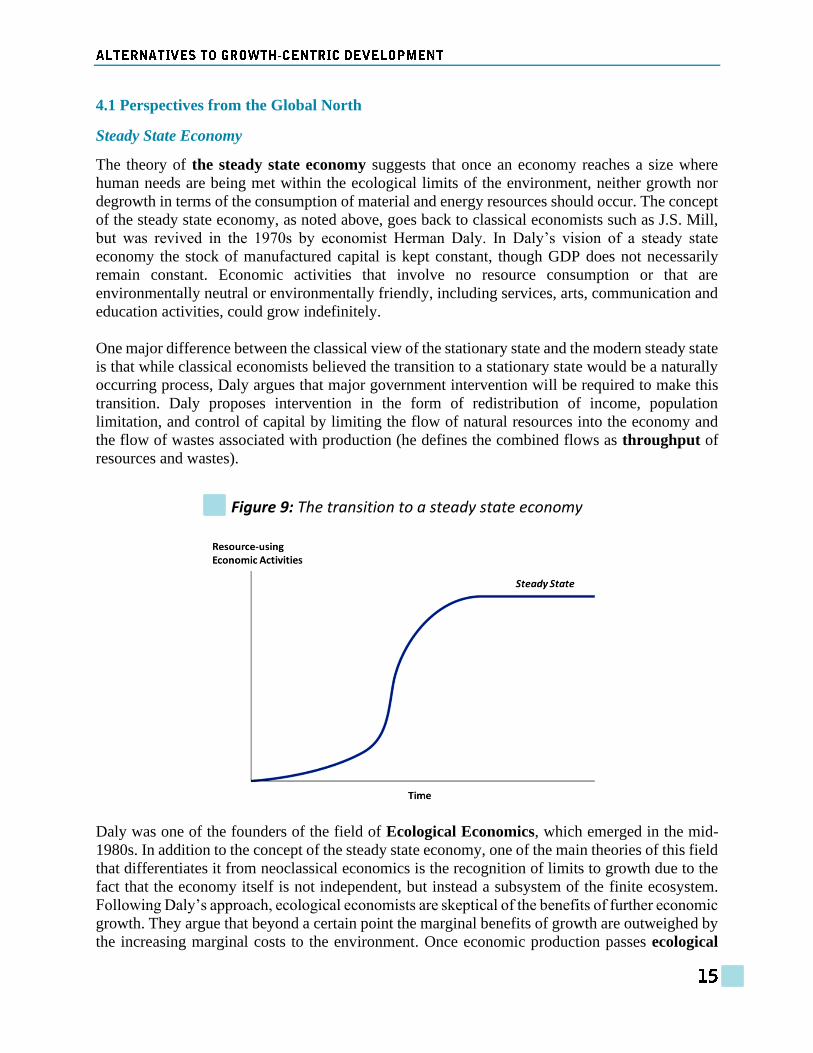
Figure 9: The transition to a steady state economy
Daly was one of the founders of the field of Ecological Economics, which emerged in the mid-
1980s. In addition to the concept of the steady state economy, one of the main theories of this field
that differentiates it from neoclassical economics is the recognition of limits to growth due to the
fact that the economy itself is not independent, but instead a subsystem of the finite ecosystem.
Following Daly’s approach, ecological economists are skeptical of the benefits of further economic
growth. They argue that beyond a certain point the marginal benefits of growth are outweighed by
the increasing marginal costs to the environment. Once economic production passes ecological
thresholds or over-depletes resources, it becomes uneconomic growth, which is not only
unsustainable but also harmful to overall wellbeing.
Another main principle of ecological economics is the concept that economic theory must be
grounded in biophysical reality, where the economy is bound by the energy limitations described
in the laws of thermodynamics. One of the major contributors here, Nicholas Georgescu-Rogen,
was an early contributor to another growth alternative theory known as degrowth.
Degrowth
The degrowth movement is another movement that challenges the idea that economic growth
should be the primary focus of development. Degrowth can be defined as equitable downscaling
of production and consumption that increases human well-being and enhances ecological
conditions at the local and global level, in the short and long term.25
The concept was first introduced in the 1970s, with the publication of The Limits to Growth in
1972. The Limits to Growth is a report commissioned by the Club of Rome that contained the
results of a computer simulation of economic and population growth with a finite supply of
resources. The simulation and associated report were a collaboration between a team of 17
scientists, and predicted that ongoing upward trends in human population growth, resource use,
and pollution would have dire consequences for humans and the planet. The report made a call to
limit economic activity to within the biophysical limits of the planet.
Though the term was coined in the 1970s, the movement remained out of mainstream economics
for the next 35 years, gaining interest again during the global financial crisis of 2007-2008. In
2008, 140 multidisciplinary scientists gathered in Paris for the first conference on degrowth. The
conference was a response to the environmental, social and economic crisis of the time. The main
result of this conference was the development of the Paris Degrowth Declaration.
The declaration describes the reasons degrowth is needed, while laying out core principles for a
paradigm shift. The declaration also introduces the idea of “Right-Sizing” the global and national
economies, which means that a mix of degrowth in the wealthier parts of the world, growth in the
Global South and redistribution of wealth will be needed to achieve a desirable outcome. The
declaration concludes with a call for further progress:
“Progress towards degrowth requires immediate steps towards efforts to
mainstream the concept of degrowth into parliamentary and public debate and
economic institutions; the development of policies and tools for the practical
implementation of degrowth; and the development of new, nonmonetary indicators
(including subjective indicators) to identify, measure and compare the benefits and
costs of economic activity, in order to assess whether changes in economic activity
contribute to or undermine the fulfilment of social and environmental objectives.”
25 Schneider, Kallis, and Martinez-Alier, 2010.
Since the Paris meeting, an international degrowth conference has been held every two years to
further the theories, and develop concrete proposals for political action. Many of these policies are
discussed in Section 5 below.
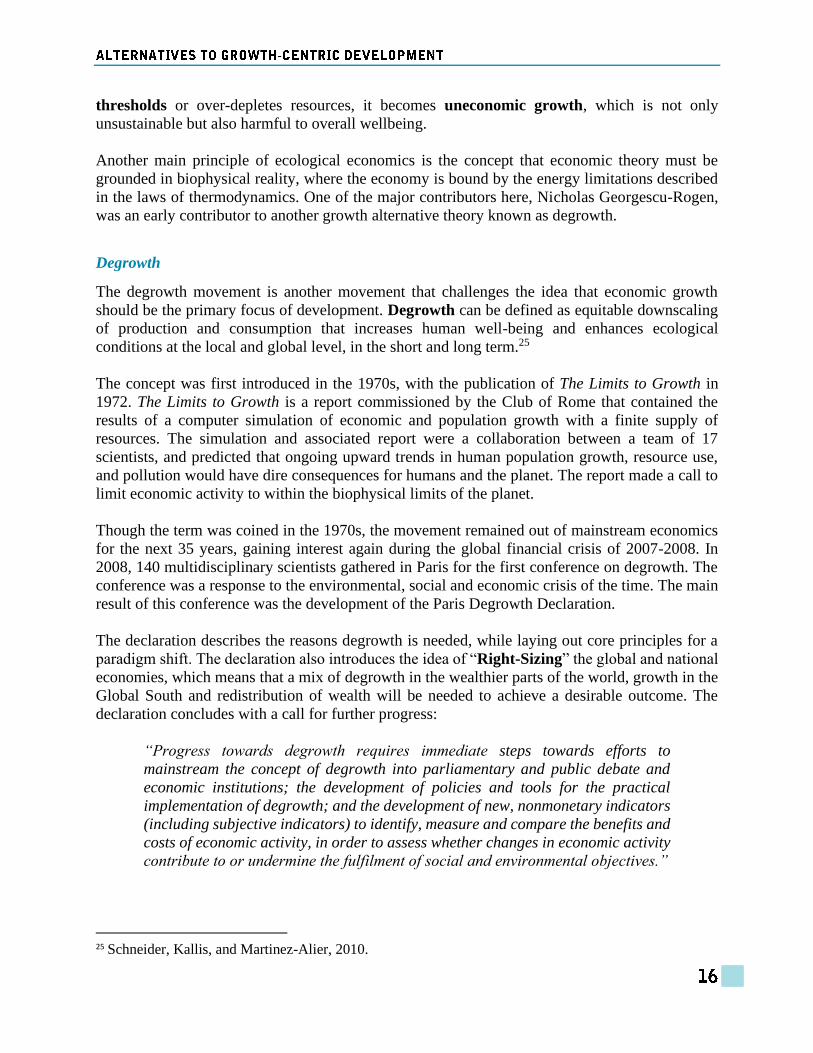
The concepts of steady state and degrowth are complementary, as degrowth can be considered a
process, with an end goal of a steady state economy.26 While Figure 9 above shows how a
developing economy could transition to steady state, with high initial growth followed by
deceleration and an eventual plateau, Figure 10 below represents how many economies will need
to go through a phase of degrowth before settling into a steady state that is within the carrying
capacity of the earth.
Figure 10: The Degrowth Transition to a Steady State Economy
Source: O’Neill, 2012.
Green Growth
Contrary to steady state and degrowth approaches, the green growth approach deems growth of
GDP as both necessary and desirable, but recognizes that effort should be undertaken to achieve
this growth in industries that help increase efficiency of resource use while reducing pollution.
Green Growth approaches see economic growth as the key driver for improving standards of
living, as well as for generating the necessary funds for conservation and environmental initiatives.
But in the Green Growth perspective, more goods can be produced with less resources, waste, and
pollution, through improved eco-efficiency.
Examples of green growth at the national level can include things like investing in renewable
energy development, infrastructure improvements that promote public transportation use, and use
of ecolabeling to promote organic and biodynamic agricultural practices. Though all of these
26 O’Neill, 2012.
practices can also be used in pursuing degrowth strategies, the continued focus on growing the
economy is what differentiates their use here. One of the core principles behind green growth is
that pollution and environmental destruction must be decoupled from growth of GDP.
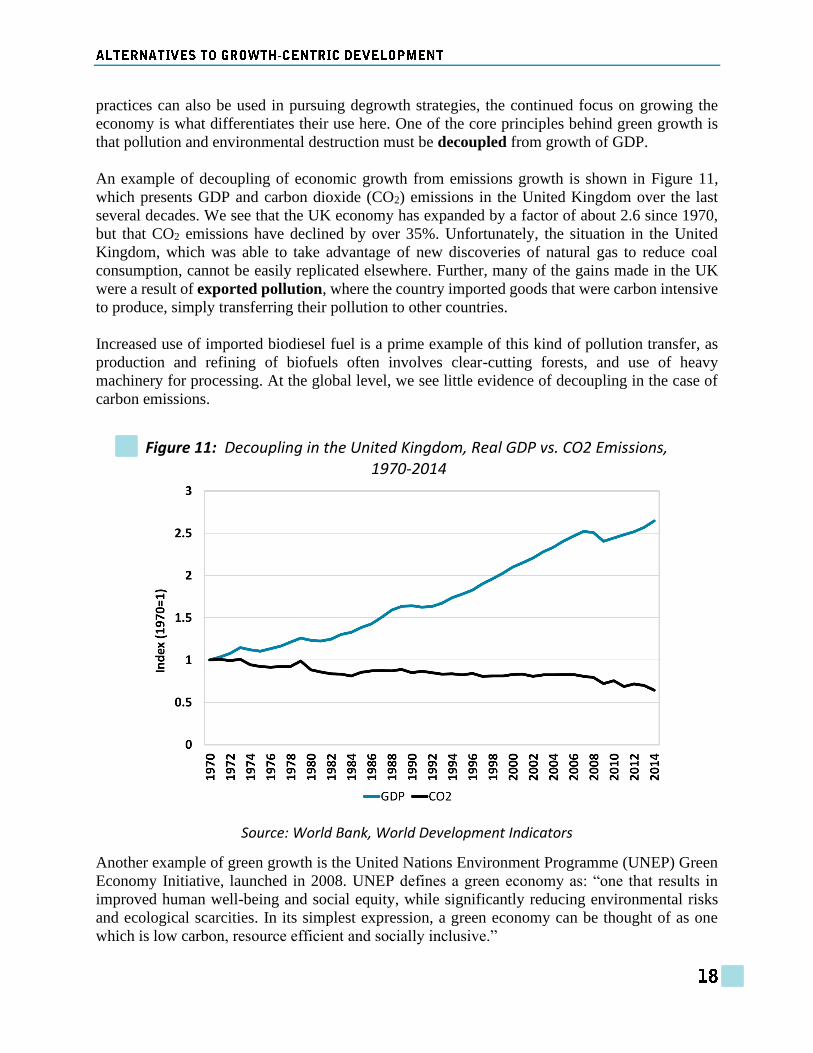
An example of decoupling of economic growth from emissions growth is shown in Figure 11,
which presents GDP and carbon dioxide (CO2) emissions in the United Kingdom over the last
several decades. We see that the UK economy has expanded by a factor of about 2.6 since 1970,
but that CO2 emissions have declined by over 35%. Unfortunately, the situation in the United
Kingdom, which was able to take advantage of new discoveries of natural gas to reduce coal
consumption, cannot be easily replicated elsewhere. Further, many of the gains made in the UK
were a result of exported pollution, where the country imported goods that were carbon intensive
to produce, simply transferring their pollution to other countries.
Increased use of imported biodiesel fuel is a prime example of this kind of pollution transfer, as
production and refining of biofuels often involves clear-cutting forests, and use of heavy
machinery for processing. At the global level, we see little evidence of decoupling in the case of
carbon emissions.
Figure 11: Decoupling in the United Kingdom, Real GDP vs. CO2 Emissions, 1970-2014
Source: World Bank, World Development Indicators
Another example of green growth is the United Nations Environment Programme (UNEP) Green
Economy Initiative, launched in 2008. UNEP defines a green economy as: “one that results in
improved human well-being and social equity, while significantly reducing environmental risks
and ecological scarcities. In its simplest expression, a green economy can be thought of as one
which is low carbon, resource efficient and socially inclusive.”

UNEP has developed a complex model to analyze the economic and environmental impacts of
directing investments to promote a transition to a green economy. They consider a green scenario
where 2% of global GDP is invested in various ways to promote sustainability, including energy
efficiency, renewable energy, waste management, infrastructure improvements, agricultural
production methods, and water management. They compare the results of this green economy
scenario to a business-as-usual (BAU) scenario where investment rates follow existing trends.
The results are shown in Figure 12.
In the short-term (2015), the green economy scenario results in about 1% lower real GDP and
lower GDP per capita. But in the longer term the green economy shows substantially better
economic performance than the BAU scenario. By 2050 real GDP in the green economy scenario
is 16% higher than in the BAU scenario. The environmental differences between the two scenarios
are initially small, but become dramatic over the following decades. By 2050 global energy
demand is 40% lower in green economy scenario, and the ecological footprint is 48% lower.27
Figure 12: Environmental and Economic Projections, Green Economy Scenario versus Business-As-Usual
Source: UNEP, 2011.
27 UNEP, 2011.
Other Critiques of Growth-Centrism
There are a number of additional viewpoints that are focused on growth-centric alternatives both
directly and indirectly. These include environmental justice, the solidarity economy, the green
economy, feminist, and Buddhist economics.
The environmental justice movement aims to address the fact that around the globe, communities
of color are disproportionately exposed to pollution and environmental destruction and
degradation. This type of unequal exposure is known as environmental racism. The movement
has been headed by grassroots organizations lead by African-Americans, Latinos, Asians and
Pacific Islanders, and Native Americans that organize against pollution and climate change while
fighting against extractive industries.28 Similarly, the concept of the Solidarity Economy places
people and the environment first, and aims to challenge the dominant capitalist system of
promoting growth and profit above all else.
The Green Economy is another similar theory with the goal of achieving a shared (socially just)
and a lasting (environmentally sustainable) prosperity.29 Concepts from the field of Feminist
Economics include valuing unpaid work, like caretaking, which are currently excluded from GDP
accounting but can contribute to well-being and development are also relevant to growth
alternative thinking. Buddhist Economics, a term first coined by E.F. Schumacher in the 1950s,
focuses on differentiating production and consumption activities into beneficial and harmful
activities, with a primary goal of minimizing suffering for all living or non-living things, rather
than a goal of increasing profit or consumption. Concepts from these, along with a variety of other
subfields are important in creating growth-centric alternatives that benefit all members of society
and the environment.
4.2 Perspectives from the Global South
While the various alternatives discussed above are primarily developed in, and focused on,
economies in the Global North, the concepts are also relevant to the Global South. Although
most developing countries do require economic growth to meet basic human needs, this does not
mean that these societies should follow the same economic growth-centric path as their
counterparts in the Global North.
In fact some developing societies already do emphasize alternatives to growth-centric
development, placing human well-being above GDP growth as their primary development goal.
The two examples below show how growth centered alternative concepts that have been around
for thousands of years are becoming more mainstream in parts of the Global South.
Sumak Kawsay (Buen Vivir) in South America
The term Sumak Kawsay is as a Quechua term loosely translated to “good life” or “full life”
(“buen vivir” in Spanish). The Quechua people are an indigenous group native to the Andes region
28 Martinez-Alier, 2002. 29 Victor and Jackson, 2016.

of Peru, Bolivia, Chile, Columbia, and Ecuador, and their concept of Sumak Kawsay refers to
living in harmony with your community, yourself, and your environment. This approach also
emphasizes preserving resources and culture for future generations. The concept and term have
been gaining mainstream popularity in recent years, and have even been incorporated into the
Ecuadorian and Bolivian Constitutions.
“Sumak Kawsay values people over profit. It is also a new way of viewing
“developing nations” because it expresses a relationship with nature and
surroundings that epitomizes the opposite of profit and commodification. A key
piece is how development is defined: it calls for a decreased emphasis on economic
and product development, and an increased focus on human development – not in
population, but an enrichment of core values, spirituality, ethics, and a deepening
of our own connection with Pachamama (mother earth).”30
The Quechua people along with other indigenous groups of South and Central America have faced
a long history of discrimination and marginalization since Spanish colonization in the 16th century.
With the implementation of neoliberal policies across Latin America in the 1980s and 90s, these
groups were further harmed, as they were encouraged to shift from community-based ownership
of resources and production for subsistence and local trade to privatization and an export oriented
economy.
Ecuador, for example, whose population is 40% indigenous, took out a number of loans from US
based financial institutions in 1980s that with came with conditions that they must adopt neoliberal
policies and implement austerity measures to reduce government spending. Ecuador focused on
oil extraction and mining, which caused tremendous damage to their natural resources, while
failing to provide economic benefits to the indigenous and poor segments of the population. With
the election of President Rafael Correa in 2007 and the growth of indigenous activist groups, there
was a renewed focus on the environment and indigenous rights. A constitutional assembly was
created to include the concept of Sumak Kawsay into the Ecuadorian constitution, and articles
were added to the constitution in 2008 stating that:
• Nature, or “Pacha Mama” has the “right to integral respect for its existence and for the
maintenance and regeneration of its life cycles, structure, functions and evolutionary
processes.”
• Nature has the right to be restored. This restoration shall be apart from the obligation of
the State and natural persons or legal entities to compensate individuals and communities
that depend on affected natural systems.
• The State shall apply preventive and restrictive measures on activities that might lead to
the extinction of species, the destruction of ecosystems and the permanent alteration of
natural cycles. The introduction of organisms and organic and inorganic material that might
definitively alter the nation’s genetic assets is forbidden.
• Persons, communities, peoples, and nations shall have the right to benefit from the
environment and the natural wealth enabling them to enjoy the good way of living.
30 Pachamama Alliance, 2019.
In the decade following the election of Correa and the revised constitution, Ecuador substantially
increased spending on education and healthcare, and saw a 38% reduction in poverty and a 47%
reduction in extreme poverty, with a significant reduction in inequality.31 Bolivia followed
Ecuador’s lead in 2009, recognizing Buen Vivir (the Spanish translation of Sumak Kawsay) in
their constitution as a principle to guide state action.
Eco-Swaraj and Radical Economic Democracy in India
Similar to Buen Vivir, the Concept of Eco-Swaraj is a grassroots framework developed in India
that respects the limits of the earth and the rights of other species, while pursuing the core values
of social justice and equity.32 “Swaraj” translates loosely to self-rule—the concept is inspired by
the ancient Indian practice of involving people in decision making through local assemblies.33
As with Sumak Kawsay in Latin America, much of the renewed interest in Eco-Swaraj in India
comes in response to harmful neoliberal policies put in place in India in the early 1990s. Since the
early 1990s income inequality in India has doubled, and their improvements in the
Multidimensional Poverty Index (a weighted measure of 10 indicators related to health, education,
and living standards) have fallen behind those of other South Asian countries.
In the past few years, a structured version of eco-swaraj known as Radical Economic Democracy
(RED) has emerged in India that is gaining widespread notice. RED is comprised of the five
themes listed below, which can be visualized as the diagram in Figure 13.34
1. Ecological wisdom and resilience: Reviving or strengthening the foundational belief in
humanity being part of nature, and the intrinsic right of the rest of nature to thrive in all its
diversity and complexity.
2. Social well-being and justice: Moving towards lives that are fulfilling and satisfactory
physically, socially, culturally, and spiritually; with equity in socio-economic and political
entitlements, benefits, rights and responsibilities across gender, class, caste, age,
ethnicities, “able”ities, sexualities, and other current divisions.
3. Direct or radical political democracy: Establishing processes of decision-making power
at the smallest unit of human settlement (rural or urban), such that every human has the
right, capacity and opportunity to take part. Political decision-making at larger levels is
taken by ecoregional or biocultural regional institutions, which respect ecological and
cultural linkages and boundaries (and therefore challenge current political boundaries,
including those of nation-states).
4. Economic democracy: Establishing or strengthening processes in which local communities
including producers and consumers—often combined in one word as “prosumers”—have
control over the means of production, distribution, exchange, and markets. Larger trade
and exchange, if and where necessary, is built on—and safeguards—this local self-reliance.
Nature, natural resources and other important elements that feed into the economy, are
governed as the commons. Private property is minimized or disappears, non-monetized
31 Weisbrot, Johnston, and Merling, 2017. 32 Kothari, Acosta, and Demaria, 2015. 33 Kothari et al., 2018. 34 Ibid.
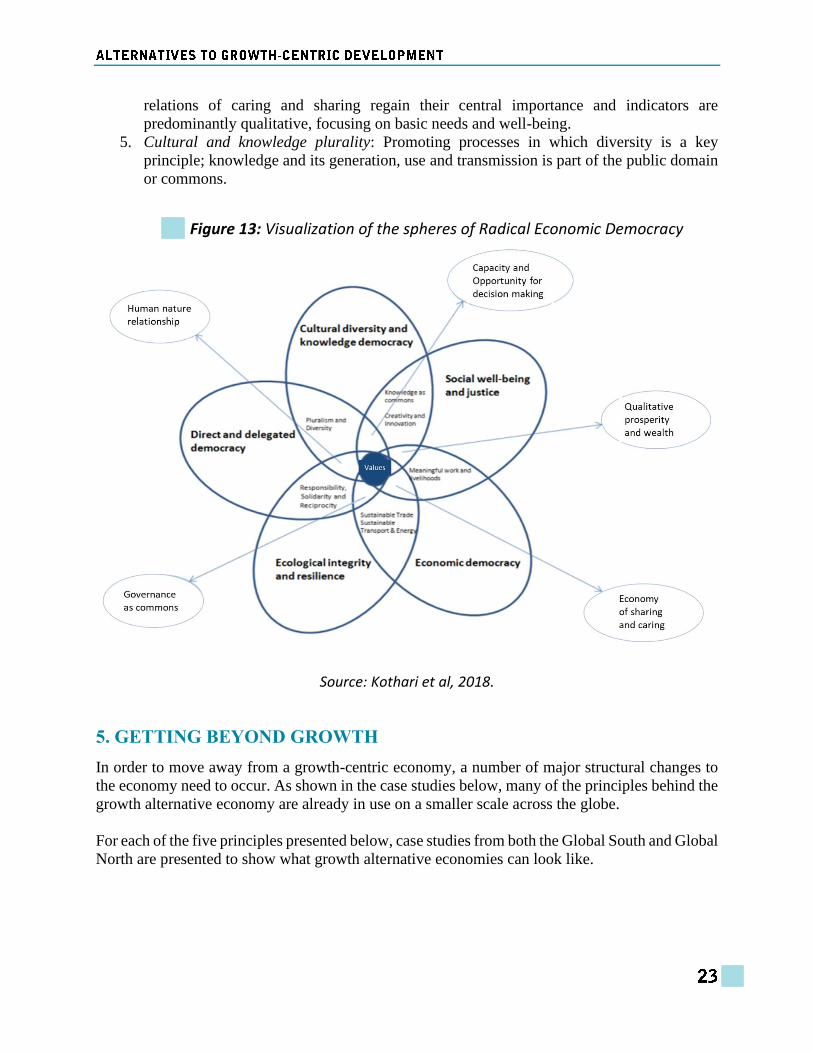
relations of caring and sharing regain their central importance and indicators are
predominantly qualitative, focusing on basic needs and well-being.
5. Cultural and knowledge plurality: Promoting processes in which diversity is a key
principle; knowledge and its generation, use and transmission is part of the public domain
or commons.
Figure 13: Visualization of the spheres of Radical Economic Democracy
Source: Kothari et al, 2018.
5. GETTING BEYOND GROWTH
In order to move away from a growth-centric economy, a number of major structural changes to
the economy need to occur. As shown in the case studies below, many of the principles behind the
growth alternative economy are already in use on a smaller scale across the globe.
For each of the five principles presented below, case studies from both the Global South and Global
North are presented to show what growth alternative economies can look like.
5.1 Measure success differently
Alternative measures and indicators of the well-being of nations have the potential to replace GDP
as the primary indicator of a nation’s success. GDP has the advantage of being relatively easy to
measure, but fails is significant ways as a measure of well-being. Some of the shortcomings of
GDP are that it does not account for volunteer work or unpaid household production (such as
childcare and housekeeping) nor for informal economic activity. On the other hand, it counts
“defensive expenditures” such as military spending, increased costs of policing, and costs of
pollution cleanup as a positive, while ignoring the costs of damage to the environment including
climate change. It also does not consider the loss of leisure time that often comes with a rise in
GDP. Finally, GDP does not take into account the distribution of income or wealth within a
country.
To address this, a variety of alternative macroeconomic indicators have been developed and used
to varying degrees.35 The simplest of these start with GDP, and make monetary adjustments to
account for environmental and social factors. Since GDP fails to account for the resource depletion
and environmental degradation associated with economic production, Green GDP estimates these
damages in monetary units, and then deduct this amount from GDP.
Another approach that starts with a traditional national accounting metric and makes adjustments
to account for the environment is the Adjusted Net Saving (ANS) measure developed by the
World Bank. The objective of ANS is to “measure the true rate of savings in an economy after
taking into account investment in human capital, depletion of natural resources, and damage
caused by pollution.” ANS is typically presented as a percent of a country’s Gross National
Income, or GNI (a measure of a nations GDP plus the income it earns from overseas). A country
with a consistently negative rate of ANS would thus be considered on an unsustainable path.
The Genuine Progress Indicator (GPI) is another alternative metric of economic growth that
attempts to account for well-being and the environment. GPI uses personal consumption as its
starting point, based on the rationale that it is consumption that directly contributes to current
welfare. Next, personal consumption is adjusted to reflect the degree of economic inequality in a
society. Then monetary estimates of goods and services that contribute to social well-being are
added. These positive factors include: the value of unpaid household labor; the external benefits
society receives from higher education; the service value of public infrastructure such as highways
and the value of volunteer work. Finally, the GPI deducts the monetary value of factors that reduce
social welfare, including: the value of commuting and lost leisure time; damages from crime,
climate change and pollution; and the depletion of natural resources.
There are also alternative indicators that shift away from using monetary values, focusing instead
on measuring well-being and sustainability. The Better Life Index (BLI) considers well-being to
be a function of 11 dimensions, including income, housing conditions, health status, work-life
balance, education, environmental quality, and subjective well-being. For each dimension, one or
more statistical indicators provide empirical information about a country’s performance on that
dimension. The results for each dimension are standardized across countries resulting in a score
35 For a more in-depth discussion of various GDP alternatives, see GDAE’s module on Macroeconomics and the
Environment.

from 0-10. While the results for each of the 11 dimensions can remain disaggregated, they can also
be combined to produce an overall well-being index.
The Happy Planet Index (HPI), developed and calculated by the British New Economics
Foundation, is perhaps the most novel attempt to devise an entirely new approach to measuring
national welfare in the context of environmental sustainability. The Happy Planet Index is
calculated on a national scale based on four factors: self-reported well-being (based on Gallup
World Poll life satisfaction data); life expectancy; inequality of outcomes (based on the distribution
in each country’s life expectancy and well-being data); and ecological footprint.
When you look at country rankings using these alternative indicators (see examples in Table 1),
you see that the countries with the highest GDP do not always score the highest when you factor
in the environment and human well-being. For example, the Philippines, which has a per capita
GDP of just under $3,000, ranks high in adjusted net savings and in the Happy Planet Index, and
has a low ecological footprint which means that living standards there are ecologically sustainable.
In contrast, the U.S. has a much larger per capita GDP at just under $60,000 per year, but ranks
significantly lower than the Philippines in ANS and HPI, with a much higher (unsustainable)
ecological footprint.
Table 1: Various indexes and indicators of success for a selection of countries
Country
Per Capita
GDP1
in USD
(2017)
Happy
Planet Index2
(2018)
Better Life
Index3
(2018)
Ecological
Footprint4
(resource use
/capacity) (2014)
Adjusted Net
Savings1
percent of GNI
(2016)
Chile 15,347 31.7 6.7 2.39 5.1
China 8,827 25.7 - 2.21 22.4
France 38,477 30.4 6.4 2.79 7.1
India 1,940 29.2 - 0.67 15.5
Mexico 8,903 40.7 6.6 1.52 12.5
Norway 75,505 36.8 7.6 3.59 15.8
Pakistan 1,548 31.5 - 0.47 14.7
Philippines 2,989 35 - 0.96 28.4
Russia 10,743 18.7 6 3.31 6.7
South
Africa 6,161 15.9 4.8 2.03 1.5
Uganda 604 19.4 - 0.71 -10.8
United
States 59,532 20.7 6.9 4.97 6.1
Sources: 1World Bank, World Development Indicators Database; 2New Economic Foundation’s Happy Planet Index; 3OECD Better Life Index; 4Global Footprint Network’s National Footprint
and Biocapacity Accounts
Economists have also created approaches that focus on human development and capabilities, and
move away from monetary values. Indian economist Amartya Sen defines development as the

process of expanding real freedoms that people enjoy. As opposed to identifying development with
the typical measures such as growth of GDP, or industrialization, Sen believes that access to
freedoms such as health care and education, and political and civil rights constitute the end goals
of development. While Sen acknowledges that things like GDP growth can be a means of
expanding these freedoms, he does not see them as an ends in themselves.36 (Sen, 2000). This is
known as the capabilities approach.
Sen also questions the commonly held notion in development that the present generation must
suffer and save, keeping current living standards down in order to accumulate capital for the future,
and that inequality in the short run is acceptable, as in the long run economic benefits will “trickle
down.”37 Philosopher Martha Nussbaum makes a similar argument using the human capabilities
approach which aims to provide “an account of basic constitutional principles that should be
respected and implemented by the governments of all nations, as a bare minimum of what respect
for human dignity requires.”38 Nussbaum lists 10 central capabilities that apply cross-culturally,
including health, affiliation (i.e. family and community), control over one’s environment, and
political control. She argues that the use of this common framework can provide an alternative to
GDP for comparative analysis of life quality between nations, though this comparative feature is
not the main focus of the approach.
There is no one indicator that has surfaced yet as the “best” alternative to GDP, and there is still
widespread debate as to the validity and interpretation of many of these alternative measures.
Though most of these indicators have not been adopted on a wide scale, the two examples below
show how an individual nation or region can use these indicators to measure their success and to
create policies that promote more than economic growth alone.
BOX 1: BHUTAN’S GROSS NATIONAL HAPPINESS INDICATOR
Perhaps the best example of nationwide adoption of an alternative index as a primary well-being
indicator comes from the country of Bhutan. Since 2008, the government has used Gross National
Happiness (GNH) to measure their country’s success and to inform policy making. Development
of the GNH index began in 2005 at the Center for Bhutan Studies, and is based on the four pillars
of good governance, sustainable socioeconomic development, preservation and promotion of
culture, and environmental conservation.
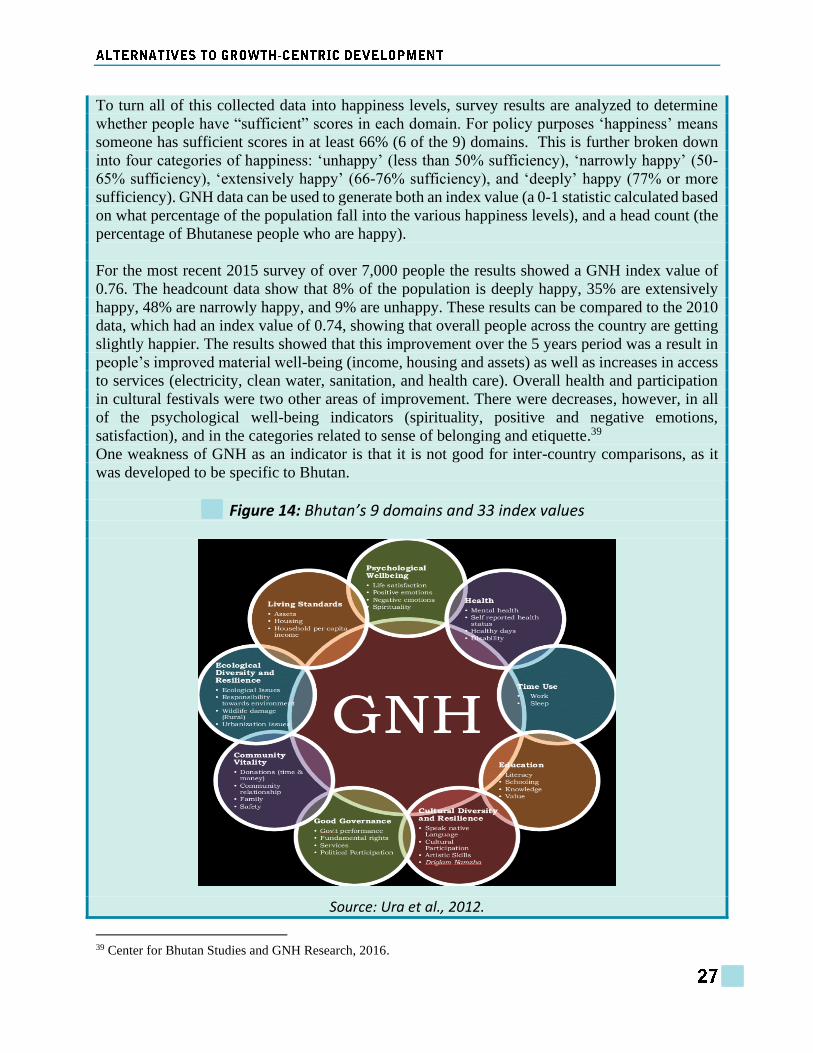
The GNH Index is broken down into 9 equally weighted domains, each with several index values
or indicators (see Figure 14 below). Information on these indicators is collected via an extensive
survey including questions about work and leisure activities, drinking water quality, community
vitality, cultural diversity, and ecological sustainability. In addition to providing a single index
value, the data is also used to calculate GNH for different demographic groups (by age, gender,
and occupation). To date, the study has been conducted in 2008, 2010, and 2015.
36 Sen, 2000. 37 Sen, 1997. 38 Nussbaum, 2000.
To turn all of this collected data into happiness levels, survey results are analyzed to determine
whether people have “sufficient” scores in each domain. For policy purposes ‘happiness’ means
someone has sufficient scores in at least 66% (6 of the 9) domains. This is further broken down
into four categories of happiness: ‘unhappy’ (less than 50% sufficiency), ‘narrowly happy’ (50-
65% sufficiency), ‘extensively happy’ (66-76% sufficiency), and ‘deeply’ happy (77% or more
sufficiency). GNH data can be used to generate both an index value (a 0-1 statistic calculated based
on what percentage of the population fall into the various happiness levels), and a head count (the
percentage of Bhutanese people who are happy).
For the most recent 2015 survey of over 7,000 people the results showed a GNH index value of
0.76. The headcount data show that 8% of the population is deeply happy, 35% are extensively
happy, 48% are narrowly happy, and 9% are unhappy. These results can be compared to the 2010
data, which had an index value of 0.74, showing that overall people across the country are getting
slightly happier. The results showed that this improvement over the 5 years period was a result in
people’s improved material well-being (income, housing and assets) as well as increases in access
to services (electricity, clean water, sanitation, and health care). Overall health and participation
in cultural festivals were two other areas of improvement. There were decreases, however, in all
of the psychological well-being indicators (spirituality, positive and negative emotions,
satisfaction), and in the categories related to sense of belonging and etiquette.39
One weakness of GNH as an indicator is that it is not good for inter-country comparisons, as it
was developed to be specific to Bhutan.
Figure 14: Bhutan’s 9 domains and 33 index values
Source: Ura et al., 2012.
39 Center for Bhutan Studies and GNH Research, 2016.
BOX 2: VERMONT’S GENUINE PROGRESS INDICATOR
In 2012 Vermont became the second state in the U.S. (Maryland being the first) to officially adopt
the use of the Genuine Progress Indicator (GPI) as an economic performance indicator. As
described above, GPI attempts to improve on GDP by accounting for a range of factors that both
increase and decrease well-being.
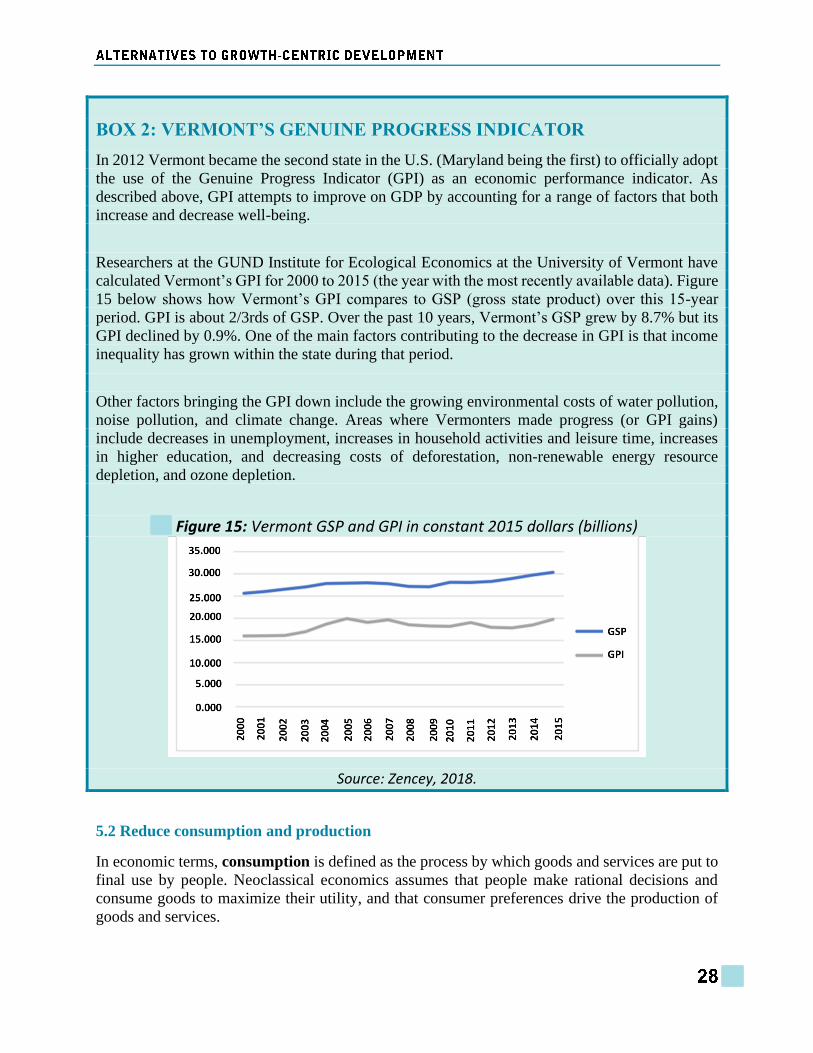
Researchers at the GUND Institute for Ecological Economics at the University of Vermont have
calculated Vermont’s GPI for 2000 to 2015 (the year with the most recently available data). Figure
15 below shows how Vermont’s GPI compares to GSP (gross state product) over this 15-year
period. GPI is about 2/3rds of GSP. Over the past 10 years, Vermont’s GSP grew by 8.7% but its
GPI declined by 0.9%. One of the main factors contributing to the decrease in GPI is that income
inequality has grown within the state during that period.
Other factors bringing the GPI down include the growing environmental costs of water pollution,
noise pollution, and climate change. Areas where Vermonters made progress (or GPI gains)
include decreases in unemployment, increases in household activities and leisure time, increases
in higher education, and decreasing costs of deforestation, non-renewable energy resource
depletion, and ozone depletion.
Figure 15: Vermont GSP and GPI in constant 2015 dollars (billions)
Source: Zencey, 2018.
5.2 Reduce consumption and production
In economic terms, consumption is defined as the process by which goods and services are put to
final use by people. Neoclassical economics assumes that people make rational decisions and
consume goods to maximize their utility, and that consumer preferences drive the production of
goods and services.

Consumption is such a big part of modern society that we consider consumerism, meaning a
significant preoccupation with the purchase and use of consumer goods and services, as a natural
human trait.40 However, this has not always been the case. In more traditional societies, it was
mainly the elite class that was involved in mass consumption. Families that were able to meet their
basic needs did not always turn to mass consumerism. Religious value systems taught people to
live simply, clothing and home styles were based on tradition instead of trend, and there was a
focus on spending that would benefit the community instead of the individual.
With the Industrial Revolution and urbanization, people left many of these traditions behind and
began to distinguish themselves through consumption. Advertising played a large role in this shift,
encouraging people to buy more and more in order to keep up with the upper-class elite. At the
same time people began to forgo leisure and family time in favor of longer work hours and higher
earnings. With globalization and increased access to television and the internet, more people are
exposed to advertising and the portrayal of the ways of life of the world’s wealthiest societies. As
income levels rise across the globe, a global “middle class” increasingly models consumption
behavior on patterns in the Global North, increasing purchases of individual vehicles, consumer
electronics and domestic appliances, and shifting to a meat-based diet.
Despite the continued drive for increased consumption, there is evidence that higher levels of
consumption and material wealth do not always contribute to increased happiness. A variety of
studies have found that increased income, which is correlated with increased consumption, only
improves well-being up to a point (approximately $75,000 income), beyond which there are
significantly diminishing returns to increased income in terms of self-described well-being, and
no improvement in “emotional well-being”.41
The growing field of behavioral economics uses insights from various social and biological
sciences to explore how people make decisions. Behavioral economics has been important in
showing that people are not always rational consumers, and often do not behave as economic
models predict. Many of the findings of this field point to the limited role of consumerism in well-
being, highlighting instead the value of experiences and activities over goods, and citing the
detrimental effects of always trying to keep up with neighbors and the upper class.
Regardless of the relationship between consumption and well-being, all consumption activities
have an impact on the environment, from the extraction of the materials, to manufacturing,
packaging, transport, and finally disposal. The term green consumerism refers to making
consumption decisions at least partly on the basis of environmental criteria. This movement is
growing as people seek out reusable, environmentally-friendly, and organic products.
Green consumerism can be further be broken down into two types: “shallow” green consumerism,
which refers to purchasing ecofriendly alternatives without changing consumption levels, and
“deep” green consumerism which refers to producing ecofriendly alternatives while also reducing
overall consumption levels. For example, someone practicing shallow green consumerism might
buy a new t-shirt made out of organic cotton, and an electric car; while someone practicing deep
40 For a more in depth look at this topic, see GDAE’s module titled “Consumption and the Consumer Society,”
available at http://www.bu.edu/eci/education-materials/teaching-modules/#consumption. 41 Kahneman and Deaton, 2010.
green consumerism might resist buying clothing that they do not need, and use a bicycle or take
public transportation. Degrowth advocates argue that deep consumerism is required in the Global
North to truly move away from a growth-centric economic system and allow for sustainable use
of earth’s resources. Reducing consumption in the Global North would also free up resources for
use by countries in the Global South, where an increase in consumption is actually needed to
improve human well-being.
Since production is tied to consumption (goods are only made if there is someone to buy them),
reducing consumption implies reducing production. Reducing production does not necessarily
mean nothing will get manufactured, and that jobs will be lost, but it does mean that the way work
gets done and goods get made will need to change. For example, in many countries the 40-hour
work week is the employment standard. However, some non-growth-centric economists suggest a
shift to a shorter work week. The New Economics Foundation (NEF) proposes a shift to a 21-hour
work week as the new norm.42 They cite three categories of benefits this shift would provide:
1. Safeguarding the natural resources of the planet: moving towards a much shorter
working week would help break the habit of living to work, working to earn, and earning
to consume. People may become less attached to carbon-intensive consumption and more
attached to relationships, pastimes, and places that absorb less money and more time.
2. Social justice and well-being for all: a 21-hour ‘normal’ working week could help
distribute paid work more evenly across the population, reducing ill-being associated with
unemployment, long working hours and too little control over time. It would make it
possible for paid and unpaid work to be distributed more equally between women and men;
for parents to spend more time with their children—and to spend that time differently; for
people to delay retirement if they wanted to, and to have more time to care for others, to
participate in local activities and to do other things of their choosing.
3. A robust and prosperous economy: shorter working hours could help to adapt the economy
to the needs of society and the environment, rather than subjugating society and
environment to the needs of the economy. Business would benefit from more women
entering the workforce; from men leading more rounded, balanced lives; and from
reductions in work-place stress associated with juggling paid employment and home-based
responsibilities.
Proponents of this concept recognize that a transition to a shorter working week would have to
happen slowly over time, and would have to be accompanied by an increase in minimum wages
and a progressive taxation structure that reduces inequality.
Finally, a shift in perspectives would be needed to get individuals to buy in to this system, and
change their expectations of their standards of living. In addition to standardizing the shorter work
week, expanding the use of reciprocity, or the non-market exchange of goods and labor, can also
improve well-being without economic growth. The following two examples—one from Quechua
societies in the Andes region in south America and one from the United States—show how the use
of a local informal economy43 and reciprocal labor can be used to reduce production and
consumption activities while still meeting human needs.
42 NEF, 2010. 43 While the term formal economy refers to economic activities that are recorded as part of GDP, the informal
economy refers to activities that are not monitored by the government or taxed, and are often non-monetary.
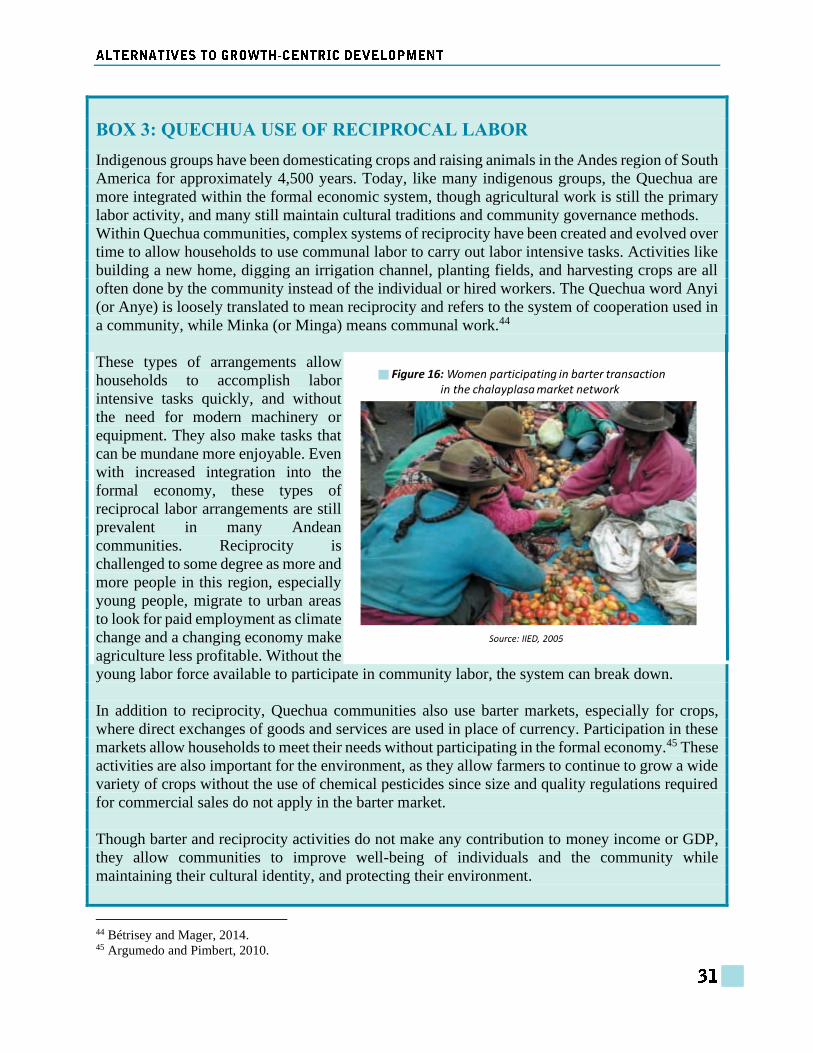
BOX 3: QUECHUA USE OF RECIPROCAL LABOR
Indigenous groups have been domesticating crops and raising animals in the Andes region of South
America for approximately 4,500 years. Today, like many indigenous groups, the Quechua are
more integrated within the formal economic system, though agricultural work is still the primary
labor activity, and many still maintain cultural traditions and community governance methods.
Within Quechua communities, complex systems of reciprocity have been created and evolved over
time to allow households to use communal labor to carry out labor intensive tasks. Activities like
building a new home, digging an irrigation channel, planting fields, and harvesting crops are all
often done by the community instead of the individual or hired workers. The Quechua word Anyi
(or Anye) is loosely translated to mean reciprocity and refers to the system of cooperation used in
a community, while Minka (or Minga) means communal work.44
These types of arrangements allow
households to accomplish labor
intensive tasks quickly, and without
the need for modern machinery or
equipment. They also make tasks that
can be mundane more enjoyable. Even
with increased integration into the
formal economy, these types of
reciprocal labor arrangements are still
prevalent in many Andean
communities. Reciprocity is
challenged to some degree as more and
more people in this region, especially
young people, migrate to urban areas
to look for paid employment as climate
change and a changing economy make
agriculture less profitable. Without the
young labor force available to participate in community labor, the system can break down.
In addition to reciprocity, Quechua communities also use barter markets, especially for crops,
where direct exchanges of goods and services are used in place of currency. Participation in these
markets allow households to meet their needs without participating in the formal economy.45 These
activities are also important for the environment, as they allow farmers to continue to grow a wide
variety of crops without the use of chemical pesticides since size and quality regulations required
for commercial sales do not apply in the barter market.
Though barter and reciprocity activities do not make any contribution to money income or GDP,
they allow communities to improve well-being of individuals and the community while
maintaining their cultural identity, and protecting their environment.
44 Bétrisey and Mager, 2014. 45 Argumedo and Pimbert, 2010.
BOX 4: TIME BANKING IN US COMMUNITIES
Like the Quechua concepts of Minka and Anyi, the concept of time banking is a system of
reciprocity involving a network of community members who give hours of service in order to
receive a time credit to later be redeemed to receive another service without the use of currency.
An example might be one individual spending 3 hours offering legal advice to another time bank
member and in exchange receiving 2 hours of child care from one member, and one hour of
Spanish lessons from another.
Although the formal economy values legal advice more highly than childcare or language tutors
(the average lawyer earns much more than the average daycare provider or educator) the time bank
exchange values everyone’s time equally.
Since timebanks often occur outside of tight knit community groups, like those present in Quechua
communities, a more formal tracking system is typically used to track credits. As of 2018, there
were around 120 formally established timebanks across the United States. One example is Our
Time Bank, serving the West Los Angeles, California region.
In addition to the hours of exchange, this time bank organization also offers a Repair Café, where
members can bring broken or damaged objects to get help repairing them, and learn how to repair
things by themselves. The organization also sponsors a “sharing economy” of specialty tools and
equipment that members can borrow, to reduce unnecessary purchases of equipment by
individuals.
5.3 Provide social safety nets and redistribute wealth
The term social safety net refers to the collection of services provided by institutions to help the
poor or disadvantaged. This could include things like unemployment benefits, low income housing
credits, food stamps, free health care, homeless shelters, and cash transfer programs. These
programs cost money to implement, and funding typically comes from taxing members of society.
In general, most countries use some form of a progressive tax structure, which means the tax
rate (tax as a percentage of your income) paid to the government increases as income levels
increase. So while an individual making $30,000 a year may pay a 10% tax rate ($3,000), someone
making $150,000 a year might pay a 30% tax rate ($45,000).
How big the social safety net should be, and how taxes are structured, are major topics of political
debate. Many degrowth proponents promote a strongly progressive tax structure as a method of
reducing inequality. Some proponents of degrowth even go as far as recommending an income
ceiling (also called a wage ceiling, or a maximum wage), which is effectively a 100% tax rate
beyond a certain amount. This would discourage individuals from seeking out never-ending salary
increases, and could reduce the consumption of luxury goods.

The concept of universal basic income, or guaranteed income has also gained support in recent
years as people worry that automation will replace the need for human workers, increasing
unemployment. Though specifics vary widely, the general concept is that government funding is
used to provide all individuals with regular payments. In the modern, developed world it is almost
impossible to meet basic needs without money, so a program like this would ensure that everyone
was able to maintain a certain basic standard of living. The main challenge of instituting universal
basic income is high costs, though proponents argue that if done correctly it can be more efficient
that the various complex social welfare programs already in place.
Another progressive concept for redistributing wealth is the idea of paying reparations, meaning
monetary compensation, to groups that have been mistreated in the past. For example, black
Americans unwillingly contributed 250 years of unpaid slave labor, making the US the economic
leader it is today and benefiting white slave owners and their descendants. The National Coalition
of Blacks for Reparations in America defines reparations as:
“A process of repairing, healing and restoring a people injured because of their
group identity and in violation of their fundamental human rights by governments,
corporations, institutions and families. Those groups that have been injured have
the right to obtain from the government, corporation, institution or family
responsible for the injuries that which they need to repair and heal themselves. In
addition to being a demand for justice, it is a principle of international human
rights law.”46
Reparations for slavery in the United States would involve paying individuals who are descendants
of slaves and identify as African American for these injustices, as well as changing existing
institutions that continue racial oppression. Ideas about how much should be paid, who would
qualify and how these payments would be redistributed vary greatly, and the topic is politically
controversial.
Ultimately a combination of social welfare programs, combined with a change in mindset, is likely
to be needed to make a significant impact on inequality. The examples below show how Brazil has
addressed income inequality with a generous social welfare program, and how Finland is testing a
universal basic income program on a small scale to observe the impacts and determine if a larger
scale program would be feasible and desirable.
BOX 5: BRAZIL’S BOLSA FAMILIA
Bolsa Familia is a social welfare program implemented in Brazil starting in 2003 that provides a
monthly stipend to low income households on the conditions that their children remain in school
without too many absences, and are vaccinated. This type of program is called a conditional cash
transfer program.
Bolsa Familia was introduced with the goals of reducing income inequality and breaking the cycle
of poverty by ensuring that children from low income households are educated and have access to
46 M4BL, 2019.
health care. Today, it is the largest program of its type, serving approximately 14 million
households (around 50 million people), and is widely considered to be a success.
Brazil is one of the few countries that has seen a decrease in intra-country inequality since the
1980s, with a decreasing share of the total national income held by the top 10%. The country’s
Gini coefficient has moved from 0.63 in 1989 to 0.53 in 2017.47
The program is credited with cutting the number of Brazilians living in extreme poverty in half
during its first 10 years while reducing hunger, increasing health care utilization,48 and increasing
the number of girls in school.49 Additionally, since these transfers are made to female heads of
households whenever possible, the program has improved the decision making power of women
in poor households.50 Opponents of social welfare programs often cite high costs as their primary
argument against them, but Bolsa Familia costs the government less than 0.6% of their total GDP.
Bolsa Familia remains popular among both liberal and conservative parties, and serves as an
example of a successful program for reducing inequality.
BOX 6: FINLAND’S UNIVERSAL BASIC INCOME TRIAL
Finland and other Nordic countries (Denmark, Sweden, Iceland, Norway) are known for having
relatively low levels of economic inequality and high levels of wealth and well bring for their
residents due to extensive government social safety nets. Residents receive government provided
healthcare, free university education, free childcare for low income families, generous paid
paternity leave, and support for unemployed, sick, and injured workers, and disabled and elderly
individuals. The United Nations rated Finland as the happiest country in their 2019 world
happiness report.
In 2016, Finland began conducting a two-year trial of a universal basic income program. For the
trial, 2,000 unemployed residents were randomly selected to receive a monthly no-strings-attached
payment equivalent to US$685 from the government. Full results from the trial are not yet
available, but preliminary results show that though the program did not increase unemployment
rates, it did affect other measures of well-being including health, stress levels, and mood.
Participants receiving UBI benefits were happier than when they had received unemployment
benefits. Participants also described feeling free to pursue their own interests and seek out
employment that interested them, or start their own businesses, without the fear of losing their
benefits once they gained employment.51 It is currently unclear whether the government will
implement a UBI plan on a larger scale, though they have decided not to continue the trial at this
point.
47 World Bank, World Development Indicators database. 2019. 48 Shei et al., 2014. 49 de Brauw et al, 2014. 50 de Brauw et al, 2013. 51 “Finland’s basic income test boosts happiness but not employment,” New York Times (Reuters) February 9, 2019.

5.4 Change ownership structures
In capitalist society, private ownership of resources (meaning one individual or small group of
individuals owns a building, business, land, etc.) is the standard ownership structure. This structure
tends to create an owner class and a worker class, resulting in economic inequality and a drive for
never ending growth as workers strive to make it to the owner class. The concept of cooperative
ownership challenges that standard, instead allowing a group to own and democratically operate
resources. Cooperative and community-based ownership structures can be used for business, for
agriculture, energy production and distribution, and for housing.
Interest in worker owned cooperatives is growing as the pay divide between average workers and
top executives continues to increase. The U.S. company Amazon is a prime example of this
discrepancy, with owner Jeff Bezos, the world’s richest man, earning an estimated $8.96 million
per hour, while many of his workers make $15 an hour operating under stressful working
conditions.52 At this rate, an Amazon employee would have to work approximately 287 years full-
time to make what the CEO makes in a single hour.
Cooperatives challenge this model, allowing worker-owners to share the profits made by their
business. A worker owned cooperative has two key principles:
1. workers own the business and they participate in its financial success on the basis of their
labor contribution to the cooperative, and
2. workers have representation on and vote for the board of directors, adhering to the principle
of one worker, one vote.53
Cooperatives have a lower ratio of highest to lowest paid salaries when compared to conventional
businesses, higher worker productivity and lower layoff rates, and a better 5-year survival rate for
new businesses.54 An additional benefit is that with more money going to workers, instead of to
upper-level managers and CEOs, more money stays in the local economy.
Like worker-owned cooperative businesses, agricultural cooperatives are farmer-owned
enterprises that allow the owners to pool their resources to produce and/or sell their products. The
two main forms of agricultural cooperatives are: production cooperatives, where farmers jointly
own and work the land and machinery; and service cooperatives, where members farm individually
but are provided with inputs like access to seeds, fertilizers, fuel, and machinery, or with services
related to the sale of the product like packaging, marketing and distribution. These cooperatives
allow small farmers to work to compete against large industrial producers. Service cooperatives
are more common in the Global North, while production cooperatives are found mainly in the
Global South.
Finally, the standard model of privately owned housing can be changed with community land
trusts. These are non-profits that allow for community land stewardship, often focusing on
providing affordable housing and revitalizing abandon buildings and lots. Instead of a private
home owner, the trust acquires land and maintains ownership. Residents take on a long-term
52 Hoffower, 2019. 53 Democracy at Work Institute, 2019. 54 Pérotin, 2017.
renewable lease instead of purchasing the home outright. When they leave (sell) the home they get
a portion of increased value, and the rest goes back into the trust. These trusts improving
community well-being by:
• providing low- and moderate-income people with the opportunity to build equity through
homeownership and ensure these residents are not displaced due to land speculation and
gentrification.
• protecting owners from downturns; foreclosure rates for land trusts have been as much as
90% less than conventional home mortgages.
• allowing for the possibility of direct, grassroots participation in decision-making and
community control of local assets.
• providing a range of community-focused initiatives including homeownership education
programs, commercial development projects, and community greening efforts.55
The two examples below show how cooperative ownership models have been implemented to help
marginalized groups around the globe. The first, in Nicaragua, shows how agricultural
cooperatives can benefit small farmers, while the second describes how immigrant women in New
York City created their own cooperative cleaning business.
BOX 7: NICARAGUA’S AGRICULTURAL COOPERATIVES
Over half of the national income in Nicaragua comes from a combination of cooperatives and
small family farms, referred to collectively as the popular economy.
One example of a cooperative that has provided a number of non-monetary benefits to its member
owners is The Gloria Quintanilla peasant cooperative, run by 22 women and consisting of 79
member families. This cooperative is on land formerly owned by the Somoza family (dictatorial
rulers of Nicaragua from 1936 to 1979) that was once used to produce coffee with chemical
pesticides and fertilizers. Today the cooperative uses agroecological practices to grow traditional
crops like bananas, plantains, cassava, yams, and maize in addition to coffee, without the use of
chemical inputs. Cooperative members process, package, and sell their coffee themselves, cutting
out middle-men who would take a large share of the profits, and allowing them to collectively
bargain for better prices. The women receive both technical and finance training, and profits are
used to fund community education.
The cooperative improves member’s self-sufficiency while also increasing food sovereignty in
the region.56 The cooperative is supported by the Asociación de Trabajadores del Campo (ATC,
or Rural Workers Association), an organization that defends rural workers and peoples of
Nicaragua. The ATC is also part of the international movement and organization called La Vía
Campesina, or the international peasant’s movement, that is active across the Global South and
works to defend peasant agriculture for food sovereignty, and to promote social justice and dignity
while opposing corporate agricultural that destroys social relations and nature.
55 communitywealth.org, 2019. 56 Via Campesina, 2018.

BOX 8: WOMEN OWNED GREEN CLEANING COOPERATIVE IN NEW
YORK CITY
In the United States, and especially in New York City, the house cleaning industry has been
dominated by women, and more specifically by women of color and immigrants, groups who are
frequently underpaid and subject to discrimination. Studies of paid care workers in New York City
(which include home care aids, nannies, and house cleaners) have found that that these workers
are likely to be subject to long and fluctuating working hours, have high levels of exposure to
chemical cleaning products, lack benefits, and often experience minimum wage and overtime
violations.57
To address this, several worker-owned cleaning cooperatives have formed in the city. One example
is Si Se Puede Women’s Cooperative in Brooklyn, which focuses on using environmentally
friendly cleaning products and ensuring that its worker owners are paid a living wage. The
cooperative was formed in 2006 by 14 women, and now has over 100 member owners, who are
all female immigrants. The name Si Se Puede (“We can do it”) was chosen by the original members
since it is a common phrase used in political and social change movements in Latin America. All
members vote equally in decisions, and meet bi-weekly for support and ongoing training. The
group worked with the Center for Family Life in Brooklyn, which has a cooperative development
program that helps local immigrants and low-income workers to start and run cooperatives. In
addition to Si Se Puede, the center has helped to support the formation of 15 local cooperative
owned businesses in the fields of elder care, cleaning, child care and tutoring, catering, and pet
care.
The number of cooperative businesses in NYC has been growing in recent years due to the Worker
Cooperative Business Development Initiative (WCBDI) launched by Mayor Bill DeBlasio in
2015. As part of this initiative, $1.2 million in funding was distributed to 10 partner organizations
and small business services to “share information with prospective entrepreneurs, support existing
worker cooperatives, spur the creation of new worker cooperatives and help small businesses
transition their business into the worker cooperative model.”58 As of the end of 2018, 132 worker
cooperatives had been launched under this initiative, and the budget for the initiative had been
increased to around $3 million per year. In addition to helping cooperatives form, the initiative
also provides businesses and prospective businesses with free services including business plan
development, financial planning, accounting, web development and tech support, and legal advice.
5.5 Use communal management of natural resources
In addition to transferring control of businesses and housing to community members, transferring
control of natural resources to the community is a strategy for promoting a growth-centric
57 NYC Consumer Affairs, 2018. 58 WCBDI, 2015.

alternative economy. In economic terms, natural resources that are rival in use (one person’s use
diminishes the ability of others to use it) and non-excludable (people cannot be prevented from
using them) are known as common pool resources. Examples of this type of resource include
grazing land, fishing grounds, water used for irrigation, and forests. These resources can be subject
to the tragedy of the commons, where they are overused by individuals behaving in a self-
interested manner.
Possible solutions to this problem involve government management or licensing of the resources,
or privatization, involving individual or corporate ownership. A third option, however, is to have
community members maintain control of the resources and develop their own rules to prevent
overuse. In 2009, political economist Elinor Ostrom received a Nobel Prize in economics for her
work related to community governance of the commons.59 Through her research on water basin
management in California, irrigation systems in Spain and Nepal, highland villages in Switzerland
and Japan, and fisheries in Maine and Indonesia, Ostrom identified eight design principles that
allow for common pool resources to be successfully managed with local governance. They are:
1. Clearly defined boundaries: To identify both the group and resources.
2. Proportional equivalence between benefits and costs: System must fairly reward members
for their contributions.
3. Collective-choice arrangements: Creation of rules and decision making must be done by
group consensus.
4. Monitoring: To prevent free riding and exploitation.
5. Graduated sanctions, with fair punishments that reflect the severity of the transgression.
6. Conflict resolution mechanisms.
7. Recognition of rights to organize, to ensure that groups are independent and create rules
from within, as opposed to being subject to externally applied rules.
8. For groups that are part of larger social systems, there must be appropriate coordination
among relevant groups.
By utilizing these principles, many communities have managed to avoid the “tragedy of the
commons”. The two examples below show how a long-maintained tradition of water system
management in Nepal is still in place today, and how a similarly structured irrigation system
management program in New Mexico is working to protect scarce water resources.
BOX 9: NEPAL’S COMMUNITY MAINTAINED WATER SYSTEMS
Managing water used to irrigate crops can be difficult, as upstream use and contamination affects
all users downstream. In Nepal, rural farmers have historically worked together to construct and
maintain their own small irrigation canal systems. As early as 500-800 AD, farmers in Kathmandu
Valley were constructing drinking water systems. These complex systems were designed to
operate in the unique climate, soils, topography, and social structure of each location. Systems
were adjusted to seasonal weather patterns and relied on indigenous knowledge passed down
through generations.
59 Elinor Ostrom was the first female (and as of 2019 still only one of two females) to win this prize in economics.
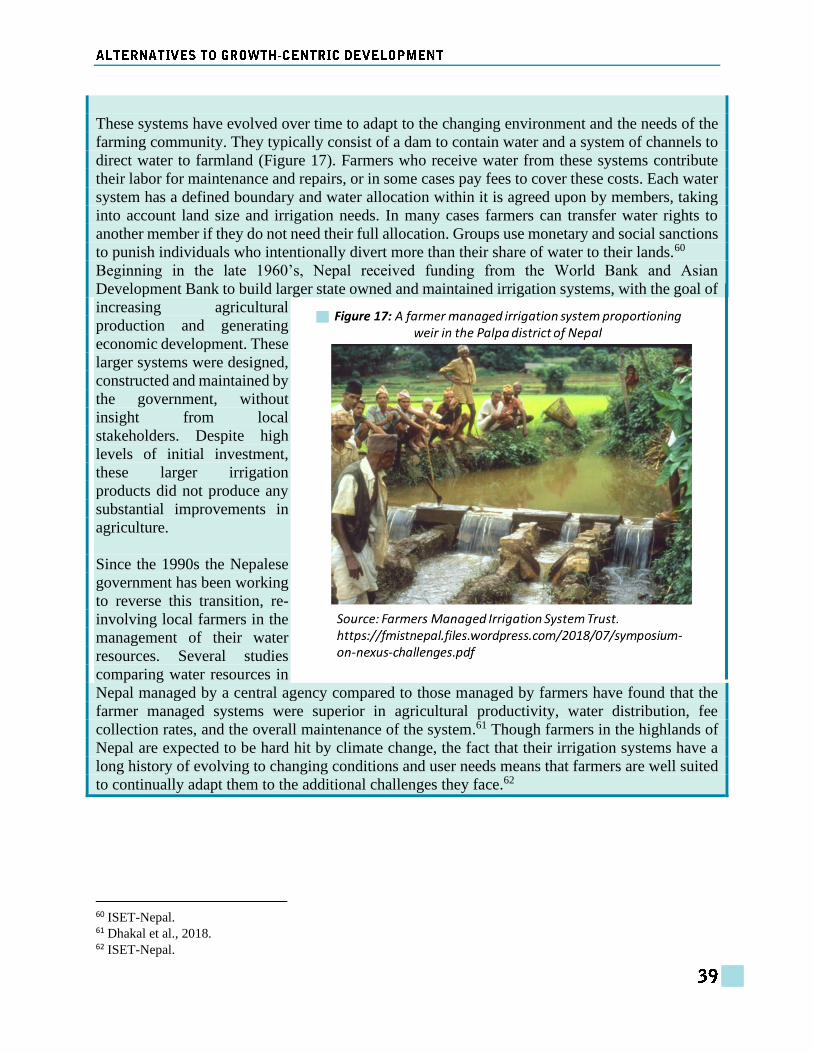
These systems have evolved over time to adapt to the changing environment and the needs of the
farming community. They typically consist of a dam to contain water and a system of channels to
direct water to farmland (Figure 17). Farmers who receive water from these systems contribute
their labor for maintenance and repairs, or in some cases pay fees to cover these costs. Each water
system has a defined boundary and water allocation within it is agreed upon by members, taking
into account land size and irrigation needs. In many cases farmers can transfer water rights to
another member if they do not need their full allocation. Groups use monetary and social sanctions
to punish individuals who intentionally divert more than their share of water to their lands.60
Beginning in the late 1960’s, Nepal received funding from the World Bank and Asian
Development Bank to build larger state owned and maintained irrigation systems, with the goal of
increasing agricultural
production and generating
economic development. These
larger systems were designed,
constructed and maintained by
the government, without
insight from local
stakeholders. Despite high
levels of initial investment,
these larger irrigation
products did not produce any
substantial improvements in
agriculture.
Since the 1990s the Nepalese
government has been working
to reverse this transition, re-
involving local farmers in the
management of their water
resources. Several studies
comparing water resources in
Nepal managed by a central agency compared to those managed by farmers have found that the
farmer managed systems were superior in agricultural productivity, water distribution, fee
collection rates, and the overall maintenance of the system.61 Though farmers in the highlands of
Nepal are expected to be hard hit by climate change, the fact that their irrigation systems have a
long history of evolving to changing conditions and user needs means that farmers are well suited
to continually adapt them to the additional challenges they face.62
60 ISET-Nepal. 61 Dhakal et al., 2018. 62 ISET-Nepal.

BOX 10: NEW MEXICO’S ACEQUIA SYSTEMS
Acequia is a Spanish term used to describe the communal irrigation systems used for thousands of
years in Spain and by indigenous groups in Latin America. These systems have made agriculture
possible in arid regions and many are still in use today. Today in New Mexico there are over 700
acequias, each serving between 3 to 300 families.63
These irrigation systems divert
surface water from rivers
through ditches to family
farmlands. The structures and
water use are governed by
locally elected unpaid
commissioners and caretakers,
with community members
coming together each year to
maintain and clean out the
ditches. (Figure 18)
The number of people each
land owner must provide to do
the cleanup is dependent on the
size of their land and amount
of water they use.
With competing water demands combined with land redevelopment, many acequias are now
considered to be at risk. New landowners in the region do not always want to provide labor to help
with clean up, and some of the tradition and cultural aspects of the acequias are being lost.64 The
New Mexico Acequia Association aims to address these issues, helping acequia members to
navigate change and maintain their water systems. The support of a larger association allows
groups to maintain local control of their resources in an environment that favors private ownership
structures.
6. CONCLUSION: PROMOTING ALTERNATIVES
Many of the examples given above focus on the local scale, emphasizing the use of local resources
instead of integration into a global growth-oriented economy. This can take the form of designing
new indicators specific to a state or region, adopting programs promoting local management and
ownership of businesses, homes, and resources, purchasing local goods, and using local time banks
or barter markets to meet consumption needs.
63 NSAC, 2016. 64 Chacón, 2018.

Another common theme of many of the examples used above is that they are efforts undertaken
by groups that the formal growth focused economy has left behind: immigrants, native and
indigenous groups, women, and minority racial and ethnic groups. These groups who have been
ignored or harmed by the global growth focused economy have organized and created their own
local institutions that allow them to thrive. Learning from these groups and including them in the
design and adoption of alternative policies and programs is also crucial.
Though many successful smaller examples exist, implementing a shift away from a growth focused
economy on a larger scale would be a major challenge requiring systematic change. While support
for degrowth, green growth and other alternatives has grown in recent decades, it has not yet
penetrated mainstream economics and politics. In order for a true shift to occur, many changes
would be needed in existing institutions and political systems.
One proposal for large-scale modification of existing growth patterns is the Green New Deal,
which has been advocated both in the United States and globally. This plan for taking on climate
change by reducing fossil fuel use, curbing emissions, and creating high paying jobs in clean
energy, does not explicitly challenge a growth focus, but it implies a major shift in investment and
employment away from fossil-fuel and energy-intensive forms of growth (see Box 11).
BOX 11: THE GREEN NEW DEAL
The concept of a “green new deal” has recently achieved some political traction, but its exact
content and policy feasibility is subject to considerable uncertainty. Aspects of what is referred to
as a “green new deal” have been discussed by ecological economists for some time. In this
discussion, there remains a tension between concepts of “green growth” and limits to growth or
degrowth. Major stated goals of a green new deal include:
This approach delinks traditional economic growth, largely based on fossil energy and resource
input-intensive techniques, from employment creation and expanding well-being. In part this is a
technological issue of employing “green”, renewable, and resilient technological options, and in
part it represents a shift in consumption from energy-intensive to energy-conserving and service-
oriented forms of consumption.
Changing existing infrastructure and institutions
Moving away from a growth-centric economy is also reliant on having systems in place that allow
people to live lifestyles where high income levels are not needed to get by, and where there are
affordable green alternatives available to everyone.
This includes having access to public transportation, affordable housing, and sustainably grown
food, and having systems for communities to control their own resources. The suburban living that
is part of the America dream (and has been promoted as the dream to work towards around the
world) often involves a large house that is expensive to heat and cool, a large gas powered vehicle
to get around and a housing layout that provides distance from neighbors and does not foster a
sense of community. Food, water and electricity are brought in from elsewhere without much
thought as to where it comes from. A greater emphasis on community self-reliance and
sustainability, local food systems, public transit, and efficient affordable housing, can offer an
alternative vision.
Population Growth and Stabilization
A growing economy is often associated with a growing population, and as emphasized by
advocates of a steady-state economy, population must eventually stabilize given finite resources.
A stabilizing population poses both economic challenges and opportunities. Typically, a stabilizing
population will have a higher proportion of older persons, and a relatively smaller labor force of
younger workers. This can put strain on such systems as Social Security and Medicare, which see
higher expenditures with a lower labor force to provide tax revenues. On the other hand, a larger
older population tends to create a large number of service-oriented jobs in health and elder care.
This provides employment opportunities in sectors that generally have lower environmental impact
than goods manufacturing, making for an overall “greener” economy.
Education, Expectations, and Behavior
Many aspects of current education and culture encourage greater goods consumption. Advertising
is a powerful tool, often promoting the idea that you can live a better life if you purchase certain
products and emulate the extravagant life styles of those presented in the media. Traditional
economics education tends to equate higher consumption with greater well-being. A reorientation
to a less environmentally damaging, and perhaps healthier and more satisfying, lifestyle can occur
only with a shift in attitudes. If people come to place higher value on community and on non-
consumptive forms of life satisfaction such as cultural activities or appreciation of nature, they will
be less likely to pursue satisfaction through higher goods consumption. The kinds of consumption
also matter; for example, a heavily meat-centered diet has much higher environmental costs and
probably also adverse health consequences.
Legal and Financial Systems
The kinds of alternative economic institutions described in the examples given above can be
fostered by certain specific policies, including: legal and financial systems that encourage and
facilitate the development of cooperatives rather than large for-profit corporations; policies that
provide more choice of work hours; regulation of misleading advertising and harmful products;
availability of credit or tax advantages for small farmers and businesses; taxes on environmentally
harmful production methods and/or subsidies for socially and environmentally beneficial
industries. Policies that provide support to low-income families for education and health care can
promote both equity and the development of work and life skills, often providing economic
benefits well in excess of their costs.
Political Implications
Perhaps the main barrier to moving forward with alternatives to growth-centric development is
political feasibility. In much political discourse, “economic growth” is considered the most
important of goals. GDP growth is often seen as a proxy for well-being. Additionally, those who
benefit most from the growth-focused agenda can afford to make large campaign contributions to
help support policies that will keep them in their positions of wealth and power. In order to gain
political support for alternatives to growth-centric models, the concept first needs to be accepted
into mainstream thought. But this may not be impossible.
When most people say “we need economic growth”, what they really mean is “we need stable and
well-paid employment” or “we need revenues to support education and health care”. If these
desirable goals can be pursued in their own right, rather than through the pursuit of perpetual
growth, people may find that lower-impact lifestyles are actually more satisfying. In communities
that have suffered economic decline, and in much of the developing world, there is clearly a need
for some form of growth, but this could be oriented to the development of “greener”, more
sustainable industries such as renewable power, or in services such as health care and education.
The many examples presented in this module indicate that alternative approaches can be effective,
can promote stable and satisfying employment, and can gain popular support. The urgency of the
climate crisis and other environmental impacts of excessive consumption, such as plastics
pollution and pollution and depletion of water supplies, suggest that policies to promote alternative
economic development approaches may be both necessary and potentially successful, both in the
global North and South.
KEY TERMS AND CONCEPTS
Adjusted Net Saving (ANS): a national accounting measure developed by the World Bank which
aims to measure how much a country is actually saving for its future.
Agricultural Cooperative: farmer owned enterprises that allow the owners to pool their resources
to produce and/or sell their products
Agroecology: an integrated approach that simultaneously applies ecological and social concepts
and principles to the design and management of food and agricultural systems. It seeks to optimize
the interactions between plants, animals, humans and the environment while taking into
consideration the social aspects that need to be addressed for a sustainable and fair food system.
Austerity Measures: policies that aim to reduce government budget deficits through spending
cuts, tax increases, or a combination of both.
Behavioral Economics: Study of the effects of psychological, cognitive, emotional, cultural and
social factors on the economic decisions of individuals and institutions and how those decisions
vary from those implied by classical theory.
Better Life Index (BLI): an index developed by the Organization for Economic Cooperation and
Development to measure national welfare using 11 well-being dimensions.
Biocapacity: the capacity of a natural environment to provide resources and assimilate wastes.
Bretton Woods Convention: the gathering of 730 delegates from all 44 Allied nations at the
Mount Washington Hotel, situated in Bretton Woods, New Hampshire, United States, to regulate
the international monetary and financial order after the conclusion of World War II. Also known
as the United Nations Monetary and Financial Conference.
Buddhist Economics: a spiritual and philosophical approach to the study of economics that
examines the psychology of the human mind and the emotions that direct economic activity, in
particular concepts such as anxiety, aspirations and self-actualization principles.
Capabilities Approach: An approach defined by its choice of focus upon the moral significance
of individuals’ capability of achieving the kind of lives they have reason to value, defined by Indian
economist and philosopher Amartya Sen.
Carrying Capacity: the maximum population size of a species that the environment can sustain
indefinitely, given the food, habitat, water, and other necessities available in the environment.
Classical Economics: a school of thought that flourished, primarily in Britain, in the late 18th and
early-to-mid 19th century with the primary theory that market economies are largely self-
regulating systems, governed by natural laws of production and exchange.
Common Pool Resources: resources that are not subject to private ownership and are available to
all, such as public parks or the oceans.
Community Land Trust: nonprofit, community-based organizations designed to ensure
community stewardship of land. Community land trusts can be used for many types of
development (including commercial and retail), but are primarily used to ensure long-term housing
affordability

Conditional Cash Transfer Programs: Programs that aim to reduce poverty by making welfare
programs conditional upon the receivers' actions. The government only transfers the money to
persons who meet certain criteria.
Consumerism: a social and economic order that encourages the acquisition of goods and services
in ever-increasing amounts
Consumption: the use of goods and services by households.
Cooperative Ownership: a model of ownership where an organization is owned and controlled
by the people who use the products or services the business produces.
Decoupling: breaking the correlation between increased economic activity and similar increases
in envrionmental impacts.
Degrowth: an equitable downscaling of production and consumption that increases human well-
being and enhances ecological conditions at the local and global level, in the short and long term.
Dependency Theory: the notion that resources flow from a "periphery" of poor and
underdeveloped states to a "core" of wealthy states, enriching the latter at the expense of the former
Ecological Economics: an economic perspective that views the economic system as a subset of
the broader ecosystem and subject to biophysical laws.
Ecological footprint (EF): a methodology that seeks to convert all human impacts into equivalent
units of biologically productive land area.
Ecological thresholds: limits beyond which ecosystems can suffer severe damage or collapse.
Eco-efficiency: production of goods and services with less use of resources, waste, and pollution.
Eco-Swaraj: is a grassroots framework developed in India that respects the limits of the earth and
the rights of other species, while pursuing the core values of social justice and equity
Environmental Justice: the fair treatment and meaningful involvement of all people regardless
of race, color, national origin, or income with respect to the development, implementation, and
enforcement of environmental laws, regulations, and policies.
Environmental Racism: environmental injustice that occurs in practice and in policy within a
racialized context.
Excludable / Non-Excludable: a good or service is called excludable if it is possible to prevent
people (consumers) who have not paid for it from having access to it. By comparison, a good or
service is non-excludable if non-paying consumers cannot be prevented from accessing it
Exported Pollution: Wastes and emissions that are either directly exported to another country, or
are indirectly exported, as countries reduce their own pollution by purchasing products that are
environmentally harmful to produce from other countries.
Feminist Economics: the critical study of economics and economies, with a focus on gender-
aware and inclusive economic inquiry and policy analysis

Food Sovereignty: is the right of peoples to healthy and culturally appropriate food produced
through ecologically sound and sustainable methods, and their right to define their own food and
agriculture systems
Genuine Progress Indicator (GPI): a national accounting measure that includes the monetary
value of goods and services that contribute to well-being and deducts impacts that detract from
well-being.
Gini Coefficient: a statistical measure of distribution used as a gauge of economic inequality,
measuring income distribution among a population.
Global North: Nations that are economically developed such as the USA, the UK, Canada,
Western European nations and developed parts of Asia
Global South: countries located in Asia, Africa, Latin America and the Caribbean and considered
to have low and middle income compared to the Global North.
Green Economy: An economy that results in improved human well-being and social equity, while
significantly reducing environmental risks and ecological scarcities.
Green GDP: An index of economic growth with the environmental consequences of that growth
(including biodiversity loss and costs of climate change) factored into a country's conventional
GDP
Green Growth: A path of economic growth that uses natural resources in a sustainable manner.
Green New Deal: a Congressional resolution in the United States that lays out a plan for taking
on climate change by reducing fossil fuel use, curbing emissions, and creating high paying jobs in
clean energy. Similar proposals have also been advanced on a global level.
Gross National Happiness (GNH): An indicator system developed by the government of Bhutan
that is based on the four pillars of good governance, sustainable socioeconomic development,
preservation and promotion of culture, and environmental conservation.
Gross State Product (GSP): a measurement of a state's output that is the sum of value added from
all industries in the state
Green Consumerism: a form of consumption that is compatible with the safeguard of the
environment for the present and for the next generations
Gross domestic product (GDP): the total market value of all final goods and services produced
within a national border in one year.
Guaranteed Income: a government guarantee that each citizen receives a minimum income.
Happy Planet Index (HPI): A measure of a nation’s well-being that combines four elements
(well-being, life expectancy, inequality, and environmental footprint) to show how efficiently
residents of different countries are using environmental resources to lead long, happy lives.
Human Capabilities Approach: An approach developed by Martha Nussbaum centered around
the notion of individual human dignity with a goal of producing capabilities for each and every
person, with capabilities below belong to individual persons, rather than to groups.
Income Ceiling: a legal limit on how much income an individual can earn, also called a wage
ceiling
Informal Economy (or Informal Sector): the part of an economy that is neither taxed nor
monitored by any form of government. Unlike the formal economy, these activities are not
included in a country's GDP.
International Monetary Fund (IMF): An international organization headquartered in
Washington, D.C., consisting of 189 countries working to foster global monetary cooperation,
secure financial stability, facilitate international trade, promote high employment and sustainable
economic growth, and reduce poverty around the world.
Living Wage: The minimum income necessary for a worker to meet their basic needs for food,
housing, and other essentials such as clothing.
Neoclassical Economics: a broad theory that focuses on supply and demand as the driving forces
behind the production, pricing, and consumption of goods and services that emerged around 1900
and replaced the earlier theories of classical economics as mainstream.
Neoliberalism: A policy model including economic liberalization policies such as privatization,
austerity, deregulation, free trade, and reductions in government spending in order to increase the
role of the private sector in the economy and society.
Paris Agreement: an agreement within the United Nations Framework Convention on Climate
Change (UNFCCC), dealing with greenhouse-gas-emissions mitigation, adaptation, and finance,
signed in 2016.
Planetary Boundaries: A quantification of the limits of key earth system processes, beyond which
humanity risks triggering non-linear, abrupt environmental change.
Progressive Tax Structure: a tax in which the average tax rate increases as the taxable amount
increases.
Radical Economic Democracy (RED): An evolving framework of governance in which each
person and community has access to decision-making forums of relevance to them, and in which
the decisions taken are infused with ecological and cultural sensitivity, and socio-economic equity.
Reciprocity: A social norm that involves in-kind exchanges between people—responding to
another's action with another equivalent action.
Repair Café: A meeting organized by and for local residents in which people repair, and learn to
repair, household electrical and mechanical devices, computers, bicycles, or clothing with the
objectives of reducing waste, maintaining repair skills and strengthening social cohesion.
Reparations: A form of compensatory payment for groups that have been wronged
Right-sizing: A mix of economic growth in the Global South, degrowth in the Global North, and
redistribution of wealth to achieve a desirable outcome
Rival: A property of good for which consumption by one consumer prevents simultaneous
consumption by other consumers, or consumption by one party reduces the ability of another party
to consume it.

Sharing Economy: An economic model defined as a peer-to-peer based activity of acquiring,
providing, or sharing access to goods and services that is often facilitated by a community-based
on-line platform
Socialism: Various economic and political theories advocating collective or governmental
ownership and administration of the means of production and distribution of goods
Social Safety Net: welfare services provided at the state and local levels with the goal of providing
services for, and improving well-being of the recipients.
Solidarity Economy: An alternative to capitalism and other authoritarian, state- dominated
economic systems in which ordinary people play an active role in shaping all of the dimensions of
human life: economic, social, cultural, political, and environmental.
Stationary State: A concept from classical economist John Stuart Mill that after a period of
growth, the economy would reach a stationary state, characterized by constant population and
stocks of capital
Steady State economy: an economy that maintains a constant level of manufactured and natural
capital by limiting resource-using economic activity.
Substitutes: Two or more consumer goods or services that could be used in place of each other.
Sumak Kawsay: The Quechua concept of living in harmony with your community, yourself, and
your environment with a focus on preserving resources and culture for future generations.
Utility: An economic term referring to the satisfaction received from consuming a good or service
Throughput: The combined flows of resource inputs and waste outputs associated with the
economic production system.
Time Banking: A reciprocity-based work trading system in which hours are the currency that
enables a person with one skill set to trade hours of work with someone with another skill set,
without any money changing hands.
Tragedy of the Commons: the tendency for common property resources to be over-exploited
because no one has an incentive to conserve the resource while individual financial incentives
promote expanded exploitation.
Uneconomic growth: growth that unsustainable and harmful to overall wellbeing.
Universal Basic Income: A guarantee of a certain amount of money provided to every citizen
within a governed population on a regular basis without the requirement of passing a test or
fulfilling a work requirement.
World Bank Group: An international financial institution that provides loans and grants to the
governments of poorer countries for the purpose of pursuing capital projects
REFERENCES Alvaredo, F., Chancel, L., Piketty, T., Saez, E., & Zucman, G. (Eds.). (2018). World inequality
report 2018. Belknap Press.
Bétrisey, F., & Mager, C. (2014). Small Farmers in Florida Province, Bolivia: Reciprocity in
Practice. Mountain Research and Development, 34(4), 369-375.
Centre for Bhutan Studies and GNH Research (2016). A Compass Towards a Just and
Harmonious Society: 2015 GNH Survey Report. Thimphu, Bhutan. Available at:
www.grossnationalhappiness.com/wp-content/uploads/2017/01/Final-GNH-Report-jp-
21.3.17-ilovepdf-compressed.pdf
Chacón, D. (2018). An erosion of the culture of the acequias. The New Mexican. March 10th,
2018
Community Wealth.Org (2019). Community Land Trusts (CLTs). Available at
https://community-wealth.org/strategies/panel/clts/index.html
Da Costa, P.N. (2019). “Wealth Inequality is Way Worse Than You Think,” Forbes Media,
2019.
Daly, Herman (1996). Beyond Growth: The Economics of Sustainable Development. Boston,
Beacon Press.
De Brauw, A., Gilligan, D. O., Hoddinott, J., & Roy, S. (2014). The impact of Bolsa Família on
women’s decision-making power. World Development, 59, 487-504.
De Brauw, A., Gilligan, D. O., Hoddinott, J., & Roy, S. (2015). The impact of Bolsa Familia on
schooling. World Development, 70, 303-316.
Democracy at Work Institute (2019). What Is a Worker Cooperative? Available at:
https://institute.coop/what-worker-cooperative
Dhakal, T., Davidson, B., & Farquharson, B. (2018). Factors Affecting Collective Actions in
Farmer-Managed Irrigation Systems of Nepal. Agriculture, 8(6), 77.
Diffenbaugh, N. S., & Burke, M. (2019). Global warming has increased global economic
inequality. Proceedings of the National Academy of Sciences, 116(20), 9808-9813.
Dos Santos, T. (1970). The structure of dependence. American Economic Review, 60(2), 231-
236.
Hall, G. H., & Patrinos, H. A. (Eds.). (2012). Indigenous peoples, poverty, and development.
Cambridge University Press.
Hoffower, H. (2019). We did the math to calculate how much money Jeff Bezos makes in a year,
month, week, day, hour, minute, and second. Business Insider, Jan 9th, 2019
Institute for New Economic Thinking (INET). (2017). Dialogues on Development: Volume 1: On
Dependency. Economic Development Working Group of the Young Scholars Initiative
(YSI) of the Institute for New Economic Thinking (INET).
Institute for Social and Environmental Transition - Nepal (ISET-Nepal). Indigenous and Local
Climate Change Adaptation Practices in Nepal. Mainstreaming Climate Change Risk
Management in Development. Kathmandu, Nepal
Intergovernmental Panel on Climate Change (IPCC). (2018). Special Report: Global Warming of
1.5°C. Intergovernmental Panel on Climate Change. Available at
https://www.ipcc.ch/sr15/
Kahneman, D., & Deaton, A. (2010). High income improves evaluation of life but not emotional
well-being. Proceedings of the national academy of sciences, 107(38), 16489-16493.
Kaza, S., Yao, L., Bhada-Tata, P., & Van Woerden, F. (2018). What a waste 2.0: a global
snapshot of solid waste management to 2050. World Bank Publications.
Kothari, A., Demaria, F., & Acosta, A. (2015). Buen Vivir, degrowth and ecological Swaraj:
Alternatives to sustainable development and the green economy. Development, 57(3-4),
362-375.
Kothari, A. (2018). “Eco-Swaraj vs. EcoCatastrophe.” Asia Pacific Perspectives, Vol. 15, no. 2,
49-5
La Via Campesina (2018). Nicaraguan women’s cooperative building self-sufficiency and food
sovereignty. Avaialable at https://viacampesina.org/en/nicaraguan-womens-cooperative-
building-self-sufficiency-and-food-sovereignty/
La Via Campesina (2019). The International Peasants Voice. Available at
https://viacampesina.org/en/international-peasants-voice/
M4BL (2019). Movement for Black Lives Reparations Now Toolkit. Available at
https://policy.m4bl.org/wp-content/uploads/2019/07/Reparations-Now-Toolkit-
FINAL.pdf
Marti, N., & Pimbert, M. P. (2006). Barter Markets: Sustaining people and nature in the Andes.
International Institute for Environment and Development (IIED).
Martinez-Alier, J. (2002). “The Environmentalism of the Poor.” Paper prepared for the
conference on The Political Economy of Sustainable Development: Environmental
Conflict, Participation and Movements. 30 August 2002, University of Witwatersrand,
Johannesburg.
Mikati, Ihab, Adam F. Benson, Thomas J. Luben, Jason D. Sacks, and Jennifer Richmond-
Bryant (2018). Disparities in Distribution of Particulate Matter Emission Sources by Race
and Poverty Status American Journal of Public Health 108, 480-485.
Moser, S., Lannen, A., Kleinhückelkotten, S., Neitzke, H., & Bilharz, M. (2016). Good
intentions, big footprints: Facing household energy use in rich countries.
National Sustainable Agriculture Commission (NSAC). (2016). Stories from the Field: New
Mexico Acequia Association. March 24th, 2016. Available at
http://sustainableagriculture.net/blog/stories-from-the-field-new-mexico-acequia-
association/
New Economics Foundation (NEF). (2010), 21 Hours: The Case for a Shorter Working Week.
Available at https://neweconomics.org/2010/02/21-hours
Niño‐Zarazúa, M., Roope, L., & Tarp, F. (2017). Global inequality: Relatively lower, absolutely
higher. Review of Income and Wealth, 63(4), 661-684.
Nussbaum, M. C. (2000). Women and Human Development: The Capabilities Approach.
Cambridge, U.K.: Cambridge University Press.
NYC Consumer Affairs (2018) Lifting up Paid Care Work: YEAR ONE of New York City’s
Paid Care Division. March 2018. New York City Department of Consumer Affairs.
O'Neill, D. W. (2012). “Measuring progress in the degrowth transition to a steady state
economy,” Ecological Economics, 84, 221-231.
Our Time Bank: Building Community in Our Corner of Los Angeles (ND). Website:
http://ourtimebank.communityforge.net/home
Oxfam (2019). Even it Up: Time to End Extreme Inequality. Available at https://www-
cdn.oxfam.org/s3fs-public/file_attachments/cr-even-it-up-extreme-inequality-291014-
en.pdf
Pachamama Alliance (2019). Sumak Kawsay: Ancient Teachings of Indigenous Peoples.
Available at https://www.pachamama.org/sumak-kawsay
Pérotin, V. (2017). Worker Co-operatives. In The Oxford Handbook of Mutual, Co-Operative,
and Co-Owned Business.
Ripple et al. (2019). “World Scientists’ Warning of a Climate Emergency,” BioScience,
November 5.
Roser, M. (2019). "Economic Growth". Published online at OurWorldInData.org. Retrieved
from: 'https://ourworldindata.org/economic-growth'
Schneider, François, Giorgos Kallis, and Joan Martinez-Alier. "Crisis or opportunity? Economic
degrowth for social equity and ecological sustainability. Introduction to this special
issue." Journal of cleaner production 18, no. 6 (2010): 511-518.
Sen, A. (1997). Development thinking at the beginning of the 21st century. Conference on
Development Thinking Practice of the Inter-American Bank. Washington, D.C.
Sen, A. (2000). Development as Freedom. New York, NY: Anchor Books.
Shei, A., Costa, F., Reis, M. G., & Ko, A. I. (2014). The impact of Brazil’s Bolsa Família
conditional cash transfer program on children’s health care utilization and health
outcomes. BMC international health and human rights, 14(1), 10.
Skoufias, E., Nakamura, S., & Gukovas, R. (2017). Safeguarding against a reversal in social
gains during the economic crisis in Brazil.
Steffen, W., Richardson, K., Rockström, J., Cornell, S. E., Fetzer, I., Bennett, E. M., ... & Folke,
C. (2015). Planetary boundaries: Guiding human development on a changing
planet. Science, 347(6223), 1259855.
Toth, I.G. (2013). Gini Policy Paper 3: Time series and cross country variation of income
inequalities in Europe on the medium run: are inequality structures converging in the past
three decades? Gini Growing Inequalities Impact. Available at: http://www.gini-
research.org/system/uploads/566/original/GINI_Policy_Paper_3.pdf?1384954508
United Nations Environment Program (UNEP). (2011). Towards a Green Economy: Pathways
to Sustainable Development and Poverty Eradication. www.unep.org/greeneconomy.
United Nations (2015). The Millennium Development Goals Report 2015.
https://www.un.org/millenniumgoals/2015_MDG_Report/pdf/MDG%202015%20rev%20(July%
201).pdf
United Nations (2018). The Sustainable Development Goals Report 2018.
Ura, Karma, Sabina Alkire (2012). and Tshoki Zangmo, GNH and GNH Index, Centre for
Bhutan Studies.
Via Campesina (2018). Nicaraguan women’s cooperative building self-sufficiency and food
sovereignty. August 26th, 2018. Available at https://viacampesina.org/en/nicaraguan-
womens-cooperative-building-self-sufficiency-and-food-sovereignty/.
Victor, P., Jackson, T. (2016) Towards a New Green Economy. The Next Systems Project.
November 3rd, 2016. Available at https://thenextsystem.org/towards-a-new-green-
economy#1-introduction
WCBDI (2015). Working Together: A Report on the First Year of the Worker Cooperative
Business Development Initiative (WCBDI). NYC Small Business Services.
Weisbrot, M., Johnston, J., & Merling, L. (2017). Decade of reform: Ecuador’s macroeconomic
policies, institutional changes, and results. Center for Economic and Policy Research, 1-
21.
World Inequality Report, 2018, Executive Summary,
https://www.ecplanet.org/sites/ecplanet.com/files/wir2018-summary-english.pdf
Zencey. E. (2018). The 2018. The Vermont Genuine Progress Indicator Project March 2018
Genuine Progress Indicator Report. Produced by the Vermont Genuine Progress Indicator
Project University of Vermont March, 2018
Zhaohua, W., Bin, Z., & Dabo, G. (2016). Take Responsibility for Electronic-Waste Disposal.
https://www.nature.com/news/take-responsibility-for-electronic-waste-disposal-
1.20345#/ref-link-13