alternatives memorandum minus attach b&c · • enhance connectivity between sections of ......
TRANSCRIPT

PARSONS 100 M Street SE, Suite 1200, Washington, DC 20003 • (202) 775-3300 • Fax: (202) 775-6087 • www.parsons.com
MEMORANDUM DATE: March 16, 2009
TO: Nicholas Nies Environmental Division Virginia Department of Transportation 1401 East Broad Street Richmond, VA 23219
FROM: Stuart Tyler, Project Manager
SUBJECT: Bridgewater Bypass Location Study State Project No. 0257-176-101, PE-101; UPC 17541 Rockingham County and Town of Bridgewater
ALTERNATIVES DEVELOPMENT AND ANALYSIS
cc: File 646792.5.4; 646792.6.5 1. INTRODUCTION This memorandum describes the range of alternatives evaluated for the study and the process used to identify and screen the alternatives for the proposed Bridgewater Bypass. It also provides a comparative review of the alternatives carried forward for detailed study, including environmental consequences, traffic considerations, and public input. Figure 1 shows the project location and study area. Preliminary candidate build alternatives were identified to be carried forward for refinement and detailed evaluation. The no-build alternative was retained for study consistent with National Environmental Policy Act regulations and to serve as a baseline for alternatives comparison. A wide range of other alternatives was considered initially, based on the identified purpose and need, suggestions received from study team members during the kick-off meeting, suggestions received at a meeting with Town of Bridgewater and Rockingham County representatives, previous work conducted by VDOT on the project, the Harrisonburg-Rockingham Metropolitan Planning Organization’s long-range transportation plan, traffic and engineering considerations, and the conditions and constraints of the study area. A screening process was used to identify the alternatives to consider in detail. 2. ALTERNATIVES DEVELOPMENT AND SCREENING 2.1 Traffic Considerations/Purpose and Need Project purpose: The purpose of the Bridgewater Bypass is to provide an alternate route for traffic, especially truck traffic, so that it doesn’t have to pass through downtown Bridgewater. Such a route would: • Enhance connectivity between sections of Route 257 east of Bridgewater and Sections of
Route 257/42 north of Bridgewater, thereby improving mobility. • Divert through traffic from existing Routes 257, 42, and 1310. • Reduce conflicts between vehicular, pedestrian, and bicycle travel on Dinkel Avenue, North
Main Street, and Mount Crawford Avenue and reduce conflicts with turning movements.
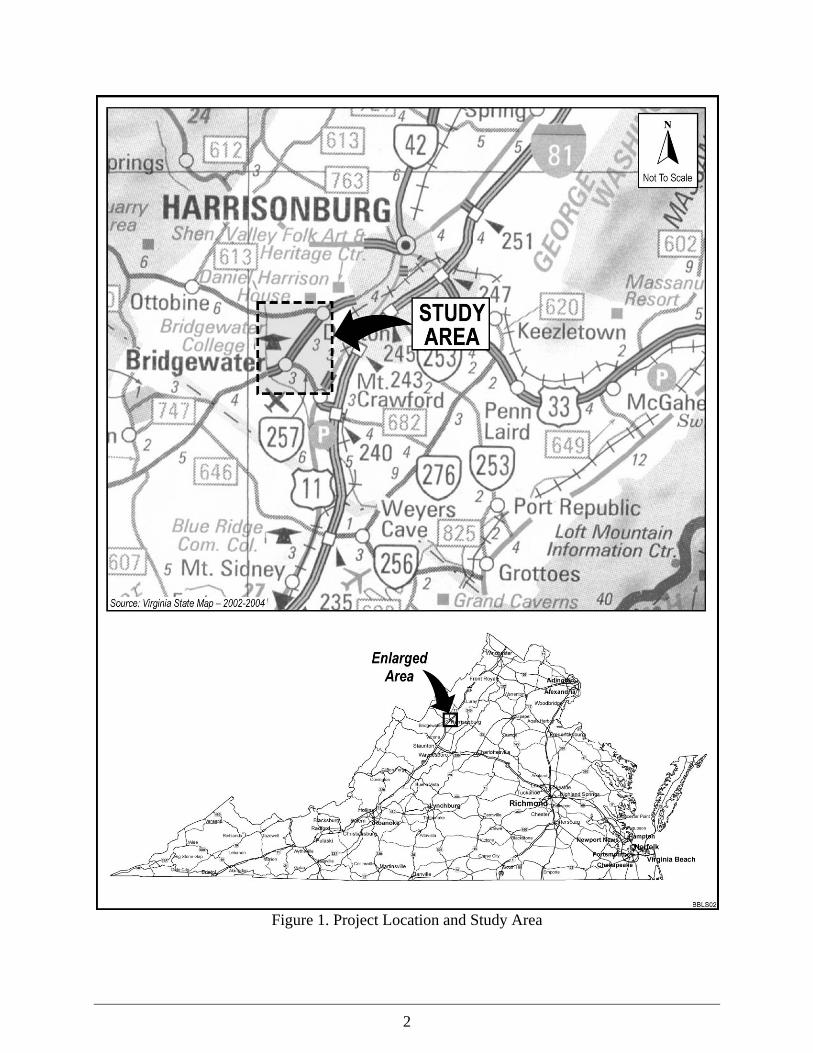
Figure 1. Project Location and Study Area
2

3
Existing conditions: Bridgewater, with a population of approximately 5,400, sits astride two Virginia primary highways: Route 42, the main route between Bridgewater and the City of Harrisonburg; and Route 257, which connects Bridgewater with U.S. Route 11 and with I-81 (at exit 240). Within Bridgewater, Routes 257 and 42 are lined on both sides with homes, businesses, industry, and institutional land uses. Bridgewater College, with an enrollment of approximately 1,500 students, straddles Route 257 and generates substantial pedestrian travel across the road at five crosswalks. Routes 257 and 42 through Bridgewater are characterized by low travel speeds (posted speeds are 30 to 35 mph), inadequate geometry (pavement is narrow along some sections, e.g., 11-foot-wide lanes instead of 12-foot standard), and substantial interference to traffic flows caused by a large number of private entrances and intersecting streets (average of 50 access points per mile, includes intersecting streets, residential driveways, and commercial and institutional entrances along Dinkel Avenue between Mount Crawford Avenue and North Main Street; along North Main Street between Dinkel Avenue and Turner Ashby High School; and along Mount Crawford Avenue between Dinkel Avenue and North Main Street). Although no accident data are available for this study, research indicates that large numbers of driveways increase the potential conflicts and resulting crashes on highways and also increase congestion. It is impossible to maintain free flow speeds when numerous access points cause slow moving vehicles. The low speeds and congestion hamper mobility for traffic traveling from points east of Bridgewater to points north of Bridgewater. Future conditions: Rockingham County’s comprehensive plan designates most of the area east and north of Bridgewater for future development. With both population and employment in the Bridgewater area expected to more than double by the year 2030, traffic volumes also are expected to grow. Detailed traffic forecasts and analyses were conducted. 2.2 Engineering Considerations Engineering considerations include the physical features and terrain of the study area that would affect the ability to construct an alternative, as well as design criteria that govern the geometric configurations of potential roadway elements.
Physical Features: Physical features include the configuration of existing roadways with which potential alternatives could connect (i.e., horizontal and vertical alignments of Routes 257, 11, 704, 42, and other streets). Constructibility involves physical space limitations and requirements for maintaining traffic flow during construction, primarily on Routes 257, 704, and 42.
Utilities: Utilities include power lines, water lines, and sewer lines that would have to be relocated if disrupted by a proposed alternative. Such relocations increase construction costs and can result in temporary service outages that might inconvenience consumers. Utilities in the project area include high-voltage power lines strung on large metal towers. Terrain: Terrain refers to the existing hills and valleys that would require cut and fill earthwork in order to construct an alternative at acceptable grades and with suitable connections to other roads and driveways.
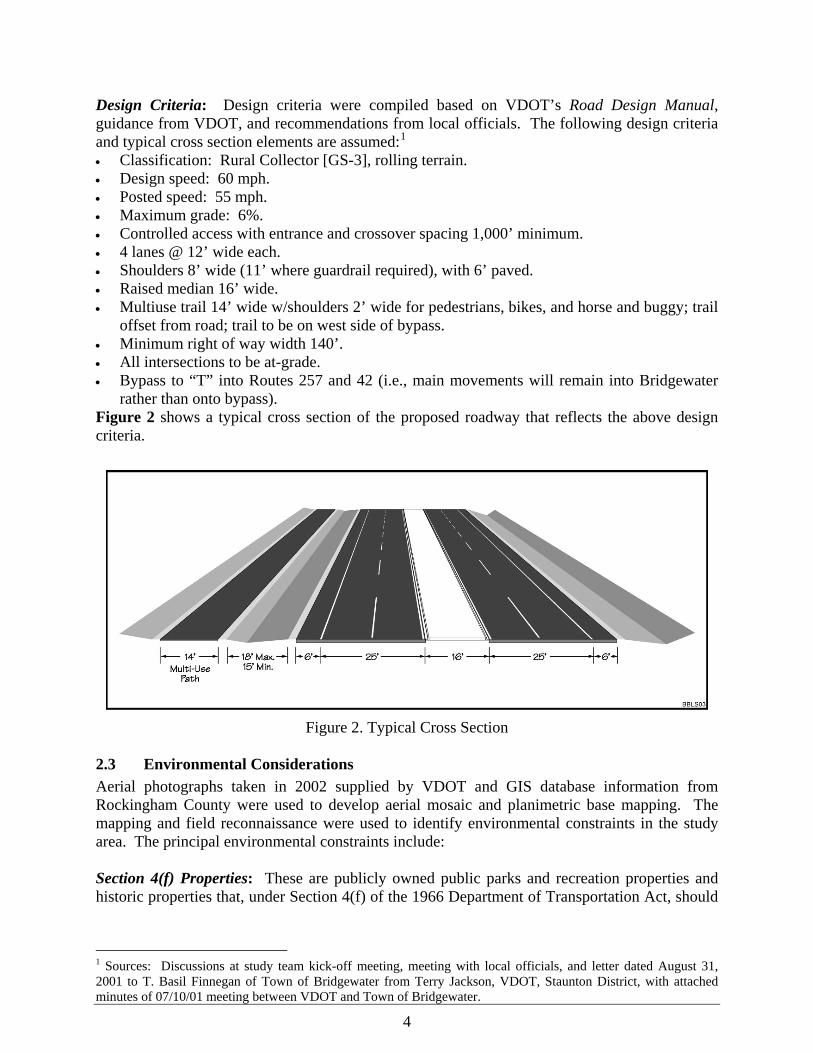
Design Criteria: Design criteria were compiled based on VDOT’s Road Design Manual, guidance from VDOT, and recommendations from local officials. The following design criteria and typical cross section elements are assumed:1
• Classification: Rural Collector [GS-3], rolling terrain. • Design speed: 60 mph. • Posted speed: 55 mph. • Maximum grade: 6%. • Controlled access with entrance and crossover spacing 1,000’ minimum. • 4 lanes @ 12’ wide each. • Shoulders 8’ wide (11’ where guardrail required), with 6’ paved. • Raised median 16’ wide. • Multiuse trail 14’ wide w/shoulders 2’ wide for pedestrians, bikes, and horse and buggy; trail
offset from road; trail to be on west side of bypass. • Minimum right of way width 140’. • All intersections to be at-grade. • Bypass to “T” into Routes 257 and 42 (i.e., main movements will remain into Bridgewater
rather than onto bypass). Figure 2 shows a typical cross section of the proposed roadway that reflects the above design criteria.
Figure 2. Typical Cross Section
2.3 Environmental Considerations Aerial photographs taken in 2002 supplied by VDOT and GIS database information from Rockingham County were used to develop aerial mosaic and planimetric base mapping. The mapping and field reconnaissance were used to identify environmental constraints in the study area. The principal environmental constraints include: Section 4(f) Properties: These are publicly owned public parks and recreation properties and historic properties that, under Section 4(f) of the 1966 Department of Transportation Act, should
1 Sources: Discussions at study team kick-off meeting, meeting with local officials, and letter dated August 31, 2001 to T. Basil Finnegan of Town of Bridgewater from Terry Jackson, VDOT, Staunton District, with attached minutes of 07/10/01 meeting between VDOT and Town of Bridgewater.
4

5
be avoided unless there is no feasible and prudent alternative. Such properties located in the study area include: • Cooks Creek Arboretum. • Recreational facilities at Turner Ashby High School. • Miller House historic property (VDHR #082-0316). • Sundial Dairy historic property (VDHR #082-5120). Agricultural and Forestal Districts: Under the Virginia Agricultural and Forestal Districts Act (Section 15.2-4300 of the Code of Virginia), land owners may apply for and local governments may approve designations of Districts to protect and encourage the development and improvement of the Commonwealth’s agricultural and forestal lands for the production of food and other products and to protect these lands as valued natural and ecological resources. Districts are not established in perpetuity but may be renewed periodically. The acquisition of land from an Agricultural and Forestal District by a state agency, such as VDOT, requires adherence to procedures outlined in the Code. There are two agricultural/forestal districts that have parcels within or adjacent to the study area: • Oak Grove Agricultural and Forestal District: approximately 1,381 acres lying between U.S.
Route 11 and Route 42 and north of Route 704. • Dry Fork Agricultural and Forestal District: approximately 6,828 acres lying west of Route
42. Farmland: Presently, much of the land within the study area remains in agricultural uses (e.g., production of cattle, poultry, corn, and hay). In addition to the sensitivity some people have to losses of farmland due to perceived picturesque qualities, farms also are businesses, the displacements of which represent economic impacts as well. Commercial/Industrial Properties: A number of businesses lie in and around the study area. Homes: Within and near the Town of Bridgewater are a number of residential subdivisions. Community Facilities: Rescue Squad on Don Litten Parkway. Water Resources, Floodplains, and Wetlands: Cooks Creek and wetlands and floodplains along the banks of the Creek. Impacts to these resources require compliance with various federal and state permitting procedures and federal executive orders. 2.4 Preliminary Alternatives Using aerial photo-base mapping and the factors described above, a number of preliminary possible alternatives were identified, as shown in Figure 3. 3. ALTERNATIVES ELIMINATED FROM DETAILED STUDY Through the alternatives screening, several concepts and alternatives were eliminated from further consideration and were not carried forward in the environmental process for detailed study. Table 1 lists the eliminated alternatives and reasons for their elimination.
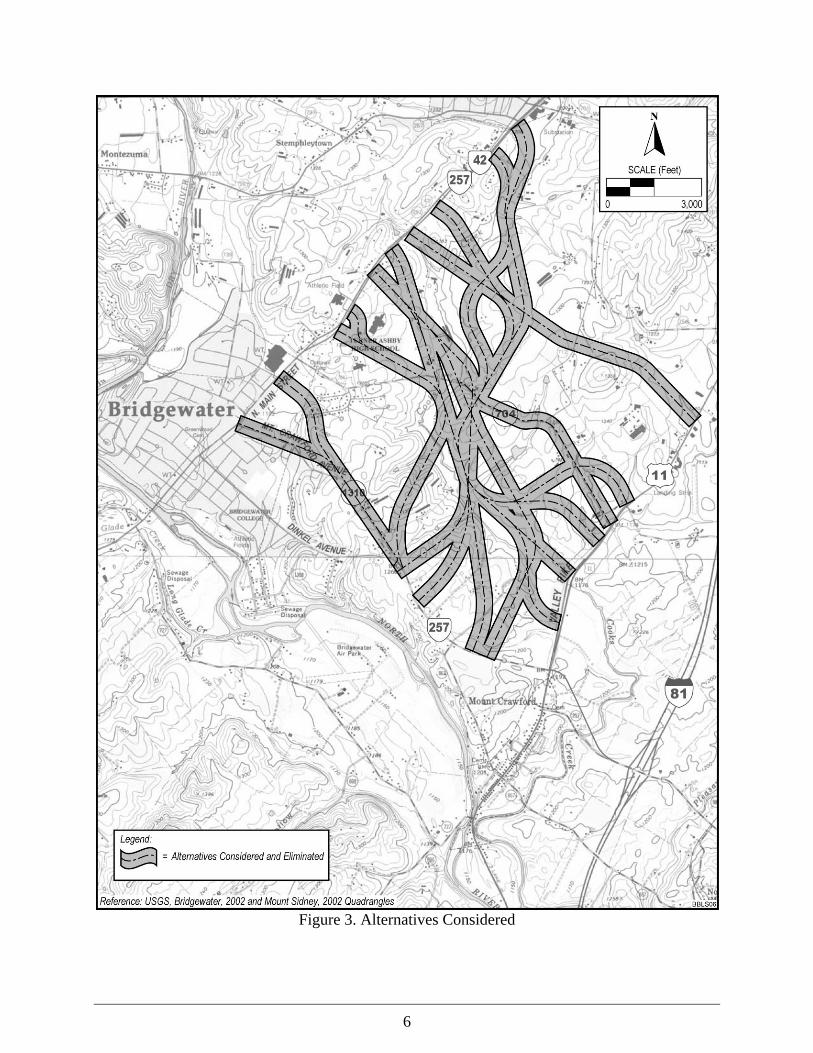
Figure 3. Alternatives Considered
6
7
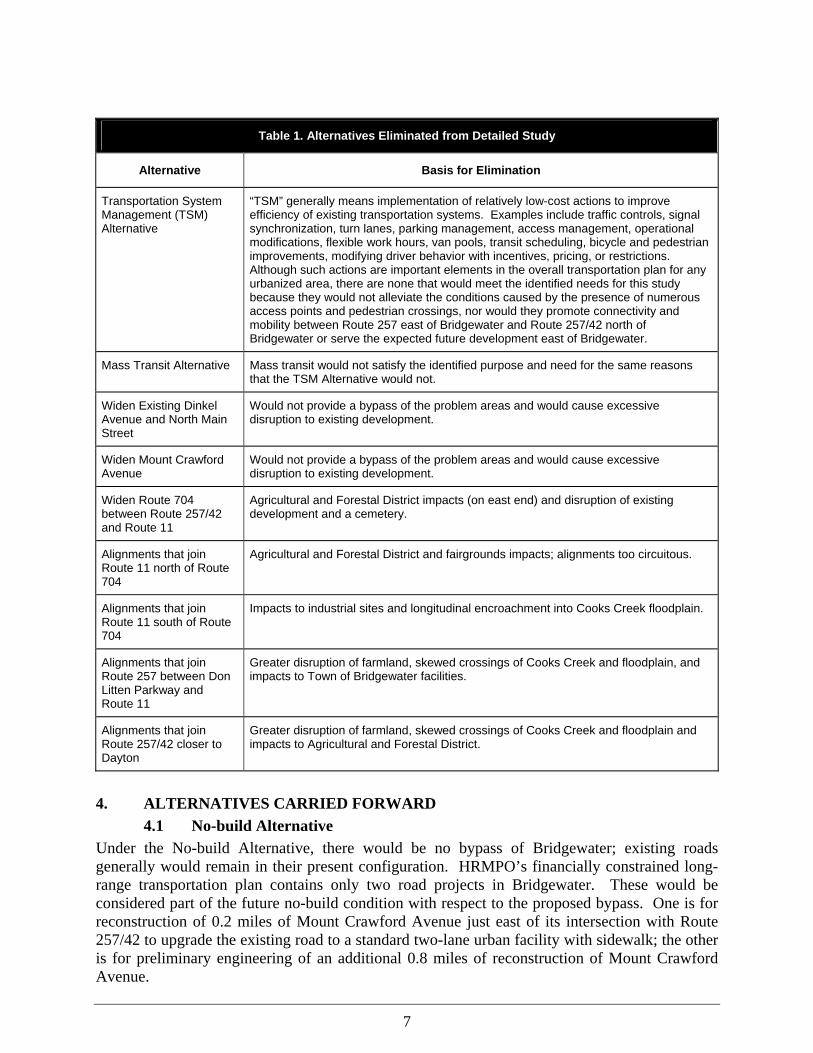
Table 1. Alternatives Eliminated from Detailed Study
Alternative Basis for Elimination
Transportation System Management (TSM) Alternative
“TSM” generally means implementation of relatively low-cost actions to improve efficiency of existing transportation systems. Examples include traffic controls, signal synchronization, turn lanes, parking management, access management, operational modifications, flexible work hours, van pools, transit scheduling, bicycle and pedestrian improvements, modifying driver behavior with incentives, pricing, or restrictions. Although such actions are important elements in the overall transportation plan for any urbanized area, there are none that would meet the identified needs for this study because they would not alleviate the conditions caused by the presence of numerous access points and pedestrian crossings, nor would they promote connectivity and mobility between Route 257 east of Bridgewater and Route 257/42 north of Bridgewater or serve the expected future development east of Bridgewater.
Mass Transit Alternative Mass transit would not satisfy the identified purpose and need for the same reasons that the TSM Alternative would not.
Widen Existing Dinkel Avenue and North Main Street
Would not provide a bypass of the problem areas and would cause excessive disruption to existing development.
Widen Mount Crawford Avenue
Would not provide a bypass of the problem areas and would cause excessive disruption to existing development.
Widen Route 704 between Route 257/42 and Route 11
Agricultural and Forestal District impacts (on east end) and disruption of existing development and a cemetery.
Alignments that join Route 11 north of Route 704
Agricultural and Forestal District and fairgrounds impacts; alignments too circuitous.
Alignments that join Route 11 south of Route 704
Impacts to industrial sites and longitudinal encroachment into Cooks Creek floodplain.
Alignments that join Route 257 between Don Litten Parkway and Route 11
Greater disruption of farmland, skewed crossings of Cooks Creek and floodplain, and impacts to Town of Bridgewater facilities.
Alignments that join Route 257/42 closer to Dayton
Greater disruption of farmland, skewed crossings of Cooks Creek and floodplain and impacts to Agricultural and Forestal District.
4. ALTERNATIVES CARRIED FORWARD 4.1 No-build Alternative Under the No-build Alternative, there would be no bypass of Bridgewater; existing roads generally would remain in their present configuration. HRMPO’s financially constrained long-range transportation plan contains only two road projects in Bridgewater. These would be considered part of the future no-build condition with respect to the proposed bypass. One is for reconstruction of 0.2 miles of Mount Crawford Avenue just east of its intersection with Route 257/42 to upgrade the existing road to a standard two-lane urban facility with sidewalk; the other is for preliminary engineering of an additional 0.8 miles of reconstruction of Mount Crawford Avenue.

8
4.2 Candidate Build Alternative A (CBA A) Description: CBA A, as shown on Figure 4, begins at the intersection of Route 257 and Don Litten Parkway, follows the alignment of Don Litten Parkway, and then proceeds in a northeasterly direction to cross Cooks Creek perpendicularly, then turns northwestward, crossing Cooks Creek again and Route 704, skirting the edge of the Turner Ashby High School complex, and joining Route 257/42 in the vicinity of Herring Lane. The typical section would be as shown on Figure 2. For environmental analysis purposes, the study corridor is 500 feet wide. The actual width of the required right of way would be determined during final design, should this alternative be selected. The length of the corridor is approximately 2.3 miles and the total area within the 500-foot-wide corridor is approximately 153 acres. Access to the new road would be controlled; that is, access would be permitted only at intersecting roadways and at property entrances to be determined during final design. At-grade intersections would be constructed at Route 257, Route 704, and Route 257/42. Other major design features would include bridges over Cooks Creek and improvements to Route 704 at the project crossing. This alternative was retained for detailed study because it would meet the identified needs, partially follows an existing established roadway (Don Litten Parkway), provides the desired “T” intersections with Routes 257 and 257/42, generally follows favorable terrain, crosses Cooks Creek at advantageous points, avoids impacts to agricultural and forestal districts, avoids use of lands from public parks, and attempts to minimize impacts to farmland by hugging property lines where possible.
Cost: The total estimated preliminary engineering and construction cost of CBA A is $40.8 million (year 2015 advertisement assumed for construction estimate). The estimated right of way and relocation cost is $20.3 million (year 2015). 4.3 Candidate Build Alternative B (CBA B) Description: CBA B, as shown on Figure 4, begins like CBA A at the intersection of Route 257 and Don Litten Parkway, follows the alignment of Don Litten Parkway, and then proceeds in a northeasterly direction to cross Cooks Creek perpendicularly, then turns northwestward. It crosses Route 704 east of Cooks Creek, continues northward, and then turns northwest to again cross Cooks Creek before joining Route 257/42 at a point not quite midway between Herring Lane and the Town of Dayton. The typical section would be as shown on Figure 2. For environmental analysis purposes, the study corridor is 500 feet wide. The actual width of the required right of way would be determined during final design, should this alternative be selected. The length of the CBA B corridor is approximately 2.6 miles and the total area within the 500-foot-wide corridor is approximately 172 acres. Access to the new road would be controlled; that is, access would be permitted only at intersecting roadways and at property entrances to be determined during final design. At-grade intersections would be constructed at Route 257, Route 704, and Route 257/42. Other major design features would include bridges over Cooks Creek and improvements to Route 704 at the project crossing. This alternative was retained for detailed study because it would meet the identified needs, partially follows an existing established roadway (Don Litten Parkway), provides the desired “T” intersections with Routes 257 and 257/42, generally follows favorable terrain, crosses Cooks Creek at advantageous points, provides a favorable crossing of Route 704, avoids impacts to agricultural and forestal districts, and avoids use of lands from public parks.

Figure 4. CBA A and CBA B
9

10
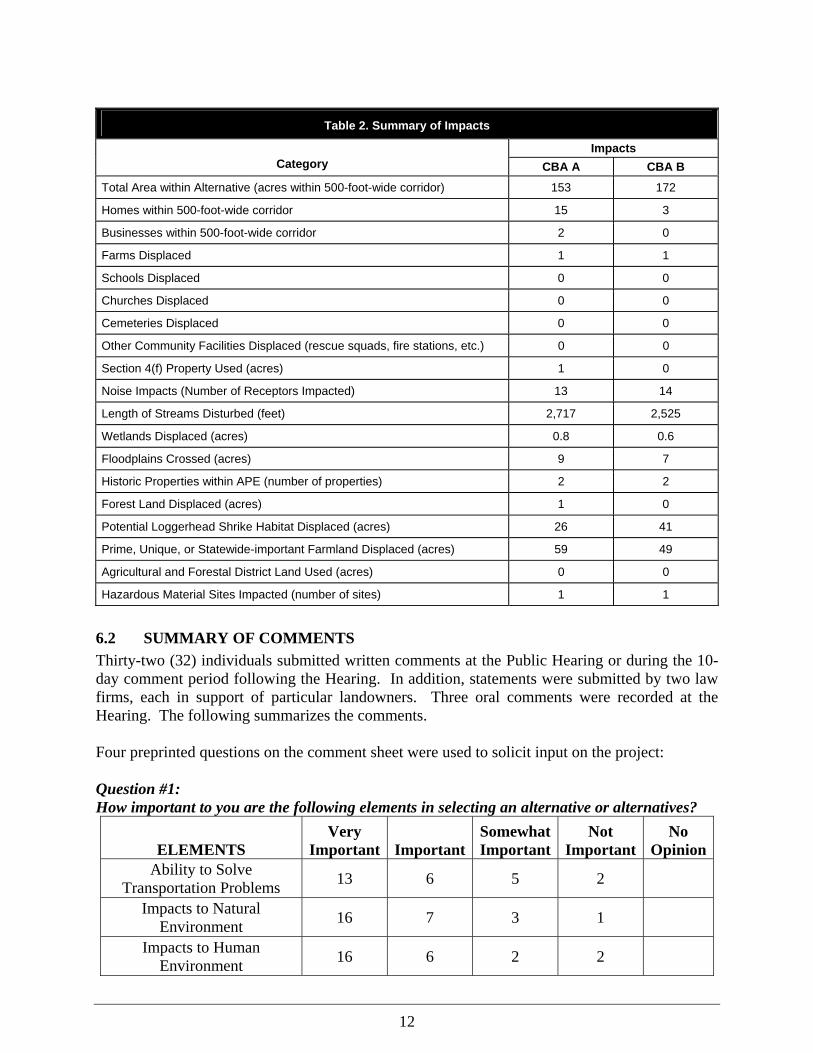
Cost: The total estimated preliminary engineering and construction cost of CBA B is $44.4 million (year 2015 assumed for construction advertisement). The estimated right of way and relocation cost is $12.2 million (year 2015). 4.4 Ability of Candidate Build Alternatives to Meet Needs Either of the Candidate Build Alternatives would generally meet the identified transportation needs. CBA A is projected to carry approximately 6,200 to 7,300 vehicles per day in the year 2030 and CBA B is projected to carry approximately 5,500 to 8,300 vehicles per day in the year 2030. Either alternative would allow traffic to travel at a posted speed of 55 mph and with limited interference from traffic turning onto or out of intersecting roads and driveways and from pedestrians crossing the roadway. Traffic traveling on either alternative would avoid the slower-speed conditions through downtown Bridgewater. Trucks traveling on either alternative would avoid the constrained turning conditions at the existing intersections in downtown Bridgewater. By providing for higher travel speeds and less interference, either alternative would improve mobility between Route 257 east of Bridgewater and Route 257/42 north of Bridgewater. Attachments A and B provide additional analysis of traffic issues, particularly those raised by citizens at the public hearing. 5. ENVIRONMENTAL CONSEQUENCES Figure 5 shows the environmental features of the study area. The No-build Alternative would not displace any families, businesses, farms, or nonprofit organizations, and would not affect any natural, ecological, cultural, or scenic resources. However, this alternative would not satisfy the identified transportation needs. Notwithstanding, the No-build Alternative was carried forward and also used as a benchmark to assess environmental impacts attributable to the proposed project. Table 2 quantifies the impacts of CBA A and CBA B. 6. PUBLIC INPUT 6.1 Description of Hearing A Location Public Hearing was held on January 16, 2008 from 4:00 p.m. to 7:00 p.m. at Turner Ashby High School located at 800 North Main Street in the Town of Bridgewater. The purpose of the hearing was to provide citizens an opportunity to informally review and discuss with Virginia Department of Transportation (VDOT) and Federal Highway Administration (FHWA) representatives the results of the location study for the proposed Bridgewater Bypass. Two Candidate Build Alternatives have been evaluated in detail, along with the No-build Alternative. Maps, drawings, the Environmental Assessment, and other reports and data pertaining to the study were available for review at the hearing. In compliance with Section 106 of the National Historic Preservation Act and 36 CFR Part 800, information concerning the potential effects on properties listed in or eligible for listing in the National Register of Historic Places was available at the hearing.

Figure 5. Environmental Features of Study Area
11
12
Table 2. Summary of Impacts
Impacts Category CBA A CBA B
Total Area within Alternative (acres within 500-foot-wide corridor) 153 172
Homes within 500-foot-wide corridor 15 3
Businesses within 500-foot-wide corridor 2 0
Farms Displaced 1 1
Schools Displaced 0 0
Churches Displaced 0 0
Cemeteries Displaced 0 0
Other Community Facilities Displaced (rescue squads, fire stations, etc.) 0 0
Section 4(f) Property Used (acres) 1 0
Noise Impacts (Number of Receptors Impacted) 13 14
Length of Streams Disturbed (feet) 2,717 2,525
Wetlands Displaced (acres) 0.8 0.6
Floodplains Crossed (acres) 9 7
Historic Properties within APE (number of properties) 2 2
Forest Land Displaced (acres) 1 0
Potential Loggerhead Shrike Habitat Displaced (acres) 26 41
Prime, Unique, or Statewide-important Farmland Displaced (acres) 59 49
Agricultural and Forestal District Land Used (acres) 0 0
Hazardous Material Sites Impacted (number of sites) 1 1
6.2 SUMMARY OF COMMENTS Thirty-two (32) individuals submitted written comments at the Public Hearing or during the 10-day comment period following the Hearing. In addition, statements were submitted by two law firms, each in support of particular landowners. Three oral comments were recorded at the Hearing. The following summarizes the comments. Four preprinted questions on the comment sheet were used to solicit input on the project: Question #1: How important to you are the following elements in selecting an alternative or alternatives?
ELEMENTS Very
Important ImportantSomewhatImportant
Not Important
No Opinion
Ability to Solve Transportation Problems 13 6 5 2
Impacts to Natural Environment 16 7 3 1
Impacts to Human Environment 16 6 2 2

13
Cost 10 11 3 1
Other 2
Also considered as very important were: • Input from the public. • Consideration of impact to the farmers in the project area. • Concern for long term impacts on cultural resources in the area. Question #2: What alternative or alternatives do you think would best meet the transportation needs of the study area, and why?
No Build Alternative 17
Candidate Build Alternative A 8
Candidate Build Alternative B 9
NOTE: The totals in this table include preferences expressed in letters and emails as well as on the comment sheets; they also include second choices and multiple choices when expressed.
Other comments included: • The No Build is the best option. • A bypass would not solve the problem. • The benefits of a bypass are not warranted by the disruption and expense of building it. • Farms and environment would be compromised by a bypass. • Move the two poultry companies and Marshalls to eliminate the need for a bypass. • Neither build alternative addresses traffic traveling Route 42 from south of Bridgewater. • Alternative A should be built as soon as possible. • Alternative A is the least expensive and should be built. • Alternative A would best handle the truck traffic in and out of Bridgewater. • Alternative A would disturb less farmland than B. • Prefers Alternative B to divert traffic from Bridgewater. • Alternative B would have less impact on people and the environment. • Alternative B would avoid congestion at Turner Ashby High School, would avoid chaos at
football games and special events, and would be closer to buggy traffic from Dayton. • The No Build is not an option because of traffic. • Traffic through town is getting worse; a bypass needs to be built. • Dislike Alternative A because of home and business displacements and proximity to Turner
Ashby High School. Question #3: If you wish to propose a different alternative, or modifications to the alternatives presented, please make your recommendation here and provide your reasons for it. • Neither build alternative would solve the traffic problems in the area and would not divert
truck traffic out of the congested areas.

14
• Seven comments were received expressing support for widening Route 704 instead of constructing a bypass.
• Widen Route 704 with bike lanes from Route 11 to the bridge over Cooks Creek; from that point build a connector to Route 42 via Turner Ashby Drive.
• Improvements should be made to the existing roads in the project area. • Widen Oakwood Drive (Route 704) from Bridgeport Drive to Route 11. • The Bypass should continue south and tie into Route 42 south of Bridgewater. • Construct Alternative A from Route 42 to Cooks Creek on Route 704. Construct a new
bridge on Route 704 and then continue new construction on to Route 11. • Widen Mount Crawford Avenue to the curve, and then build a truck route through the woods
to Marshalls. • Widen Main Street and improve the turn geometrics at Dinkel Avenue and Main Street. • Relocate the Quarles gas station and make the truck route one block west of Route 42. • Concern was expressed regarding young drivers to and from Turner Ashby High School. • The multi-use path would be a waste of space and money because: 1) most people don’t
walk on bypasses where traffic is going fast, and, 2) indications from the buggy community are that the path would not be used for buggy travel because it would not take buggy users anywhere near where they desire to travel.
• Can the Town do anything to prohibit 18-wheeler traffic in Bridgewater? Can the traffic pattern be revised to make Main Street one-way?
• Consider a proposal whereby Dinkel Avenue, Mount Crawford Avenue, and Oakwood Drive would all be improved to allow for greater and safer capacity.
• Why was there no origin and destination study performed for the project? • Every effort should be made to not destroy the dairy operations and prime farmlands in the
area. • There was concern that the project does not meet the identified purpose and need established
in the Environmental Assessment. • There was concern for excess noise created by the proposed corridor. • Everything that can be done should be done to preserve farmland by promoting smart
growth. Question #4: How did you hear about tonight’s meeting?
Received Newsletter
Newspaper Advertisement
Web Site Radio/TV
Received Post Card Other
5 20 3 5 1 5
Additional Comments: • A bypass of Bridgewater is long overdue. • There was concern for urban sprawl in the area and its impact on the old order Mennonite
community. • The land owners want to work in partnership with VDOT to come up with the best solution. • Please consider the placement of an underpass under the Bypass to access property divided
by the corridor. This should be of adequate size to accommodate farm equipment and farm animals.
• There is too much politics involved with this project.

15
• Available traffic data does not seem to support the need for a bypass. Further, some of the data appear inconsistent and should be reconsidered.
• It is not clear that the bypass would actually be used by trucks generated by several industries in and around Bridgewater. Rather, it seems likely that many of these trucks would continue to use existing roads, including Dinkel Avenue, Mount Crawford Avenue, Oakwood Drive, and West Mosby Road/Pike Church Road.
• Given the farmland impacts associated with the bypass alternatives, VDOT should try again to obtain input from the Natural Resources Conservation Service.
• The purpose and need is so narrowly defined that the outcome of the Environmental Assessment was preordained; the purpose and need should be revised to address specific transportation concerns rather than just stating the desired outcome of the study - a bypass.
• There was concern regarding the linkage between the proposed bypass and commercial development outlined in the Town of Bridgewater’s Comprehensive Plan.
• Request was made to amend the Environmental Assessment to more fully discuss alternatives that were considered but eliminated, particularly with regard to alignments that would follow existing Route 704 (Oakwood Drive).
• Sound walls would be terribly inappropriate for this project given the rural character of the surrounding area.
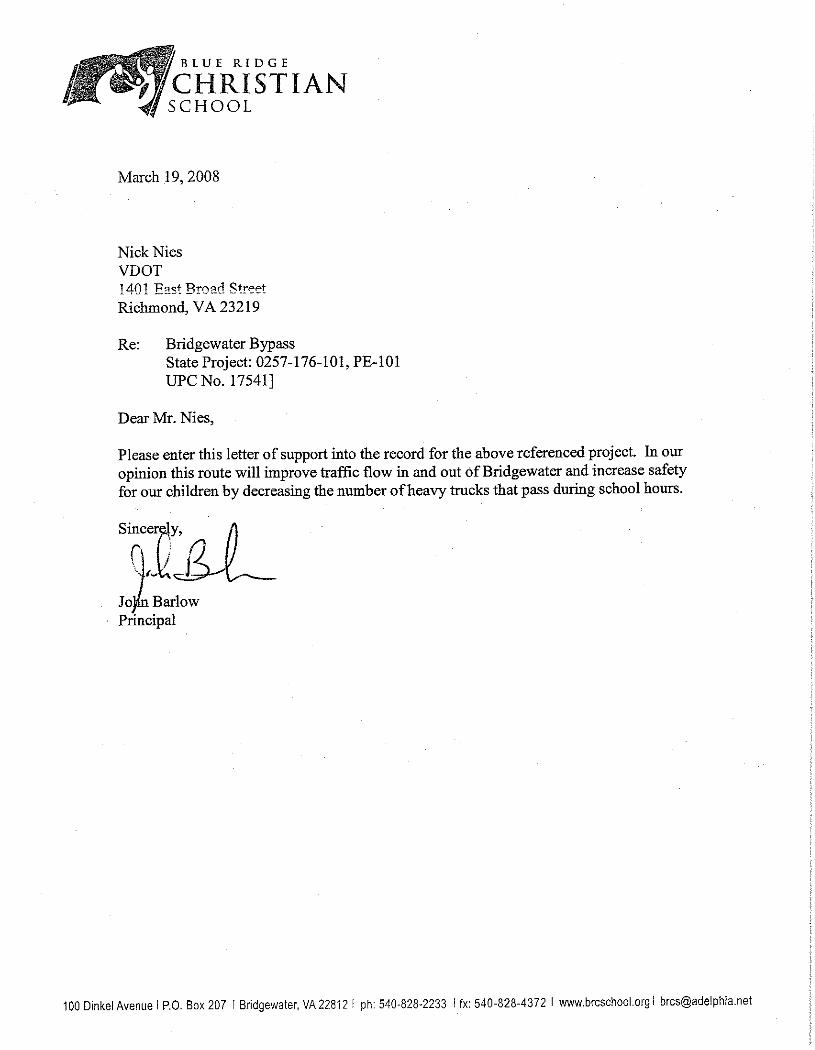
• Impacts to farmland should be more fully discussed in the Environmental Assessment. 6.3 OTHER COORDINATION On February 12, 2008, the Town Council of Bridgewater passed a resolution requesting that VDOT select CBA A for implementation. Additional letters of support were received from several major employers in the area. See Attachment C.

1
ATTACHMENT A
Discussion Paper: Forecast Volumes on North Main Street and Dinkel Avenue
April 29, 2008 Bridgewater Bypass Environmental Assessment
State Project: 0257-176-101, PE-101; UPC 17541 From: Route 257 To: Route 42
Rockingham County and Town of Bridgewater ________________________________________________________________________ Purpose. This paper has been prepared to respond to questions raised at the Harrisonburg-Rockingham Metropolitan Planning Organization (HRMPO) Technical Advisory Committee meeting of March 20, 2008. Meeting participants highlighted traffic forecasts prepared for the Bridgewater Bypass Environmental Assessment (EA) that showed traffic volumes increasing on several sections of Dinkel Avenue and North Main Street if the Bridgewater Bypass were to be constructed. The discussion below describes the modeling process and probable technical reasons that the regional transportation model shows traffic volumes increasing on several roadway segments in the Bridgewater downtown area following construction of either of the Build alternatives. Traffic forecasting model. The traffic forecasts for the Bridgewater Bypass EA were developed using the HRMPO’s computerized regional travel demand model. This model was developed and validated by HRMPO using a comprehensive traffic count database as well as industry-standard techniques. Key parameters in the traffic forecasting process include travel times on various routes (affected by roadway parameters such as speed limits, observed travel time and delay, and level of congestion), locations of traffic generators (where people live, work, and shop), and expected increases in travel as a function of projected development and long-range land use plans (growth in population and employment). Models seek to replicate, to the maximum extent possible, real world travel behaviors, but are also limited by the fact that simplifications are necessary to make them manageable. As further background to the discussions later in this paper:
• As occurs in the real world, traffic on a given segment of roadway is comprised of vehicles coming from and going to a multitude of origins and destinations, some near the study area and others further afield.
• A key assumption in travel demand models is that motorist choices to use particular routes are based to a large extent on the goal of minimizing overall travel time. The effect of this is that models may route trips onto longer paths in order to make use of new faster facilities or facilities that may have some capacity freed up by a new roadway (i.e., the trip distance may be longer but the trip time is shorter).
• Travel demand models replicate the effect of congestion through an iterative process – the result is that trips between a particular origin and destination may take multiple routes based on congestion. While a new roadway may divert some traffic from a congested route, traffic from other routes may fill up the capacity that is opened up by the diverted traffic. This is particularly true when a roadway is projected to operate at over-capacity conditions (i.e., volume to capacity ratio greater than 1.0).
• To allow them to be manageable, regional models simplify all of the entrances onto the roadway system to a limited number of access points with multiple connections to the roadway network. For example, in the Bridgewater area, traffic going to and from the area

2
located east of Main Street and between Dinkel Avenue and Mount Crawford Avenue is modeled with connections on both Dinkel and Mount Crawford. To a small extent, congestion on Dinkel Avenue results in the model shifting traffic going to this area from Dinkel Avenue onto Mount Crawford Avenue. This shift, which is generally minor, has some effect on how traffic is assigned by the computer to the roadway network.
Forecasted traffic volumes. The table below highlights the differences in forecasted traffic volumes on Dinkel Avenue, North Main Street, and Mount Crawford Avenue. Commentary and conclusions with respect to these forecasts are shown in bullet form following the table.
Road Name Location Base Year
No-build Year 2030
With Alt A Year 2030
Change **
With Alt B Year 2030
Change **
Dinkel Ave (257) East of 1st St 8,131 11,287 11,172 -1.0% 11,372 0.8% Dinkel Ave (257) Main St (42) to 1st St 8,131 11,314 10,653 -5.8% 10,237 -9.5% Dinkel Ave (257) Average of two segments above 11,300 10,912 -3.4% 10,805 -4.4% Main St (42) South of Dinkel Ave 10,769 13,334 13,922 4.4% 13,476 1.1%
Main St (42) Dinkel Ave to Mt Crawford Ave 13,365 17,258 17,738 2.8% 17,346 0.5%
North Main St (42) Mt Crawford Ave to N River Rd 17,102 25,603 23,949 -6.5% 23,943 -6.5%
North Main St (42) North of N River Rd 16,950 26,124 25,764 -1.4% 25,329 -3.0%
North Main St (42) South of Oakwood Dr (704) 16,950 27,971 28,796 2.9% 28,038 0.2%
North Main St (42) North of Oakwood Dr (704) 16,950 26,233 25,681 -2.1% 25,676 -2.1%
Mt Crawford Ave West of Dinkel Ave 2,602 7,242 5,433 -25.0% 5,990 -17.3% ** -- Indicates percent change in traffic as compared to the No-build Alternative.
As shown in the table above, the proposed bypass is expected to have a limited net effect on traffic volumes on most sections of Dinkel Avenue and North Main Street. In general, the change in traffic on these roadways is plus or minus five percent; indicative of relatively negligible net change in traffic. It is important to note, however, that the proposed Build Alternatives would divert traffic from these roads; the net change is limited because the regional model shows traffic from other roads taking the place of the diverted traffic. This shift from other roads is occurring because Dinkel Avenue and North Main Street are projected to be near or over capacity and removing traffic from these roads frees up capacity that could be used by traffic currently using other routes to avoid the congestion. The longer routes may also make more use of local and residential routes. As an example, the model shows higher levels of traffic on 1st Street south of Dinkel Avenue under the No-build scenario than for either of the Build scenarios – once some traffic is removed from Dinkel Avenue by the proposed bypass, the traffic using 1st Street shifts back to Dinkel Avenue. Discussion. Identifying the diversion potential of the proposed Build Alternatives (as distinct from the net change in traffic which reflects traffic from other roads filling back in for freed capacity), can be performed in several ways, one of which was used by the study team to respond to several comments received at the public hearing. This analysis, included as an appendix to this discussion paper, included several findings relevant to this discussion:

• A separate diversion analysis using a technique called pivot-point analysis and actual field travel times shows that approximately 10 percent of the traffic going between Routes 11/ 257 and the area around Marshalls would make use of Candidate Build Alternative (CBA) A. Either of the proposed CBAs (A or B) would also provide substantial travel time improvements from Routes 11/257 to Cargill and other Dayton destinations. The estimated 7,000 to 8,000 vehicles per day projected on CBA A or B includes not only traffic diverted from Dinkel Avenue and North Main Street but also from other study area roads that could, potentially, experience benefits in operations and/or safety.
• Not all of the traffic on North Main Street comes from/to Dinkel Avenue and, accordingly, not all traffic would be divertable with either of the CBAs. For peak direction traffic (cars and trucks) on North Main Street, 72 percent comes from the south in the a.m. peak, while 62 percent goes to the south in the p.m. peak. This suggests that the Bridgewater Bypass would provide a potential alternative route for somewhere in the range of 25 to 35 percent of the total traffic on North Main Street just north of Dinkel Avenue.
• Based on car and truck traffic counts at key intersections in the study area, the potential diversion benefits of the Build Alternatives are greater for trucks than for cars. The counts show that over three-quarters of the east-west peak-hour truck traffic in the study area is on Dinkel Avenue. Unlike for car traffic, Mount Crawford Avenue is not really a viable alternative to Dinkel Avenue for trucks, as shown by the very low truck counts on Mount Crawford Avenue.
• Based on travel time analysis for trips between the intersection of Routes 11 and 257 and the area around Perdue and Marshalls, Mount Crawford Avenue is by far the quickest route. For trucks, however, factors other than travel time result in them not using this route. The next quickest route is using Dinkel Avenue and Main Street and the truck counts indicate that this route is used by a high percent of trucks traveling between the two locations. Because Mount Crawford Avenue is not a viable alternative to Dinkel Avenue for trucks, it is anticipated that the attractiveness of either of the proposed Build Alternatives as an alternative route would be higher for trucks than for cars.
• While the changes in overall volumes on Mount Crawford Avenue would be relatively low (1,000 to 1,500 vehicles per day), the reductions represent 17 to 25 percent decreases, which are particularly noteworthy on a roadway with significant geometric deficiencies.
Summary. The differences in traffic forecasts on Dinkel Avenue and Main Street generally represent small net increases or decreases because, due to the over-capacity conditions of North Main Street and Dinkel Avenue, the capacity freed by traffic diversions to the proposed Build Alternatives would be replaced by traffic from other nearby roadways. The regional model predicts some shifts in traffic both locally and at a broader geographic level to take advantage of both the new roadway and the capacity that it would free up on existing roads in downtown Bridgewater. This substitution of traffic does not occur to the same extent on Mount Crawford Avenue, resulting in estimates of substantial net diversions on this roadway.
3

APPENDIX Supplemental Analysis Performed in Response to Public Hearing Comments
Potential Traffic Relief for North Main Street from the Candidate Build Alternatives Among comments received at the January 16, 2008 public hearing, was the suggestion that the majority of traffic on North Main Street in Bridgewater originates and is destined to areas served by South Main Street rather than Dinkel Avenue. Turning movement counts conducted by Parsons Transportation Group at the Main Street/Dinkel Avenue intersection provide data to respond to this comment. Travel patterns as identified from the intersection count data are summarized in Exhibit 1. The data suggest that, overall, more of both the northbound and southbound traffic on North Main Street north of Dinkel Avenue comes from or goes to the south on South Main Street rather than the east on Dinkel Avenue. In the a.m. peak hour, more than 70 percent of the traffic on North Main Street comes from South Main Street, as does about 58 percent of the traffic in the p.m. peak. For southbound traffic, the pattern differs between the a.m. and p.m. peak periods: during the a.m. peak slightly more than half of the traffic goes east on Dinkel Avenue, while in the p.m. peak, more than 60 percent of the southbound traffic goes south on South Main Street. In general, this suggests that the Bridgewater Bypass would provide a potential alternative route for somewhere in the range of 25 to 35 percent of the total traffic on North Main Street just north of Dinkel Avenue.
Exhibit 1 Travel Patterns for Traffic On North Main
Street in Bridgewater Northbound traffic on Main Street (Route 42) North of
Dinkel Avenue (Route 257) AM Peak PM Peak Total traffic 411 372 From south 294 71.5% 214 57.5% From east 95 23.1% 126 33.9% Truck traffic 30 19 From south 14 46.7% 9 47.4% From east 15 50.0% 10 52.6%
Southbound traffic on Main Street (Route 42) North of Dinkel Avenue (Route 257)
AM Peak PM Peak Total traffic 268 512 To south 106 39.6% 316 61.7% To east 140 52.2% 161 31.4% Truck traffic 24 25 To south 11 45.8% 10 40.0% To east 11 45.8% 15 60.0% Note: Percentages may not add to 100 because of the gas station/convenience store located across from Dinkel Avenue on Main Street.
1

An assessment of the turning movement data for truck traffic, however, indicates that there is generally an even split of truck traffic between South Main Street and Dinkel Avenue. The exception to this is the p.m. peak period, where the majority of southbound trucks on Main Street north of Dinkel Avenue go east – about 60 percent of southbound trucks turn left onto eastbound Dinkel Avenue and 40 percent go south onto South Main Street. These data confirm and quantify the observation of those who provided comments at the public hearing that the proposed Bridgewater Bypass would provide a potential diversion for about a third of the traffic on North Main Street in Bridgewater. It is important to note that the diversion estimates developed for the analysis in the Environmental Assessment (EA) do not contradict this finding: the highest potential traffic diversions on the study network from the construction of either Alternative A or B are from Mount Crawford Avenue and not North Main Street or Dinkel Avenue. To reiterate the finding: both the analysis of the intersection turning movements at Main Street and Dinkel Avenue and the analysis performed for the EA indicate that the proposed Bridgewater Bypass would have the potential to divert only a portion of the total traffic demands currently on North Main Street. Travel Times in the Study Area The traffic analysis performed for the EA made use of the Harrisonburg-Rockingham Metropolitan Planning Organization (HRMPO) travel demand model, which was developed and validated based on a number of parameters including an extensive traffic count database, existing and projected regional demographics, and a travel distribution algorithm that incorporated home interview survey data and well-established techniques for estimating trip origins and destinations. In order to respond to comments received at the public hearing in more detail, additional analysis was performed with respect to travel times and delays in the study area. Travel times, speeds, and delays were recorded in the field and a spreadsheet-based methodology was applied to estimate travel times between several key origin and destination points in the study area. The spreadsheet methodology accounted for segment travel times, average intersection delays for individual turning movements, and average delays on Dinkel Avenue due to pedestrian crossings at Bridgewater College. Exhibit 2 summarizes the travel times between Route 257 at Route 11 and three major truck generators in the study area (Perdue, Marshall’s, and Cargill).
Exhibit 2 Travel Times and Estimated Percentages of Traffic Using Various Routes Origin and Destination
Route # Route Description
Travel Time
Percent on Route
11/257 to 1 Dinkel-Main 0:05:56 18.4%
Perdue 2 Dinkel-Mt Crawford-Main 0:04:28 49.5%
3 Dinkel-Alts A/B-Oakwood-Main 0:06:43 10.9%
4 Dinkel-Alt A-Wayland/Main 0:07:22 7.1%
5 Dinkel-Alt B-Wayland/Main 0:08:47 2.7%
6 Valley-Oakwood-Main 0:07:34 6.2%
7 Valley-Oakwood-Alt A-Wayland/Main 0:08:17 3.8%
8 Valley-Oakwood-Alt B-Wayland/Main 0:09:58 1.2%
11/257 to 1 Dinkel-Main 0:06:22 15.0%
Marshalls 2 Dinkel-Mt Crawford-Main 0:04:53 37.0%
2

Exhibit 2 Travel Times and Estimated Percentages of Traffic Using Various Routes Origin and Destination
Route # Route Description
Travel Time
Percent on Route
3 Dinkel-Alts A/B-Oakwood-Main 0:06:18 15.6%
4 Dinkel-Alt A-Wayland/Main 0:06:57 10.5%
5 Dinkel-Alt B-Wayland/Main 0:08:22 4.4%
6 Valley-Oakwood-Main 0:07:08 9.3%
7 Valley-Oakwood-Alt A-Wayland/Main 0:07:52 6.0%
8 Valley-Oakwood-Alt B-Wayland/Main 0:09:33 2.1%
11/257 to 1 Dinkel-Main 0:10:50 2.4%
Cargill 2 Dinkel-Mt Crawford-Main 0:09:21 5.1%
3 Dinkel-Alts A/B-Oakwood-Main/Wayland 0:08:55 6.4%
4 Dinkel-Alt A-Wayland 0:06:34 21.3%
5 Dinkel-Alt B-Wayland 0:05:52 30.6%
6 Valley-Oakwood-Wayland 0:09:46 4.2%
7 Valley-Oakwood-Alt A-Wayland 0:07:30 13.3%
8 Valley-Oakwood-Alt B-Wayland 0:07:02 16.8%
Perdue to 1 Main-Dinkel 0:06:06 17.3%
11/257 2 Main-Mt Crawford-Dinkel 0:04:28 51.8%
3 Main-Oakwood-Alts A/B-Dinkel 0:06:43 11.4%
4 Wayland/Main-Alt A-Dinkel 0:07:27 7.0%
5 Wayland/Main-Alt B-Dinkel 0:08:52 2.7%
6 Main-Oakwood-Valley 0:07:49 5.5%
7 Wayland/Main-Alt A-Oakwood-Valley 0:08:37 3.2%
8 Wayland/Main-Alt B-Oakwood-Valley 0:10:18 1.0%
Marshalls to 1 Main-Dinkel 0:06:32 14.3%
11/257 2 Main-Mt Crawford-Dinkel 0:04:53 39.0%
3 Main-Oakwood-Alts A/B-Dinkel 0:06:18 16.4%
4 Wayland/Main-Alt A-Dinkel 0:07:02 10.5%
5 Wayland/Main-Alt B-Dinkel 0:08:27 4.4%
6 Main-Oakwood-Valley 0:07:23 8.4%
7 Wayland/Main-Alt A-Oakwood-Valley 0:08:12 5.1%
8 Wayland/Main-Alt B-Oakwood-Valley 0:09:53 1.8%
Cargill to 1 Main-Dinkel 0:09:02 7.9%
11/257 2 Main-Mt Crawford-Dinkel 0:08:03 12.5%
3 Main-Oakwood-Alts A/B-Dinkel 0:09:30 6.3%
4 Wayland/Main-Alt A-Dinkel 0:07:09 18.9%
5 Wayland/Main-Alt B-Dinkel 0:06:27 26.3%
6 Main-Oakwood-Valley 0:10:36 3.8%
7 Wayland-Alt A-Oakwood-Valley 0:08:20 10.9%
8 Wayland-Alt B-Oakwood-Valley 0:07:52 13.5%
3

ATTACHMENT B
1
ATTACHMENT B Bridgewater Bypass
Responses to Public Hearing Comments Regarding Traffic Issues March 18, 2008
SUMMARY Major Truck Traffic Generators
• Perdue (11th largest employer in the region, 740 employees). • Marshall’s (10th largest employer in the region, 915 employees). • Cargill (2nd largest employer in the region, 2,000 employees).
Other Truck Traffic Generators
• Bridgewater IGA grocery store. • Farm operations throughout the study area.
Truck Travel Patterns (analysis based on classified intersection turning movement counts)
• There is twice as much truck traffic in the a.m. peak hour than in the p.m. peak. • Two-thirds of regional truck traffic is on north-south roadways (Route 11 and
Route 42). • Over three-quarters of the east-west peak-hour truck traffic in the study area is on
Dinkel Avenue; approximately 19 percent of east-west peak-hour truck traffic in the study area is on Route 704.
• There is very little truck traffic on Mount Crawford Avenue (4 trucks during the a.m. peak hour, 1 truck in the p.m. peak hour).
Source of Traffic on North Main Street
• For peak direction traffic (cars and trucks) on North Main Street, 72 percent comes from the south in the a.m. peak, while 62 percent goes to the south in the p.m. peak.
• This suggests that the Bridgewater Bypass would provide a potential alternative route for somewhere in the range of 25 to 35 percent of the total traffic on North Main Street just north of Dinkel Avenue.
• In the a.m. peak hour, truck traffic is evenly split, with about half of the trucks coming from the south.
• In the p.m. peak hour, more southbound trucks go east on Dinkel Avenue (60 percent) than go south.
Travel Times on Various Routes (analysis discussion below focuses on travel times between the intersection of Routes 11/257 and Perdue/Marshall’s)
• Based on travel times alone, Mount Crawford Avenue is by far the quickest route. For trucks at least, factors other than travel time result in them not using this route.
• The next quickest route is using Dinkel Avenue and Main Street. • Travel time using Oakwood Drive from Route 11 to Route 42 is approximately
10-20 seconds longer (3-5 percent higher) than using the Bridgewater Bypass
1

Alternative A. The percentage of traffic using either of these routes could be expected to be within 3-5 percent of each other.
• Either of the proposed Bridgewater Bypass routes (Alternative A or B) would provide appreciable travel time improvements to Cargill and other Dayton destinations. One-third or more of the traffic from the Routes 11/257 intersection to Dayton would use the proposed bypass. Oakwood Drive is a less attractive route to Dayton than either Alternative A or B (due to lower travel speeds).
Land Use in the Study Area
• Study area is within the regional growth boundary. Planned land uses include residential, commercial, and industrial. Planned agricultural uses are located either north or south of the study area.
• Both population and employment are expected to double in the study area between 2000 and 2030.
• Much of planned growth is along existing roadway corridors. Some is located along the “planning” alignment of the proposed Bridgewater Bypass (this alignment is shown in the Town’s Comprehensive Plan).
Feasibility of Truck Restrictions on Dinkel Avenue east of Route 42
• Truck route alternatives to using Dinkel Avenue are very limited, reducing the feasibility of restricting trucks.
• Improvements to Mount Crawford Avenue and/or additional slowing of traffic on Dinkel Avenue may result in pressures for increased use of Mount Crawford Avenue by trucks.
• Construction of the proposed Bypass from Dinkel Avenue to at least Oakwood Drive, along with some improvements to Oakwood Drive towards to Route 42, would provide a viable route that would make truck restrictions on Dinkel Avenue more feasible.
Trucks on North Main Street
• Based on truck travel patterns, truck restrictions on Dinkel Avenue east of Route 42 may remove up to half of the trucks on North Main Street just north of Dinkel Avenue.
• Truck restrictions on North Main Street would encounter feasibility issues because of limited alternative routes for trucks coming from the south on Route 42.
Reconfiguring Streets in Downtown Bridgewater
• There are two options for instituting a one-way pair system: using North Liberty Street (east of Main Street), or North Grove Street (west of Main Street).
• Both of these options pose issues in terms of passing through residential areas, and both appear to have limited feasibility based on potential costs/impacts versus benefits.
• Connecting the southern end of North Grove Street to Main Street in the vicinity of Dinkel Avenue could result in substantial impacts to commercial and church properties.
2

• Using North Liberty Street would require roadway on new alignment north of Mount Crawford Avenue.
Meeting Project Purpose and Need with Upgraded Route 704
• Upgrades to Route 704 were suggested as a viable option to constructing either of the proposed Bridgewater Bypass alternatives.
• Upgrades to Route 704 would provide competitive travel times (vs. the Bridgewater Bypass alternatives between Routes 11/257 and the major truck traffic generators within the Town of Bridgewater). This, however, represents only a portion of total traffic on Dinkel Avenue; Route 704 would provide small benefits to address items identified at the outset of the study as the need for the project.
• The analysis does show, however, that upgrades to Route 704 would provide a number of benefits, including:
o Much of the planned growth in the study area is expected to take along Routes 11 and 42. There are a limited number of good connecting roads between these two growth corridors, and an upgraded Route 704 could provide this important function.
o In terms of truck traffic between Interstate 81 at Route 257 and the areas around Perdue and Marshall’s, the travel time analysis shows that the Route 704 upgrade would provide a generally comparable travel time to the proposed Bridgewater Bypass Alternative A.
o An upgraded Route 704 could provide a reasonable truck travel alternative to Mount Crawford Avenue which, when it is upgraded, may require some level of truck traffic control to restrict heavier use by trucks.
3

Responses to Public Hearing Comments Regarding Traffic Issues Major Truck Generators There are three major generators of tractor-trailer traffic in and near the study area. The first is Perdue, which is located west of North Main Street (Route 42) several blocks north of Mount Crawford Avenue. Marshall’s is also located west of North Main Street; just south of the Oakwood Drive (Route 704) intersection. The third major area truck traffic generator, physically located in Dayton, is Cargill. Cargill is located on the east side of John Wayland Highway (Route 42). Exhibit 1 shows the locations of these three tractor-trailer traffic generators. There are also a number of smaller truck traffic generators in the study area, including the Bridgewater IGA grocery store (located near Perdue on North Main Street), as well as trucks going to and from various farm operations in the study area.
Exhibit 1 Major Study Area Truck Traffic Generators
4

Existing Truck Travel Patterns The primary truck routes in and through the study area are Dinkel Avenue (Route 257), North Main Street (Route 42), and Valley Pike (Route 11). Exhibit 2 shows truck traffic volumes based on traffic counts performed by Parsons in January and March 2008. Over three-quarters of the east-west peak-hour truck traffic in the study area is on Dinkel Avenue, while 19 percent is on Route 704. Field observation also suggests that an appreciable portion of the truck traffic on Route 704 is trucks going to and from farm operations. Other items of note:
• There is twice as much truck traffic in the a.m. peak hour than in the p.m. peak. • Two-thirds of regional truck traffic is on north-south roadways (Route 11 and
Route 42) • There is very little truck traffic on Mount Crawford Avenue (4 trucks during the
a.m. peak hour, 1 in the p.m. peak hour)
Exhibit 2 2008 AM/PM Peak Hour Truck Volumes in the Study Area
5

North Main Street Comments received at the January 16, 2008 public hearing suggested that the majority of traffic on North Main Street in Bridgewater originates from and is destined to areas served by South Main Street rather than Dinkel Avenue. Turning movement counts conducted by Parsons Transportation Group at Main Street and Dinkel Avenue provides data to respond to this comment. Travel patterns as identified from the intersection count data are summarized in Exhibit 3. The data suggest that, overall, more of both the northbound and southbound traffic on North Main Street north of Dinkel Avenue comes from or goes to the south on South Main Street rather than the east on Dinkel Avenue. In the a.m. peak hour, more than 70 percent of the traffic on North Main Street comes from South Main Street, as does about 58 percent of the traffic in the p.m. peak. For southbound traffic, the pattern differs between the a.m. and p.m. peak periods: during the a.m. peak slightly more than half of the traffic goes east on Dinkel Avenue, while in the p.m. peak, more than 60 percent of the southbound traffic goes south on South Main Street. In general, this suggests that the Bridgewater Bypass would provide a potential alternative route for somewhere in the range of 25 to 35 percent of the total traffic on North Main Street just north of Dinkel Avenue. An assessment of the turning movement data for truck traffic, however, indicates that there is generally an even split of truck traffic between South Main Street and Dinkel Avenue. The exception to this is the p.m. peak period, where the majority of southbound trucks on Main Street north of Dinkel Avenue go east – about 60 percent of southbound trucks turn left onto eastbound Dinkel Avenue and 40 percent go south onto South Main Street. These data confirm and quantify the observation of those who provided comments at the public hearing that the proposed Bridgewater Bypass would provide a potential diversion for about a third of the traffic on North Main Street in Bridgewater. It is important to note that the diversion estimates developed for the analysis do not contradict this finding: the highest potential traffic diversions on the study network from the construction of either Alternative A or B are from Mount Crawford Avenue and not North Main Street or Dinkel Avenue. To reiterate the finding: both the analysis of the intersection turning movements at Main Street and Dinkel Avenue and the analysis performed for the EA indicate that the proposed Bridgewater Bypass would have the potential to divert only a portion of the total traffic demands currently on North Main Street.
6

Exhibit 3 Travel Patterns for Traffic On North Main
Street in Bridgewater Northbound traffic on Main Street (Route 42) North of
Dinkel Avenue (Route 257) AM Peak PM Peak Total traffic 411 372 From south 294 71.5% 214 57.5% From east 95 23.1% 126 33.9% Truck traffic 30 19 From south 14 46.7% 9 47.4% From east 15 50.0% 10 52.6%
Southbound traffic on Main Street (Route 42) North of Dinkel Avenue (Route 257)
AM Peak PM Peak Total traffic 268 512 To south 106 39.6% 316 61.7% To east 140 52.2% 161 31.4% Truck traffic 24 25 To south 11 45.8% 10 40.0% To east 11 45.8% 15 60.0% Note: Percentages may not add to 100 because of the gas station/convenience store located across from Dinkel Avenue on Main Street.
Travel Times in the Study Area The traffic analysis performed for the Environmental Assessment (EA) made use of the Harrisonburg-Rockingham Metropolitan Planning Organization (HRMPO) travel demand model, which was developed and validated based on a number of parameters including an extensive traffic count database, existing and projected regional demographics, and a travel distribution algorithm that incorporated home interview survey data and well-established techniques for estimating trip origins and destinations. In order to respond to comments received at the public hearing in more detail, additional analysis was performed with respect to travel times and delays in the study area. Travel times, speeds, and delays were recorded in the field and a spreadsheet-based methodology was applied to estimate travel times between several key origin and destination points in the study area. The spreadsheet methodology accounted for segment travel times, average intersection delays for individual turning movements, and average delays on Dinkel Avenue due to pedestrian crossings at Bridgewater College. Exhibit 4 summarizes the travel times between Route 257 at Route 11 and three major truck generators in the study area (Perdue, Marshall’s, and Cargill).
7

Exhibit 4 Travel Times and Estimated Percentages of Traffic Using Various Routes Origin and Destination
Route # Route Description
Travel Time
Percent on Route
11/257 to 1 Dinkel-Main 0:05:56 18.4%
Perdue 2 Dinkel-Mt Crawford-Main 0:04:28 49.5%
3 Dinkel-Alts A/B-Oakwood-Main 0:06:43 10.9%
4 Dinkel-Alt A-Wayland/Main 0:07:22 7.1%
5 Dinkel-Alt B-Wayland/Main 0:08:47 2.7%
6 Valley-Oakwood-Main 0:07:34 6.2%
7 Valley-Oakwood-Alt A-Wayland/Main 0:08:17 3.8%
8 Valley-Oakwood-Alt B-Wayland/Main 0:09:58 1.2%
11/257 to 1 Dinkel-Main 0:06:22 15.0%
Marshalls 2 Dinkel-Mt Crawford-Main 0:04:53 37.0%
3 Dinkel-Alts A/B-Oakwood-Main 0:06:18 15.6%
4 Dinkel-Alt A-Wayland/Main 0:06:57 10.5%
5 Dinkel-Alt B-Wayland/Main 0:08:22 4.4%
6 Valley-Oakwood-Main 0:07:08 9.3%
7 Valley-Oakwood-Alt A-Wayland/Main 0:07:52 6.0%
8 Valley-Oakwood-Alt B-Wayland/Main 0:09:33 2.1%
11/257 to 1 Dinkel-Main 0:10:50 2.4%
Cargill 2 Dinkel-Mt Crawford-Main 0:09:21 5.1%
3 Dinkel-Alts A/B-Oakwood-Main/Wayland 0:08:55 6.4%
4 Dinkel-Alt A-Wayland 0:06:34 21.3%
5 Dinkel-Alt B-Wayland 0:05:52 30.6%
6 Valley-Oakwood-Wayland 0:09:46 4.2%
7 Valley-Oakwood-Alt A-Wayland 0:07:30 13.3%
8 Valley-Oakwood-Alt B-Wayland 0:07:02 16.8%
Perdue to 1 Main-Dinkel 0:06:06 17.3%
11/257 2 Main-Mt Crawford-Dinkel 0:04:28 51.8%
3 Main-Oakwood-Alts A/B-Dinkel 0:06:43 11.4%
4 Wayland/Main-Alt A-Dinkel 0:07:27 7.0%
5 Wayland/Main-Alt B-Dinkel 0:08:52 2.7%
6 Main-Oakwood-Valley 0:07:49 5.5%
7 Wayland/Main-Alt A-Oakwood-Valley 0:08:37 3.2%
8 Wayland/Main-Alt B-Oakwood-Valley 0:10:18 1.0%
Marshalls to 1 Main-Dinkel 0:06:32 14.3%
11/257 2 Main-Mt Crawford-Dinkel 0:04:53 39.0%
3 Main-Oakwood-Alts A/B-Dinkel 0:06:18 16.4%
4 Wayland/Main-Alt A-Dinkel 0:07:02 10.5%
8
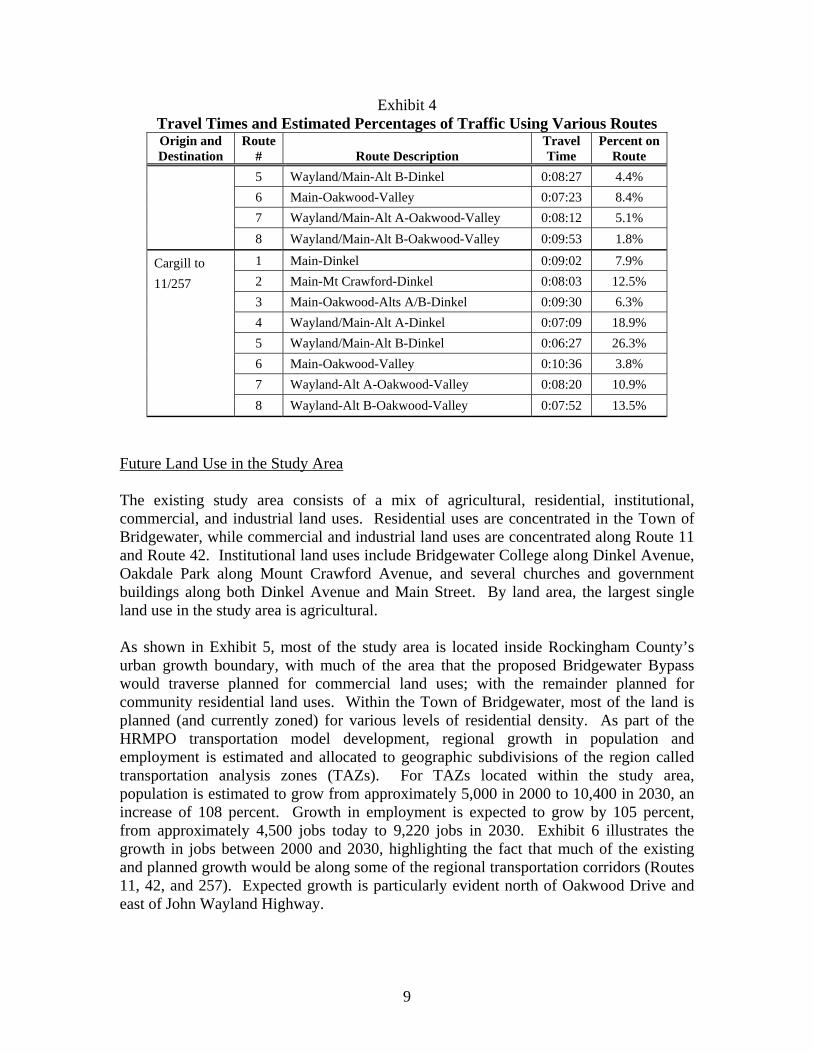
Exhibit 4 Travel Times and Estimated Percentages of Traffic Using Various Routes Origin and Destination
Route # Route Description
Travel Time
Percent on Route
5 Wayland/Main-Alt B-Dinkel 0:08:27 4.4%
6 Main-Oakwood-Valley 0:07:23 8.4%
7 Wayland/Main-Alt A-Oakwood-Valley 0:08:12 5.1%
8 Wayland/Main-Alt B-Oakwood-Valley 0:09:53 1.8%
Cargill to 1 Main-Dinkel 0:09:02 7.9%
11/257 2 Main-Mt Crawford-Dinkel 0:08:03 12.5%
3 Main-Oakwood-Alts A/B-Dinkel 0:09:30 6.3%
4 Wayland/Main-Alt A-Dinkel 0:07:09 18.9%
5 Wayland/Main-Alt B-Dinkel 0:06:27 26.3%
6 Main-Oakwood-Valley 0:10:36 3.8%
7 Wayland-Alt A-Oakwood-Valley 0:08:20 10.9%
8 Wayland-Alt B-Oakwood-Valley 0:07:52 13.5%
Future Land Use in the Study Area The existing study area consists of a mix of agricultural, residential, institutional, commercial, and industrial land uses. Residential uses are concentrated in the Town of Bridgewater, while commercial and industrial land uses are concentrated along Route 11 and Route 42. Institutional land uses include Bridgewater College along Dinkel Avenue, Oakdale Park along Mount Crawford Avenue, and several churches and government buildings along both Dinkel Avenue and Main Street. By land area, the largest single land use in the study area is agricultural. As shown in Exhibit 5, most of the study area is located inside Rockingham County’s urban growth boundary, with much of the area that the proposed Bridgewater Bypass would traverse planned for commercial land uses; with the remainder planned for community residential land uses. Within the Town of Bridgewater, most of the land is planned (and currently zoned) for various levels of residential density. As part of the HRMPO transportation model development, regional growth in population and employment is estimated and allocated to geographic subdivisions of the region called transportation analysis zones (TAZs). For TAZs located within the study area, population is estimated to grow from approximately 5,000 in 2000 to 10,400 in 2030, an increase of 108 percent. Growth in employment is expected to grow by 105 percent, from approximately 4,500 jobs today to 9,220 jobs in 2030. Exhibit 6 illustrates the growth in jobs between 2000 and 2030, highlighting the fact that much of the existing and planned growth would be along some of the regional transportation corridors (Routes 11, 42, and 257). Expected growth is particularly evident north of Oakwood Drive and east of John Wayland Highway.
9

Exhibit 5 Locality Land Use Plans
10

Exhibit 6 Population and Employment in the Study Area (2000 and Projected 2030)
11
Clearly, the expected growth in the study area can be expected to create additional travel demands. Growth in the Town of Bridgewater and along the John Wayland Highway corridor can certainly be anticipated to generate east-west travel demands across the study area. Feasibility of Truck Restrictions on Dinkel Avenue and Main Street in Downtown Bridgewater Several comments that were received from the public hearing suggested that truck traffic restrictions be imposed on one or more streets in Downtown Bridgewater. A major consideration in establishing such restrictions is the availability of alternative routes that do not impose undue travel time burdens on commercial enterprises that generate or need to be served by truck traffic. It is also important to consider the potential for unintended consequences if trucks divert to other roadways that are perhaps even less suited for truck traffic than those roadways proposed for restrictions. As discussed previously, traffic counts indicate that Dinkel Avenue is by far the preferred route for trucks going from I-81 at Exit 240 to facilities in Bridgewater such as Perdue and Marshall’s. This is true despite the fact that trucks often have to stop for pedestrian traffic in the vicinity of Bridgewater College, and the fact that using Mount Crawford Avenue represents a quicker route (although the current geometry makes traveling on Mount Crawford Avenue considerably slower for trucks than it is for cars). A truck restriction along Dinkel Avenue could have the effect of shifting traffic to Mount Crawford Avenue, particularly if Mount Crawford Avenue were improved to enhance safety. Analysis of the travel time data described above suggests that construction of the Bridgewater Bypass from Dinkel Avenue to Oakwood Drive would provide a viable alternative for trucks going to Perdue and Marshall’s. Construction of at least the southern portion of the Bypass (Alternatives A and B are generally the same south of Oakwood Drive) would, therefore, enhance the feasibility of implementing a truck restriction on Dinkel Avenue. It is important to note, however, that approximately one-third of the truck traffic on Dinkel Avenue east of Main Street comes from South Main Street. Because the proposed Bridgewater Bypass would not provide a feasible alternative for this traffic, alternative routes south of the river would be needed. The same issue of truck traffic going to and from the south would severely reduce the feasibility of truck restrictions on North Main Street. Reconfiguring Streets in Downtown Bridgewater to Accommodate Travel Demands Exhibit 7 illustrates several alternatives for constructing either a new roadway that could better accommodate trucks, or for constructing the second half of a one-way pair. For a one-way pair, existing North Main Street would carry either the northbound or southbound traffic and a parallel roadway would carry traffic in the other direction. Two primary options for developing this new roadway were identified: 1) using North Liberty Street (east of Main Street), or 2) using North Grove Street (west of Main Street).
12

Exhibit 7 Potential Alignments for Improved Circulation in Bridgewater
(New Roadway or One-Way Pair Configurations)
13

Exhibit 7 shows sections of each of these roads where either the existing roadbed could be used or where roadway would need to be constructed on new alignment. At a very preliminary level, each of these new roadway alignments would present a number of issues that could be hurdles due to overall impacts as well as potential costs/impacts versus benefits. Key concerns include:
• Both alignments pass through residential areas, creating both perceived and real impacts to these communities.
• The North Grove Street alignment would likely require the taking of several houses.
• Connecting the southern end of North Grove Street to Main Street in the vicinity of Dinkel Avenue would result in substantial impacts to the gas station and church in this area. While these impacts could be mitigated to some degree based on reduced geometrics, the role of the new roadway in terms of carrying trucks requires that the roadway and intersection geometrics accommodate trucks.
• Using North Liberty Street would require roadway on new alignment north of Mount Crawford Road. Much of this alignment would pass close to and perhaps within Oakdale Park property.
Meeting the Project Purpose and Need with an Upgraded Route 704 As stated in the EA, The purpose of the Bridgewater Bypass is to provide an alternate route for traffic, especially truck traffic, so that it doesn’t have to pass through downtown Bridgewater. Such a route would:
• Enhance connectivity between sections of Route 257 east of Bridgewater and Sections of Route 257/42 north of Bridgewater, thereby improving mobility.
• Divert through traffic from existing Routes 257, 42, and 1310. • Reduce conflicts between vehicular, pedestrian, and bicycle travel on Dinkel
Avenue, North Main Street, and Mount Crawford Avenue and reduce conflicts with turning movements.
The traffic analysis performed for the EA, as well as the supplemental analysis described in this technical memorandum, indicates that the proposed Bypass would provide an alternative route for traffic passing through downtown Bridgewater, but that the potential for diverting traffic is limited somewhat by several factors, many of which were highlighted in comments provided at the public hearing. As described earlier, more than half of the overall traffic on North Main Street north of Dinkel Avenue comes not from Dinkel Avenue but from South Main Street. While a higher proportion of truck traffic on North Main Street comes from Dinkel Avenue, the overall projected traffic diversion benefit of the proposed bypass would be higher on Mount Crawford Avenue than it would on Dinkel Avenue. This is, again, less true of trucks because observation and traffic counts indicate that trucks do not use Mount Crawford Avenue despite its potential time savings, probably due to the current substandard geometrics of the road. Several comments received at the public hearing included queries about the potential for upgrading Route 704 and the extent to which such an upgrade would be a viable
14

alternative to serve the identified transportation and safety needs in downtown Bridgewater. An upgrade to Route 704 was initially considered and then dropped from detailed consideration because, based on the analysis performed using the regional travel demand model, it provided extremely limited potential for diverting traffic from downtown Bridgewater. The additional analysis performed for this technical memorandum confirms this. In addition, upgrades to Route 704 would also provide substantially less traffic diversion potential from Mount Crawford Avenue than the proposed bypass would. For this reason, it is believed that upgrades to Route 704 would not meet the specific transportation needs cited in the EA. The analysis performed for this technical memorandum does indicate, however, that upgrades to Route 704 would provide a number of transportation benefits for the study area and the region. As the future land use plans indicate, much of the growth in the study area would take place along Routes 11 and 42. There are currently a limited number of good connecting roads between these two growth corridors, and an upgraded Route 704 could provide this important function. In terms of the subset of truck traffic that does travel between Interstate 81 at Route 257 and the areas around Perdue and Marshall’s, the travel time analysis does show that the Route 704 upgrade would provide a generally comparable travel time to the proposed Bridgewater Bypass Alternative A. It could also provide a reasonable truck travel alternative to Mount Crawford Avenue which, when it is upgraded, may require some level of truck traffic control to restrict heavier use by trucks. Comparison of traffic data reported in EA with data from VDOT’s Special Locality Reports for Bridgewater A commenter suggested that estimated existing traffic volumes presented in the EA are inconsistent with figures provided in other data sources, specifically the Special Locality Reports (SLRs) for Bridgewater. The referenced reports are published by the Virginia Department of Transportation (VDOT), which conducts a program where traffic count data are gathered from sensors in or along Virginia’s streets and highways and other sources. From these data, estimates of the average daily number of vehicles that traveled each segment of road are calculated. Exhibit 8 summarizes the relevant data.
Exhibit 8 Summary of Traffic Volumes by Year and Road Segment
Annual Average Daily Traffic (AADT) on Road Segment
Data Source
Rte 257 Main St. to
ECL Bridgewater
N. Main (Rte 42) Dinkel to
Mt. Crawford
N. Main (Rte 42) Mt. Crawford to
N. River Rd.
N. Main (Rte 42) N. River Rd. to
NCL Bridgewater EA 8,100 13,400 – 17,100 2007 SLR 7,900 13,000 16,000 16,000 2006 SLR 7,800 13,000 15,000 15,000 2005 SLR 8,100 13,000 17,000 17,000 2004 SLR 7,900 13,000 17,000 17,000 2003 SLR 7,600 13,000 16,000 16,000 2002 SLR 8,700 15,000 17,000 15,000 2001 SLR 8,200 14,000 16,000 14,000
15

Sources: Environmental Assessment, Bridgewater Bypass, 12/11/07. Virginia Department of Transportation, Daily Traffic Volume Estimates Including Vehicle Classification Estimates Where Available, Special Locality Report 176, Town of Bridgewater, years 2002, 2003, 2004, 2005, 2006, 2007; Virginia Department of Transportation, Daily Traffic Volume Estimates Including Vehicle Classification Estimates Where Available, Jurisdiction Report 82, Rockingham County, 2001. As noted by the commenter, these data do not suggest a substantial traffic volume growth trend on these road segments over the last several years. However, the data do show that the numbers presented in the EA, while not matching exactly, are entirely consistent with other estimates developed by VDOT over the last several years. It should be noted that these are all estimates, and not necessarily exact counts. Furthermore, the data show that traffic volumes can vary from year to year. Such variability can be attributed to changes in travel patterns, land use changes, the state of the local economy, or any number of other factors. Finally, forecasts for the design year using the approved regional travel model do show growth in future traffic volumes as a result of expected growth in population and employment and land use changes over the coming years.
16

ATTACHMENT C
BRIDGEWATER TOWN COUNCIL RESOLUTION AND INDUSTRY LETTERS
1