alternatives exposure for dc participants -...
TRANSCRIPT
Alternatives Exposure
for DC Participants
John CorcoranSenior Client Portfolio Manager,
Global Multi-Asset Group
2 For Institutional Use Only
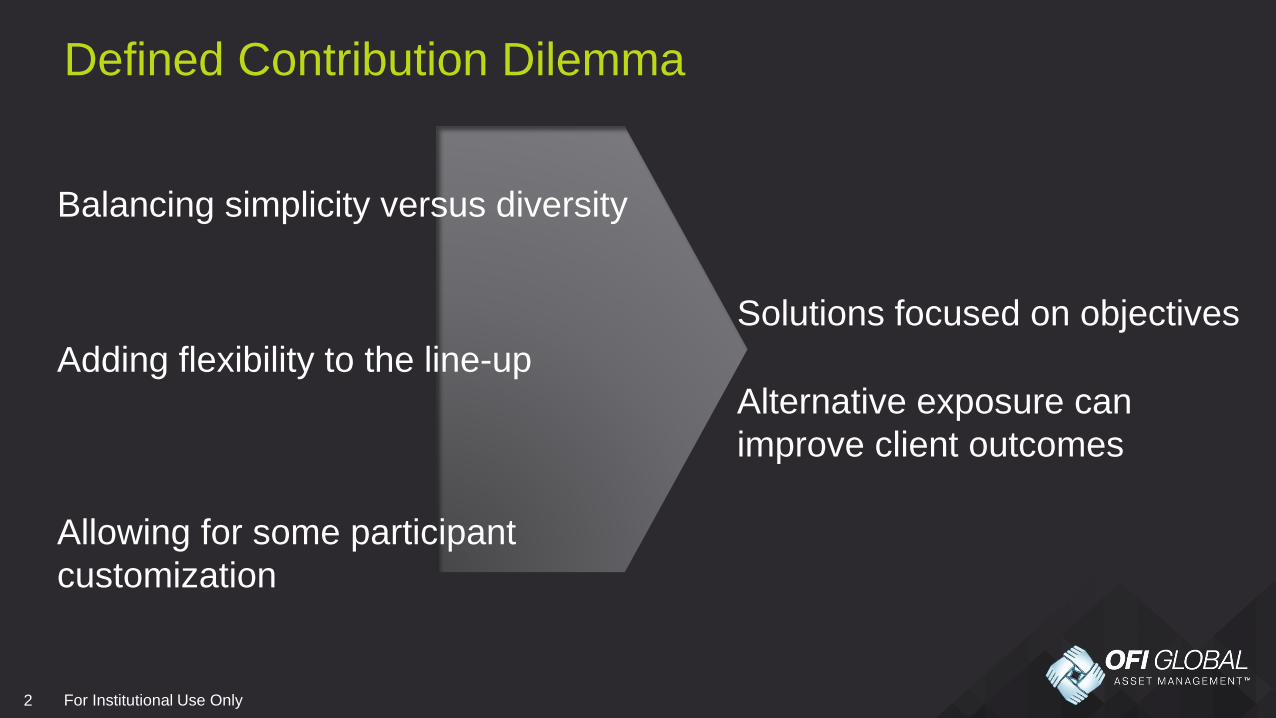
Defined Contribution Dilemma
Balancing simplicity versus diversity
Adding flexibility to the line-up
Allowing for some participant
customization
Solutions focused on objectives
Alternative exposure can
improve client outcomes
3 For Institutional Use Only
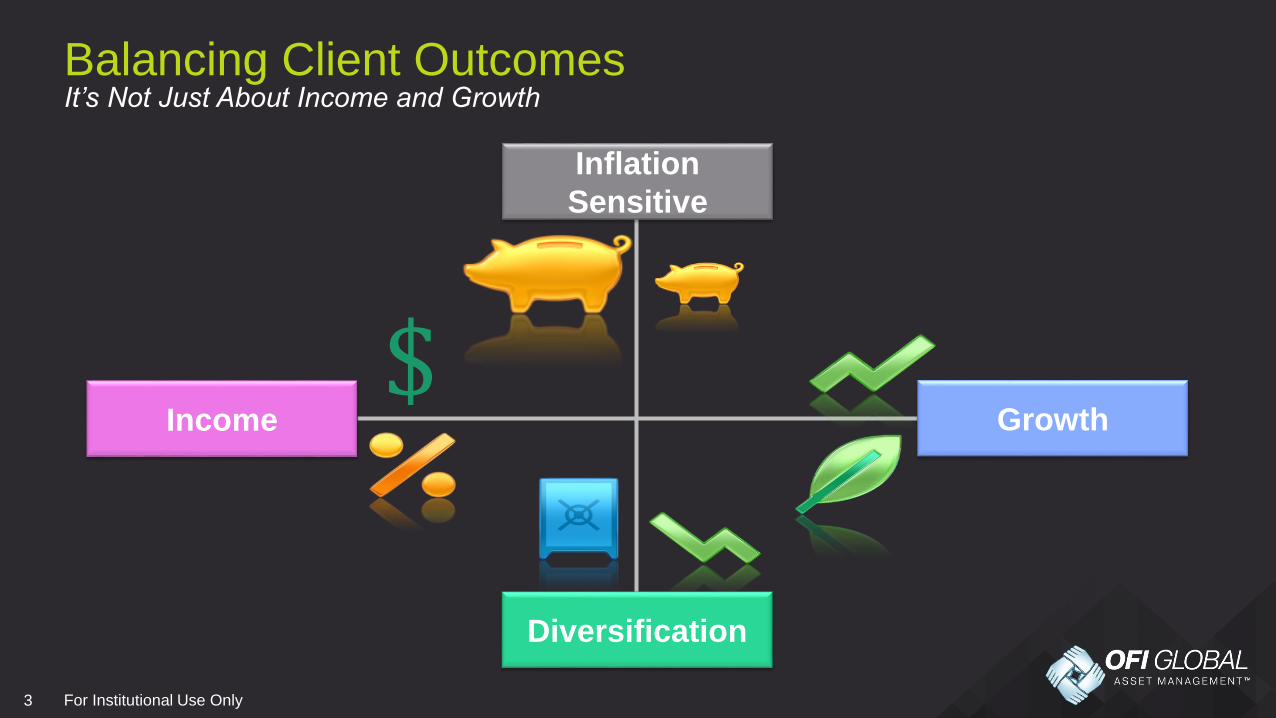
It’s Not Just About Income and GrowthBalancing Client Outcomes
Inflation
Sensitive
$Income Growth
Diversification
4 For Institutional Use Only
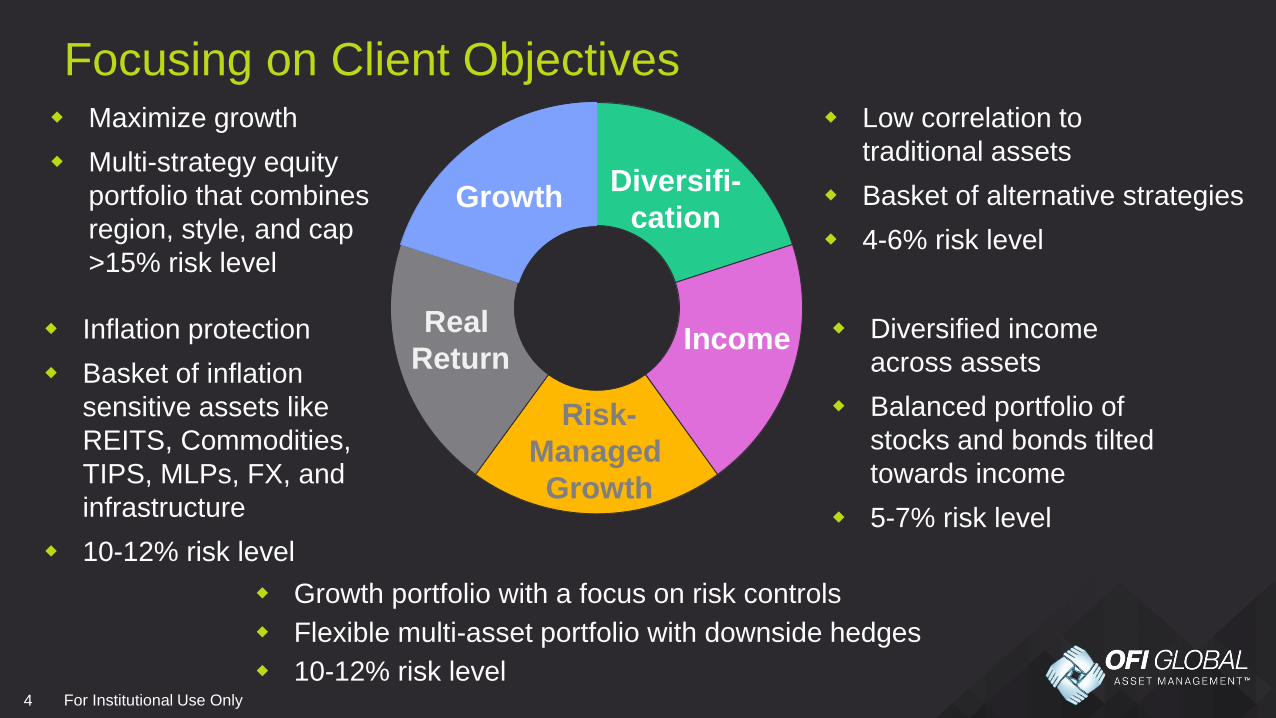
Focusing on Client Objectives
Real
Return
Diversifi-
cation
Income
Risk-
Managed
Growth
Growth
Maximize growth
Multi-strategy equity
portfolio that combines
region, style, and cap
>15% risk level
Inflation protection
Basket of inflation
sensitive assets like
REITS, Commodities,
TIPS, MLPs, FX, and
infrastructure
10-12% risk level
Low correlation to
traditional assets
Basket of alternative strategies
4-6% risk level
Growth portfolio with a focus on risk controls
Flexible multi-asset portfolio with downside hedges
10-12% risk level
Diversified income
across assets
Balanced portfolio of
stocks and bonds tilted
towards income
5-7% risk level
5 For Institutional Use Only
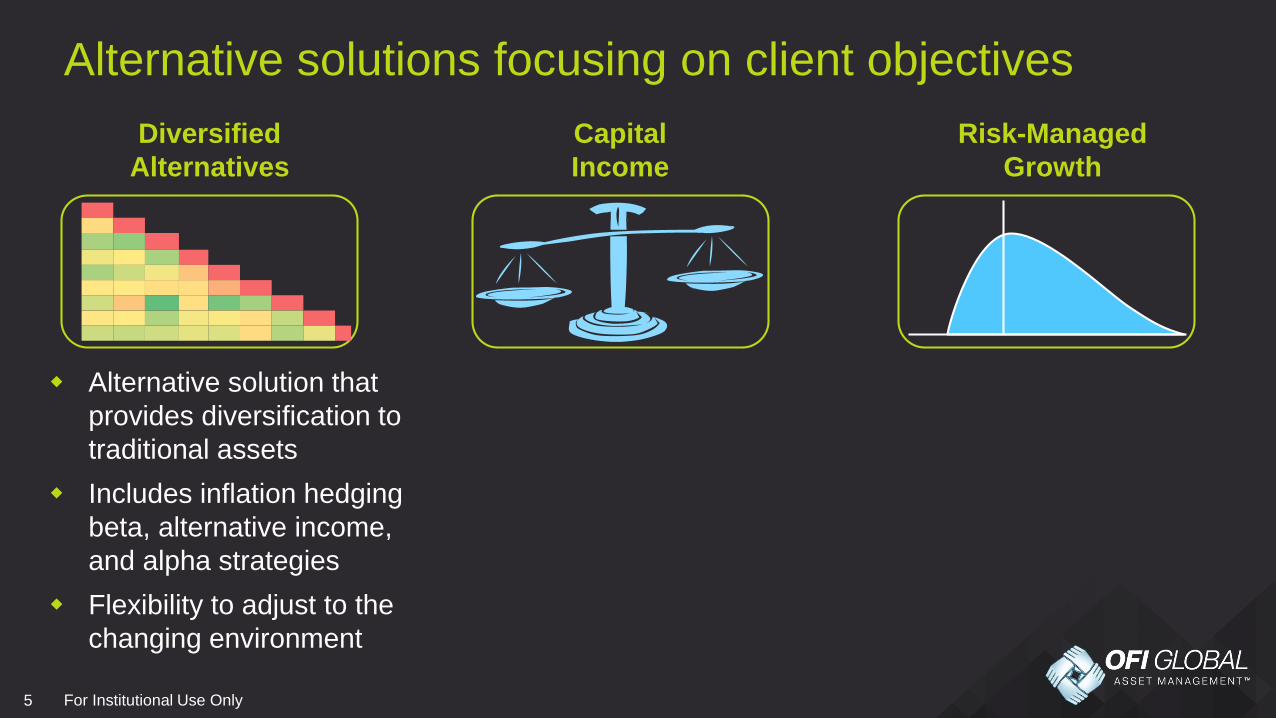
Alternative solutions focusing on client objectives
Alternative solution that
provides diversification to
traditional assets
Includes inflation hedging
beta, alternative income,
and alpha strategies
Flexibility to adjust to the
changing environment
Risk-Managed
Growth
Capital
Income
Diversified
Alternatives
6 For Institutional Use Only
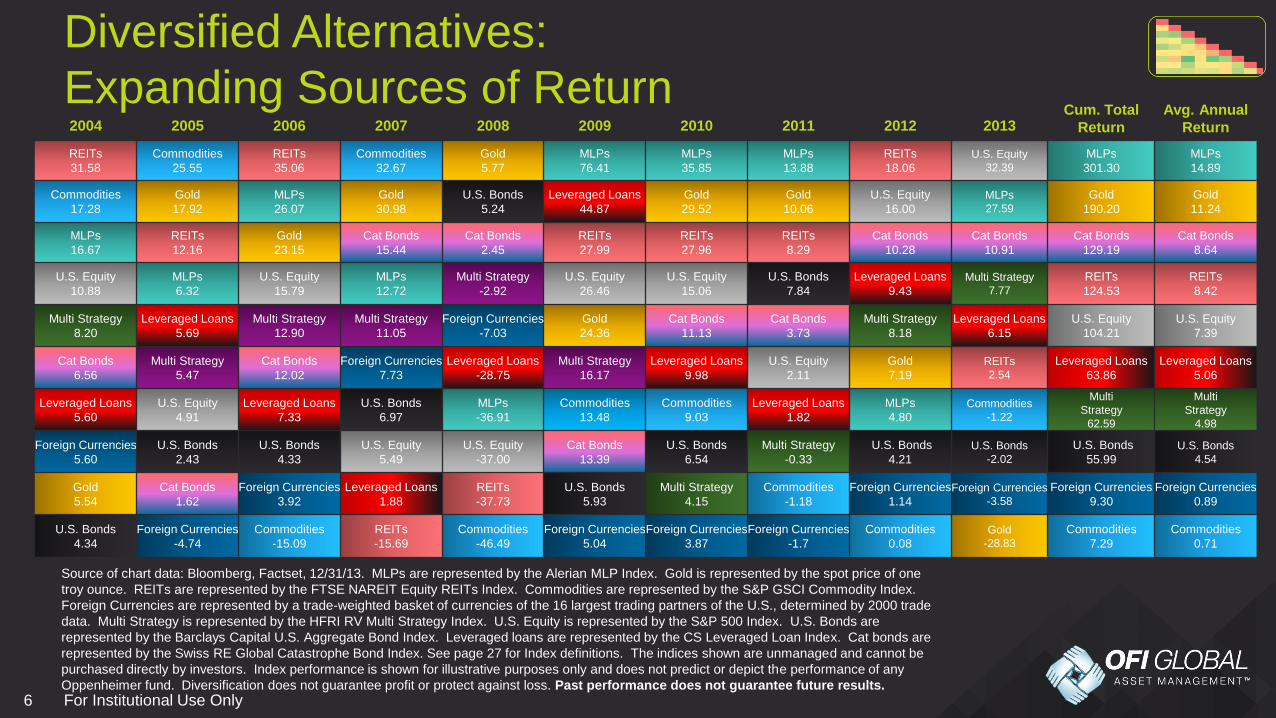
Source of chart data: Bloomberg, Factset, 12/31/13. MLPs are represented by the Alerian MLP Index. Gold is represented by the spot price of one
troy ounce. REITs are represented by the FTSE NAREIT Equity REITs Index. Commodities are represented by the S&P GSCI Commodity Index.
Foreign Currencies are represented by a trade-weighted basket of currencies of the 16 largest trading partners of the U.S., determined by 2000 trade
data. Multi Strategy is represented by the HFRI RV Multi Strategy Index. U.S. Equity is represented by the S&P 500 Index. U.S. Bonds are
represented by the Barclays Capital U.S. Aggregate Bond Index. Leveraged loans are represented by the CS Leveraged Loan Index. Cat bonds are
represented by the Swiss RE Global Catastrophe Bond Index. See page 27 for Index definitions. The indices shown are unmanaged and cannot be
purchased directly by investors. Index performance is shown for illustrative purposes only and does not predict or depict the performance of any
Oppenheimer fund. Diversification does not guarantee profit or protect against loss. Past performance does not guarantee future results.
2004 2005 2006 2007 2008 2009 2010 2011 2012 2013Cum. Total
Return
Avg. Annual
Return
REITs
31.58
Commodities
25.55
REITs
35.06
Commodities
32.67
Gold
5.77
MLPs
76.41
MLPs
35.85
MLPs
13.88
REITs
18.06
U.S. Equity
32.39
MLPs
301.30
MLPs
14.89
Commodities
17.28
Gold
17.92
MLPs
26.07
Gold
30.98
U.S. Bonds
5.24
Leveraged Loans
44.87
Gold
29.52
Gold
10.06
U.S. Equity
16.00
MLPs
27.59
Gold
190.20
Gold
11.24
MLPs
16.67
REITs
12.16
Gold
23.15
Cat Bonds
15.44
Cat Bonds
2.45
REITs
27.99
REITs
27.96
REITs
8.29
Cat Bonds
10.28
Cat Bonds
10.91
Cat Bonds
129.19
Cat Bonds
8.64
U.S. Equity
10.88
MLPs
6.32
U.S. Equity
15.79
MLPs
12.72
Multi Strategy
-2.92
U.S. Equity
26.46
U.S. Equity
15.06
U.S. Bonds
7.84
Leveraged Loans
9.43
Multi Strategy
7.77
REITs
124.53
REITs
8.42
Multi Strategy
8.20
Leveraged Loans
5.69
Multi Strategy
12.90
Multi Strategy
11.05
Foreign Currencies
-7.03
Gold
24.36
Cat Bonds
11.13
Cat Bonds
3.73
Multi Strategy
8.18
Leveraged Loans
6.15
U.S. Equity
104.21
U.S. Equity
7.39
Cat Bonds
6.56
Multi Strategy
5.47
Cat Bonds
12.02
Foreign Currencies
7.73
Leveraged Loans
-28.75
Multi Strategy
16.17
Leveraged Loans
9.98
U.S. Equity
2.11
Gold
7.19
REITs
2.54
Leveraged Loans
63.86
Leveraged Loans
5.06
Leveraged Loans
5.60
U.S. Equity
4.91
Leveraged Loans
7.33
U.S. Bonds
6.97
MLPs
-36.91
Commodities
13.48
Commodities
9.03
Leveraged Loans
1.82
MLPs
4.80
Commodities
-1.22
Multi
Strategy
62.59
Multi
Strategy
4.98
Foreign Currencies
5.60
U.S. Bonds
2.43
U.S. Bonds
4.33
U.S. Equity
5.49
U.S. Equity
-37.00
Cat Bonds
13.39
U.S. Bonds
6.54
Multi Strategy
-0.33
U.S. Bonds
4.21
U.S. Bonds
-2.02
U.S. Bonds
55.99
U.S. Bonds
4.54
Gold
5.54
Cat Bonds
1.62
Foreign Currencies
3.92
Leveraged Loans
1.88
REITs
-37.73
U.S. Bonds
5.93
Multi Strategy
4.15
Commodities
-1.18
Foreign Currencies
1.14
Foreign Currencies
-3.58
Foreign Currencies
9.30
Foreign Currencies
0.89
U.S. Bonds
4.34
Foreign Currencies
-4.74
Commodities
-15.09
REITs
-15.69
Commodities
-46.49
Foreign Currencies
5.04
Foreign Currencies
3.87
Foreign Currencies
-1.7
Commodities
0.08
Gold
-28.83
Commodities
7.29
Commodities
0.71
Diversified Alternatives:
Expanding Sources of Return
7 For Institutional Use Only
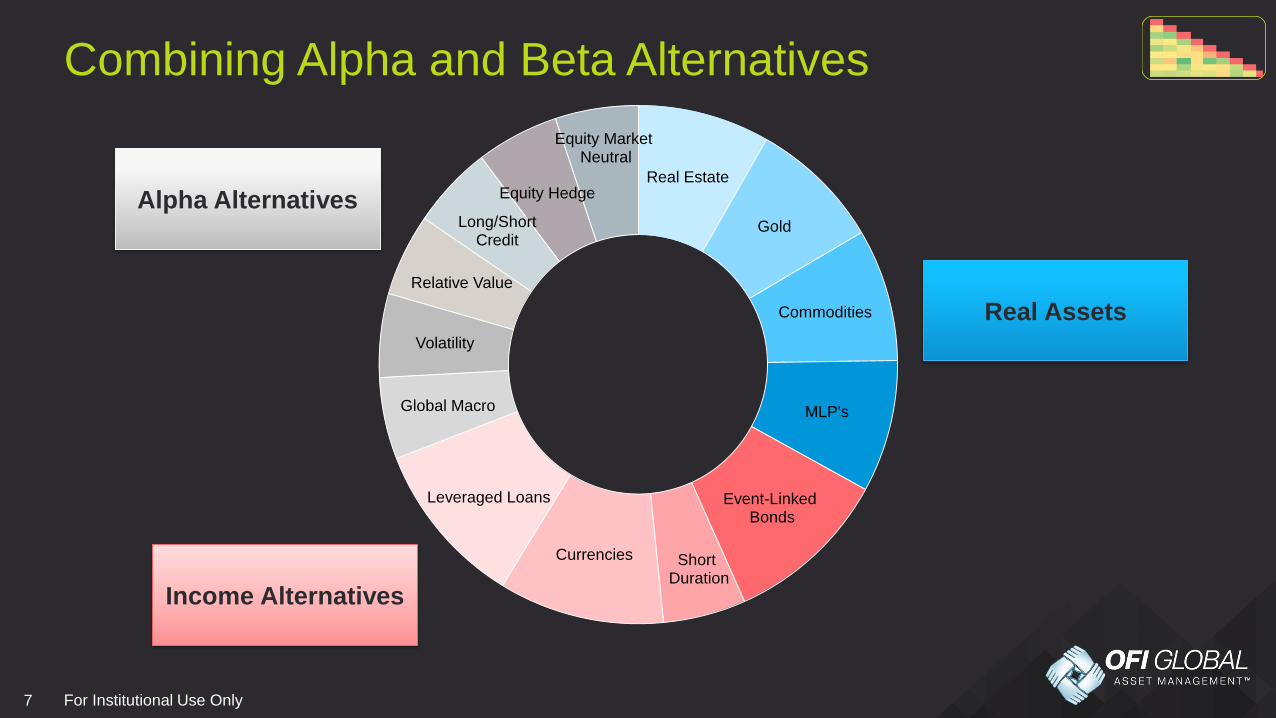
Real Estate
Gold
Commodities
MLP's
Event-LinkedBonds
ShortDuration
Currencies
Leveraged Loans
Global Macro
Volatility
Relative Value
Long/Short Credit
Equity Hedge
Equity MarketNeutral
Combining Alpha and Beta Alternatives
Alpha Alternatives
Real Assets
Income Alternatives

8 For Institutional Use Only
2.94 3.37
6.87
8.849.56
14.62
0
2
4
6
8
10
12
14
16
Source: FactSet and Morningstar, 12/31/13. See page 27 for index definitions.
Past performance does not guarantee future results.
Event-Linked Bonds—
Historically Low Volatility plus High Sharpe RatioS
tandard
Devia
tion %
2.25
0.84
0.390.61 0.71
0.45
0
1
2
3
Sharp
e R
atio %
SHARPE RATIO (10-YEAR AS OF 12/31/13)VOLATILITY (10-YEAR AS OF 12/31/13)
Swiss Re Global Cat Bond Index
Barclays U.S. Aggregate Bond Index
Citi WGBI Index
60/40 S&P 500/Barclays Agg
High Yields Bonds
S&P 500 Index

9 For Institutional Use Only
SWISS RE GLOBAL CAT BOND INDEX RETURNS
Event-Linked Bond Performance
Source: Bloomberg, 12/31/13. See page 27 for Index definitions. Indices are unmanaged and cannot be
purchased directly by investors. Index performance is shown for illustrative purposes only and does not
predict or depict the performance of any particular investment. Past performance does not guarantee
future results.
100
120
140
160
180
200
220
240
260
2002 2003 2004 2005 2006 2007 2008 2009 2010 2011 2012 2013
Sw
iss R
e C
at
Bond
Index L
evel
European Sovereign
Debt Crisis in 2011
Start of the Fed’s
“Taper Tantrum”
in 2013
Subprime Crisis in 2007
U.S. Debt Downgrade in 2011
10 For Institutional Use Only
Alerian MLP Index Total Return (AMZX)
Performance in Periods of Rising Interest Rates
*Indicates the increase in interest rates in terms of basis points for each time period.
An investor cannot invest directly in an index. They are unmanaged and shown for illustrative purposes only. Please see
page 27 for index definitions. Past performance does not guarantee future results.
Source: Bloomberg, Alerian Capital Management, Barclays Research estimates. As of 6/30/2013.
1,600
1,400
1,200
1,000
800
600
400
200
0
Jan
-96
Jan
-97
Jan
-98
Jan
-00
Jan
-01
Jan
-02
Jan
-03
Jan
-04
Jan
-05
Jan
-06
Jan
-07
Ja
n-0
8
Jan
-09
Jan
-10
Ja
n-1
1
Jan
-12
Jan
-13
Jan
-99
AMZX
+5%
AMZX
-3%AMZX
-4%
AMZX
+54%
AMZX
+30%
AMZX
+11%
AMZX
+23%
+145 bps*
+249 bps*
+112 bps*
+213 bps*
+175 bps*
+134 bps*
+108 bps*
11 For Institutional Use Only
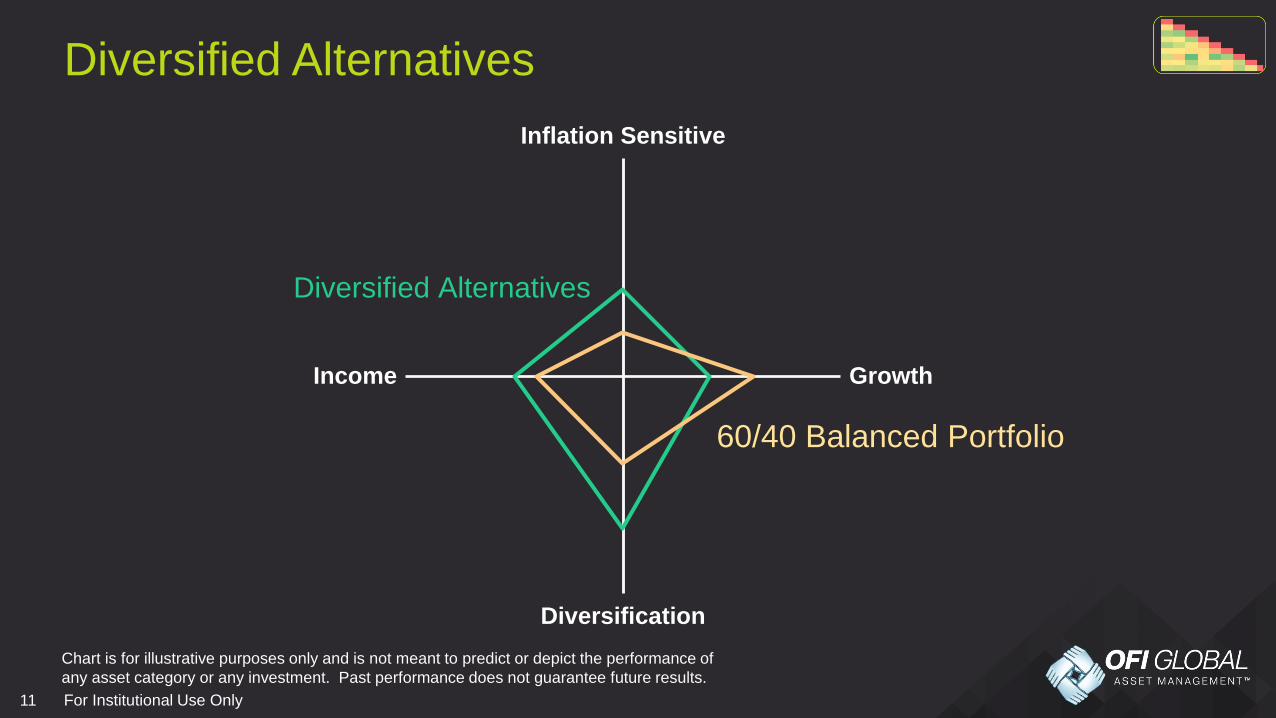
Diversified Alternatives
Inflation Sensitive
Growth
Diversification
Income
Diversified Alternatives
60/40 Balanced Portfolio
Chart is for illustrative purposes only and is not meant to predict or depict the performance of
any asset category or any investment. Past performance does not guarantee future results.
12 For Institutional Use Only
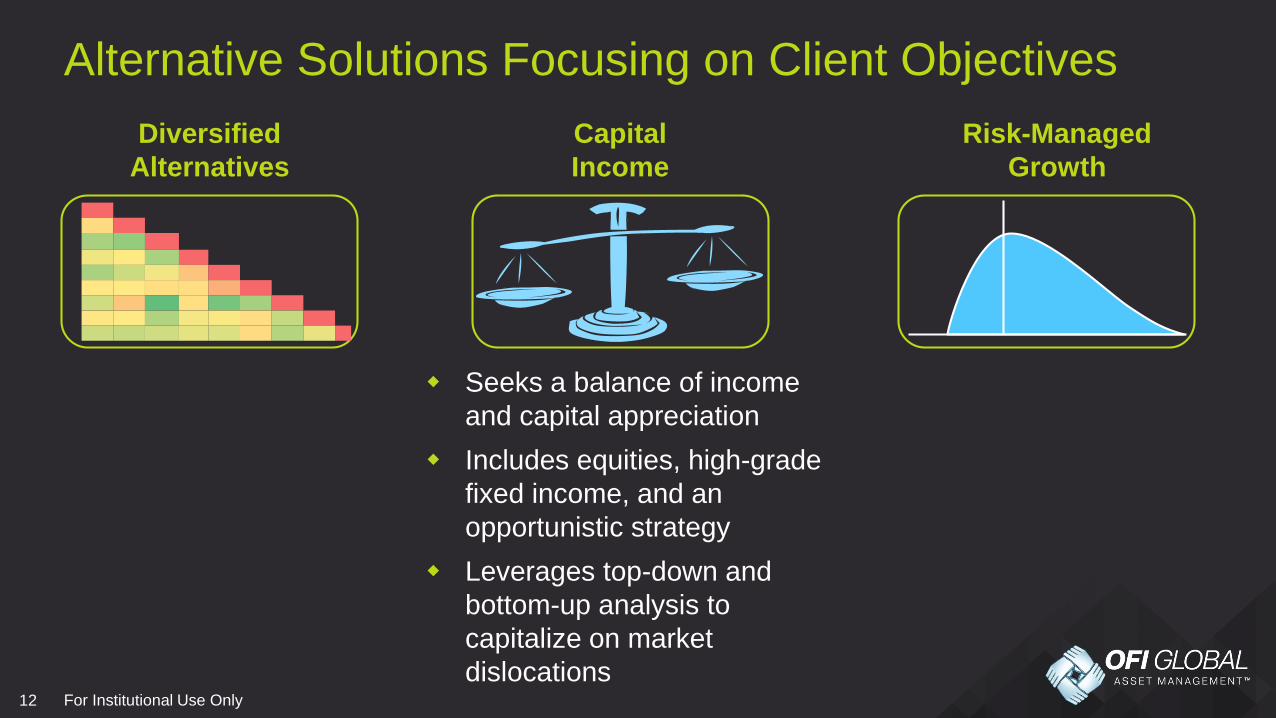
Alternative Solutions Focusing on Client Objectives
Risk-Managed
Growth
Capital
Income
Diversified
Alternatives
Seeks a balance of income
and capital appreciation
Includes equities, high-grade
fixed income, and an
opportunistic strategy
Leverages top-down and
bottom-up analysis to
capitalize on market
dislocations
13 For Institutional Use Only
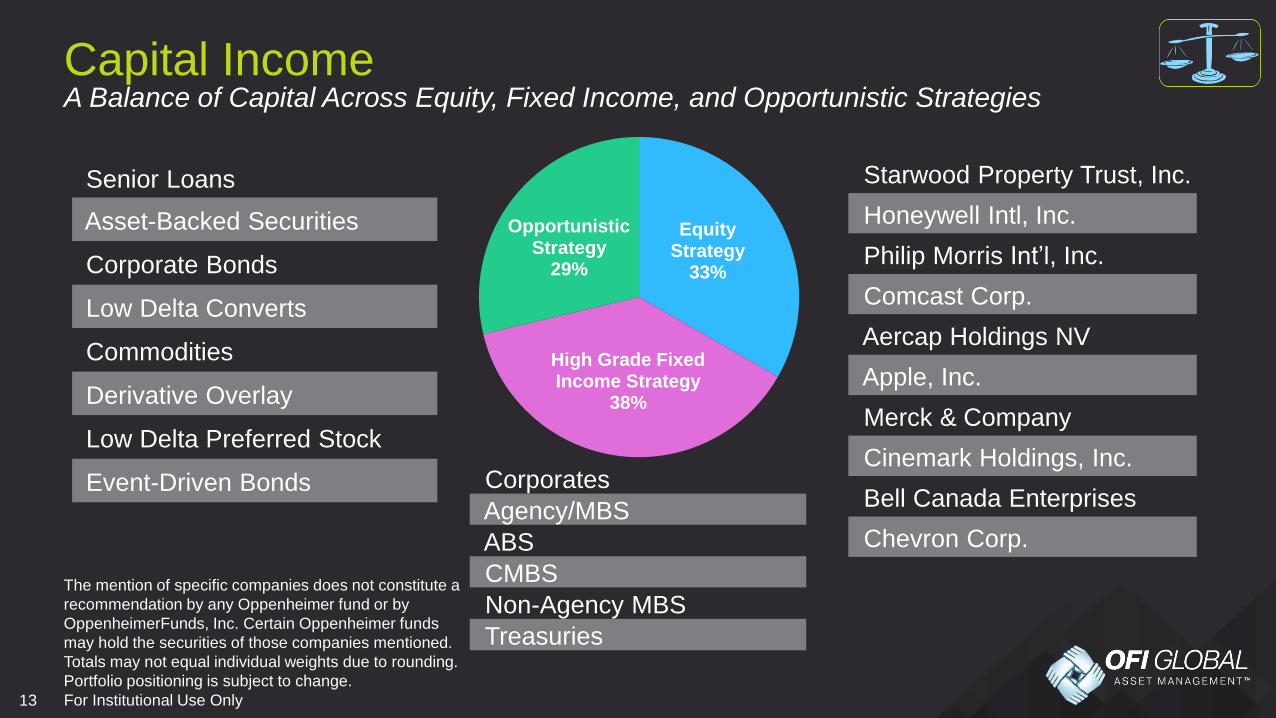
A Balance of Capital Across Equity, Fixed Income, and Opportunistic StrategiesCapital Income
The mention of specific companies does not constitute a
recommendation by any Oppenheimer fund or by
OppenheimerFunds, Inc. Certain Oppenheimer funds
may hold the securities of those companies mentioned.
Totals may not equal individual weights due to rounding.
Portfolio positioning is subject to change.
Equity Strategy
33%
High Grade Fixed Income Strategy
38%
OpportunisticStrategy
29%
Senior Loans
Asset-Backed Securities
Corporate Bonds
Low Delta Converts
Commodities
Derivative Overlay
Low Delta Preferred Stock
Event-Driven Bonds
Starwood Property Trust, Inc.
Honeywell Intl, Inc.
Philip Morris Int’l, Inc.
Comcast Corp.
Aercap Holdings NV
Apple, Inc.
Merck & Company
Cinemark Holdings, Inc.
Bell Canada Enterprises
Chevron Corp.
Corporates
Agency/MBS
ABS
CMBS
Non-Agency MBS
Treasuries

14 For Institutional Use Only
3-YEAR RISK/RETURN (AS OF 12/31/13)
Capital Income: Risk/Return Profile
Source of chart data: Morningstar, 12/31/13.
Past performance does not guarantee future results.
Funds listed above include Oppenheimer Capital Income Fund: OPPEX; Federated Capital Income: CAPAX; Franklin Income:
FKINX; Goldman Sachs Income Builder: GSBFX; Hartford Balanced Income: HBLAX; James Balanced:
Golden Rainbow: GLRBX; JP Morgan Income Builder: JNBAX; MFS Diversified Income: DIFAX;
Principal Diversified Real Asset: PRDAX; Principal Global Diversified: PGBAX. See slide 27
for index definitions.
Annualized Standard Deviation %
-1
1
3
5
7
9
11
13
15
17
0 2 4 6 8 10 12
Annua
lized R
etu
rn
%
Capital
Income
Morningstar Conservative
Allocation Category Avg.
High Risk /Low Reward
Low Risk /High
Reward
S&P 500 Index
Barclays U.S. Aggregate Bond Index
Competitors

15 For Institutional Use Only
Providing More Growth, Diversification, and Inflation ProtectionCapital Income
Inflation Sensitive
Growth
Diversification
Income
Capital Income
35/65 Balanced
Chart is for illustrative purposes only and is not meant to predict or depict the performance of
any asset category or any investment. Past performance does not guarantee future results.

16 For Institutional Use Only
Alternative Solutions Focusing on Client Objectives
Risk-Managed
Growth
Capital
Income
Diversified
Alternatives
Seeks capital appreciation
with flexible approach to asset
allocation
Dynamic risk management
for downside protection
Broad, active investment
universe
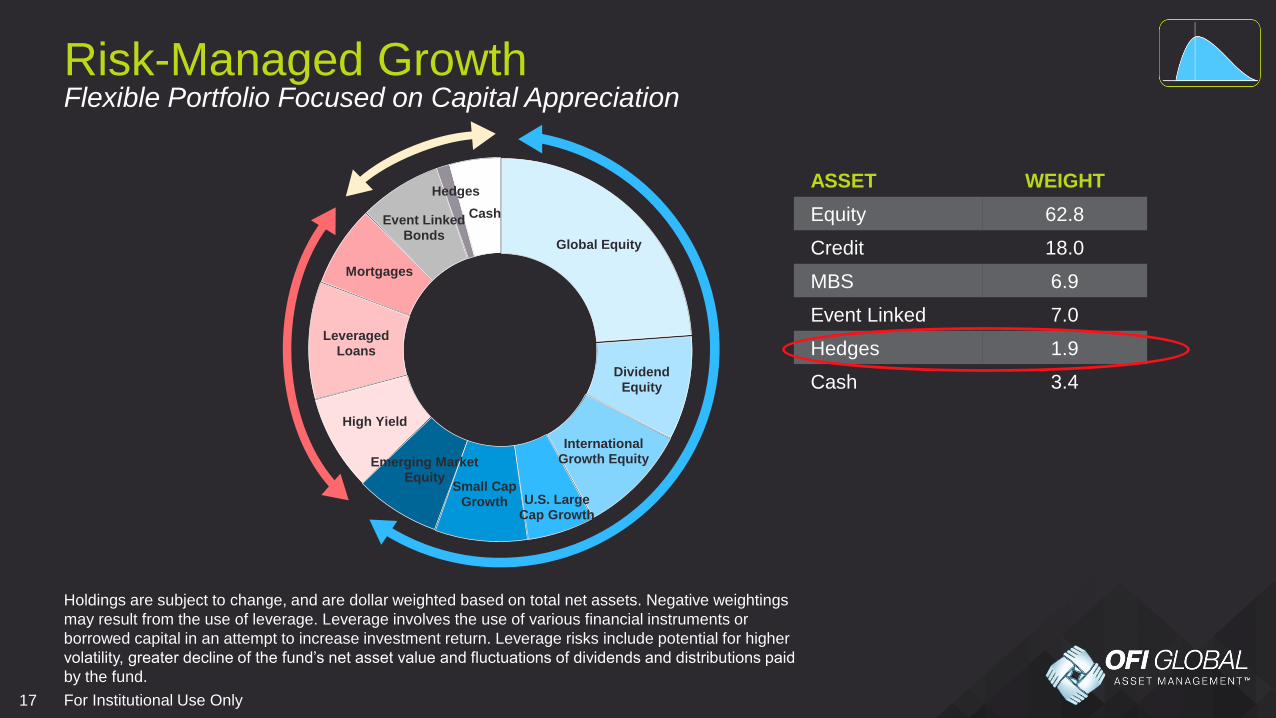
17 For Institutional Use Only
Global Equity
Dividend Equity
International Growth Equity
U.S. Large Cap Growth
Small Cap Growth
Emerging Market Equity
High Yield
Leveraged Loans
Mortgages
Event Linked Bonds
Hedges
Cash
Flexible Portfolio Focused on Capital Appreciation
Holdings are subject to change, and are dollar weighted based on total net assets. Negative weightings
may result from the use of leverage. Leverage involves the use of various financial instruments or
borrowed capital in an attempt to increase investment return. Leverage risks include potential for higher
volatility, greater decline of the fund’s net asset value and fluctuations of dividends and distributions paid
by the fund.
Risk-Managed Growth
ASSET WEIGHT
Equity 62.8
Credit 18.0
MBS 6.9
Event Linked 7.0
Hedges 1.9
Cash 3.4
18 For Institutional Use Only
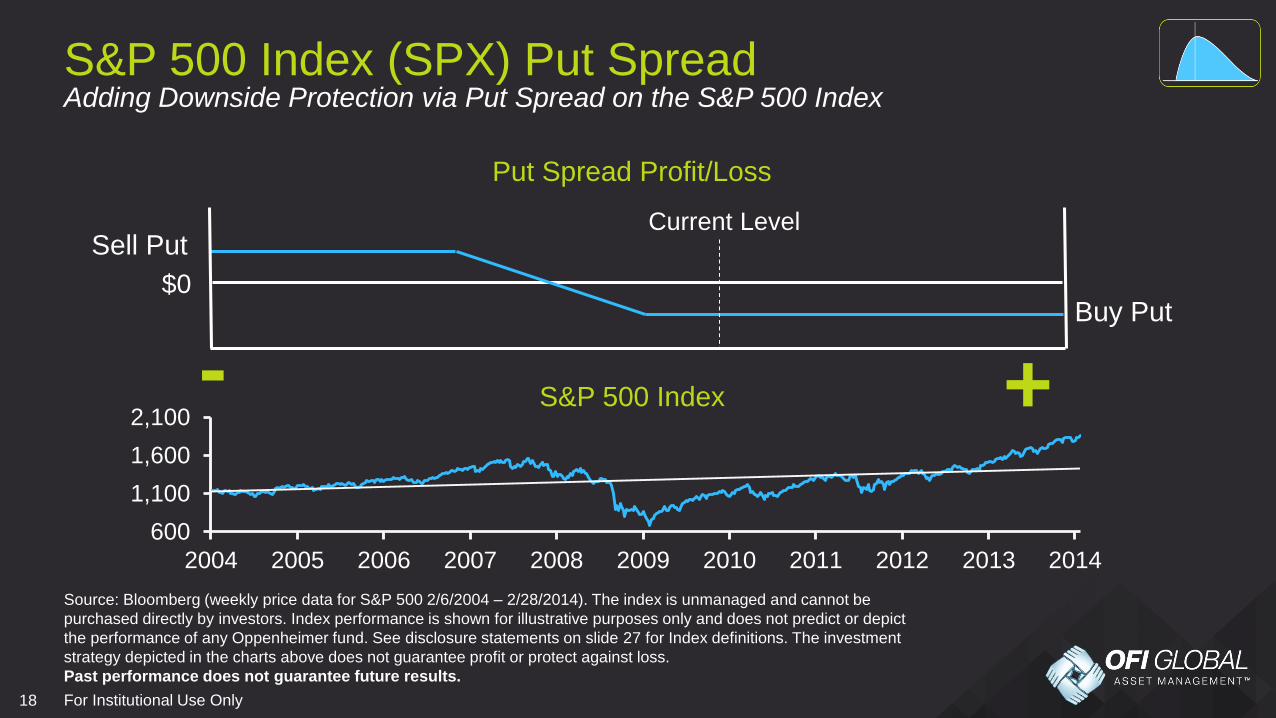
Adding Downside Protection via Put Spread on the S&P 500 IndexS&P 500 Index (SPX) Put Spread
Sell Put
Buy Put$0
Current Level
+-
600
1,100
1,600
2,100
2004 2005 2006 2007 2008 2009 2010 2011 2012 2013 2014
Source: Bloomberg (weekly price data for S&P 500 2/6/2004 – 2/28/2014). The index is unmanaged and cannot be
purchased directly by investors. Index performance is shown for illustrative purposes only and does not predict or depict
the performance of any Oppenheimer fund. See disclosure statements on slide 27 for Index definitions. The investment
strategy depicted in the charts above does not guarantee profit or protect against loss.
Past performance does not guarantee future results.
Put Spread Profit/Loss
S&P 500 Index
19 For Institutional Use Only
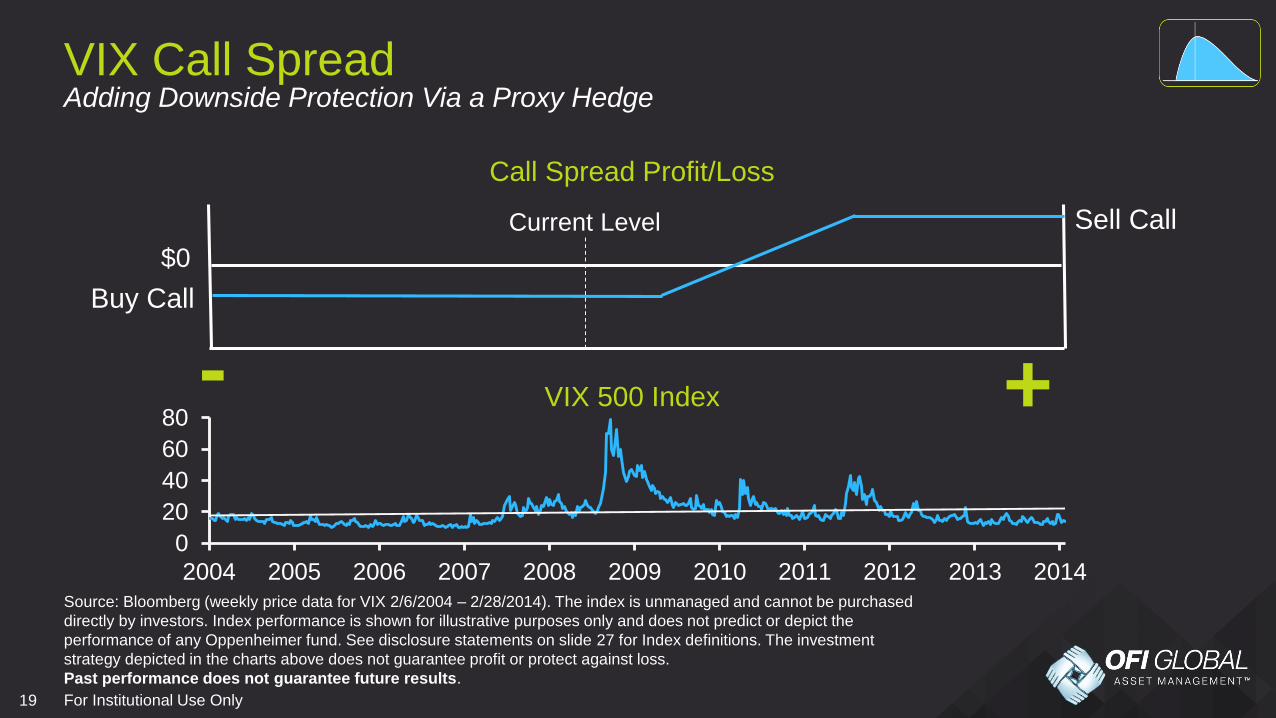
Adding Downside Protection Via a Proxy Hedge VIX Call Spread
Source: Bloomberg (weekly price data for VIX 2/6/2004 – 2/28/2014). The index is unmanaged and cannot be purchased
directly by investors. Index performance is shown for illustrative purposes only and does not predict or depict the
performance of any Oppenheimer fund. See disclosure statements on slide 27 for Index definitions. The investment
strategy depicted in the charts above does not guarantee profit or protect against loss.
Past performance does not guarantee future results.
Buy Call
Sell Call
$0
Current Level
+-
Call Spread Profit/Loss
VIX 500 Index
0
20
40
60
80
2004 2005 2006 2007 2008 2009 2010 2011 2012 2013 2014
20 For Institutional Use Only
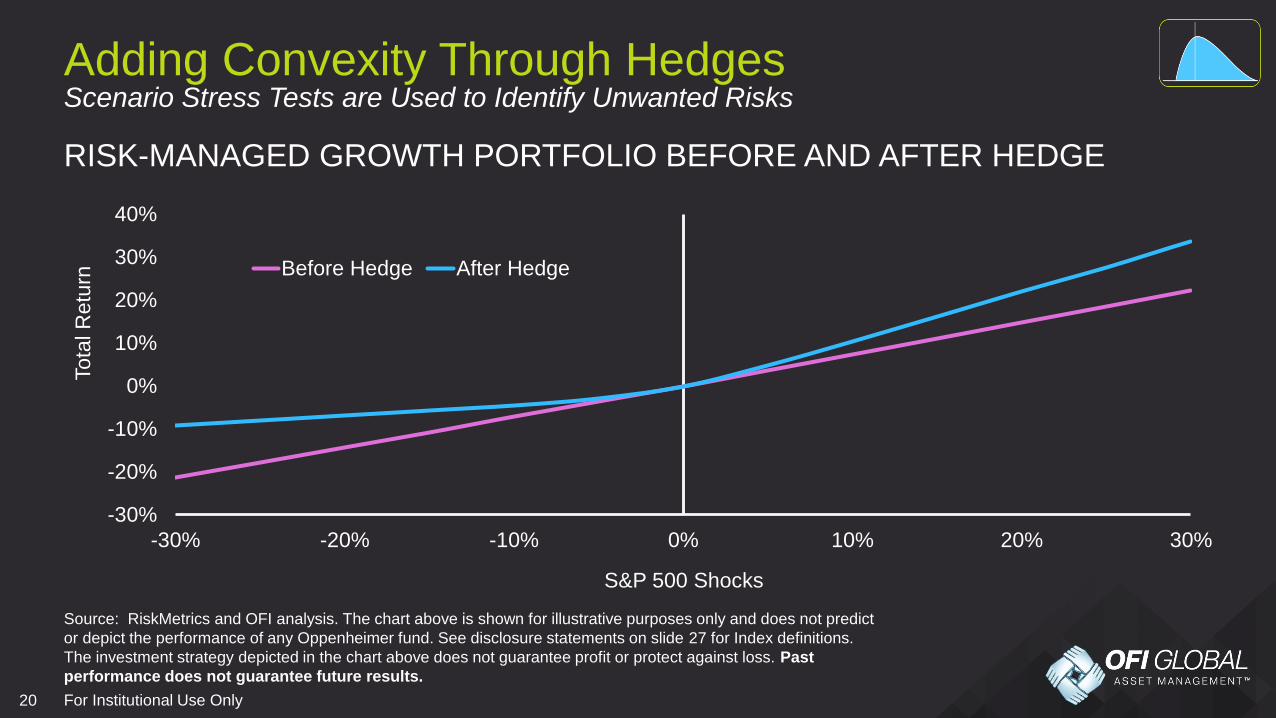
Scenario Stress Tests are Used to Identify Unwanted Risks
RISK-MANAGED GROWTH PORTFOLIO BEFORE AND AFTER HEDGE
Source: RiskMetrics and OFI analysis. The chart above is shown for illustrative purposes only and does not predict
or depict the performance of any Oppenheimer fund. See disclosure statements on slide 27 for Index definitions.
The investment strategy depicted in the chart above does not guarantee profit or protect against loss. Past
performance does not guarantee future results.
Adding Convexity Through Hedges
-30%
-20%
-10%
0%
10%
20%
30%
40%
-30% -20% -10% 0% 10% 20% 30%
Tota
l R
etu
rn
S&P 500 Shocks
Before Hedge After Hedge
21 For Institutional Use Only
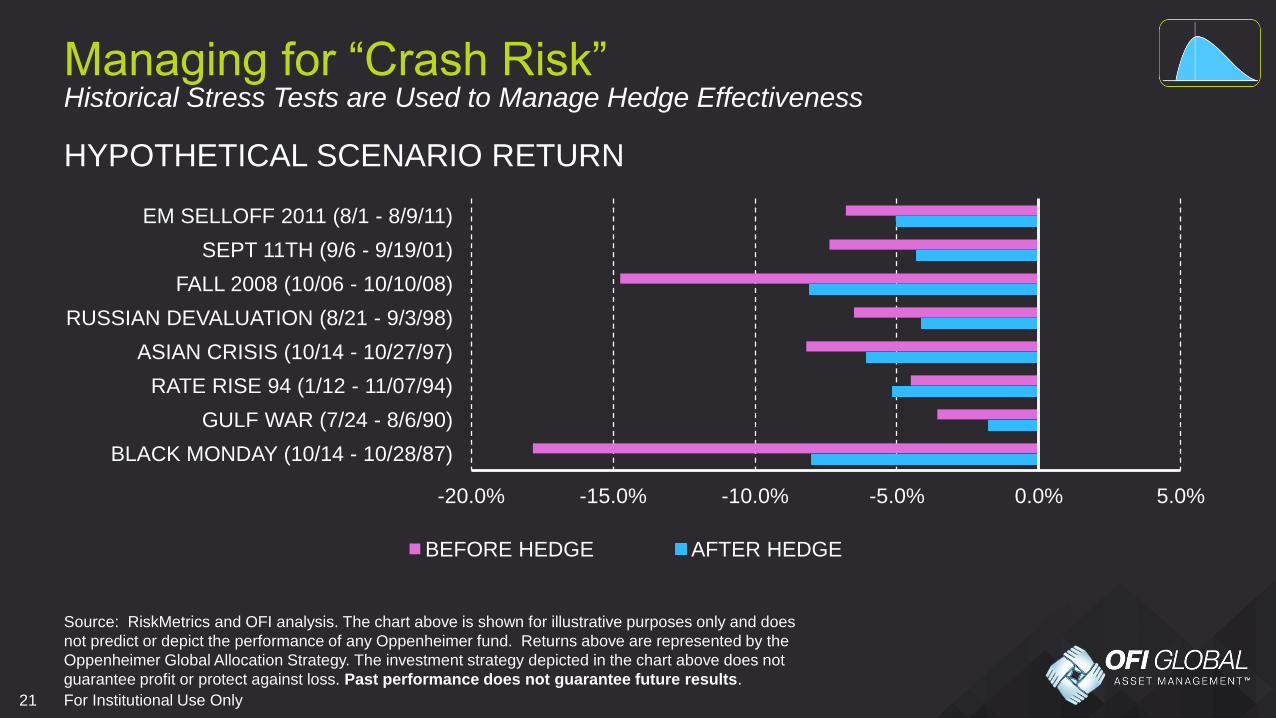
Historical Stress Tests are Used to Manage Hedge Effectiveness
HYPOTHETICAL SCENARIO RETURN
Managing for “Crash Risk”
-20.0% -15.0% -10.0% -5.0% 0.0% 5.0%
BLACK MONDAY (10/14 - 10/28/87)
GULF WAR (7/24 - 8/6/90)
RATE RISE 94 (1/12 - 11/07/94)
ASIAN CRISIS (10/14 - 10/27/97)
RUSSIAN DEVALUATION (8/21 - 9/3/98)
FALL 2008 (10/06 - 10/10/08)
SEPT 11TH (9/6 - 9/19/01)
EM SELLOFF 2011 (8/1 - 8/9/11)
BEFORE HEDGE AFTER HEDGE
Source: RiskMetrics and OFI analysis. The chart above is shown for illustrative purposes only and does
not predict or depict the performance of any Oppenheimer fund. Returns above are represented by the
Oppenheimer Global Allocation Strategy. The investment strategy depicted in the chart above does not
guarantee profit or protect against loss. Past performance does not guarantee future results.

22 For Institutional Use Only
Return Shaping Used to Reduce “Crash Risk”Dynamic risk management
Low Cost Hedges to
Reduce Downside Risk Typical Distribution
of Portfolio Returns
Return
Shaping
Chart is for illustrative purposes only and is not meant to predict or depict the performance of any asset
category or any investment. Past performance does not guarantee future results.

23 For Institutional Use Only
Adding Diversification Through Downside HedgesRisk-Managed Growth
60/40 Balanced
Inflation Sensitive
Growth
Diversification
Income
Risk-Managed Growth
Chart is for illustrative purposes only and is not meant to predict or depict the performance of
any asset category or any investment. Past performance does not guarantee future results.
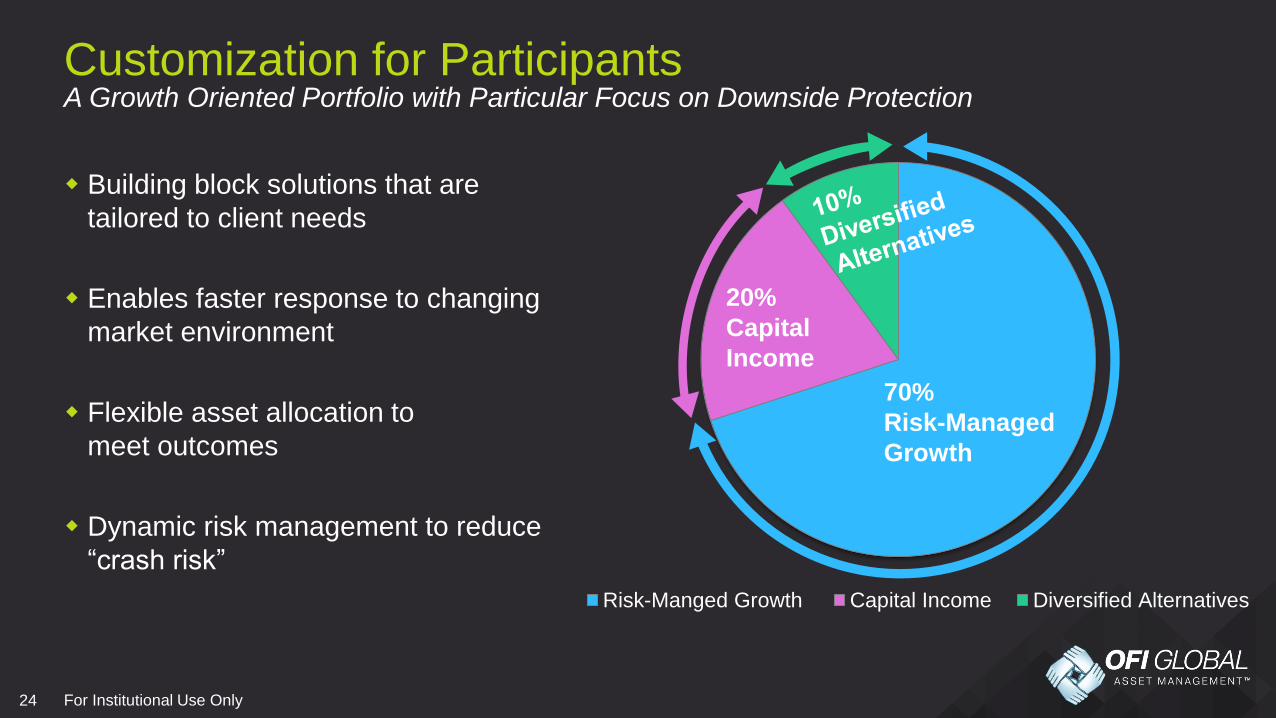
24 For Institutional Use Only
Customization for Participants
Risk-Manged Growth Capital Income Diversified Alternatives
A Growth Oriented Portfolio with Particular Focus on Downside Protection
Building block solutions that are
tailored to client needs
Enables faster response to changing
market environment
Flexible asset allocation to
meet outcomes
Dynamic risk management to reduce
“crash risk”
70%
Risk-Managed
Growth
20%
Capital
Income
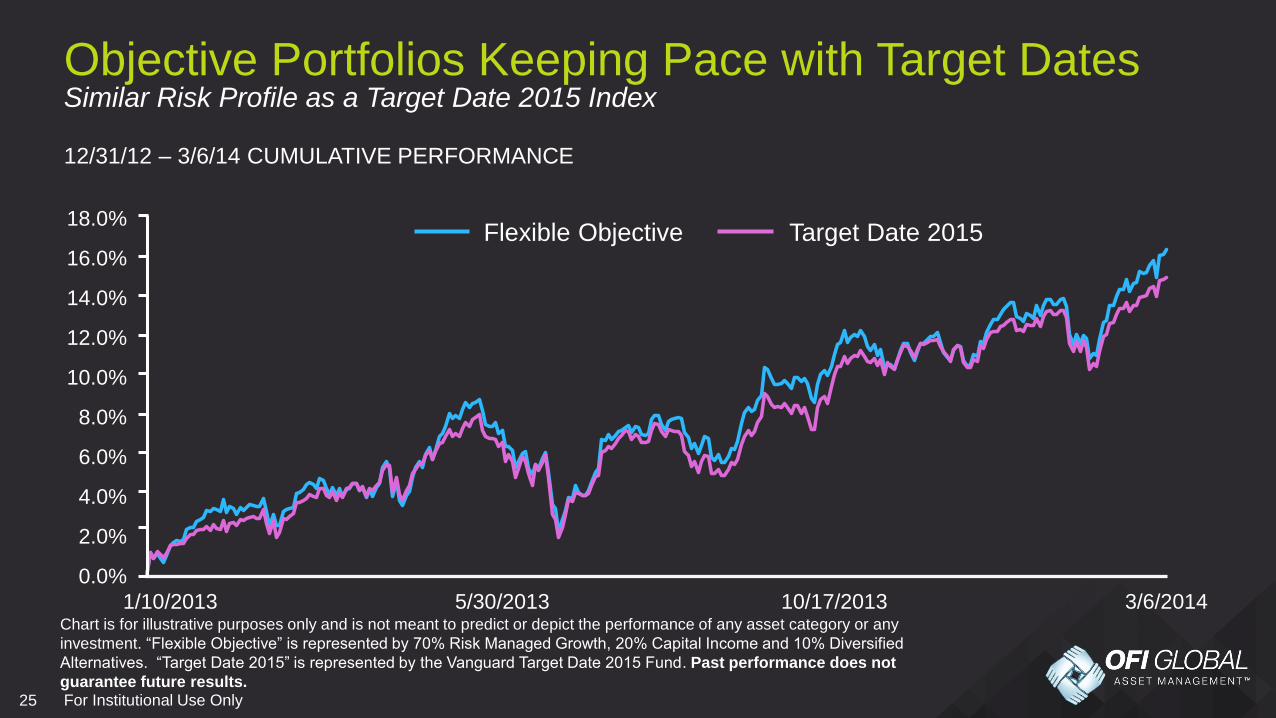
25 For Institutional Use Only
Objective Portfolios Keeping Pace with Target Dates
Diversification
0.0%
2.0%
4.0%
6.0%
8.0%
10.0%
12.0%
14.0%
16.0%
18.0%
3/6/201410/17/20135/30/20131/10/2013
Similar Risk Profile as a Target Date 2015 Index
12/31/12 – 3/6/14 CUMULATIVE PERFORMANCE
Flexible Objective Target Date 2015
Chart is for illustrative purposes only and is not meant to predict or depict the performance of any asset category or any
investment. “Flexible Objective” is represented by 70% Risk Managed Growth, 20% Capital Income and 10% Diversified
Alternatives. “Target Date 2015” is represented by the Vanguard Target Date 2015 Fund. Past performance does not
guarantee future results.
26 For Institutional Use Only
Key Takeaways
Adding alternative exposure increases breadth to manage additional
client dimensions
Bundled solutions focused on income, growth or diversification can
be a simple way to add diversity to a line-up
Alternatives include both alpha and beta exposures, and the
management of risk is as important as security selection
Objective approach can enhance flexibility and provide participants
with some customization

27 For Institutional Use Only
Definitions The S&P 500 Index is a free-float capitalization-weighted index of the prices of 500 large-cap common stocks actively traded in the United States.
The MSCI AC World ex-U.S. Index is designed to measure the equity market performance of developed and emerging markets and excludes the U.S. The index is unmanaged and cannot be purchased directly by investors.
The MSCI Emerging Markets Index is designed to measure the equity market performance of emerging markets. The index is unmanaged, includes the reinvestment of dividends and cannot be purchased directly by investors.
The Barclays U.S. Aggregate Bond Index is an investment-grade domestic bond index. The index is unmanaged and cannot be purchased directly by investors.
The EMBI+ tracks returns for actively traded external debt instruments in emerging market, and is also J.P. Morgan's most liquid U.S-dollar emerging markets debt benchmark. The index segments further the universe of emerging markets as defined by the broader EMBI Global and EMBI Global Diversified, by placing a strict liquidity requirement rule for inclusion. Included in the EMBI+ are US-dollar denominated Brady bonds, Eurobonds, and traded loans issued by sovereign entities.
JPM GABI consists of the JPM GABI US, a U.S. dollar denominated, investment-grade index spanning asset classes from developed to emerging markets, and the JPM GABI extends the U.S. index to also include multi-currency, investment-grade instruments.
The FTSE National Association of Real Estate Investment Trusts (NAREIT) Equity Index consists of certain companies that own and operate income-producing real estate that have 75% or more of their respective gross invested assets in the equity or mortgage debt of commercial properties. The index is unmanaged, includes the reinvestment of dividends and cannot be purchased directly by investors.
The Alerian MLP Index is a market-cap weighted, float-adjusted index created to provide a comprehensive benchmark for investors to track the performance of the energy MLP sector.
The Credit Suisse Leveraged Loan Index is a composite index of senior loan returns representing an unleveraged investment in senior loans that is broadly based across the spectrum of senior bank loans and includes reinvestment of income.
The S&P GSCI™ Total Return index measures a fully collateralized commodity futures investment that is rolled forward from the fifth to the ninth business day of each month. Currently the S&P GSCI™ includes 242 commodity nearby futures contracts. The S&P GSCI™ Total Return is significantly different than the return from buying physical commodities.
The Barclays Capital U.S. Government Bond Index is the U.S. Government component of the Barclays Capital U.S. Aggregate Index. It includes public obligations of the U.S. Treasury with a remaining maturity of one year or more. It also includes publicly issued debt of U.S. Government agencies, quasi-federal corporations, and corporate debt guaranteed by the U.S. Government.
The Philadelphia Gold & Silver Index is a market capitalization-weighted index of 30 leading companies focused on the mining of gold and silver.
The Citigroup Non-U.S. World Government Bond Index is comprised of developed market foreign government bonds with maturities over one year.
The Citigroup U.S. Government Index is composed of all U.S. Treasury notes and bonds with remaining maturities of at least one year and outstanding principal of at least $25 million that are included in the Citigroup Broad Investment-Grade Bond Index.
The JPMorgan Domestic High Yield Index is designed to mirror the investment universe for the U.S. dollar domestic high yield corporate debt market.
HFRX RV Multi Strategy Index: Relative Value: Multi-Strategies employ an investment thesis is predicated on realization of a spread between related yield instruments in which one or multiple components of the spread contains a fixed income, derivative, equity, real estate, MLP or combination of these or other instruments. Strategies are typically quantitatively driven to measure the existing relationship between instruments and, in some cases, identify attractive positions in which the risk adjusted spread between these instruments represents an attractive opportunity for the investment manager. In many cases these strategies may exist as distinct strategies across which a vehicle which allocates directly, or may exist as related strategies over which a single individual or decision making process manages. Multi-strategy is not intended to provide broadest-based mass market investors appeal, but are most frequently distinguished from others arbitrage strategies in that they expect to maintain >30% of portfolio exposure in 2 or more strategies meaningfully distinct from each other that are expected to respond to diverse market influences.Gold is represented by the dollar spot price of one troy ounce.
Swiss Re Cat Bond Indices are a series of performance indices constructed to track the price return and the total rate of return for USD denominated cat bonds. Swiss Re Cat Bond Indices track the performance of the main basket, all outstanding USD denominated catastrophe bonds.
The Chicago Board Options Exchange Market Volatility Index (“VIX”) is a measure of the implied volatility of S&P 500 index options and represents the market's expectation of stock market volatility over the next 30-day period.
Past performance does not guarantee future results.
Indices are unmanaged and cannot be purchased directly by investors. Index performance is shown for illustrative purposes only and does not predict or depict the
performance of the fund.
28 For Institutional Use Only
DisclosuresSpecial Risks: Fixed income investing entails credit and interest rate risks. When interest rates rise, bond prices generally fall, and the Fund’s share prices can fall. May invest up to 40% in below-investment-grade (“high yield” or "junk") bonds, which are more at risk of default and are subject to liquidity risk. Value investing involves the risk that undervalued securities may not appreciate as anticipated. Mortgage-backed securities are subject to prepayment risk. Derivative instruments whose values depend on the performance of an underlying security, asset, interest rate, index or currency, entail potentially higher volatility and risk of loss compared to traditional stock or bond investments. Convertible bonds are subject to the additional risk that the market value of the equity or other securities into which they are convertible will never be sufficient to justify conversion, rendering the conversion value of the bonds worthless. Asset-backed securities are subject to prepayment risk. Foreign investments may be volatile and involve additional expenses and special risks, including currency fluctuations, foreign taxes and geopolitical risks. Emerging and developing market investments may be especially volatile. The Fund may also invest through a wholly-owned Cayman Islands subsidiary, which is subject to the laws of the Cayman Islands and involves the risk that changes to those laws could negatively affect the Fund. Diversification does not guarantee profit or protect against loss. These views represent the opinions of OppenheimerFunds, Inc. and are not intended as investment advice or to predict or depict performance of any investment. These views are as of the open of business on March 28, 2014, and are subject to change based on subsequent developments.
Investing in MLPs involves additional risks as compared to the risks of investing in common stock, including risks related to cash flow, dilution and voting rights. Each Fund’s investments are concentrated in the energy infrastructure industry with an emphasis on securities issued by MLPs, which may increase volatility. Energy infrastructure companies are subject to risks specific to the industry such as fluctuations in commodity prices, reduced volumes of natural gas or other energy commodities, environmental hazards, changes in the macroeconomic or the regulatory environment or extreme weather. MLPs may trade less frequently than larger companies due to their smaller capitalizations which may result in erratic price movement or difficulty in buying or selling. Additional management fees and other expenses are associated with investing in MLP funds. The Oppenheimer SteelPath MLP Funds are subject to certain MLP tax risks. An investment in an Oppenheimer SteelPath MLP Fund does not offer the same tax benefits of a direct investment in an MLP. The Funds are organized as Subchapter “C” Corporations and are subject to U.S. federal income tax on taxable income at the corporate tax rate (currently as high as 35%) as well as state and local income taxes. The potential tax benefit of investing in MLPs depend on them being treated as partnerships for federal income tax purposes. If the MLP is deemed to be a corporation, its income would be subject to federal taxation at the entity level, reducing the amount of cash available for distribution which could result in a reduction of the fund’s value. MLP funds accrue deferred income taxes for future tax liabilities associated with the portion of MLP distributions considered to be a tax-deferred return of capital and for any net operating gains as well as capital appreciation of its investments. This deferred tax liability is reflected in the daily NAV and as a result a MLP fund's after-tax performance could differ significantly from the underlying assets even if the pre-tax performance is closely tracked.
These views represent the opinions of OppenheimerFunds, Inc. and are not intended as investment advice or to predict or depict performance of any
investment. These views are as of the open of business on March 16, 2014, and are subject to change based on subsequent developments.
The S&P 500 Index is a free-float capitalization-weighted index of the prices of 500 large-cap common stocks actively traded in the United States.
Shares of Oppenheimer funds are not deposits or obligations of any bank, are not guaranteed by any bank, are not insured by the FDIC or any other
agency, and involve investment risks, including the possible loss of the principal amount invested.
Before investing in any of the Oppenheimer funds, investors should carefully consider a fund’s investment objectives, risks, charges and
expenses. Fund prospectuses and summary prospectuses contain this and other information about the funds, and may be obtained by asking
your financial advisor, visiting oppenheimerfunds.com or calling 1.800.CALL OPP (225.5677). Investors should read prospectuses and
summary prospectuses carefully before investing.
For Institutional Use Only. This material has been prepared by OppenheimerFunds Distributor, Inc. for institutional investors only. It has not been filed with
FINRA, may not be reproduced and may not be shown to, quoted to or used with retail investors.
Oppenheimer funds are distributed by OppenheimerFunds Distributor, Inc.
225 Liberty Street, New York, NY 10281-1008
© 2014 OppenheimerFunds Distributor, Inc. All rights reserved.