alternative vehicle detection technologies for traffic signal
TRANSCRIPT


8
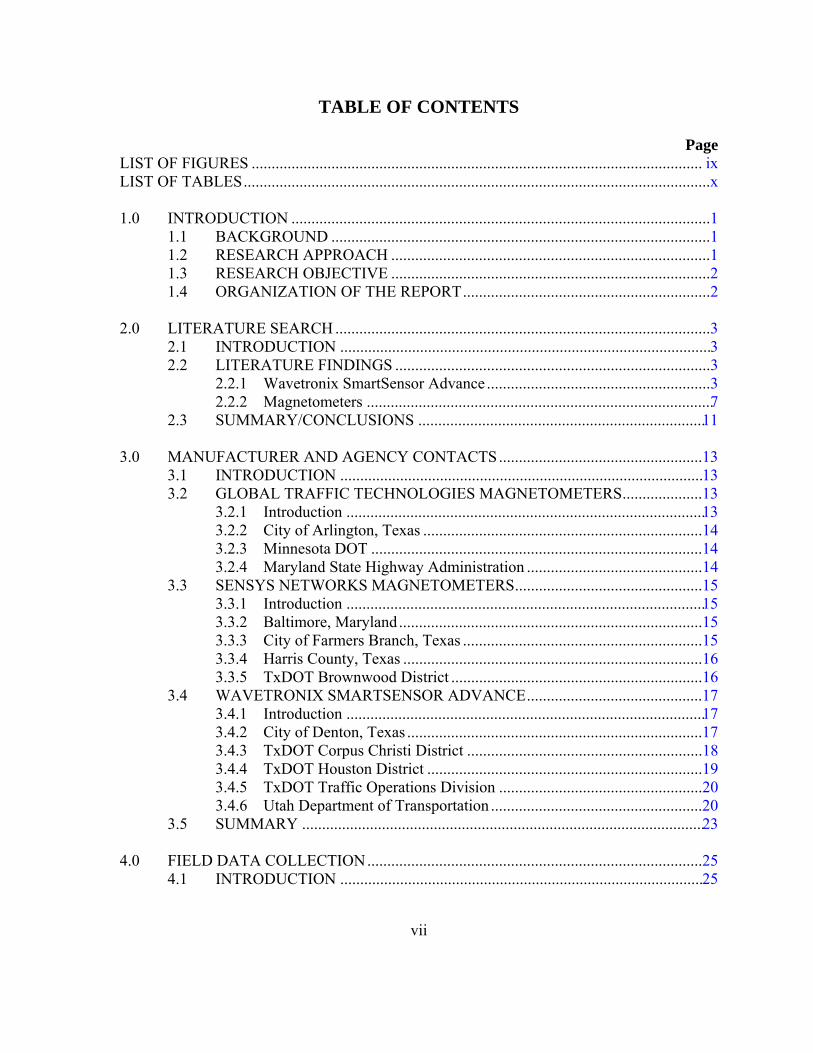
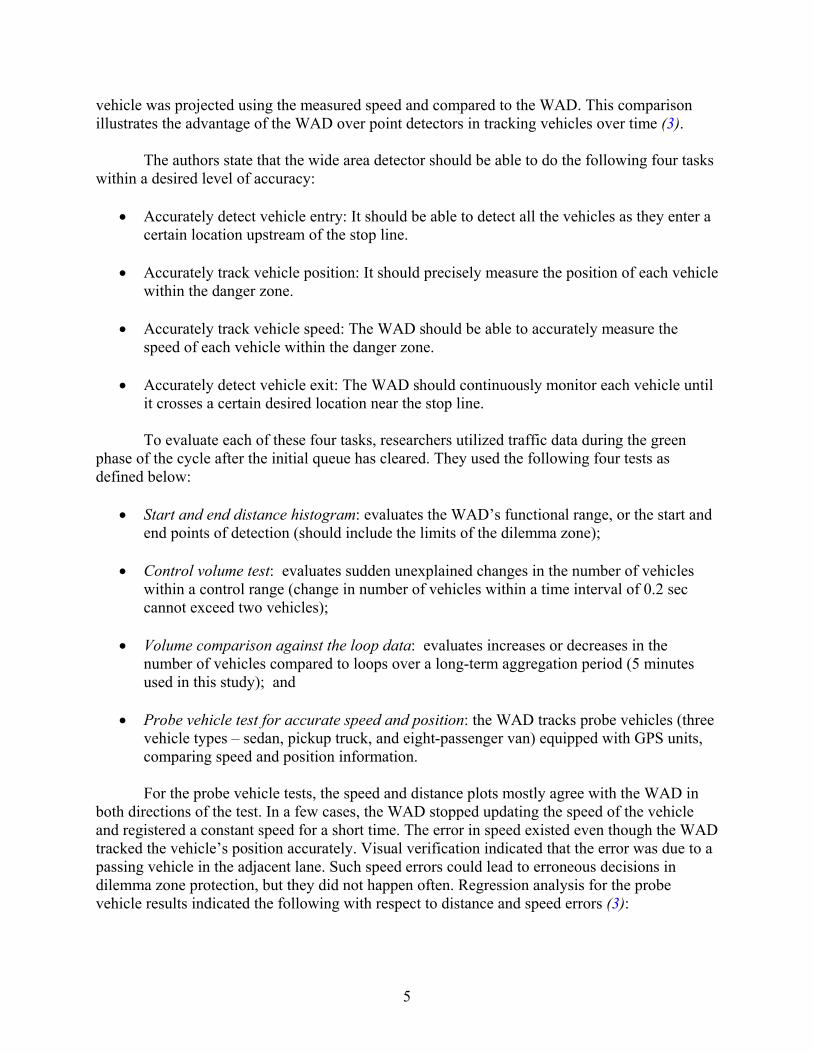
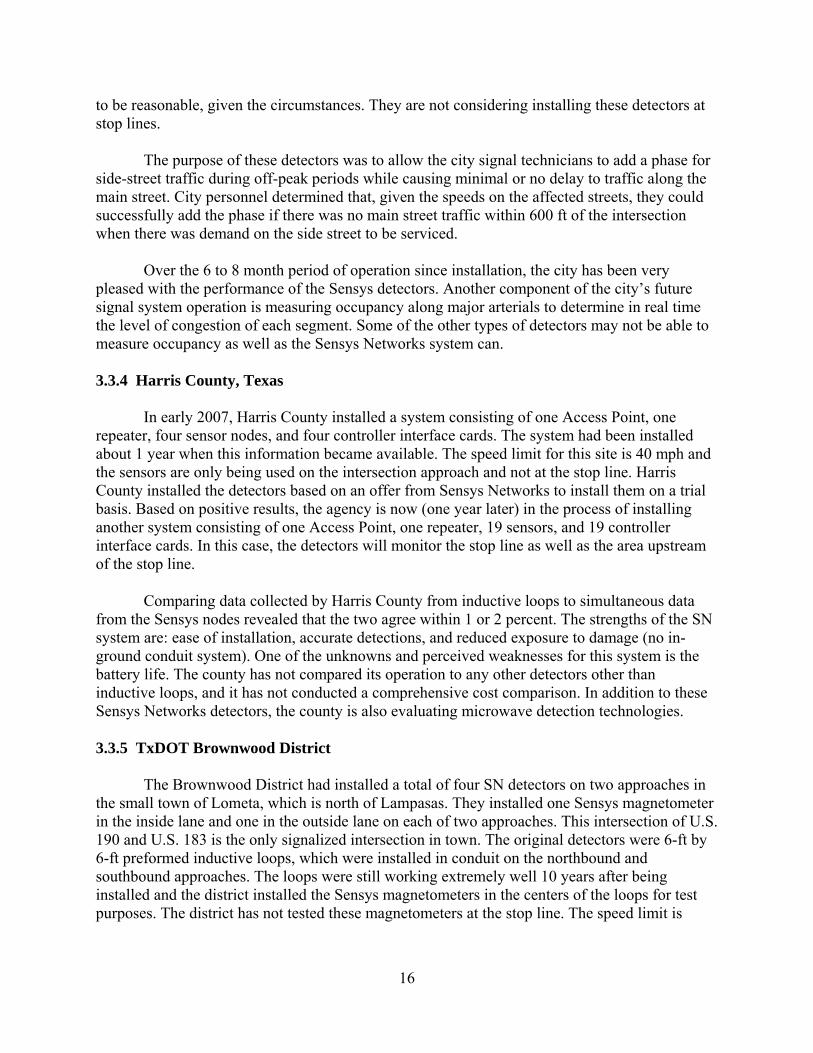
always within 5 percent of true counts. In less demanding conditions, it was always within 1 to 2 percent of true counts. Figure 3 shows speed plotted as a solid line and presence detection accuracy as 15-minute averages. Its inaccuracy was manifest as overcounts due to double-counting combination trucks at very slow speeds. This double counting would be of little or no significance at signalized intersections (1).
-20%
-15%
-10%
-5%
0%
5%
10%
15%
20%
7:00 7:15 7:30 7:45 8:00 8:15 8:30 8:45 9:00Time
% E
rror
from
Bas
elin
e
5
10
15
20
25
30
35
40
45
50
55
60
65
15 m
in a
ve S
peed
(mph
)
Sensys Baseline
Source: Reference (1). Figure 3. Magnetometer Count Accuracy, Lane 2, 7 a.m. to 9 a.m., February 2, 2006.
One negative aspect of the magnetometer system must also be acknowledged, and that is
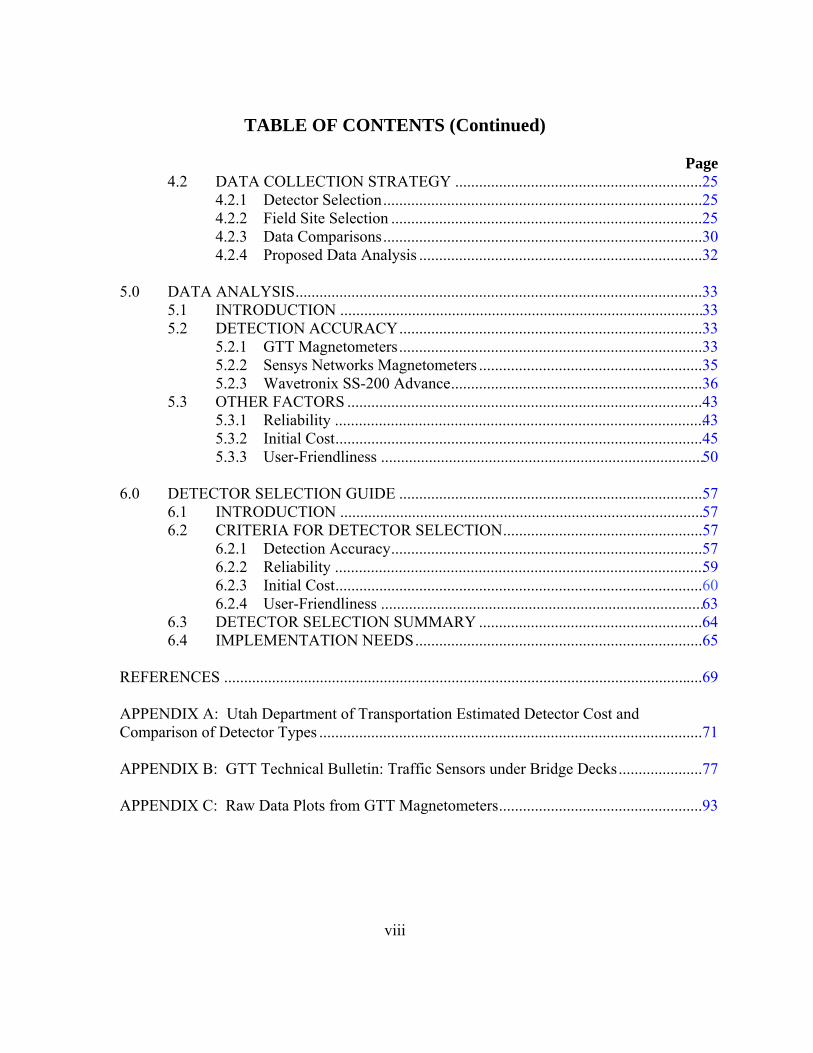
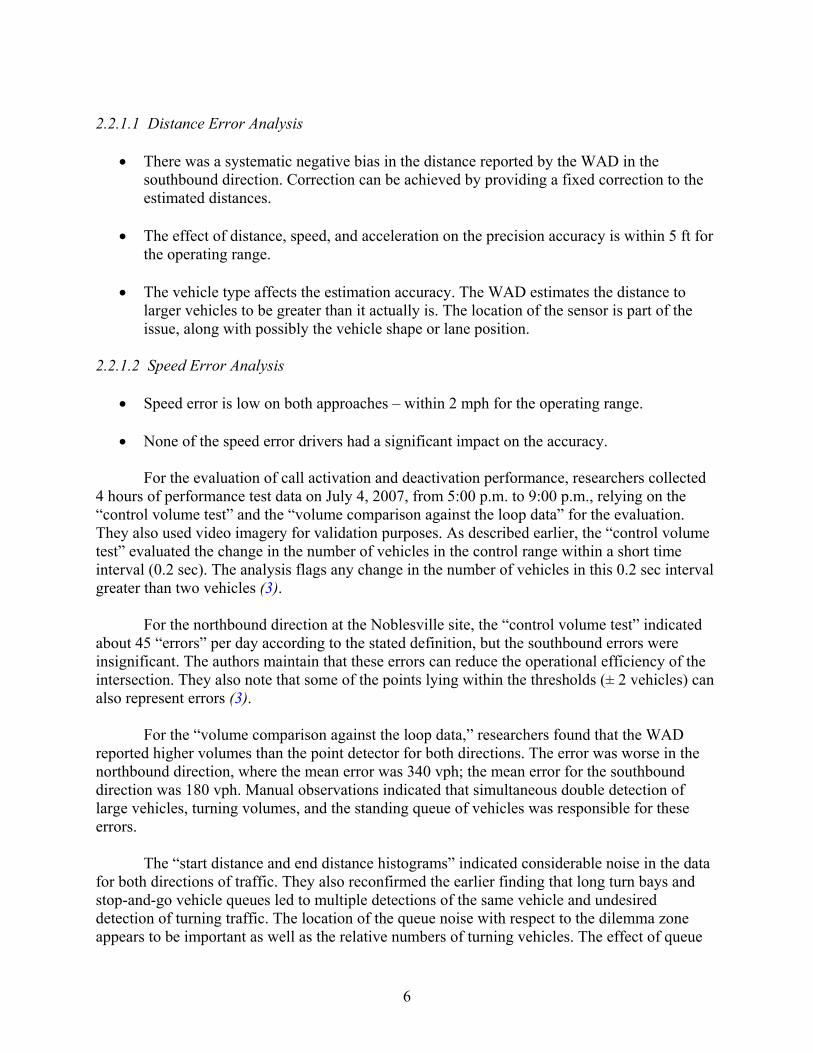
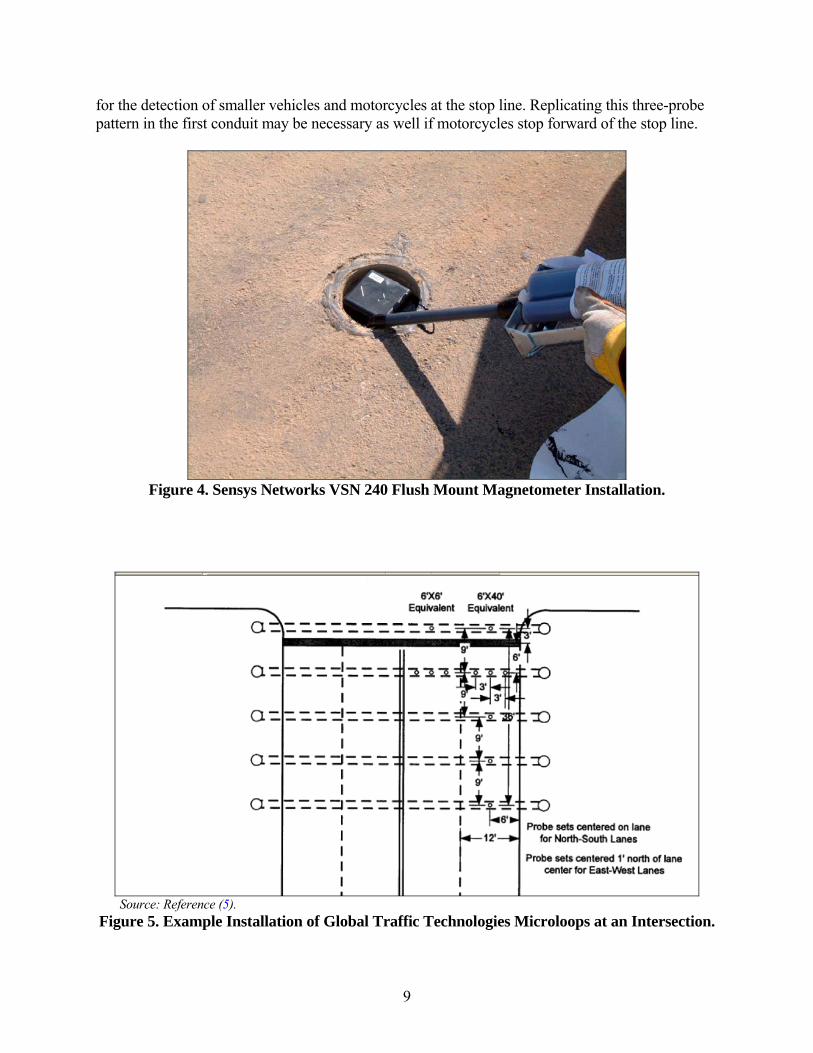
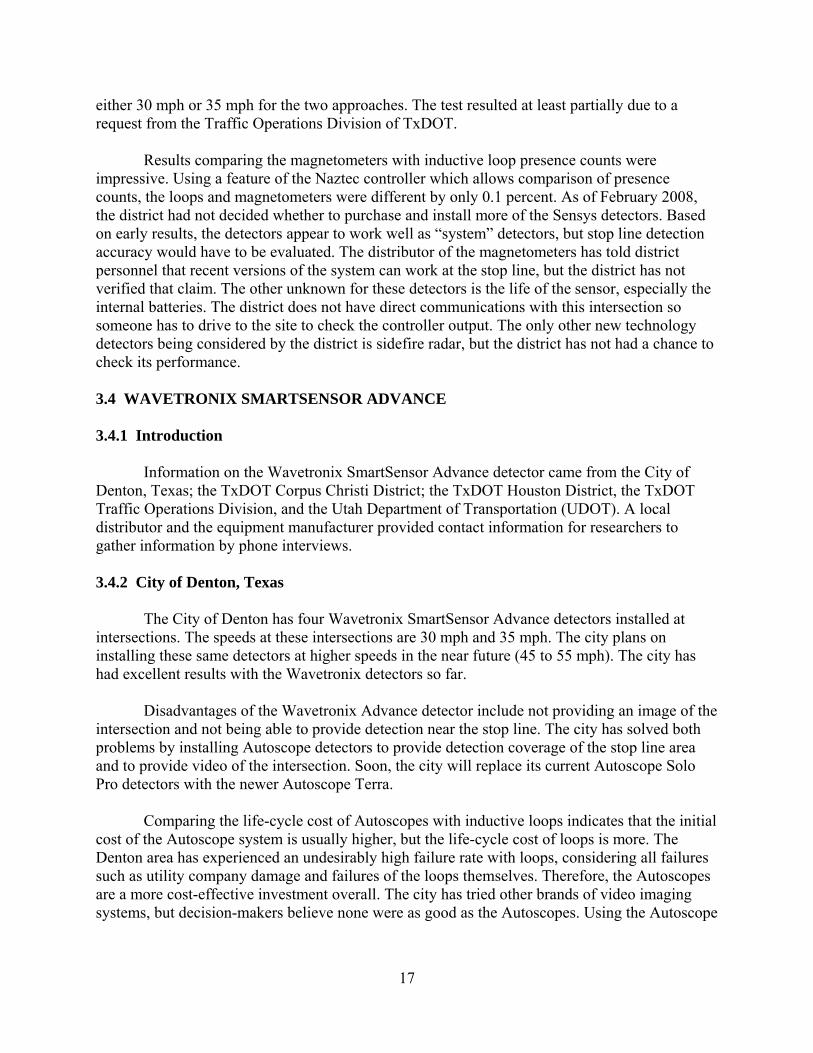
the need to close lanes for installation and replacement of the sensors. Installing each sensor only takes about 30 minutes and requires coring and extracting a small cylindrical-shaped core of pavement and backfilling around the sensor with a recommended epoxy. Figure 4 shows the sensor and the backfilling process. TTI has installed these sensors at two freeway field labs (I-35 in Austin and S.H. 6 in College Station). According to the manufacturer, the battery life range is from 8.5 to 13 years, so unless a major failure occurs inside the SN, the sensor’s life-cycle costs should be similar to that of its competitors. In case of failure, a major cost will be for traffic control to close the lane.
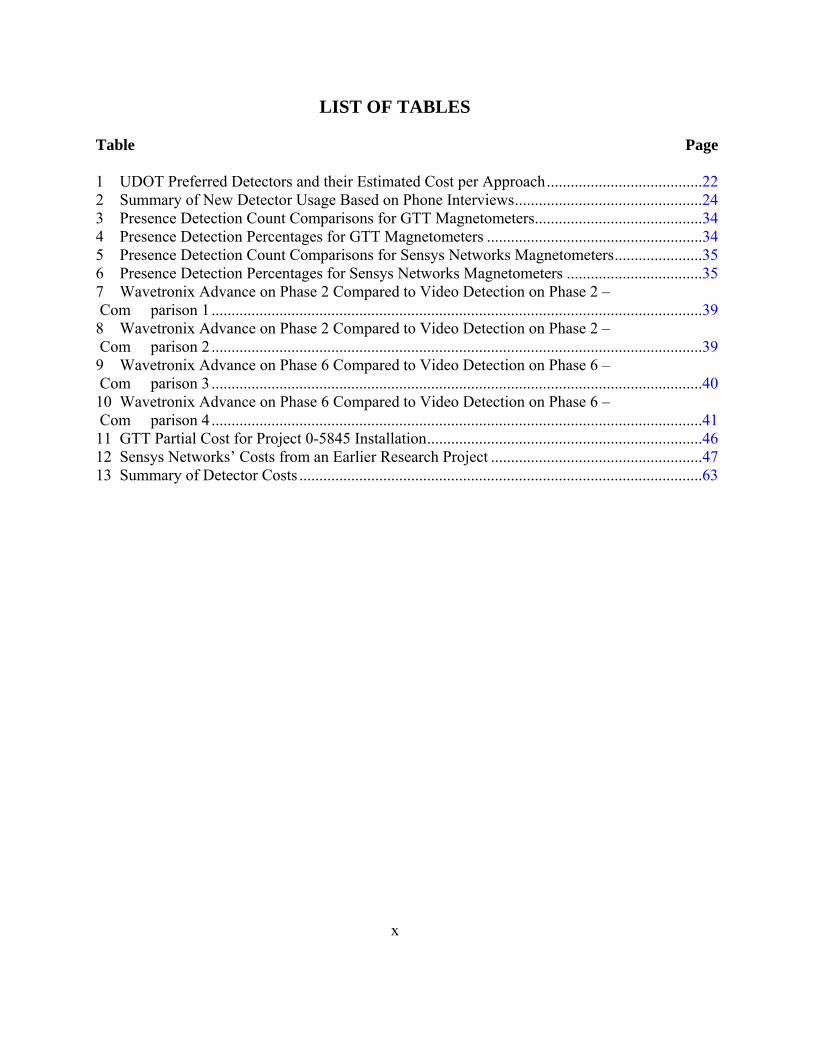
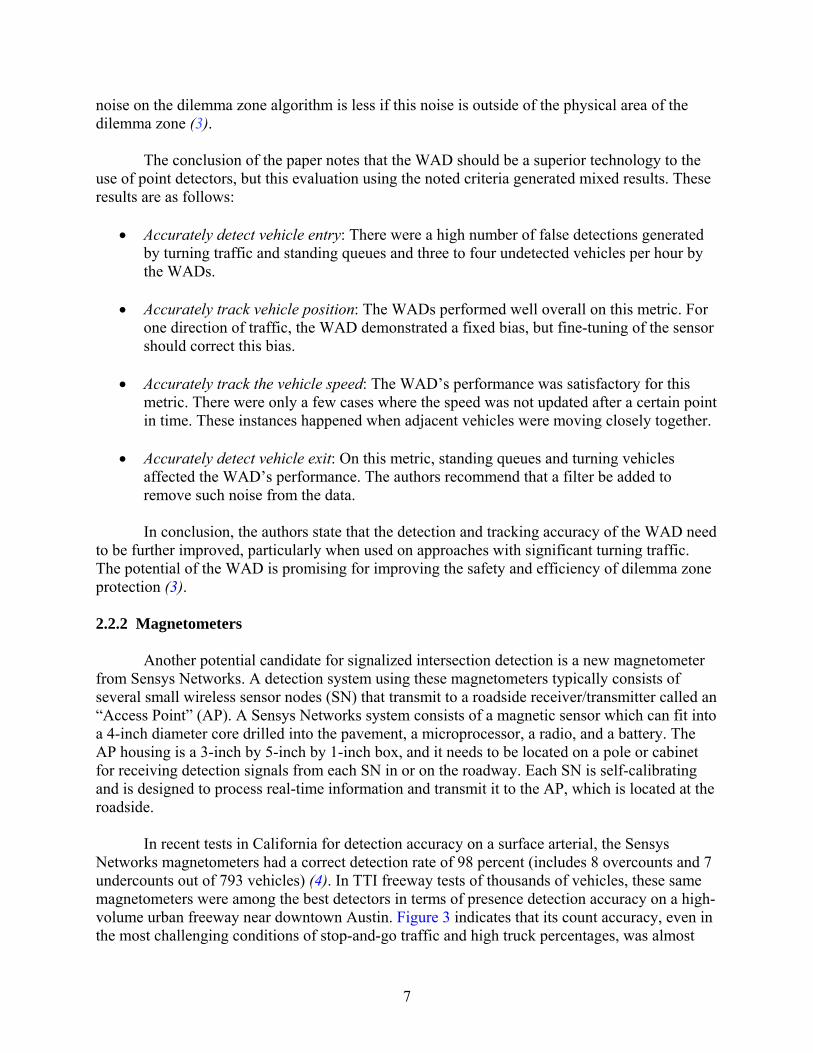
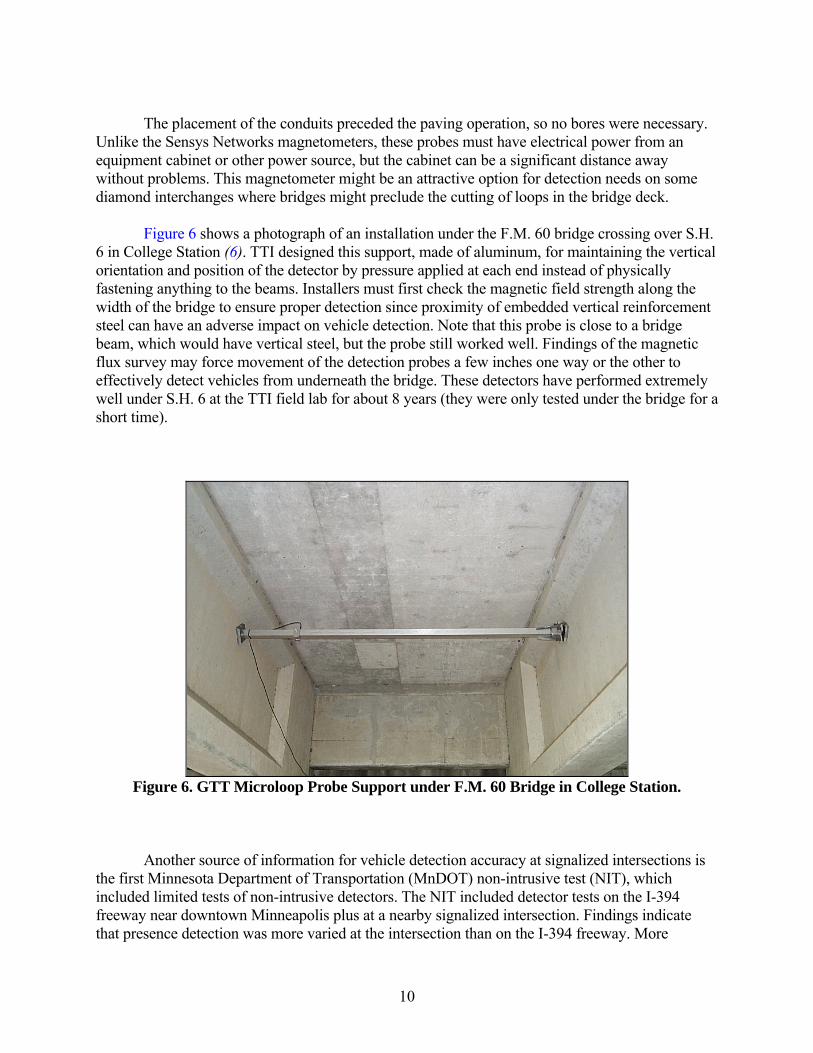
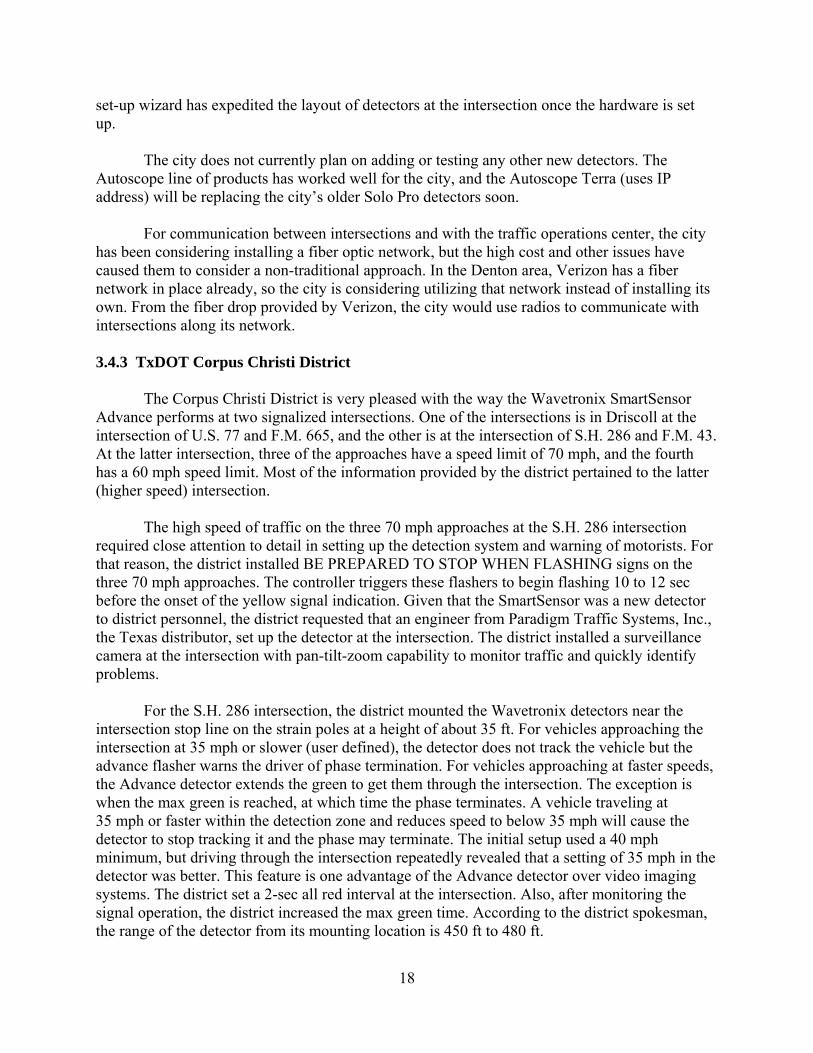
A second magnetometer by Global Traffic Technologies (previously 3M) has indicated promising results on freeways and at intersections. It can either be installed in a horizontal bore underneath the roadway or under a bridge structure. One recent installation in the Philadelphia area placed the rows of detectors 9 ft apart longitudinally at the stop line to replicate a 6-ft by 40-ft inductive loop. Figure 5 shows that the first 3-inch conduit is located 3 ft past the stop line, and the spacing on remaining conduits is 9 ft (5). Note that the second conduit houses three probes per lane
9
for the detection of smaller vehicles and motorcycles at the stop line. Replicating this three-probe pattern in the first conduit may be necessary as well if motorcycles stop forward of the stop line.
Figure 4. Sensys Networks VSN 240 Flush Mount Magnetometer Installation.
Source: Reference (5).
Figure 5. Example Installation of Global Traffic Technologies Microloops at an Intersection.
10
The placement of the conduits preceded the paving operation, so no bores were necessary.
Unlike the Sensys Networks magnetometers, these probes must have electrical power from an equipment cabinet or other power source, but the cabinet can be a significant distance away without problems. This magnetometer might be an attractive option for detection needs on some diamond interchanges where bridges might preclude the cutting of loops in the bridge deck.
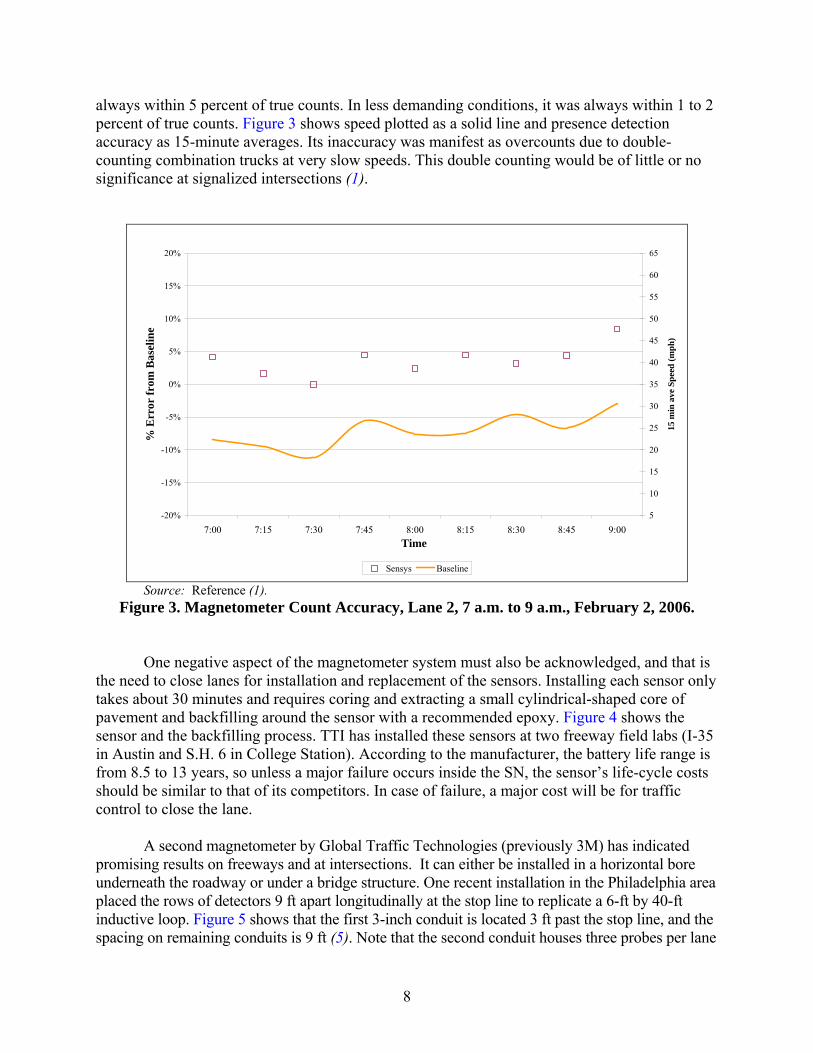
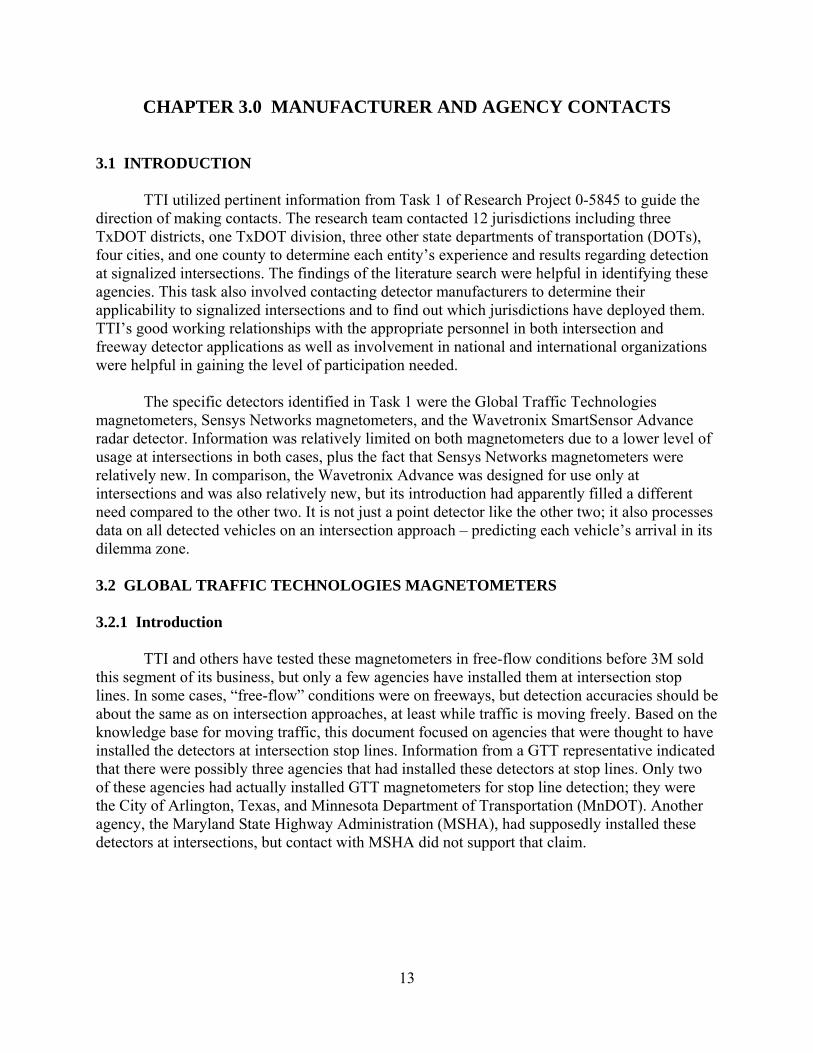
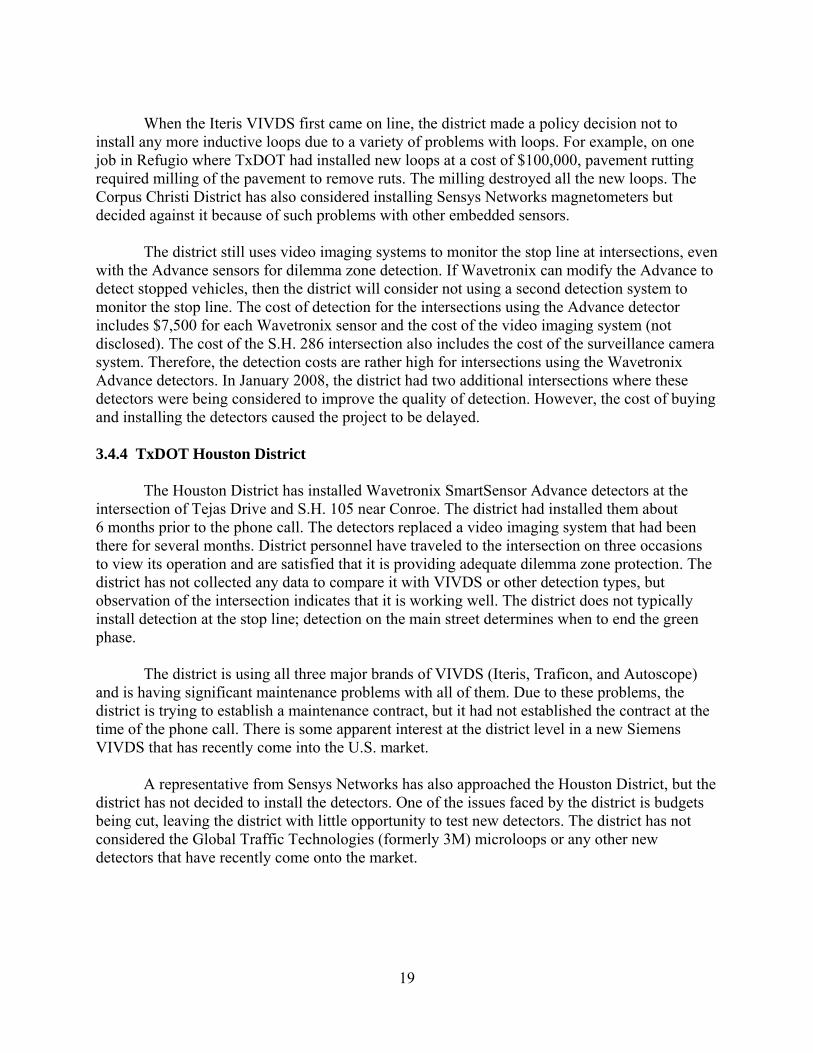
Figure 6 shows a photograph of an installation under the F.M. 60 bridge crossing over S.H.
6 in College Station (6). TTI designed this support, made of aluminum, for maintaining the vertical orientation and position of the detector by pressure applied at each end instead of physically fastening anything to the beams. Installers must first check the magnetic field strength along the width of the bridge to ensure proper detection since proximity of embedded vertical reinforcement steel can have an adverse impact on vehicle detection. Note that this probe is close to a bridge beam, which would have vertical steel, but the probe still worked well. Findings of the magnetic flux survey may force movement of the detection probes a few inches one way or the other to effectively detect vehicles from underneath the bridge. These detectors have performed extremely well under S.H. 6 at the TTI field lab for about 8 years (they were only tested under the bridge for a short time).
Figure 6. GTT Microloop Probe Support under F.M. 60 Bridge in College Station.
Another source of information for vehicle detection accuracy at signalized intersections is the first Minnesota Department of Transportation (MnDOT) non-intrusive test (NIT), which included limited tests of non-intrusive detectors. The NIT included detector tests on the I-394 freeway near downtown Minneapolis plus at a nearby signalized intersection. Findings indicate that presence detection was more varied at the intersection than on the I-394 freeway. More

11
specifically, the pulse ultrasonic, passive acoustic, and VIVDS were generally within 10 percent of baseline volume data while one of the passive infrared devices was within 5 percent (7).
During phase I of the NIT, the ASIM IR 224 had the best overall results of any detector at the intersection. One set of results indicated a correlation coefficient very close to 1.000, indicating a high degree of reliability from one time period to the next. However, on another occasion, manual observation indicated the device only detected 27 out of 50 vehicles. Research documentation did not attempt to determine the reason for this inconsistency (8).
2.3 SUMMARY/CONCLUSIONS Based on the literature review, the Wavetronix SmartSensor Advance as well as the two magnetometers are worthy of further investigation. Research at Purdue University on the SmartSensor Advance indicates that it has advantages over point detectors, and this early look at its performance characteristics indicates that it is worth installing in Texas for further observation (3). There are some additional measures of effectiveness (MOEs) not included in the Purdue research that need to be considered in Research Project 0-5845. Positive attributes of this detector are its ease of installation and setup and its ability to monitor up to three lanes of traffic non-intrusively. A negative attribute is that it does not cover the stop line area of the intersection, requiring a second detector type on each approach if stop line detection is needed.
The two magnetometers may also be appropriate for intersection applications. TTI has included both in freeway research with favorable results (1). Positive attributes of the Sensys Networks magnetometers are quick installation time (short lane closures), accuracy approaching that of inductive loops, and less damage to pavement compared to loops. The most significant negative aspect is the requirement to close lanes for installation and replacement of the sensor nodes. Microloops from Global Traffic Technologies are about as accurate as loops and require little interference with traffic, but usually require horizontal boring for initial installation under pavement. If boring is required, the initial cost may be higher than other options.

13
CHAPTER 3.0 MANUFACTURER AND AGENCY CONTACTS 3.1 INTRODUCTION
TTI utilized pertinent information from Task 1 of Research Project 0-5845 to guide the direction of making contacts. The research team contacted 12 jurisdictions including three TxDOT districts, one TxDOT division, three other state departments of transportation (DOTs), four cities, and one county to determine each entity’s experience and results regarding detection at signalized intersections. The findings of the literature search were helpful in identifying these agencies. This task also involved contacting detector manufacturers to determine their applicability to signalized intersections and to find out which jurisdictions have deployed them. TTI’s good working relationships with the appropriate personnel in both intersection and freeway detector applications as well as involvement in national and international organizations were helpful in gaining the level of participation needed.
The specific detectors identified in Task 1 were the Global Traffic Technologies magnetometers, Sensys Networks magnetometers, and the Wavetronix SmartSensor Advance radar detector. Information was relatively limited on both magnetometers due to a lower level of usage at intersections in both cases, plus the fact that Sensys Networks magnetometers were relatively new. In comparison, the Wavetronix Advance was designed for use only at intersections and was also relatively new, but its introduction had apparently filled a different need compared to the other two. It is not just a point detector like the other two; it also processes data on all detected vehicles on an intersection approach – predicting each vehicle’s arrival in its dilemma zone. 3.2 GLOBAL TRAFFIC TECHNOLOGIES MAGNETOMETERS 3.2.1 Introduction
TTI and others have tested these magnetometers in free-flow conditions before 3M sold this segment of its business, but only a few agencies have installed them at intersection stop lines. In some cases, “free-flow” conditions were on freeways, but detection accuracies should be about the same as on intersection approaches, at least while traffic is moving freely. Based on the knowledge base for moving traffic, this document focused on agencies that were thought to have installed the detectors at intersection stop lines. Information from a GTT representative indicated that there were possibly three agencies that had installed these detectors at stop lines. Only two of these agencies had actually installed GTT magnetometers for stop line detection; they were the City of Arlington, Texas, and Minnesota Department of Transportation (MnDOT). Another agency, the Maryland State Highway Administration (MSHA), had supposedly installed these detectors at intersections, but contact with MSHA did not support that claim.
14
3.2.2 City of Arlington, Texas
City of Arlington employees indicated that the city had, at one time, installed these detectors at one intersection, but the detectors stopped working and the city discontinued the use of microloops. The person who would have had more information no longer worked for the city. 3.2.3 Minnesota DOT
MnDOT is no longer using GTT microloops at signalized intersections. The ones installed in the twin cities area were installed around 2000, but MnDOT did not like the detectors for two reasons. One was the relatively high cost of the detection system, and the second was that the probes could not be tested using some of the standard MnDOT equipment. For example, MnDOT personnel like to use a “megger” to test standard inductive loops, but the use of a megger could damage microloops. Another consideration was that the microloops required a special detector card in the cabinet (apparently for stop line detection). One could infer from the information provided that the accuracy of the detectors was not the reason for discontinuing their use. 3.2.4 Maryland State Highway Administration
The Maryland State Highway Administration is using GTT non-invasive microloops on intersection approaches around the state. Of the approximately 2700 signalized intersections maintained by the MSHA, about 1700 of them have a mixture of GTT non-invasive probes or other surface-mount detectors (e.g., loops) on intersection approaches, but not at the stop line. For stop line detection, the MSHA typically uses video imaging systems and uses almost exclusively the Autoscope Solo Pro. The video systems provide adequate stop line detection with few exceptions, mostly consisting of an occasional false call. One feature of video that state personnel hope to exploit soon is its ability to generate a near-real-time video image of the intersection via a fiber network. The current MSHA specification calls for video for presence detection at the stop line and non-invasive GTT microloop probes for advance detection.
Use of these non-invasive probes at/near the stop line would not be feasible, according to the Maryland Chief of Signal Operations. When the state used inductive loops for presence detection at the stop line, it used 6-ft by 30-ft loops in a quadrapole configuration. Using GTT probes as a replacement for this long loop would require too many probes to be feasible.
The MSHA installed some of the early probes by drilling vertically from the surface. The agency also installed a few under bridges, and they seemed to perform well. Today, they install the probes exclusively in horizontal polyvinyl chloride PVC using triple probe sets in each lane for advance detection. The only adjustments needed for some sites occur when vehicles travel slowly over the detectors, necessitating the use of the “extend” function in the detector cards for 1 to 2 sec to replicate a 6-ft by 6-ft loop. The current MSHA policy is not to install surface-mount sensors, which would preclude magnetometers from Sensys Networks.

15
3.3 SENSYS NETWORKS MAGNETOMETERS 3.3.1 Introduction
Information on the Sensys Networks magnetometers came primarily from phone interviews, but one source of information was an article sent by the Director of Sales and Business Development located in Austin, Texas. The article described an installation in Baltimore, Maryland. This Sensys representative provided contact information for subsequent phone interviews by research personnel. TTI made phone calls to the City of Farmers Branch, Texas; Harris County, Texas; and the TxDOT Brownwood District. Like the GTT magnetometers, agencies have installed these magnetometers at a number of freeway locations, so decision-makers know their performance under those conditions better than at intersection stop lines. Therefore, identification of contacts and the interviews placed more emphasis on stop line detection than on setback (advanced) detection. Even so, agencies found to have used these magnetometers at stop lines were limited. 3.3.2 Baltimore, Maryland
Information for the Baltimore installation of Sensys Networks detectors came from the manufacturer and not directly from the Baltimore City Department of Transportation. The city installed these detectors at the stop line of minor street intersections along a 1-mile stretch of Edmondson Avenue just west of Gwynns Falls Park. The arterial is a major east-west route west of the city center and is the route along which U.S. 40 enters the city.
The project to install Sensys detectors involved 12 intersections and the installation of 54 flush-mount sensors, with one or two sensors installed at the stop line in each lane in May 2007. The project required 12 Access Points connected to 12 National Electrical Manufacturers Association (NEMA) TS2 traffic signal controllers. The information provided by Sensys Networks indicated that the system’s cost effectiveness, flexibility, and ease of installation resulted in additional requisitions for the deployment of more than 50 additional intersections using this same detection system. A quote from the signal electronics superintendent indicated that the city was able to install the new detectors at the 12 intersections without expensive infrastructure or cabling upgrades. He stated that the savings in time and materials were “tremendous.” The average field installation time required per intersection was about 3 hours. 3.3.3 City of Farmers Branch, Texas
Around July 2007 (6 to 8 months before the phone interview), the City of Farmers Branch installed a system of Sensys Networks detectors to monitor mid-block traffic on the approaches to the intersection of Webb Chapel Road and Golfing Green Drive. Webb Chapel Road is a major north-south arterial and Golfing Green Drive is a minor street, which forms a four-way intersection. The system includes six nodes and two repeaters. The feature that attracted the city to the Sensys Networks system was being able to communicate wirelessly with the cabinet and avoid the high cost of installing conduit over a distance of 600 ft from the intersection on the affected approaches. City decision-makers considered the cost of the system
16
to be reasonable, given the circumstances. They are not considering installing these detectors at stop lines.
The purpose of these detectors was to allow the city signal technicians to add a phase for
side-street traffic during off-peak periods while causing minimal or no delay to traffic along the main street. City personnel determined that, given the speeds on the affected streets, they could successfully add the phase if there was no main street traffic within 600 ft of the intersection when there was demand on the side street to be serviced.
Over the 6 to 8 month period of operation since installation, the city has been very
pleased with the performance of the Sensys detectors. Another component of the city’s future signal system operation is measuring occupancy along major arterials to determine in real time the level of congestion of each segment. Some of the other types of detectors may not be able to measure occupancy as well as the Sensys Networks system can. 3.3.4 Harris County, Texas
In early 2007, Harris County installed a system consisting of one Access Point, one repeater, four sensor nodes, and four controller interface cards. The system had been installed about 1 year when this information became available. The speed limit for this site is 40 mph and the sensors are only being used on the intersection approach and not at the stop line. Harris County installed the detectors based on an offer from Sensys Networks to install them on a trial basis. Based on positive results, the agency is now (one year later) in the process of installing another system consisting of one Access Point, one repeater, 19 sensors, and 19 controller interface cards. In this case, the detectors will monitor the stop line as well as the area upstream of the stop line.
Comparing data collected by Harris County from inductive loops to simultaneous data from the Sensys nodes revealed that the two agree within 1 or 2 percent. The strengths of the SN system are: ease of installation, accurate detections, and reduced exposure to damage (no in-ground conduit system). One of the unknowns and perceived weaknesses for this system is the battery life. The county has not compared its operation to any other detectors other than inductive loops, and it has not conducted a comprehensive cost comparison. In addition to these Sensys Networks detectors, the county is also evaluating microwave detection technologies.
3.3.5 TxDOT Brownwood District
The Brownwood District had installed a total of four SN detectors on two approaches in the small town of Lometa, which is north of Lampasas. They installed one Sensys magnetometer in the inside lane and one in the outside lane on each of two approaches. This intersection of U.S. 190 and U.S. 183 is the only signalized intersection in town. The original detectors were 6-ft by 6-ft preformed inductive loops, which were installed in conduit on the northbound and southbound approaches. The loops were still working extremely well 10 years after being installed and the district installed the Sensys magnetometers in the centers of the loops for test purposes. The district has not tested these magnetometers at the stop line. The speed limit is
17
either 30 mph or 35 mph for the two approaches. The test resulted at least partially due to a request from the Traffic Operations Division of TxDOT.
Results comparing the magnetometers with inductive loop presence counts were impressive. Using a feature of the Naztec controller which allows comparison of presence counts, the loops and magnetometers were different by only 0.1 percent. As of February 2008, the district had not decided whether to purchase and install more of the Sensys detectors. Based on early results, the detectors appear to work well as “system” detectors, but stop line detection accuracy would have to be evaluated. The distributor of the magnetometers has told district personnel that recent versions of the system can work at the stop line, but the district has not verified that claim. The other unknown for these detectors is the life of the sensor, especially the internal batteries. The district does not have direct communications with this intersection so someone has to drive to the site to check the controller output. The only other new technology detectors being considered by the district is sidefire radar, but the district has not had a chance to check its performance. 3.4 WAVETRONIX SMARTSENSOR ADVANCE 3.4.1 Introduction
Information on the Wavetronix SmartSensor Advance detector came from the City of Denton, Texas; the TxDOT Corpus Christi District; the TxDOT Houston District, the TxDOT Traffic Operations Division, and the Utah Department of Transportation (UDOT). A local distributor and the equipment manufacturer provided contact information for researchers to gather information by phone interviews. 3.4.2 City of Denton, Texas
The City of Denton has four Wavetronix SmartSensor Advance detectors installed at intersections. The speeds at these intersections are 30 mph and 35 mph. The city plans on installing these same detectors at higher speeds in the near future (45 to 55 mph). The city has had excellent results with the Wavetronix detectors so far.
Disadvantages of the Wavetronix Advance detector include not providing an image of the intersection and not being able to provide detection near the stop line. The city has solved both problems by installing Autoscope detectors to provide detection coverage of the stop line area and to provide video of the intersection. Soon, the city will replace its current Autoscope Solo Pro detectors with the newer Autoscope Terra.
Comparing the life-cycle cost of Autoscopes with inductive loops indicates that the initial cost of the Autoscope system is usually higher, but the life-cycle cost of loops is more. The Denton area has experienced an undesirably high failure rate with loops, considering all failures such as utility company damage and failures of the loops themselves. Therefore, the Autoscopes are a more cost-effective investment overall. The city has tried other brands of video imaging systems, but decision-makers believe none were as good as the Autoscopes. Using the Autoscope
18
set-up wizard has expedited the layout of detectors at the intersection once the hardware is set up.
The city does not currently plan on adding or testing any other new detectors. The Autoscope line of products has worked well for the city, and the Autoscope Terra (uses IP address) will be replacing the city’s older Solo Pro detectors soon.
For communication between intersections and with the traffic operations center, the city has been considering installing a fiber optic network, but the high cost and other issues have caused them to consider a non-traditional approach. In the Denton area, Verizon has a fiber network in place already, so the city is considering utilizing that network instead of installing its own. From the fiber drop provided by Verizon, the city would use radios to communicate with intersections along its network. 3.4.3 TxDOT Corpus Christi District
The Corpus Christi District is very pleased with the way the Wavetronix SmartSensor Advance performs at two signalized intersections. One of the intersections is in Driscoll at the intersection of U.S. 77 and F.M. 665, and the other is at the intersection of S.H. 286 and F.M. 43. At the latter intersection, three of the approaches have a speed limit of 70 mph, and the fourth has a 60 mph speed limit. Most of the information provided by the district pertained to the latter (higher speed) intersection.
The high speed of traffic on the three 70 mph approaches at the S.H. 286 intersection required close attention to detail in setting up the detection system and warning of motorists. For that reason, the district installed BE PREPARED TO STOP WHEN FLASHING signs on the three 70 mph approaches. The controller triggers these flashers to begin flashing 10 to 12 sec before the onset of the yellow signal indication. Given that the SmartSensor was a new detector to district personnel, the district requested that an engineer from Paradigm Traffic Systems, Inc., the Texas distributor, set up the detector at the intersection. The district installed a surveillance camera at the intersection with pan-tilt-zoom capability to monitor traffic and quickly identify problems.
For the S.H. 286 intersection, the district mounted the Wavetronix detectors near the intersection stop line on the strain poles at a height of about 35 ft. For vehicles approaching the intersection at 35 mph or slower (user defined), the detector does not track the vehicle but the advance flasher warns the driver of phase termination. For vehicles approaching at faster speeds, the Advance detector extends the green to get them through the intersection. The exception is when the max green is reached, at which time the phase terminates. A vehicle traveling at 35 mph or faster within the detection zone and reduces speed to below 35 mph will cause the detector to stop tracking it and the phase may terminate. The initial setup used a 40 mph minimum, but driving through the intersection repeatedly revealed that a setting of 35 mph in the detector was better. This feature is one advantage of the Advance detector over video imaging systems. The district set a 2-sec all red interval at the intersection. Also, after monitoring the signal operation, the district increased the max green time. According to the district spokesman, the range of the detector from its mounting location is 450 ft to 480 ft.
19
When the Iteris VIVDS first came on line, the district made a policy decision not to
install any more inductive loops due to a variety of problems with loops. For example, on one job in Refugio where TxDOT had installed new loops at a cost of $100,000, pavement rutting required milling of the pavement to remove ruts. The milling destroyed all the new loops. The Corpus Christi District has also considered installing Sensys Networks magnetometers but decided against it because of such problems with other embedded sensors.
The district still uses video imaging systems to monitor the stop line at intersections, even with the Advance sensors for dilemma zone detection. If Wavetronix can modify the Advance to detect stopped vehicles, then the district will consider not using a second detection system to monitor the stop line. The cost of detection for the intersections using the Advance detector includes $7,500 for each Wavetronix sensor and the cost of the video imaging system (not disclosed). The cost of the S.H. 286 intersection also includes the cost of the surveillance camera system. Therefore, the detection costs are rather high for intersections using the Wavetronix Advance detectors. In January 2008, the district had two additional intersections where these detectors were being considered to improve the quality of detection. However, the cost of buying and installing the detectors caused the project to be delayed. 3.4.4 TxDOT Houston District
The Houston District has installed Wavetronix SmartSensor Advance detectors at the intersection of Tejas Drive and S.H. 105 near Conroe. The district had installed them about 6 months prior to the phone call. The detectors replaced a video imaging system that had been there for several months. District personnel have traveled to the intersection on three occasions to view its operation and are satisfied that it is providing adequate dilemma zone protection. The district has not collected any data to compare it with VIVDS or other detection types, but observation of the intersection indicates that it is working well. The district does not typically install detection at the stop line; detection on the main street determines when to end the green phase.
The district is using all three major brands of VIVDS (Iteris, Traficon, and Autoscope) and is having significant maintenance problems with all of them. Due to these problems, the district is trying to establish a maintenance contract, but it had not established the contract at the time of the phone call. There is some apparent interest at the district level in a new Siemens VIVDS that has recently come into the U.S. market.
A representative from Sensys Networks has also approached the Houston District, but the district has not decided to install the detectors. One of the issues faced by the district is budgets being cut, leaving the district with little opportunity to test new detectors. The district has not considered the Global Traffic Technologies (formerly 3M) microloops or any other new detectors that have recently come onto the market.

20
3.4.5 TxDOT Traffic Operations Division
A representative of the Traffic Operations Division (TRF) observed the installation of two Wavetronix Advance units in Austin at U.S. 290/Circle Drive (west of Austin). Even though he has not been involved in continued observation of the detectors, he had favorable comments regarding its ease of installation and features offered to the user. It basically detects vehicles over a distance of about 500 ft and offers eight detection zone segments. It allows the user to set certain parameters within each zone. The TRF representative supported the use of the technology, even though it requires the user to rethink how detection zones are established compared to multi-point detection. The technology may not be better than multi-point detection, but he considered it worth investigating for dilemma zone detection. 3.4.6 Utah Department of Transportation
The information from the Utah Department of Transportation came from the state’s signal systems engineer, who is located at the UDOT Traffic Management Center in Salt Lake City. As of February 2008, UDOT had installed 40 to 50 Wavetronix Advance detectors at signalized intersections around the state, with the first ones installed in October 2005. The state is planning on tripling this number by July 2008. There is no set policy on the speed range for these detectors to be used, but as a general rule, UDOT uses dilemma zone protection for speeds of 45 mph and greater, but it is also considered at sites with 40 mph design speed. UDOT considers the upper end of the speed range for the Advance to be 60 mph. UDOT is encouraging all of its regions to use only radar for dilemma zone detection, as decision-makers believe it is safer and more efficient than other methods they have considered.
UDOT uses stop line detection at most intersections. However, a growing trend within UDOT is not to use stop line detection on two phase intersections (those without left-turn phasing) where Wavetronix radar is used on the main street and where the phase is set to “min recall.” Two local intersections in Salt Lake City have performed well under this scenario. One of them initially had functioning loops that were subsequently disconnected and the other had no stop line detection at all. UDOT operates most of its main street (phases 2 and 6) on min recall with a typical minimum green ranging from 15 to 20 sec. Using an average vehicle length of 20 ft results in a queue length of 140 to 160 ft behind the stop line, which is well within the range of radar (100 to 500 ft from the sensor). However, radar cannot distinguish which lanes vehicles are in, so left turn phasing requires detection in the left turn lane.
UDOT initially installed Wavetronix radar because of the observed benefits in intersection safety and efficiency. These radar detectors replaced inductive loops that had been used in the past. UDOT had also used video detection, but video was limited in where it could be used effectively, referring to the 10:1 rule for camera mounting heights (i.e., 10 ft horizontal for each vertical ft of camera height). UDOT policy limits the use of video detection to speeds of 40 mph and under. For design speeds greater than 40 mph, UDOT has generally used loops for advance detection. As of about 5 years ago, UDOT changed its detection design to conform to that used by TxDOT, the Institute of Transportation Engineers, and the California Department of Transportation (multiple loops for dilemma zone protection and passage time appropriate for the selected speed range).
21
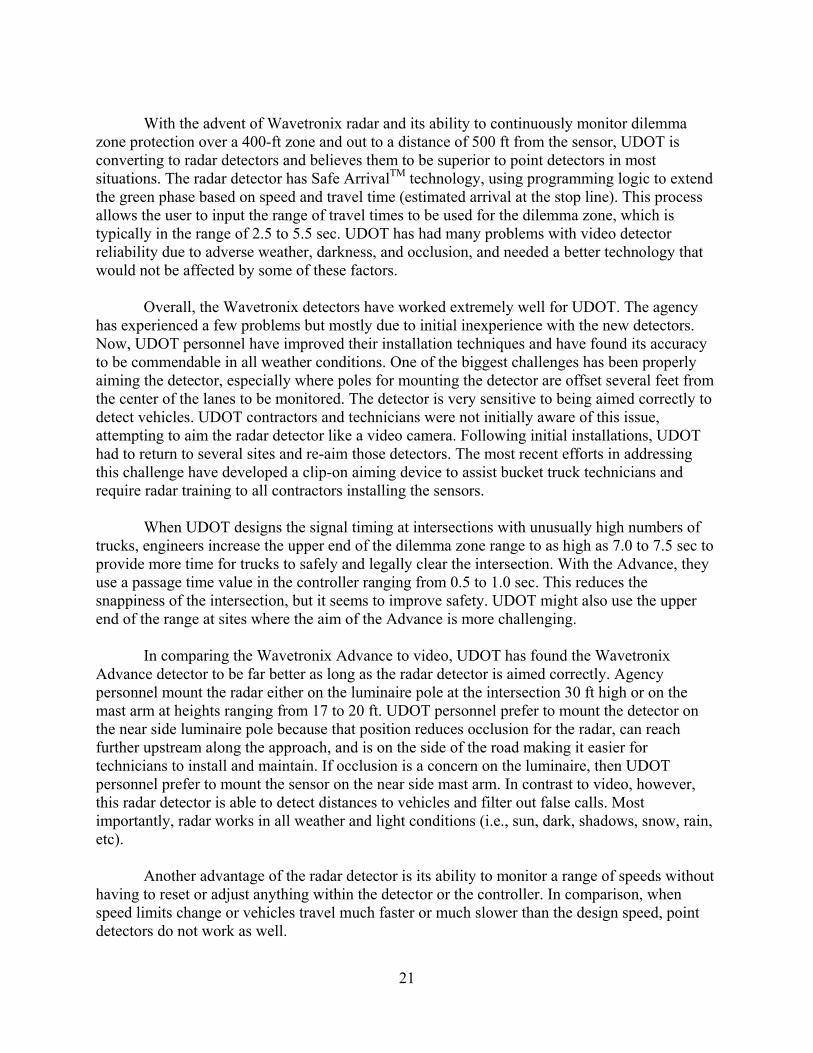
With the advent of Wavetronix radar and its ability to continuously monitor dilemma
zone protection over a 400-ft zone and out to a distance of 500 ft from the sensor, UDOT is converting to radar detectors and believes them to be superior to point detectors in most situations. The radar detector has Safe ArrivalTM technology, using programming logic to extend the green phase based on speed and travel time (estimated arrival at the stop line). This process allows the user to input the range of travel times to be used for the dilemma zone, which is typically in the range of 2.5 to 5.5 sec. UDOT has had many problems with video detector reliability due to adverse weather, darkness, and occlusion, and needed a better technology that would not be affected by some of these factors.
Overall, the Wavetronix detectors have worked extremely well for UDOT. The agency has experienced a few problems but mostly due to initial inexperience with the new detectors. Now, UDOT personnel have improved their installation techniques and have found its accuracy to be commendable in all weather conditions. One of the biggest challenges has been properly aiming the detector, especially where poles for mounting the detector are offset several feet from the center of the lanes to be monitored. The detector is very sensitive to being aimed correctly to detect vehicles. UDOT contractors and technicians were not initially aware of this issue, attempting to aim the radar detector like a video camera. Following initial installations, UDOT had to return to several sites and re-aim those detectors. The most recent efforts in addressing this challenge have developed a clip-on aiming device to assist bucket truck technicians and require radar training to all contractors installing the sensors.
When UDOT designs the signal timing at intersections with unusually high numbers of trucks, engineers increase the upper end of the dilemma zone range to as high as 7.0 to 7.5 sec to provide more time for trucks to safely and legally clear the intersection. With the Advance, they use a passage time value in the controller ranging from 0.5 to 1.0 sec. This reduces the snappiness of the intersection, but it seems to improve safety. UDOT might also use the upper end of the range at sites where the aim of the Advance is more challenging.
In comparing the Wavetronix Advance to video, UDOT has found the Wavetronix Advance detector to be far better as long as the radar detector is aimed correctly. Agency personnel mount the radar either on the luminaire pole at the intersection 30 ft high or on the mast arm at heights ranging from 17 to 20 ft. UDOT personnel prefer to mount the detector on the near side luminaire pole because that position reduces occlusion for the radar, can reach further upstream along the approach, and is on the side of the road making it easier for technicians to install and maintain. If occlusion is a concern on the luminaire, then UDOT personnel prefer to mount the sensor on the near side mast arm. In contrast to video, however, this radar detector is able to detect distances to vehicles and filter out false calls. Most importantly, radar works in all weather and light conditions (i.e., sun, dark, shadows, snow, rain, etc).
Another advantage of the radar detector is its ability to monitor a range of speeds without having to reset or adjust anything within the detector or the controller. In comparison, when speed limits change or vehicles travel much faster or much slower than the design speed, point detectors do not work as well.
22
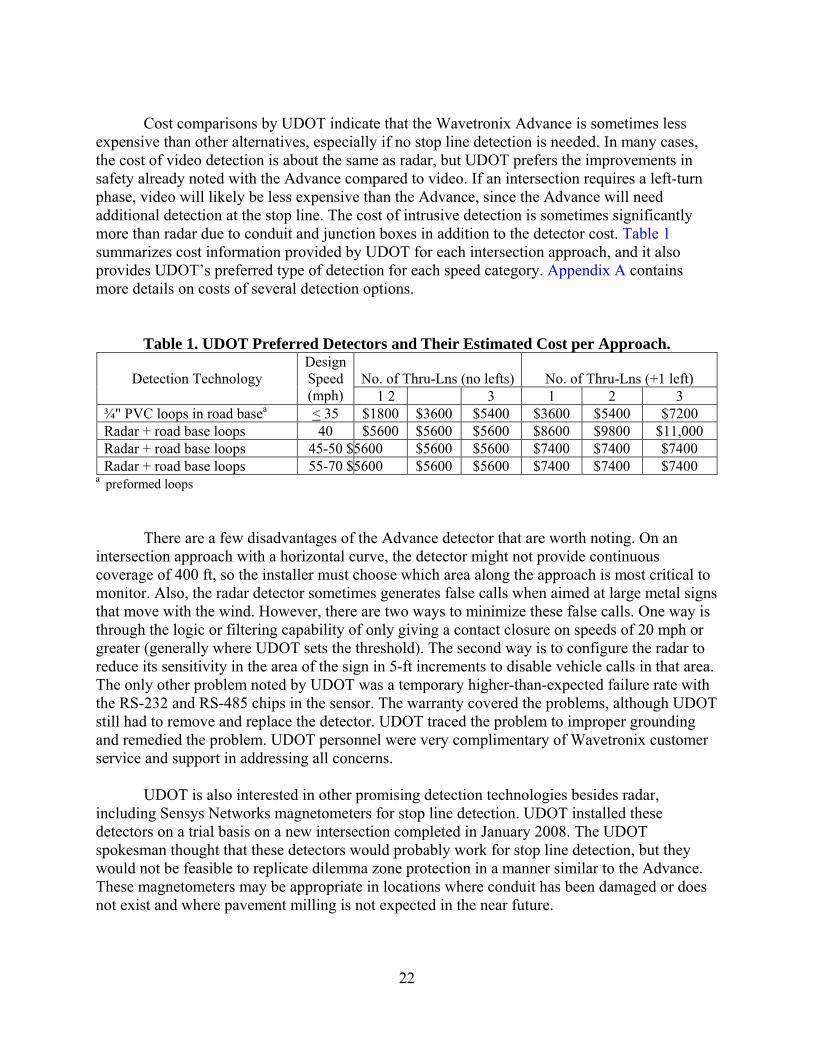
Cost comparisons by UDOT indicate that the Wavetronix Advance is sometimes less
expensive than other alternatives, especially if no stop line detection is needed. In many cases, the cost of video detection is about the same as radar, but UDOT prefers the improvements in safety already noted with the Advance compared to video. If an intersection requires a left-turn phase, video will likely be less expensive than the Advance, since the Advance will need additional detection at the stop line. The cost of intrusive detection is sometimes significantly more than radar due to conduit and junction boxes in addition to the detector cost. Table 1 summarizes cost information provided by UDOT for each intersection approach, and it also provides UDOT’s preferred type of detection for each speed category. Appendix A contains more details on costs of several detection options.
Table 1. UDOT Preferred Detectors and Their Estimated Cost per Approach.
Detection Technology
Design Speed (mph)
No. of Thru-Lns (no lefts)
No. of Thru-Lns (+1 left)
1 2 3 1 2 3 ¾" PVC loops in road basea < 35 $1800 $3600 $5400 $3600 $5400 $7200 Radar + road base loops 40 $5600 $5600 $5600 $8600 $9800 $11,000 Radar + road base loops 45-50 $5600 $5600 $5600 $7400 $7400 $7400 Radar + road base loops 55-70 $5600 $5600 $5600 $7400 $7400 $7400
a preformed loops
There are a few disadvantages of the Advance detector that are worth noting. On an intersection approach with a horizontal curve, the detector might not provide continuous coverage of 400 ft, so the installer must choose which area along the approach is most critical to monitor. Also, the radar detector sometimes generates false calls when aimed at large metal signs that move with the wind. However, there are two ways to minimize these false calls. One way is through the logic or filtering capability of only giving a contact closure on speeds of 20 mph or greater (generally where UDOT sets the threshold). The second way is to configure the radar to reduce its sensitivity in the area of the sign in 5-ft increments to disable vehicle calls in that area. The only other problem noted by UDOT was a temporary higher-than-expected failure rate with the RS-232 and RS-485 chips in the sensor. The warranty covered the problems, although UDOT still had to remove and replace the detector. UDOT traced the problem to improper grounding and remedied the problem. UDOT personnel were very complimentary of Wavetronix customer service and support in addressing all concerns.
UDOT is also interested in other promising detection technologies besides radar, including Sensys Networks magnetometers for stop line detection. UDOT installed these detectors on a trial basis on a new intersection completed in January 2008. The UDOT spokesman thought that these detectors would probably work for stop line detection, but they would not be feasible to replicate dilemma zone protection in a manner similar to the Advance. These magnetometers may be appropriate in locations where conduit has been damaged or does not exist and where pavement milling is not expected in the near future.
23
3.5 SUMMARY
Information from the 12 agencies indicates that the three selected detectors are being used successfully but, in some cases, in different ways from one agency to another. For example, two agencies are using magnetometers at stop lines, whereas others are using them only for advance detection. Attempts to find agencies that are currently using GTT magnetometers for stop line detection were unsuccessful, although two agencies had used them at one or a few intersections for this purpose in the past. This finding alone suggests that these detectors are not the preferred detector for stop line detection. In contrast, two agencies are currently using or installing Sensys magnetometers at stop lines. Based on other information from the GTT representative who provided contact information, at least one agency has determined that these probes are a cost-effective solution for stop line detection and is installing them for this purpose, especially where directional drilling is not required (e.g., on new construction where conduit can be installed during the initial construction phase). Unfortunately, the representative did not provide contact information for that agency. Even without full confirmation of the effectiveness of this detector, it may still be desirable for TxDOT use, at least for advance detection. Their applicability for stop lines is still unknown, so the data collection strategy (Task 3 of this project) should attempt to find a location where vehicles stop over the detectors to determine their accuracy for that application. Only one of the contacted agencies is using GTT probes extensively – the Maryland State Highway Agency – for advance detection, supplemented by video at the stop line.
Interview information pertaining to the Sensys magnetometers suggests that cost savings relating to trenching is a significant factor in choosing this sensor. Also, the part of its installation that requires lane closures can be accomplished in less time than cutting loops so that reduced lane closure time is another factor in its favor. Previous research has indicated its accuracy in free-flow and congested flow conditions approaches that of inductive loops. One concern expressed about this detector was the battery life of the sensor node in the roadway, but the evidence so far indicates a battery life ranging from 8.5 years to 13 years depending on traffic volume, reporting rate of the sensor, and ambient temperature.
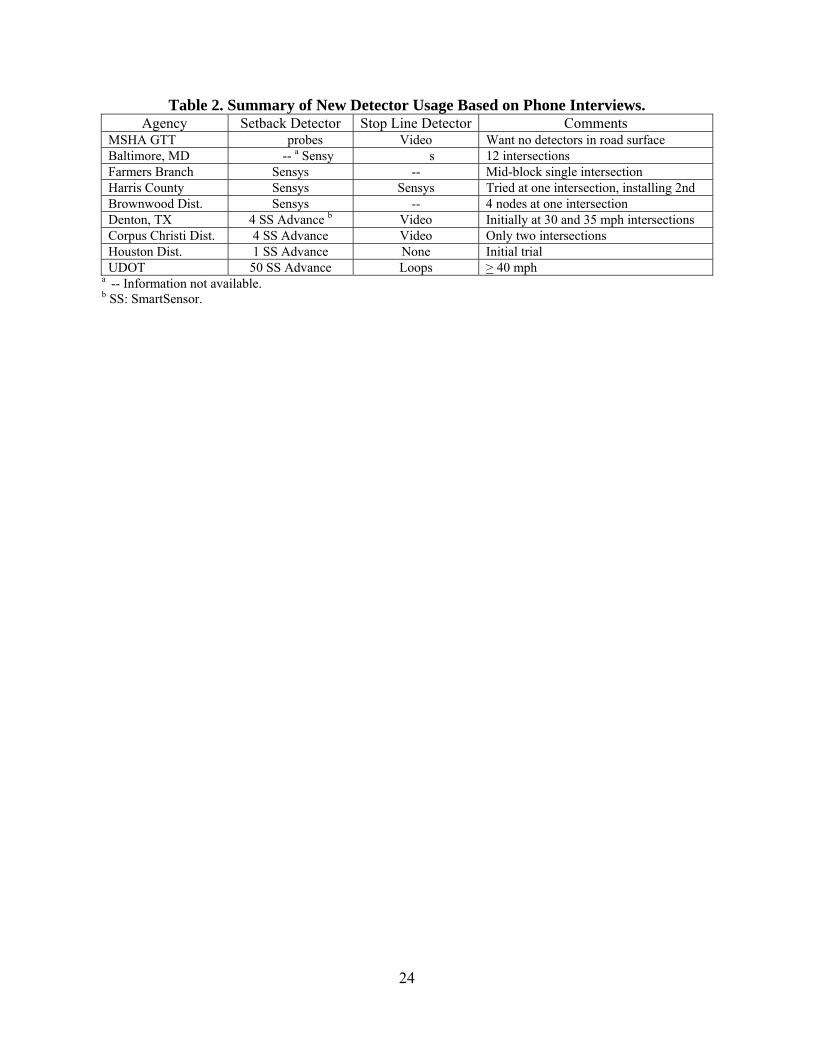
Users of the SmartSensor Advance all expressed positive comments, but would prefer to have one sensor on each approach doing both dilemma zone protection and stop line detection. The Advance only does dilemma zone detection. There are situations where stop line detection is not needed. For example, UDOT does not use stop line detection on two-phase intersections (no left-turn phase), and uses the min recall feature in the controller to bring back the green phase. However, in cases where stop line detection is needed, some agencies are using loops while others are using video. Of the agencies contacted, UDOT is by far the biggest user of the Advance and has developed a refined and rational selection process for identifying the preferred technologies for intersection detection. UDOT uses loops for stop line detection, whereas MSHA, the City of Denton, and the Corpus Christi District use video. Table 2 summarizes pertinent findings from contacting agencies.
24
Table 2. Summary of New Detector Usage Based on Phone Interviews. Agency Setback Detector Stop Line Detector Comments
MSHA GTT probes Video Want no detectors in road surface Baltimore, MD -- a Sensy s 12 intersections Farmers Branch Sensys -- Mid-block single intersection Harris County Sensys Sensys Tried at one intersection, installing 2nd Brownwood Dist. Sensys -- 4 nodes at one intersection Denton, TX 4 SS Advance b Video Initially at 30 and 35 mph intersections Corpus Christi Dist. 4 SS Advance Video Only two intersections Houston Dist. 1 SS Advance None Initial trial UDOT 50 SS Advance Loops > 40 mph
a -- Information not available. b SS: SmartSensor.
25
CHAPTER 4.0 FIELD DATA COLLECTION 4.1 INTRODUCTION
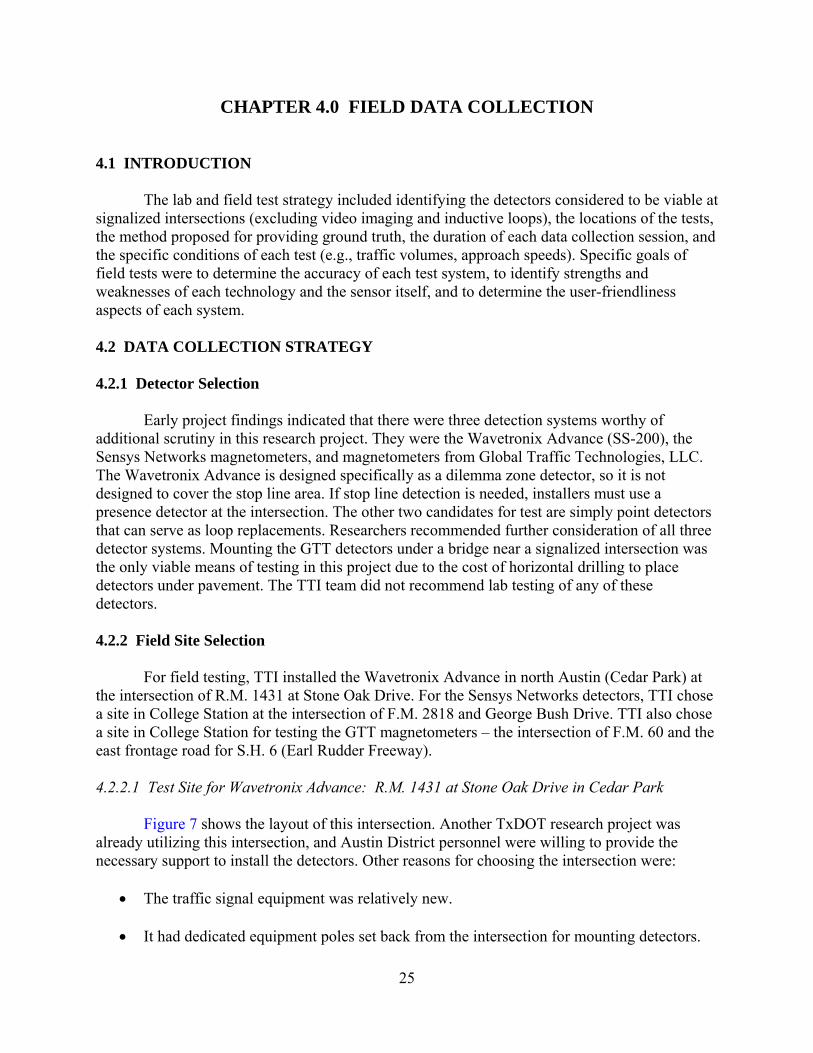
The lab and field test strategy included identifying the detectors considered to be viable at signalized intersections (excluding video imaging and inductive loops), the locations of the tests, the method proposed for providing ground truth, the duration of each data collection session, and the specific conditions of each test (e.g., traffic volumes, approach speeds). Specific goals of field tests were to determine the accuracy of each test system, to identify strengths and weaknesses of each technology and the sensor itself, and to determine the user-friendliness aspects of each system. 4.2 DATA COLLECTION STRATEGY 4.2.1 Detector Selection Early project findings indicated that there were three detection systems worthy of additional scrutiny in this research project. They were the Wavetronix Advance (SS-200), the Sensys Networks magnetometers, and magnetometers from Global Traffic Technologies, LLC. The Wavetronix Advance is designed specifically as a dilemma zone detector, so it is not designed to cover the stop line area. If stop line detection is needed, installers must use a presence detector at the intersection. The other two candidates for test are simply point detectors that can serve as loop replacements. Researchers recommended further consideration of all three detector systems. Mounting the GTT detectors under a bridge near a signalized intersection was the only viable means of testing in this project due to the cost of horizontal drilling to place detectors under pavement. The TTI team did not recommend lab testing of any of these detectors. 4.2.2 Field Site Selection For field testing, TTI installed the Wavetronix Advance in north Austin (Cedar Park) at the intersection of R.M. 1431 at Stone Oak Drive. For the Sensys Networks detectors, TTI chose a site in College Station at the intersection of F.M. 2818 and George Bush Drive. TTI also chose a site in College Station for testing the GTT magnetometers – the intersection of F.M. 60 and the east frontage road for S.H. 6 (Earl Rudder Freeway). 4.2.2.1 Test Site for Wavetronix Advance: R.M. 1431 at Stone Oak Drive in Cedar Park
Figure 7 shows the layout of this intersection. Another TxDOT research project was already utilizing this intersection, and Austin District personnel were willing to provide the necessary support to install the detectors. Other reasons for choosing the intersection were:
• The traffic signal equipment was relatively new.
• It had dedicated equipment poles set back from the intersection for mounting detectors.
26
• The intersection layout was fairly simple (T-intersection).
• It was close to the Traffic Operations Division’s Cedar Park facility.
• It offers a clear view of both high-speed approaches from the cabinet.
• It has a high number of trucks.
• Equipment from the other research project could serve a dual purpose.
• The speed limit is 65 mph.
• Sufficient space is available in the cabinet for research equipment.
Figure 7. R.M. 1431 at Stone Oak Drive in Cedar Park.
27
For the selected intersection with a speed limit of 65 mph, TxDOT would typically need detection for dilemma zone protection beginning at 540 ft from the stop line and at one or more detection points between the 540-ft point and the 320-ft point. The Wavetronix sensor has a range of 500 ft from the detector (typically mounted at or near the stop line), so in a “typical” mounting location, it would not cover the total 540 ft. Given that the selected intersection had poles 175 ft from the stop line on each high-speed approach, both researchers and Wavetronix engineers recommended placing the detectors on the upstream poles on the same mast arm used for mounting video imaging cameras. From that location, these detectors can begin detecting vehicles at 675 ft from the stop line (175 ft plus the detector range of 500 ft). On the near end, the detectors could cover as close as 275 ft from the stop line (175 ft plus 100 ft). Therefore, the Wavetronix detection zone covered even more than the necessary 320 ft to 540 ft required by TxDOT specifications. Everyone involved in this decision at the time felt confident that the additional range due to detector placement would be an advantage since vehicle speeds sometimes exceeded the 65 mph speed limit and because of the high number of trucks. 4.2.2.2 Test Site for Sensys Networks: F.M. 2818 at George Bush Drive
TTI initially proposed field-testing the Sensys Networks magnetometers in College
Station at the intersection of F.M. 2818 and George Bush Drive. TTI had previously installed the detectors at this intersection, but the stop line detectors failed to communicate in tests prior to beginning data collection. TTI pursued getting the detectors replaced as well as finding an alternate site. Contacts with the vendor were successful in getting new magnetometers installed, so researchers used this site after all. In lieu of the College Station intersection, researchers had identified an alternate site in the Houston metropolitan area, installed by the Harris County Traffic Department at the intersection of Huffmeister Road and Hempstead Highway.
Figure 8 shows the intersection layout in College Station and the locations of the Sensys
Networks detectors installed in July 2008. Testing of these magnetometers involved a comparison of vehicle detections compared to an existing 6-ft by 40-ft inductive loop, supplemented by recorded video from this intersection approach. To compare to the existing loop, researchers did not have to rewire the approach as might normally be necessary since this was the only loop on that approach. Intersection conduits were already relatively full, so pulling new wire would have been challenging.
Reasons for choosing the F.M. 2818/George Bush Drive intersection were as follows:
• Some of the ancillary detector equipment (e.g., an Access Point) was already installed.
• The traffic signal cabinet was large and already had some of the needed equipment.
• The intersection was near TTI headquarters.
• The intersection layout was fairly simple with good sight distance.
• TxDOT’s Bryan District and the City of College Station were supportive.

28
• The traffic mix was adequate with some trucks and motorcycles.
• Equipment from another research project could serve a dual purpose.
Figure 8. F.M. 2818 and George Bush Drive in College Station.
Since the intersection approach of interest already had a functional 6-ft by 40-ft inductive
loop, researchers and the vendor installed the magnetometers to replicate the detection zone of the loop to facilitate easy comparison. The installation placed the five test magnetometers generally in the center of the travel lane with an average spacing (as measured in the direction of traffic) of 9.25 ft with the first one at 1.5 ft in front of the stop line. Motorists used the paved shoulder as a right-turn lane, although it was not marked as such.
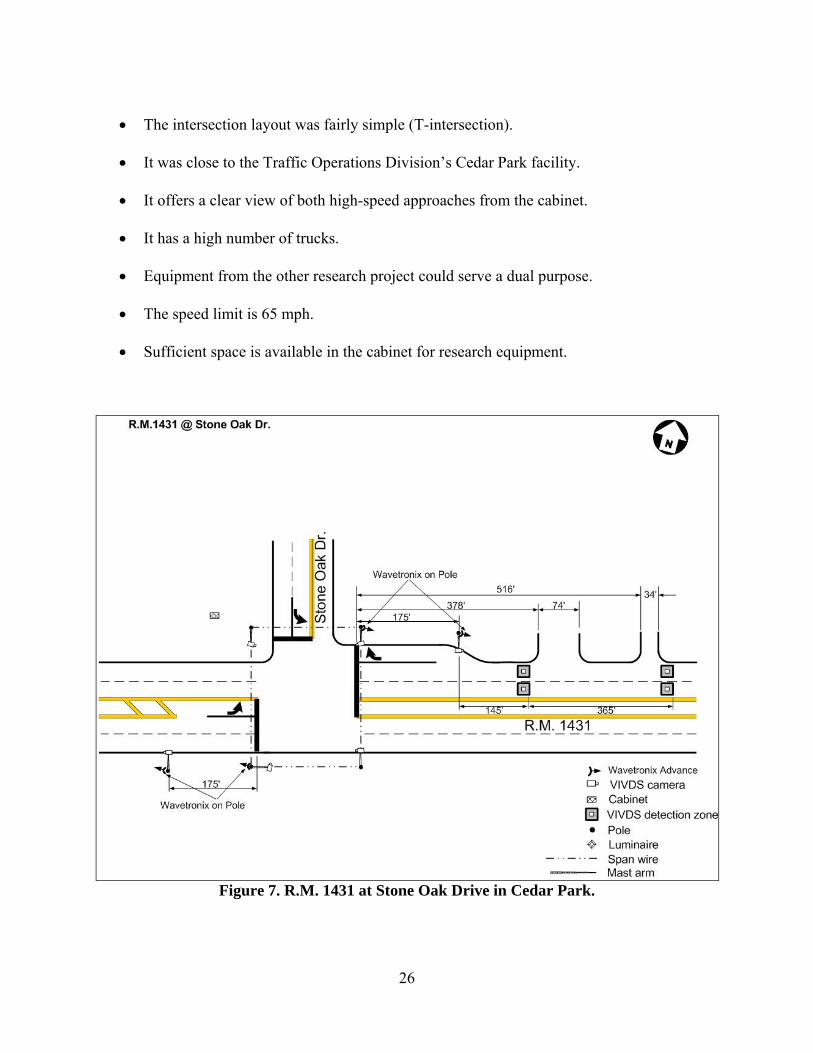
4.2.2.3 Test Site for GTT Magnetometers: F.M. 60 at S.H. 6 in College Station
Site selection for the GTT magnetometers was more difficult since no intersections were known to have these detectors installed, and their installation at a new intersection could have required more effort than other systems. It was desirable to find a location to test them at the stop
29
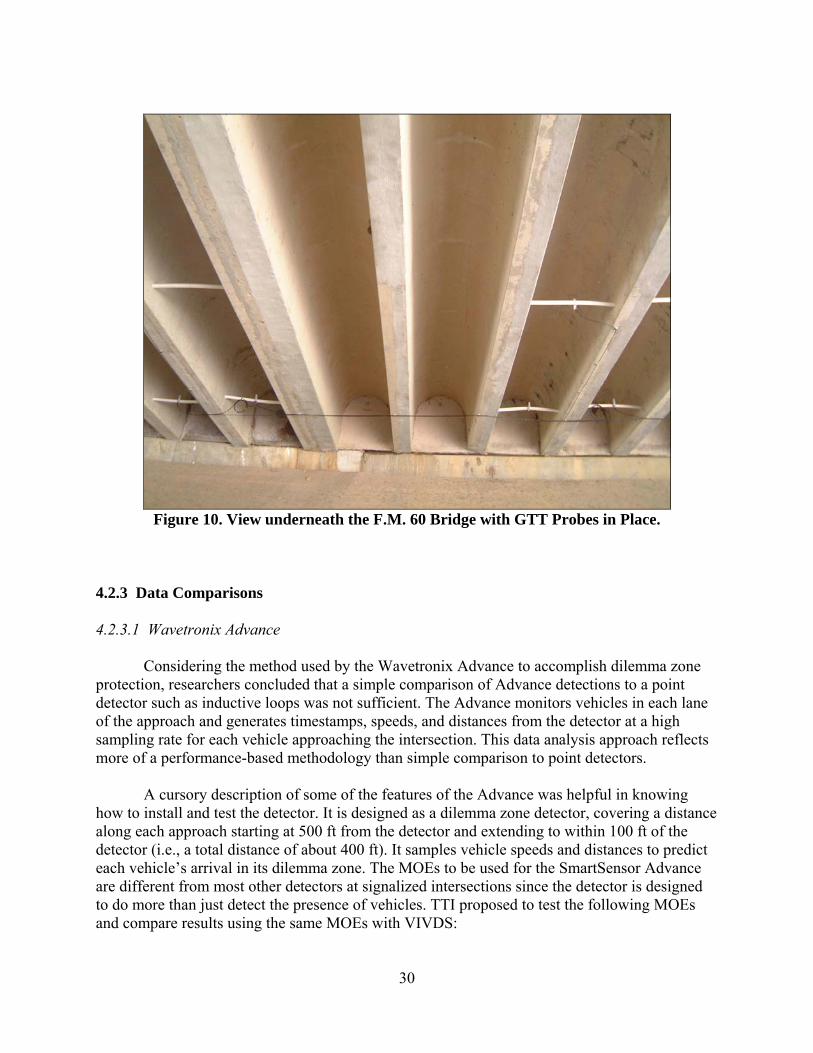
line (to check their ability to hold a call for stopped vehicles, their detection range, etc.), but the test could also replicate the stop line if they were installed where vehicles stop over them. One such location was in College Station at the F.M. 60 (University Drive) bridge on the westbound approach to the S.H. 6 (Earl Rudder Freeway) east frontage road. Figure 9 shows the layout of this intersection and positioning of the detectors. Installers placed the detectors near the end of the bridge to be able to stand on the paved slope underneath the bridge for installation. They used short sections of PVC pipe wedged between the integrated bridge beams as support for the GTT magnetometer probes. “Zip ties” provided the means of keeping the probes vertical and fixed in position. Figure 10 indicates the finished position of the probes under the bridge structure with placement of two detectors in the exit position (as viewed by passing traffic) and one in the entry position. Verification data came from recorded video based on the video camera used by TxDOT for intersection detection. This camera was located on the mast arm for westbound traffic. TTI had originally planned on using the bridge over S.H. 6 at this same interchange, but closer observation of traffic revealed that traffic queues seldom extend past the end of the bridge for collection of the needed data. Appendix B provides details from the manufacturer on installation of these detectors under bridges.
Figure 9. F.M. 60 and S.H. 6 East Frontage Road in College Station.
30
Figure 10. View underneath the F.M. 60 Bridge with GTT Probes in Place.
4.2.3 Data Comparisons 4.2.3.1 Wavetronix Advance Considering the method used by the Wavetronix Advance to accomplish dilemma zone protection, researchers concluded that a simple comparison of Advance detections to a point detector such as inductive loops was not sufficient. The Advance monitors vehicles in each lane of the approach and generates timestamps, speeds, and distances from the detector at a high sampling rate for each vehicle approaching the intersection. This data analysis approach reflects more of a performance-based methodology than simple comparison to point detectors.
A cursory description of some of the features of the Advance was helpful in knowing
how to install and test the detector. It is designed as a dilemma zone detector, covering a distance along each approach starting at 500 ft from the detector and extending to within 100 ft of the detector (i.e., a total distance of about 400 ft). It samples vehicle speeds and distances to predict each vehicle’s arrival in its dilemma zone. The MOEs to be used for the SmartSensor Advance are different from most other detectors at signalized intersections since the detector is designed to do more than just detect the presence of vehicles. TTI proposed to test the following MOEs and compare results using the same MOEs with VIVDS:
31
• the number of vehicles arriving in the dilemma zone at the onset of yellow on phases 2 and 6 (dilemma zone defined as 2.5 sec to 5.5 sec travel time from the stop line);
• red-light running violations on phases 2 and 6 – this MOE will use VIVDS to monitor the
area within the intersection beyond the stop line at the onset of red;
• signal cycle statistics such as max-outs, phase green time, and cycle length statistics; and
• delay to side street motorists on phase 7 (left turns) approximated as the delay incurred by side street vehicles beginning with the first detection of left turn demand and ending with the end of that green phase.
Reasons for selecting these MOEs include ability to measure them accurately using
automated methods and equipment, their impact on safety and intersection operations, and confidence in the outcome. Using automated data collection strategies allowed the collection of more data compared to manually collecting the data. Measuring actual vehicle delay was not on the list, although it would also be desirable if it could be done accurately. The fourth bulleted item is a surrogate for vehicle delay and should provide a good comparison between the Wavetronix Advance and other detectors. TTI monitored the Advance at the R.M. 1431 intersection for a period of several days while recording values to be used to calculate the stated MOEs. The selected MOEs required comparing the intersection operation using the Advance to operation of the same intersection using some other detector. Results allowed a comparison to determine if the Advance is better or worse than VIVDS. This comparison did not involve a baseline system per se since the Advance is not conducive to straightforward comparison in that manner. Also, there were no inductive loops or other similarly accurate detectors installed at the intersection. A video imaging system provided detection, hence the comparison against VIVDS. 4.2.3.2 Sensys Networks Magnetometers
Data comparisons for the SN magnetometers on F.M. 2818 determined the number of misses and false detections from the magnetometers compared to the on-site 6-ft by 40-ft inductive loop and supplemented by recorded video. Since this technology is not affected by weather or light conditions, the data collection and analysis were relatively straightforward. For these magnetometers, it was important to capture trucks and motorcycles in the traffic stream. The data collection strategy set a goal of capturing a minimum of 30 of each targeted vehicle type. The length of time required for collecting the total number of trucks and motorcycles was less than 2 full days. The data collected from the site included the detection timestamps (from each detector), vehicle counts by classification (length), recorded video of the traffic stream, and the controller state. Since the magnetometers were centered in the inductive loop and “connected” together, timestamps of SN detectors should match the timestamps of the loop reasonably well. 4.2.3.3 GTT Magnetometers
Using the noted F.M. 60 site for testing the GTT magnetometers required installing the microloops under the F.M. 60 bridge and using the TxDOT video camera for verification. Data

32
comparisons involved timestamps of detections from each detector and subsequent side-by-side comparisons using recorded video to determine misses and overcounts. TTI had previously mounted similar magnetometers underneath a nearby bridge in another research project to demonstrate their ability to be mounted underneath a structure, but the study needed to be repeated with the appropriate emphasis on stopped vehicle detection. TTI collected data for 3 days to assess the detection accuracy of these detectors. 4.2.4 Proposed Data Analysis
Even though the data analysis came later (in Task 5), researchers had to consider the appropriate comparisons prior to collecting the data. Comparisons came from the data collected in this task, user input (Task 2), and the intended use of detectors. Detection accuracies of the three test systems came from field tests at the noted sites. Input from other users was helpful, but it assumed transferability of findings from other parts of the country. The design of each detector was an important consideration as well. For example, the Wavetronix Advance is designed only for dilemma zone protection and would not be used for slow-speed approaches.
In the final comparisons of the three proposed test systems, TTI will provide sufficient
information for TxDOT to make informed decisions about selecting from these three systems. In the field test of the Wavetronix Advance in Austin, TTI installed the detection system and connected it with the signal controller to have it operate the intersection for several days. TTI compared its operation with VIVDS at the same intersection. In summary, TTI proposed to make the following comparisons based on field data:
• Compare Wavetronix Advance with VIVDS.
• Compare Sensys Networks magnetometers with loops (baseline).
• Compare GTT magnetometers with video (baseline).
• Compare Sensys Networks magnetometers, Wavetronix Advance, and GTT magnetometers, primarily qualitatively.

33
CHAPTER 5.0 DATA ANALYSIS 5.1 INTRODUCTION
The data collected in Task 4 of Research Project 0-5845 forms the basis of the data analysis. TTI conducted a thorough analysis of the field data and other information gathered in early tasks. At the most basic level, the research established the performance of the test detector(s) by correct detections or by incorrect detections. Incorrect detections can occur as false positives (detection when there is no vehicle present) or missed detections. The data will be categorized according to detector technology and manufacturer. One of the technologies is radar, and the other two are magnetic detectors. In all three cases, there was no apparent impact due to light conditions or weather conditions. The analysis looked for trends in terms of conditions that often cause problems or seldom cause problems and whether the errors would lead to critical intersection problems related to safety or efficiency.
In addition to the accuracy data provided through field tests, the research team considered additional features offered by the selected technology that might enhance intersection operations and safety. Finally, the research team did a comparison of costs of the new technologies, using data from vendors and agency contacts. The accuracy of this comparison is limited by cost estimates that might not reflect current TxDOT costs since they are based on purchasing in smaller numbers than is typical of TxDOT purchasing.
The results in this chapter fall into the categories of performance (i.e., accuracy), equipment reliability, initial costs, and user-friendliness. Of the three devices, the Wavetronix Advance was the most challenging to evaluate due to its design as a dilemma zone detector. The other two are point detectors, so simply comparing with a good baseline detector such as inductive loops forms an appropriate comparison. Since the Advance is a dilemma zone detector that monitors each vehicle speed and distance from the detector and predicts its arrival in the dilemma zone, it cannot simply be compared to a presence detector as the only means of comparison. Therefore, TTI evaluated its performance by metrics such as red-light running, vehicles caught in the dilemma zone and number of signal cycles per unit of time. Researchers tested it running in parallel with a video imaging system at the intersection of R.M. 1431 and Stone Oak Drive in Cedar Park, which TxDOT had installed to control the intersection. 5.2 DETECTION ACCURACY 5.2.1 GTT Magnetometers
A vendor representative was present to supervise the installation and configuration of the magnetometers under the F.M. 60 bridge in College Station. Data collection for the GTT magnetometers required manual observation of recorded video using a TxDOT camera. The camera was a component of a VIVDS that was installed at the test approach to control the intersection. In the right lane, “GTT1” is the entry magnetometer and is a single probe, whereas “GTT2” is the exit magnetometer set and involves two probes. In the left lane, “GTT3” is the
34
entry magnetometer and is a single probe, whereas “GTT4” is the exit magnetometer set and involves two probes.
Human observers watched the replay of the recorded video to detect vehicles stopped
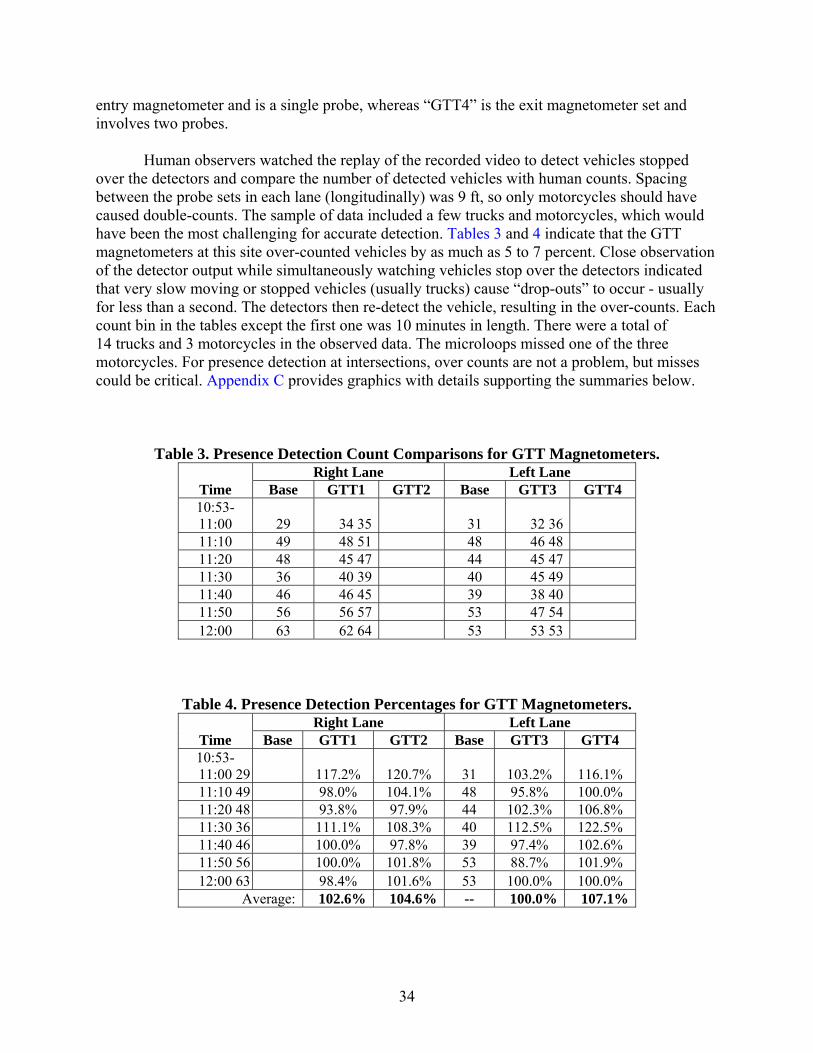
over the detectors and compare the number of detected vehicles with human counts. Spacing between the probe sets in each lane (longitudinally) was 9 ft, so only motorcycles should have caused double-counts. The sample of data included a few trucks and motorcycles, which would have been the most challenging for accurate detection. Tables 3 and 4 indicate that the GTT magnetometers at this site over-counted vehicles by as much as 5 to 7 percent. Close observation of the detector output while simultaneously watching vehicles stop over the detectors indicated that very slow moving or stopped vehicles (usually trucks) cause “drop-outs” to occur - usually for less than a second. The detectors then re-detect the vehicle, resulting in the over-counts. Each count bin in the tables except the first one was 10 minutes in length. There were a total of 14 trucks and 3 motorcycles in the observed data. The microloops missed one of the three motorcycles. For presence detection at intersections, over counts are not a problem, but misses could be critical. Appendix C provides graphics with details supporting the summaries below.
Table 3. Presence Detection Count Comparisons for GTT Magnetometers.
Time Right Lane Left Lane
Base GTT1 GTT2 Base GTT3 GTT4 10:53-11:00 29 34 35 31 32 36 11:10 49 48 51 48 46 48 11:20 48 45 47 44 45 47 11:30 36 40 39 40 45 49 11:40 46 46 45 39 38 40 11:50 56 56 57 53 47 54 12:00 63 62 64 53 53 53
Table 4. Presence Detection Percentages for GTT Magnetometers.
Time Right Lane Left Lane
Base GTT1 GTT2 Base GTT3 GTT4 10:53-11:00 29 117.2% 120.7% 31 103.2% 116.1% 11:10 49 98.0% 104.1% 48 95.8% 100.0% 11:20 48 93.8% 97.9% 44 102.3% 106.8% 11:30 36 111.1% 108.3% 40 112.5% 122.5% 11:40 46 100.0% 97.8% 39 97.4% 102.6% 11:50 56 100.0% 101.8% 53 88.7% 101.9% 12:00 63 98.4% 101.6% 53 100.0% 100.0%
Average: 102.6% 104.6% -- 100.0% 107.1%
35
One weakness of GTT magnetometers for presence detection at the stop line is that their detection area is small. Placing two microloops per location to provide sufficient detection width would probably be necessary, but doing multiple horizontal bores to create a 20-ft or 40-ft detection zone would not be practical unless new construction involved placement of conduit in advance of the surfacing operation. Their placement well below the surface would protect them from surface milling during reconstruction. 5.2.2 Sensys Networks Magnetometers
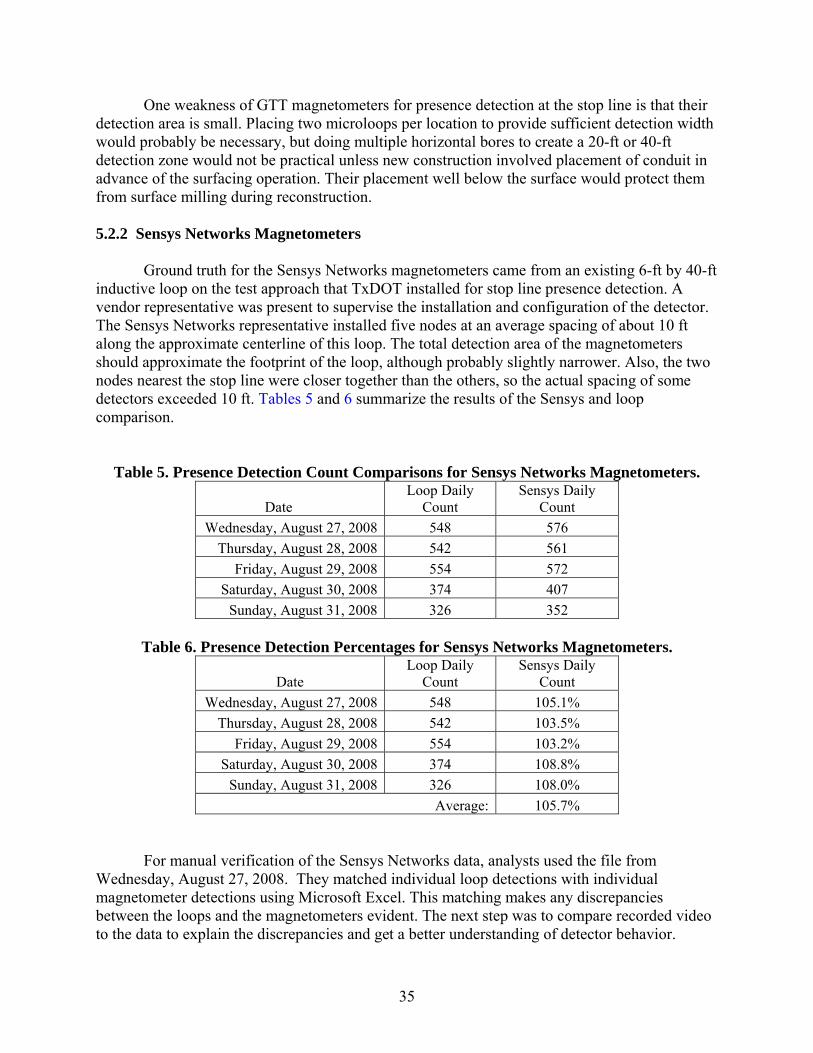
Ground truth for the Sensys Networks magnetometers came from an existing 6-ft by 40-ft inductive loop on the test approach that TxDOT installed for stop line presence detection. A vendor representative was present to supervise the installation and configuration of the detector. The Sensys Networks representative installed five nodes at an average spacing of about 10 ft along the approximate centerline of this loop. The total detection area of the magnetometers should approximate the footprint of the loop, although probably slightly narrower. Also, the two nodes nearest the stop line were closer together than the others, so the actual spacing of some detectors exceeded 10 ft. Tables 5 and 6 summarize the results of the Sensys and loop comparison.
Table 5. Presence Detection Count Comparisons for Sensys Networks Magnetometers.
Date Loop Daily
Count Sensys Daily
Count Wednesday, August 27, 2008 548 576
Thursday, August 28, 2008 542 561 Friday, August 29, 2008 554 572
Saturday, August 30, 2008 374 407 Sunday, August 31, 2008 326 352
Table 6. Presence Detection Percentages for Sensys Networks Magnetometers.
Date Loop Daily
Count Sensys Daily
Count Wednesday, August 27, 2008 548 105.1%
Thursday, August 28, 2008 542 103.5% Friday, August 29, 2008 554 103.2%
Saturday, August 30, 2008 374 108.8% Sunday, August 31, 2008 326 108.0%
Average: 105.7%
For manual verification of the Sensys Networks data, analysts used the file from
Wednesday, August 27, 2008. They matched individual loop detections with individual magnetometer detections using Microsoft Excel. This matching makes any discrepancies between the loops and the magnetometers evident. The next step was to compare recorded video to the data to explain the discrepancies and get a better understanding of detector behavior.
36
In the daily count summary, manual observations indicated that the Sensys Networks magnetometers over-counted from 3 to 8 percent. This discrepancy is due to several factors, but the largest impact is from “fail-safe” calls caused by a communication interruption between the magnetometers and the Sensys Networks Access Point. On August 27, this interruption occurred about 12 times, generating 2 to 6 additional counts per occurrence. These lapses in communication did not cause any missed calls, only additional false calls. Right-turning vehicles on the shoulder could also have caused discrepancies, along with left-turning vehicles from the main phase that clip the corner of the detection zone, and small vehicles that “drop out” when moving from one magnetic detector to another. Again, over counts are not necessarily problematic.
The possibility of magnetometers dropping a call when a vehicle moves from one magnetometer to the next is a concern because it might prevent a vehicle from being served in a timely manner, or served at all. This phenomenon is most likely to happen with motorcycles or compact cars. Practices that will help to mitigate this problem include:
• placing detectors closer together,
• using two magnetic detectors side-by-side at the stop line (for motorcycles), or
• adding a short extension to each magnetometer.
5.2.3 Wavetronix SS-200 Advance
As noted above, TTI researchers installed the Wavetronix SmartSensor Advance at the intersection of R.M. 1431 and Stone Oak Drive in Cedar Park, Texas, to test its capabilities in providing dilemma zone protection to motorists and compare it to video detection. The speed limit at the R.M. 1431 intersection is 65 mph. The research team collected data for 2 weeks at the intersection while the video detection system was providing dilemma zone protection for the main street approaches. TTI then installed the Advance detector at two locations on both main street approaches to the intersection: phase 2 (eastbound) and phase 6 (westbound). The first test installed two Advance detectors, one for each main street approach, on poles at 175 ft upstream of the intersection and collected data for 2 weeks while the SS-200 detectors were providing dilemma zone protection for motorists. The second test installed two SS-200 detectors, one for each main street approach, on poles at the stop line while the SS-200 detectors were providing dilemma zone protection on the main street approaches to the intersection.
In both SS-200 detector tests at 175 ft upstream of the intersection and at the stop line, a
vendor representative was present to supervise the installation, aiming, and configuration of the SS-200 detector’s parameters. He used the default dilemma zone travel time lower and upper limit parameters to 2.5 and 5.5 sec, respectively. He also set a passage time of 200 milliseconds into the controller for both main street phases 2 and 6 as recommended by the manufacturer.
The TTI research team collected the following real-time data for comparing the SS-200
detector’s dilemma zone protection capabilities to that of video detection: phase status (red, yellow, green), stop line detector actuations (on/off), SS-200 detector actuations (on/off), and
37
number of red-light-runners on the main street approaches. An Autoscope video detection system with two detectors drawn in the middle of the intersection downstream of the main street stop-line approaches provided the red-light-running data.
5.2.3.1 Wavetronix Measures of Effectiveness
The MOEs that TTI researchers used to compare the SS-200 detector to video detection
for dilemma zone protection included the number of phase terminations per day and the number of red-light runners on main street approaches. The following sections provide the results of analyzing the data collected from the three studies at the R.M. 1431 and Stone Oak Dr. intersection. The analysis includes the comparison of the performance of the SS-200 detector in providing dilemma zone protection to motorists while installed at 175 ft upstream of the intersection and at the stop line to the performance of the video detection system installed at the intersection to provide dilemma zone protection and stop line detection.
5.2.3.2 Phase 2 (Eastbound) Comparison for 175 ft Location
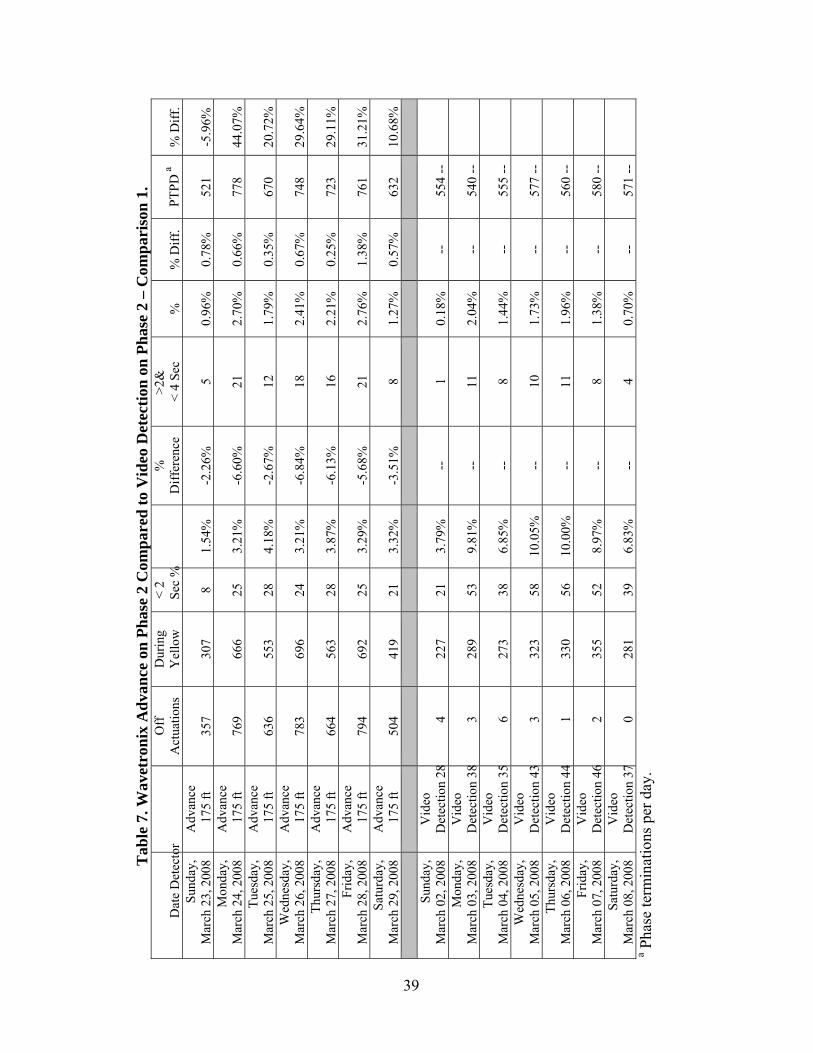
Tables 7 through 10 show results of these comparisons. Table 7 shows results comparing
the SS-200 detector installed at 175 ft upstream of the stop line on phase 2 to the video detection system. The table shows results for 1 week of data. As expected by TTI researchers, there was an average increase of about 23 percent in the number of phase terminations for phase 2 using the SS-200 detectors as compared to video detection. This finding indicates that the SS-200 detector is better at detecting gaps in the stream of traffic than video detection systems. The improved ability to detect gaps translates into more phase terminations per day for main street phase 2 due to demand from traffic on side street phase 4 at the intersection. At the same time, the data analysis indicates an average decrease of 4.81 percent in red-light-running within the first 2 sec after the onset of red and an average increase of 0.67 percent in red-light-running between 2 to 4 sec after red start on phase 2 when using the SS-200 detector compared to video detection.
Researchers were expecting a decrease in red-light-runners in general when using the
SS 200 detector due to its advance dilemma zone protection capabilities. However, the evidence suggests that the increase in red-light running 2 to 4 sec after the onset of red when using the SS 200 detector is due to the short passage time (200 milliseconds) in the controller for the main street phases. Another reason could be that installers should have set the dilemma zone travel time lower and upper limit values to 2 and 6 sec due to the large number of trucks that pass through the intersection instead of 2.5 and 5.5 sec. In comparing the number of red-light-runners during the first 2 sec of red and from 2 to 4 sec after red, researchers normalized the number of red-light runners by dividing by the total number of phase terminations per day for phase 2. They did this normalization before comparing the percentages of red-light-runners when the SS-200 was in use at the intersection to the percentages of red-light-runners when video detection was in use. The following description of some of the columns in Table 7 applies for other tables in the other sections in this document:
• The column labeled “Detector” indicates the detector that was used to provide dilemma
zone protection to motorists on the main street approaches to the intersection on that day. For the SS-200 detector, it also indicates the detector’s location.
38
• The column labeled “Off Actuations” provides the total number of times the video
detectors detecting red-light-runners turned off during the yellow and red indications of the corresponding main street phase. In other words, it is the total number of vehicles that cleared the red-light-running detectors during yellow or red on main street phases 2 or 6.
• The column labeled “During Yellow” provides the total number of vehicles that cleared
the red-light-running detectors during yellow on main street phases 2 or 6.
• The column labeled “< 2 Sec” provides the number of red-light-runners that were detected going through the intersection within the first 2 sec after the onset of red by the video detectors used to detect red-light-runners.
• The column labeled “%” provides the percentage of the red-light-runners within the first
2 sec of red to the total number of phase terminations on the corresponding phase.
• The column labeled “% Difference” provides the difference in the percentages between the red-light-runners while the SS-200 detector was in use and the corresponding day-of-the-week while video detection provided dilemma zone protection.
• The column labeled “> 2 & < 4 Sec” provides the number of red-light-runners detected
going through the intersection after the onset of red by 2 sec and less than 4 sec. The next two columns provide similar information as the columns following the “< 2 Sec” column.
• The column labeled “PTPD” provides the number of phase terminations per day for the
main street approach phases.
• The next column labeled “% Difference” provides the percent increase or decrease in the total number of phase terminations when using the SS-200 detector compared to video detection.
5.2.3.2 Phase 2 (Eastbound) Stop Line Comparison
Similarly, Table 8 shows a week of data collected at the R.M. 1431 intersection with the
SS-200 detector installed at the stop line on both main street approaches to provide dilemma zone protection in comparison to a week of data while the video detection system provided dilemma zone protection. Results in Table 8 do not always use sequential days but are intended to facilitate comparisons between the Wavetronix Advance and video detection on a weekday-to-weekday basis (e.g., Monday to Monday, Tuesday to Tuesday, etc.) Again, there was an average increase of about 18 percent in the number of phase terminations for phase 2 per day. However, the number of red-light-runners within the first 2 sec after the onset of red decreased by 0.76 percent, and the number of red-light-runners within 2 to 4 sec after the onset of red also decreased by 0.68 percent.
T
able
7. W
avet
roni
x A
dvan
ce o
n Ph
ase
2 C
ompa
red
to V
ideo
Det
ectio
n on
Pha
se 2
– C
ompa
riso
n 1.
Dat
e D
etec
tor
O
ff
Act
uatio
ns
Dur
ing
Yel
low
<
2 Se
c %
%
D
iffer
ence
>2
&
< 4
Sec
%
% D
iff.
PTPD
a
% D
iff.
Sund
ay,
Mar
ch 2
3, 2
008
Adv
ance
1
75 ft
35
7 30
7 8
1.54
%
-2.2
6%
5 0.
96%
0.
78%
52
1 -5
.96%
M
onda
y,
Mar
ch 2
4, 2
008
Adv
ance
1
75 ft
76
9 66
6 25
3.
21%
-6
.60%
21
2.
70%
0.
66%
77
8 44
.07%
Tu
esda
y,
Mar
ch 2
5, 2
008
Adv
ance
1
75 ft
63
6 55
3 28
4.
18%
-2
.67%
12
1.
79%
0.
35%
67
0 20
.72%
W
edne
sday
, M
arch
26,
200
8 A
dvan
ce
175
ft
783
696
24
3.21
%
-6.8
4%
18
2.41
%
0.67
%
748
29.6
4%
Thur
sday
, M
arch
27,
200
8 A
dvan
ce
175
ft
664
563
28
3.87
%
-6.1
3%
16
2.21
%
0.25
%
723
29.1
1%
Frid
ay,
Mar
ch 2
8, 2
008
Adv
ance
1
75 ft
79
4 69
2 25
3.
29%
-5
.68%
21
2.
76%
1.
38%
76
1 31
.21%
Sa
turd
ay,
Mar
ch 2
9, 2
008
Adv
ance
1
75 ft
50
4 41
9 21
3.
32%
-3
.51%
8
1.27
%
0.57
%
632
10.6
8%
Sund
ay,
Mar
ch 0
2, 2
008
Vid
eo
Det
ectio
n 28
4 22
7 21
3.
79%
--
1
0.18
%
--
554
--
Mon
day,
M
arch
03,
200
8 V
ideo
D
etec
tion
383
289
53
9.81
%
--
11
2.04
%
--
540
--
Tues
day,
M
arch
04,
200
8 V
ideo
D
etec
tion
356
273
38
6.85
%
--
8 1.
44%
--
55
5 --
W
edne
sday
, M
arch
05,
200
8 V
ideo
D
etec
tion
433
323
58
10.0
5%
--
10
1.73
%
--
577
--
Thur
sday
, M
arch
06,
200
8 V
ideo
D
etec
tion
441
330
56
10.0
0%
--
11
1.96
%
--
560
--
Frid
ay,
Mar
ch 0
7, 2
008
Vid
eo
Det
ectio
n 46
2 35
5 52
8.
97%
--
8
1.38
%
--
580
--
Satu
rday
, M
arch
08,
200
8 V
ideo
D
etec
tion
370
281
39
6.83
%
--
4 0.
70%
--
57
1 --
a P
hase
term
inat
ions
per
day
.
39
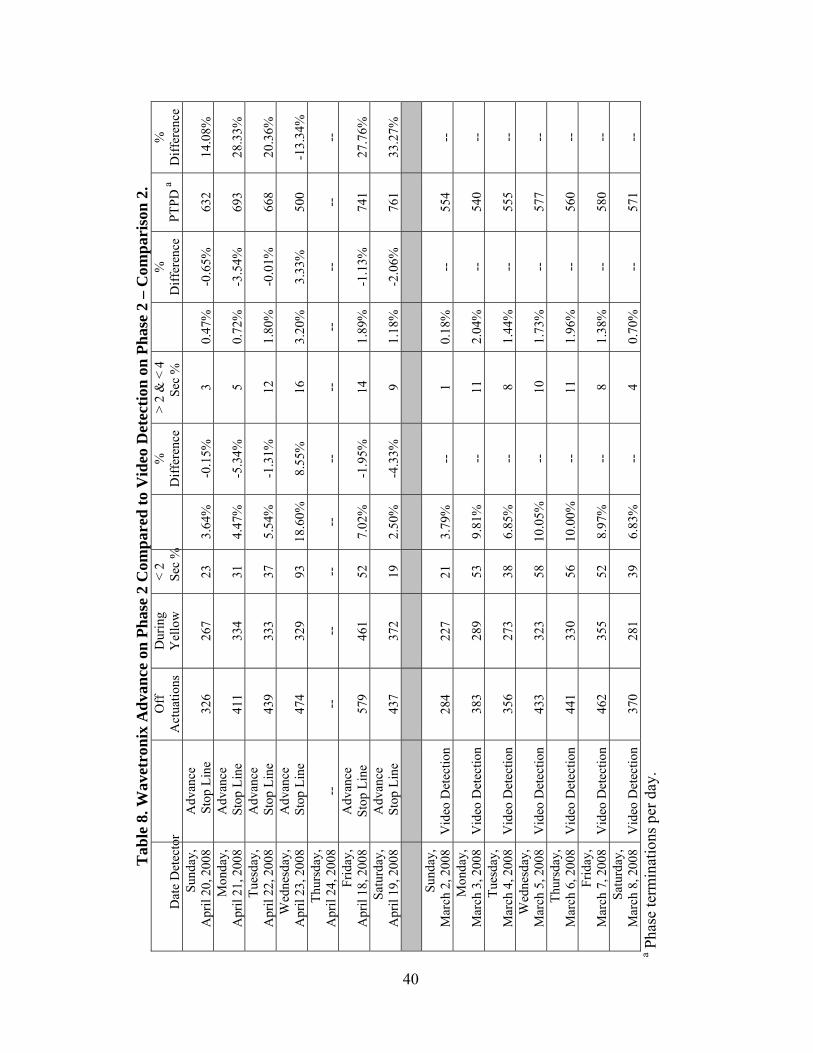
T
able
8. W
avet
roni
x A
dvan
ce o
n Ph
ase
2 C
ompa
red
to V
ideo
Det
ectio
n on
Pha
se 2
– C
ompa
riso
n 2.
Dat
e D
etec
tor
O
ff
Act
uatio
ns
Dur
ing
Yel
low
<
2 Se
c %
%
D
iffer
ence
>
2 &
< 4
Se
c %
%
D
iffer
ence
PT
PD a
%
D
iffer
ence
Su
nday
, A
pril
20, 2
008
Adv
ance
S
top
Line
32
6 26
7 23
3.
64%
-0
.15%
3
0.47
%
-0.6
5%
632
14.0
8%
Mon
day,
A
pril
21, 2
008
Adv
ance
S
top
Line
41
1 33
4 31
4.
47%
-5
.34%
5
0.72
%
-3.5
4%
693
28.3
3%
Tues
day,
A
pril
22, 2
008
Adv
ance
S
top
Line
43
9 33
3 37
5.
54%
-1
.31%
12
1.
80%
-0
.01%
66
8 20
.36%
W
edne
sday
, A
pril
23, 2
008
Adv
ance
S
top
Line
47
4 32
9 93
18
.60%
8.
55%
16
3.
20%
3.
33%
50
0 -1
3.34
%
Thur
sday
, A
pril
24, 2
008
--
--
--
--
--
--
--
--
--
--
--
Frid
ay,
Apr
il 18
, 200
8 A
dvan
ce
Stop
Lin
e 57
9 46
1 52
7.
02%
-1
.95%
14
1.
89%
-1
.13%
74
1 27
.76%
Sa
turd
ay,
Apr
il 19
, 200
8 A
dvan
ce
Sto
p Li
ne
437
372
19
2.50
%
-4.3
3%
9 1.
18%
-2
.06%
76
1 33
.27%
Su
nday
, M
arch
2, 2
008
Vid
eo D
etec
tion
284
227
21
3.79
%
--
1 0.
18%
--
55
4 --
M
onda
y,
Mar
ch 3
, 200
8 V
ideo
Det
ectio
n 38
3 28
9 53
9.
81%
--
11
2.
04%
--
54
0 --
Tu
esda
y,
Mar
ch 4
, 200
8 V
ideo
Det
ectio
n 35
6 27
3 38
6.
85%
--
8
1.44
%
--
555
--
Wed
nesd
ay,
Mar
ch 5
, 200
8 V
ideo
Det
ectio
n 43
3 32
3 58
10
.05%
--
10
1.
73%
--
57
7 --
Th
ursd
ay,
Mar
ch 6
, 200
8 V
ideo
Det
ectio
n 44
1 33
0 56
10
.00%
--
11
1.
96%
--
56
0 --
Fr
iday
, M
arch
7, 2
008
Vid
eo D
etec
tion
462
355
52
8.97
%
--
8 1.
38%
--
58
0 --
Sa
turd
ay,
Mar
ch 8
, 200
8 V
ideo
Det
ectio
n 37
0 28
1 39
6.
83%
--
4
0.70
%
--
571
--
a Pha
se te
rmin
atio
ns p
er d
ay.
40

T
able
9. W
avet
roni
x A
dvan
ce o
n Ph
ase
6 C
ompa
red
to V
ideo
Det
ectio
n on
Pha
se 6
– C
ompa
riso
n 3.
Dat
e D
etec
tor
O
ff
Act
uatio
ns
Dur
ing
Yel
low
<
2 Se
c %
%
D
iffer
ence
>
2 &
< 4
Se
c %
%
D
iffer
ence
PT
PD a
%
D
iffer
ence
Su
nday
, M
arch
23,
200
8 A
dvan
ce
175
ft
508
477
20
2.33
%
0.13
%
3 0.
35%
0.
35%
85
8 45
.18%
M
onda
y,
Mar
ch 2
4, 2
008
Adv
ance
1
75 ft
10
06
902
49
5.38
%
1.21
%
19
2.09
%
1.39
%
910
58.2
6%
Tues
day,
M
arch
25,
200
8 A
dvan
ce
175
ft
1328
11
20
138
14.4
7%
8.77
%
28
2.94
%
1.47
%
954
55.1
2%
Wed
nesd
ay,
Mar
ch 2
6, 2
008
Adv
ance
1
75 ft
10
86
991
58
4.66
%
-0.4
5%
15
1.20
%
0.25
%
1245
98
.56%
Th
ursd
ay,
Mar
ch 2
7, 2
008
Adv
ance
1
75 ft
10
80
1003
45
4.
00%
-0
.26%
17
1.
51%
0.
60%
11
25
70.9
7%
Frid
ay,
Mar
ch 2
8, 2
008
Adv
ance
1
75 ft
13
37
1190
11
0 11
.71%
7.
50%
23
2.
45%
1.
75%
93
9 9.
82%
Sa
turd
ay,
Mar
ch 2
9, 2
008
Adv
ance
17
5 ft
837
782
33
3.63
%
0.06
%
9 0.
99%
0.
56%
91
0 -1
.62%
Su
nday
, M
arch
02,
200
8 V
ideo
D
etec
tion
139
124
13
2.20
%
--
0 0.
00%
--
59
1 --
M
onda
y,
Mar
ch 0
3, 2
008
Vid
eo
Det
ectio
n 27
1 21
5 24
4.
17%
--
4
0.70
%
--
575
--
Tues
day,
M
arch
04,
200
8 V
ideo
D
etec
tion
302
232
35
5.69
%
--
9 1.
46%
--
61
5 --
W
edne
sday
, M
arch
05,
200
8 V
ideo
D
etec
tion
345
266
32
5.10
%
--
6 0.
96%
--
62
7 --
Th
ursd
ay,
Mar
ch 0
6, 2
008
Vid
eo
Det
ectio
n 30
7 25
2 28
4.
26%
--
6
0.91
%
--
658
--
Frid
ay,
Mar
ch 0
7, 2
008
Vid
eo
Det
ectio
n 36
2 29
4 36
4.
21%
--
6
0.70
%
--
855
--
Satu
rday
, M
arch
08,
200
8 V
ideo
D
etec
tion
293
240
33
3.57
%
--
4 0.
43%
--
92
5 --
a P
hase
term
inat
ions
per
day
.
41
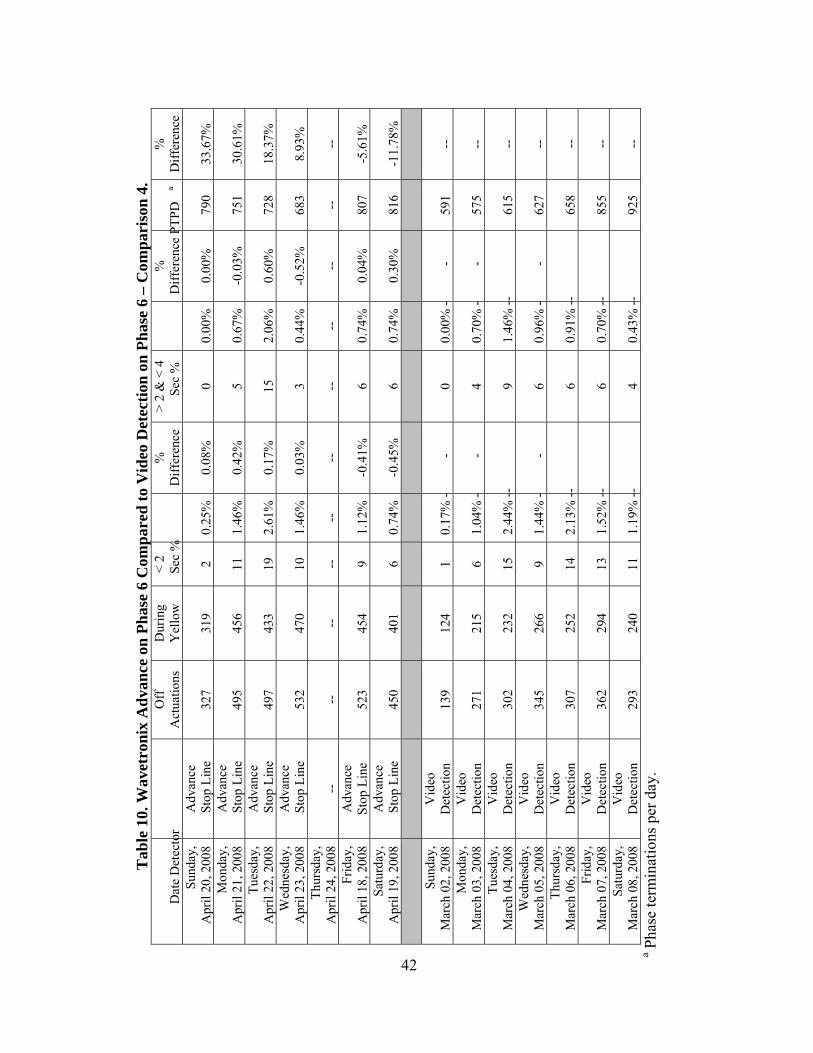
T
able
10.
Wav
etro
nix
Adv
ance
on
Phas
e 6
Com
pare
d to
Vid
eo D
etec
tion
on P
hase
6 –
Com
pari
son
4.
Dat
e D
etec
tor
O
ff
Act
uatio
ns
Dur
ing
Yel
low
<
2 Se
c %
%
D
iffer
ence
>
2 &
< 4
Se
c %
%
D
iffer
ence
PTP
Da
%
Diff
eren
ce
Sund
ay,
Apr
il 20
, 200
8 A
dvan
ce
Sto
p Li
ne
327
319
2 0.
25%
0.
08%
0
0.00
%
0.00
%
790
33.6
7%
Mon
day,
A
pril
21, 2
008
Adv
ance
S
top
Line
49
5 45
6 11
1.
46%
0.
42%
5
0.67
%
-0.0
3%
751
30.6
1%
Tues
day,
A
pril
22, 2
008
Adv
ance
S
top
Line
49
7 43
3 19
2.
61%
0.
17%
15
2.
06%
0.
60%
72
8 18
.37%
W
edne
sday
, A
pril
23, 2
008
Adv
ance
S
top
Line
53
2 47
0 10
1.
46%
0.
03%
3
0.44
%
-0.5
2%
683
8.93
%
Thur
sday
, A
pril
24, 2
008
--
--
--
--
--
--
--
--
--
--
--
Frid
ay,
Apr
il 18
, 200
8 A
dvan
ce
Stop
Lin
e 52
3 45
4 9
1.12
%
-0.4
1%
6 0.
74%
0.
04%
80
7 -5
.61%
Sa
turd
ay,
Apr
il 19
, 200
8 A
dvan
ce
Sto
p Li
ne
450
401
6 0.
74%
-0
.45%
6
0.74
%
0.30
%
816
-11.
78%
Su
nday
, M
arch
02,
200
8 V
ideo
D
etec
tion
139
124
1 0.
17%
--
0 0.
00%
--
591
--
Mon
day,
M
arch
03,
200
8 V
ideo
D
etec
tion
271
215
6 1.
04%
--
4 0.
70%
--
575
--
Tues
day,
M
arch
04,
200
8 V
ideo
D
etec
tion
302
232
15
2.44
% --
9
1.46
% --
61
5 --
W
edne
sday
, M
arch
05,
200
8 V
ideo
D
etec
tion
345
266
9 1.
44%
--
6 0.
96%
--
627
--
Thur
sday
, M
arch
06,
200
8 V
ideo
D
etec
tion
307
252
14
2.13
% --
6
0.91
% --
65
8 --
Fr
iday
, M
arch
07,
200
8 V
ideo
D
etec
tion
362
294
13
1.52
% --
6
0.70
% --
85
5 --
Sa
turd
ay,
Mar
ch 0
8, 2
008
Vid
eo
Det
ectio
n 29
3 24
0 11
1.
19%
--
4 0.
43%
--
925
--
a Pha
se te
rmin
atio
ns p
er d
ay.
42

43
5.2.3.3 Phase 6 (Westbound) Comparison for 175 ft Location
Table 9 shows the comparison in performance from one week of data when the SS-200
detector was providing dilemma zone protection for motorists on phase 6 at the R.M. 1431 intersection to another week of data while the video detection system was providing dilemma zone protection. TxDOT and TTI installed the SS-200 detector on a pole at 175 ft upstream of the intersection. The data analysis indicates a 48 percent increase in phase terminations per day for phase 6 while the SS-200 detector was in use compared to video detection. The higher increase in phase terminations for phase 6 is due to both the side street phase 4 and the opposing arterial left-turn phase 5 while the other main street phase 2 is only affected by side street phase 4. However, there was an increase of 2.43 percent in red-light-running within the first 2 sec of red when the SS-200 detector was in use compared to when video detection was in use. Again, TTI researchers believe the increase was due to the 200 milliseconds of passage time that was entered in the controller for phase 6 and the dilemma zone lower and upper travel time boundaries of 2.5 to 5.5 sec that were configured into the SS-200 detector. There was also an increase of 0.91 percent in red-light running 2 to 4 sec after the onset of red when the SS-200 controlled the intersection as compared to when video controlled the intersection.
5.2.3.4 Phase 6 (Westbound) Stop Line Comparison
Table 10 shows the results of analysis of 1 week of data while the SS-200 detector was
providing dilemma zone protection to motorists on phase 6 compared to another week of data while the video detection system was providing dilemma zone protection. The SS-200 detector was on a pole at the stop line. The results indicate an average increase of around 12 percent in the number of phase 6 terminations per day when the SS-200 detector was installed at the intersection. The number of red-light-runners within the first 2 sec of red decreased by 0.03 percent, while the number of red-light-runners between 2 sec and 4 sec of red increased by 0.07 percent when the SS-200 detector controlled the intersection. 5.3 OTHER FACTORS The other factors included in this document are equipment reliability, initial cost, and user-friendliness. Equipment reliability is a matter of how much attention the detector and ancillary equipment require. Cost, in this case, is the first-time cost, although a better metric is life-cycle cost once a history of the detectors becomes available. User-friendliness has mostly to do with the software and the user interface that any user would encounter. 5.3.1 Reliability
Equipment reliability is a measure of how well and how consistently each detector performs day in and day out over a long time period without a need for human intervention. It includes immunity to weather and light changes. It also should include how vulnerable the equipment is to utility work and other activities such as pavement milling, even though damage due to these activities is not directly the fault of the detector. TTI was unable to operate the detectors for periods of time longer than several days due to delays by manufacturers providing
44
the equipment in a timely manner, so future research should include additional monitoring of each of these detectors at signalized intersections. 5.3.1.1 GTT Magnetometers Reliability of the GTT magnetometers appeared to be acceptable during this short-term test. No weather or light conditions affect their performance. In some locations, mounting underneath bridges would leave the detectors susceptible to vandalism, although researchers do not anticipate this exposure to be a major problem. Lead-in cables from the detectors to roadside ground boxes and cabinets must utilize cabinets, so occasional utility disruptions would probably occur just as they do with inductive loops. TTI has had these same magnetometers under S.H. 6 in College Station for about 10 years with no problems from the detectors. The 3-inch horizontal conduit for mounting these detectors under S.H. 6 is a benign environment except for water penetration. These detectors appear to function well even when completely submersed in water. There have been problems with rodents burrowing into ground boxes and chewing on cables, causing disruptions in service. Both the current tests and S.H. 6 longer-term tests indicate that two probes at each station are more accurate than one, and accurate detection of motorcycles requires three detectors. 5.3.1.2 Sensys Networks Magnetometers
Testing of the Sensys Networks magnetometers in this research yielded about 2 months of data, with some data collected at the stop line and some upstream. During that time, these magnetometers indicated a high degree of reliability. They are immune to any weather and lighting issues and installation on the pavement takes less time than inductive loops. They transmit wirelessly to the roadside with a battery life of about 10 years. They do not require conduit, at least not from the sensor nodes to the roadside, so utility work in the vicinity of the detectors will not pose a hazard. However, pavement milling would destroy these sensors since they mount flush with the pavement surface.
TTI has worked with these detectors for about 3 years on freeways and arterials. On a
previous research project, TTI and the TxDOT installed these magnetometers on I-35 in Austin, on S.H. 6 in College Station, and at the intersection of F.M. 2818 and George Bush Drive in College Station. Surface milling was responsible for destroying all of the detectors installed on I-35 (as well as inductive loops). Longevity of the S.H. 6 detectors was apparently affected by failure of the epoxy bond around three of the detectors. At the F.M. 2818 site, the Texas vendor of Sensys Networks products was unable to communicate with a few of the sensor nodes after several months of inactivity. TxDOT had installed a chip-seal treatment over these sensors that might have resulted in failure. TTI and the vendor replaced these nodes to conduct this research project. Also, TTI found the vendor software to be problematic following replacement of detectors on S.H. 6. Multiple phone calls to the manufacturer’s technical support were unsuccessful in resolving the problem. Even the Texas representative was unable to provide assistance at the level of technicality involved. It would appear that the manufacturer released firmware to the public before fully doing the necessary quality assurance that should always be a
45
prerequisite to release. At this point, the authors believe that the manufacturer could do more to provide a reliable product, especially given its high marks in the area of detection accuracy. 5.3.1.3 Wavetronix SS-200 Advance
The Wavetronix Advance is newer than the other two detectors selected for test. This fact became important in this research because even the manufacturer recommended both a controller passage time setting and mounting location at the selected intersection that were inappropriate. Also, given the relatively high number of trucks, installers should have increased the detector’s dilemma zone default limits of 2.5 to 5.5 sec to a range of perhaps 2.0 to 6.0 sec. The initial data analysis following data collection did not provide sufficient clues to suggest that a problem existed, so the discovery of this problem came too late to re-collect the data with improved settings. Fortunately, TTI had moved the detector (from 175 ft upstream to the stop line), so some of the results improved. The research team believes that the passage time setting in the controller should have been about 1.0 sec instead of 200 milliseconds.
The research team believes that the reliability of this detector, again based on limited
testing, is commendable. It is not affected by light or weather, and causes little or no traffic disruption during installation (typically mounted off the roadway on an existing pole). Cabling for connecting the detector to the cabinet will probably utilize existing conduit, so it is still somewhat vulnerable to utility work, but the authors believe this is only a minor concern. Its long-term reliability should be excellent. There is nothing that is known to go “out of adjustment” or that needs attention from a maintenance standpoint. TTI is not aware of any type of statistics that would indicate mean-time-between-failures, but its reliability is expected to rival its freeway counterparts such as the Wavetronix SS-125 (High Definition). Using these benchmarks as a guide, the authors believe the reliability of this product to be among the best. 5.3.2 Initial Cost
Cost estimates presented in this section come from equipment cost quotes to TTI from
local vendors and costs gathered from the Utah Department of Transportation. The UDOT information should be considered preliminary and subject to change simply because it had not been fully reviewed by all responsible persons and because costs for such equipment are constantly changing. Also, the TTI values might not represent the unit-cost values that could be achieved by TxDOT simply due to the buying power and potential cost reduction of larger quantities.
The cost values presented in this document are only first-time costs, so they provide a
less compelling comparison than life-cycle costs. Of course, for a life-cycle cost comparison, the analysis must include information like failure rate and frequency of maintenance calls. Failure rates of detectors are highly variable and are often not well documented. For these reasons, analyses over past years have drawn differing conclusions. Another factor is the current trend to eliminate in-road detection and replace it with detection over, under, or beside the road (“non-intrusive detection”). In some cases, this policy results in less accurate detection compared with in-road detection, which could lead to greater motorist delay. The cost of this greater delay is often ignored due to the uncertainties involved.
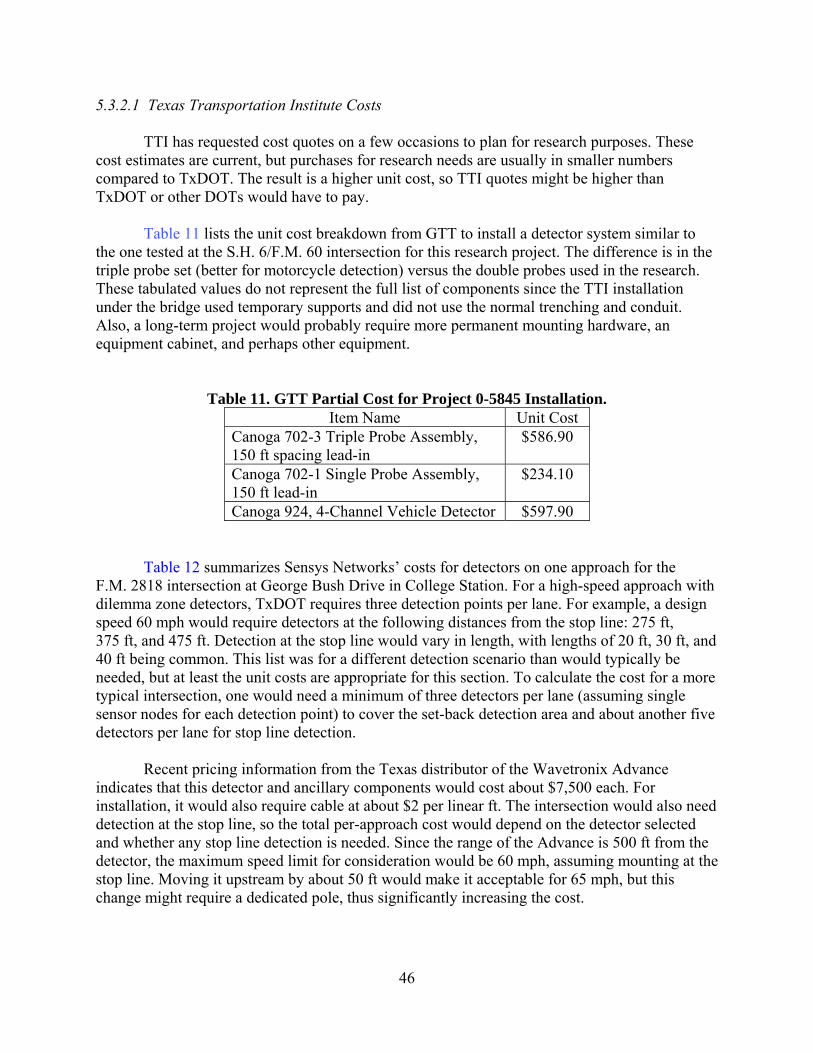
46
5.3.2.1 Texas Transportation Institute Costs
TTI has requested cost quotes on a few occasions to plan for research purposes. These cost estimates are current, but purchases for research needs are usually in smaller numbers compared to TxDOT. The result is a higher unit cost, so TTI quotes might be higher than TxDOT or other DOTs would have to pay.
Table 11 lists the unit cost breakdown from GTT to install a detector system similar to the one tested at the S.H. 6/F.M. 60 intersection for this research project. The difference is in the triple probe set (better for motorcycle detection) versus the double probes used in the research. These tabulated values do not represent the full list of components since the TTI installation under the bridge used temporary supports and did not use the normal trenching and conduit. Also, a long-term project would probably require more permanent mounting hardware, an equipment cabinet, and perhaps other equipment.
Table 11. GTT Partial Cost for Project 0-5845 Installation. Item Name Unit Cost
Canoga 702-3 Triple Probe Assembly, 150 ft spacing lead-in
$586.90
Canoga 702-1 Single Probe Assembly, 150 ft lead-in
$234.10
Canoga 924, 4-Channel Vehicle Detector $597.90 Table 12 summarizes Sensys Networks’ costs for detectors on one approach for the
F.M. 2818 intersection at George Bush Drive in College Station. For a high-speed approach with dilemma zone detectors, TxDOT requires three detection points per lane. For example, a design speed 60 mph would require detectors at the following distances from the stop line: 275 ft, 375 ft, and 475 ft. Detection at the stop line would vary in length, with lengths of 20 ft, 30 ft, and 40 ft being common. This list was for a different detection scenario than would typically be needed, but at least the unit costs are appropriate for this section. To calculate the cost for a more typical intersection, one would need a minimum of three detectors per lane (assuming single sensor nodes for each detection point) to cover the set-back detection area and about another five detectors per lane for stop line detection.
Recent pricing information from the Texas distributor of the Wavetronix Advance indicates that this detector and ancillary components would cost about $7,500 each. For installation, it would also require cable at about $2 per linear ft. The intersection would also need detection at the stop line, so the total per-approach cost would depend on the detector selected and whether any stop line detection is needed. Since the range of the Advance is 500 ft from the detector, the maximum speed limit for consideration would be 60 mph, assuming mounting at the stop line. Moving it upstream by about 50 ft would make it acceptable for 65 mph, but this change might require a dedicated pole, thus significantly increasing the cost.

47
The installer should keep the distance of the upstream detector location to a minimum to keep costs down as well as to maintain the needed dilemma zone protection near the stop line. The maximum distance upstream from the intersection for this detector to operate properly depends on the position of the dilemma zone. Stated another way, TxDOT should install the detector so that the near end of the detector’s coverage area extends to the end of the dilemma zone. The detection zone for the Advance extends to 100 ft upstream of the detector, so the installer must subtract this distance when determining the position of the detector. Many agencies use a range of travel time to the stop line to estimate the dilemma zone, frequently choosing 2.5 to 5.5 sec. The Advance allows the user to change this range. Figure 11 shows the position of the upstream pole, assuming the end of the dilemma zone is 2.0 or 2.5 sec from the stop line.
Table 12. Sensys Networks’ Costs from an Earlier Research Project. Item Name Item No. Qty. Rate Subtotal
AP240-E Access Point with Ethernet and RS-485 in NEMA 4x Enclosure
900-240-015-0-000 1 $3,000 $3,000
AP240-E/EG/EGG Power Supply 900-240-015-y-002 1 $150 $150AP240-E/EG/EGG Mounting Bracket 900-240-015-y-010 1 $150 $150RP240-B+ High Capacity Battery Operated Repeater
900-240-025-0-000 1 $600 $600
VSN240-f Flush-Mount Vehicle Sensor Node
900-240-100-0-000 10 $450 $4,500
VSN240-f Epoxy Tube (enough for 4 sensors)
240-100-0-005 3 $50 $150
BSN240-f Coring Bit 240-100-0-010 1 $500 $500
Distance to Wavetronix Pole (ft)
0.0
50.0
100.0
150.0
200.0
50 55 60 65 70
Speed Limit (mph)
Dist
ance
(ft)
2.5 sec2.0 sec
Figure 11. Maximum Distance of Advance Detector from Stop Line.
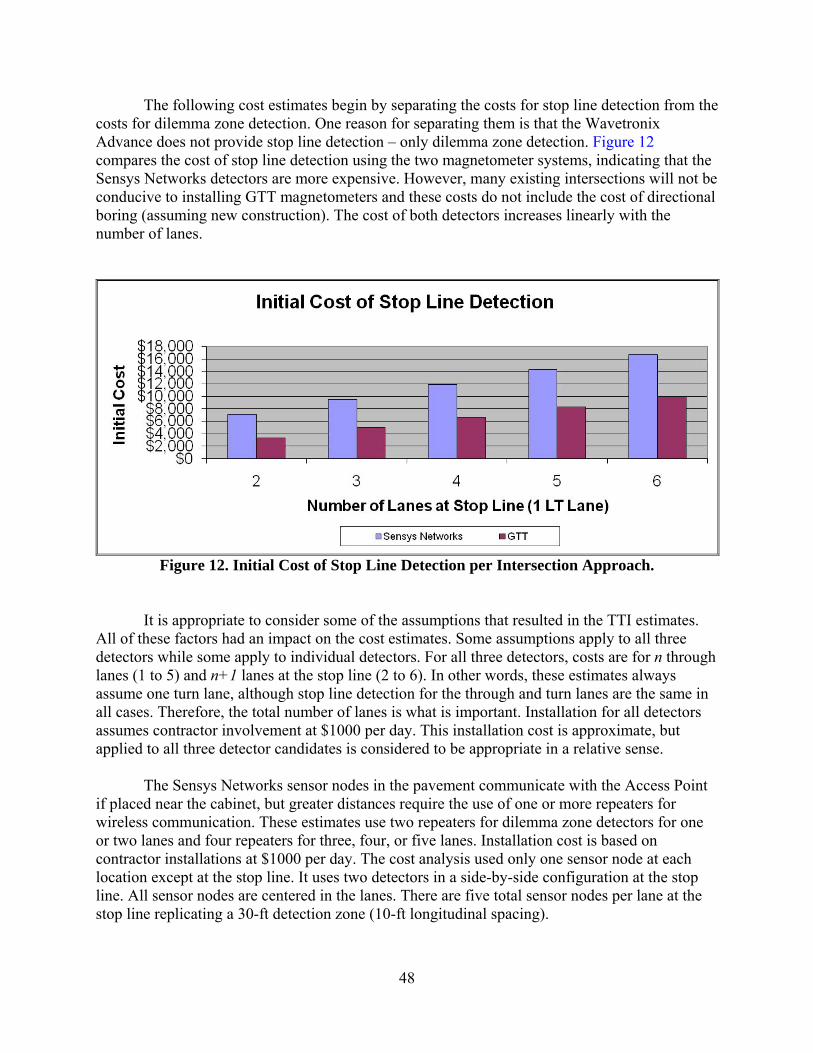
48
The following cost estimates begin by separating the costs for stop line detection from the costs for dilemma zone detection. One reason for separating them is that the Wavetronix Advance does not provide stop line detection – only dilemma zone detection. Figure 12 compares the cost of stop line detection using the two magnetometer systems, indicating that the Sensys Networks detectors are more expensive. However, many existing intersections will not be conducive to installing GTT magnetometers and these costs do not include the cost of directional boring (assuming new construction). The cost of both detectors increases linearly with the number of lanes.
Figure 12. Initial Cost of Stop Line Detection per Intersection Approach.
It is appropriate to consider some of the assumptions that resulted in the TTI estimates. All of these factors had an impact on the cost estimates. Some assumptions apply to all three detectors while some apply to individual detectors. For all three detectors, costs are for n through lanes (1 to 5) and n+1 lanes at the stop line (2 to 6). In other words, these estimates always assume one turn lane, although stop line detection for the through and turn lanes are the same in all cases. Therefore, the total number of lanes is what is important. Installation for all detectors assumes contractor involvement at $1000 per day. This installation cost is approximate, but applied to all three detector candidates is considered to be appropriate in a relative sense.
The Sensys Networks sensor nodes in the pavement communicate with the Access Point if placed near the cabinet, but greater distances require the use of one or more repeaters for wireless communication. These estimates use two repeaters for dilemma zone detectors for one or two lanes and four repeaters for three, four, or five lanes. Installation cost is based on contractor installations at $1000 per day. The cost analysis used only one sensor node at each location except at the stop line. It uses two detectors in a side-by-side configuration at the stop line. All sensor nodes are centered in the lanes. There are five total sensor nodes per lane at the stop line replicating a 30-ft detection zone (10-ft longitudinal spacing).
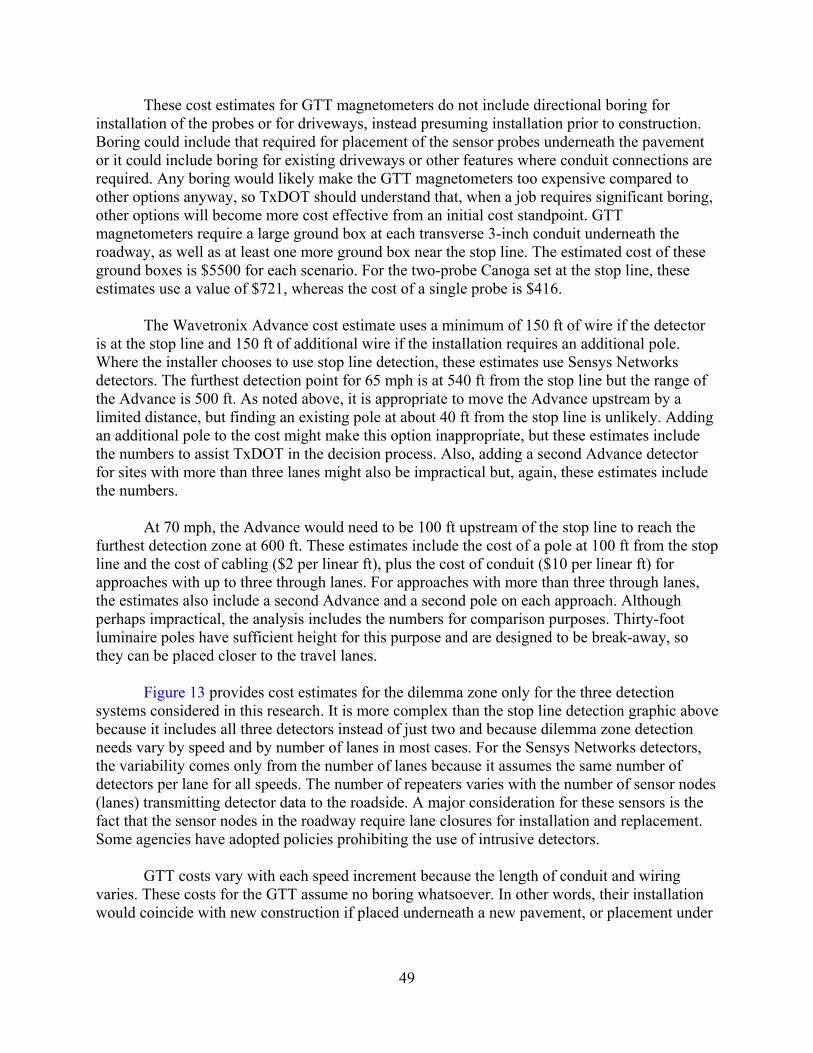
49
These cost estimates for GTT magnetometers do not include directional boring for installation of the probes or for driveways, instead presuming installation prior to construction. Boring could include that required for placement of the sensor probes underneath the pavement or it could include boring for existing driveways or other features where conduit connections are required. Any boring would likely make the GTT magnetometers too expensive compared to other options anyway, so TxDOT should understand that, when a job requires significant boring, other options will become more cost effective from an initial cost standpoint. GTT magnetometers require a large ground box at each transverse 3-inch conduit underneath the roadway, as well as at least one more ground box near the stop line. The estimated cost of these ground boxes is $5500 for each scenario. For the two-probe Canoga set at the stop line, these estimates use a value of $721, whereas the cost of a single probe is $416. The Wavetronix Advance cost estimate uses a minimum of 150 ft of wire if the detector is at the stop line and 150 ft of additional wire if the installation requires an additional pole. Where the installer chooses to use stop line detection, these estimates use Sensys Networks detectors. The furthest detection point for 65 mph is at 540 ft from the stop line but the range of the Advance is 500 ft. As noted above, it is appropriate to move the Advance upstream by a limited distance, but finding an existing pole at about 40 ft from the stop line is unlikely. Adding an additional pole to the cost might make this option inappropriate, but these estimates include the numbers to assist TxDOT in the decision process. Also, adding a second Advance detector for sites with more than three lanes might also be impractical but, again, these estimates include the numbers. At 70 mph, the Advance would need to be 100 ft upstream of the stop line to reach the furthest detection zone at 600 ft. These estimates include the cost of a pole at 100 ft from the stop line and the cost of cabling ($2 per linear ft), plus the cost of conduit ($10 per linear ft) for approaches with up to three through lanes. For approaches with more than three through lanes, the estimates also include a second Advance and a second pole on each approach. Although perhaps impractical, the analysis includes the numbers for comparison purposes. Thirty-foot luminaire poles have sufficient height for this purpose and are designed to be break-away, so they can be placed closer to the travel lanes.
Figure 13 provides cost estimates for the dilemma zone only for the three detection systems considered in this research. It is more complex than the stop line detection graphic above because it includes all three detectors instead of just two and because dilemma zone detection needs vary by speed and by number of lanes in most cases. For the Sensys Networks detectors, the variability comes only from the number of lanes because it assumes the same number of detectors per lane for all speeds. The number of repeaters varies with the number of sensor nodes (lanes) transmitting detector data to the roadside. A major consideration for these sensors is the fact that the sensor nodes in the roadway require lane closures for installation and replacement. Some agencies have adopted policies prohibiting the use of intrusive detectors.
GTT costs vary with each speed increment because the length of conduit and wiring
varies. These costs for the GTT assume no boring whatsoever. In other words, their installation would coincide with new construction if placed underneath a new pavement, or placement under
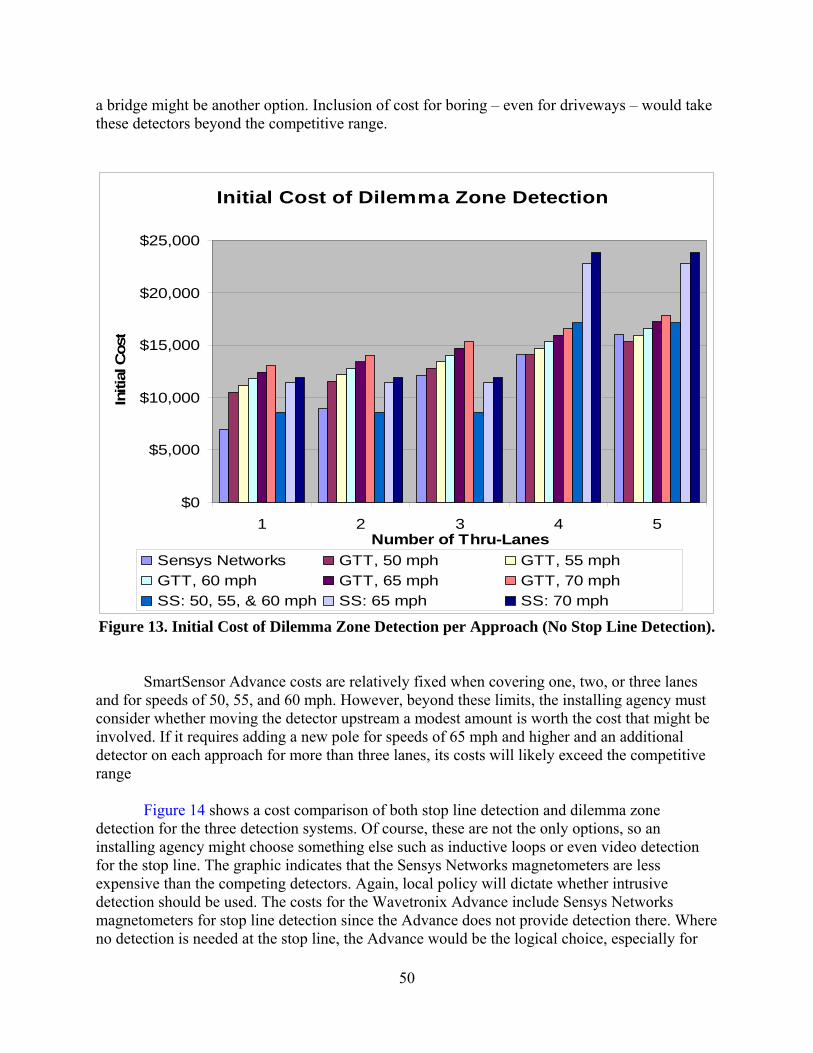
50
a bridge might be another option. Inclusion of cost for boring – even for driveways – would take these detectors beyond the competitive range.
Initial Cost of Dilemma Zone Detection
$0
$5,000
$10,000
$15,000
$20,000
$25,000
1 2 3 4 5Number of Thru-Lanes
Initi
al C
ost
Sensys Networks GTT, 50 mph GTT, 55 mphGTT, 60 mph GTT, 65 mph GTT, 70 mphSS: 50, 55, & 60 mph SS: 65 mph SS: 70 mph
Figure 13. Initial Cost of Dilemma Zone Detection per Approach (No Stop Line Detection).
SmartSensor Advance costs are relatively fixed when covering one, two, or three lanes and for speeds of 50, 55, and 60 mph. However, beyond these limits, the installing agency must consider whether moving the detector upstream a modest amount is worth the cost that might be involved. If it requires adding a new pole for speeds of 65 mph and higher and an additional detector on each approach for more than three lanes, its costs will likely exceed the competitive range Figure 14 shows a cost comparison of both stop line detection and dilemma zone detection for the three detection systems. Of course, these are not the only options, so an installing agency might choose something else such as inductive loops or even video detection for the stop line. The graphic indicates that the Sensys Networks magnetometers are less expensive than the competing detectors. Again, local policy will dictate whether intrusive detection should be used. The costs for the Wavetronix Advance include Sensys Networks magnetometers for stop line detection since the Advance does not provide detection there. Where no detection is needed at the stop line, the Advance would be the logical choice, especially for
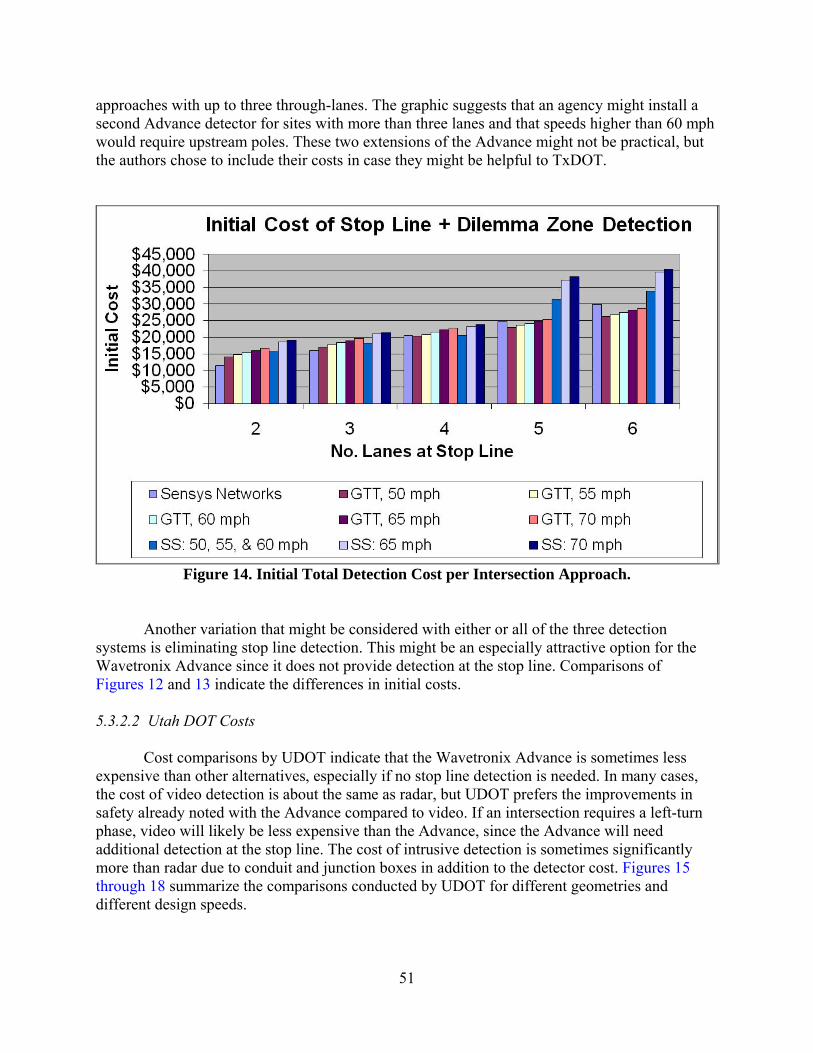
51
approaches with up to three through-lanes. The graphic suggests that an agency might install a second Advance detector for sites with more than three lanes and that speeds higher than 60 mph would require upstream poles. These two extensions of the Advance might not be practical, but the authors chose to include their costs in case they might be helpful to TxDOT.
Figure 14. Initial Total Detection Cost per Intersection Approach.
Another variation that might be considered with either or all of the three detection systems is eliminating stop line detection. This might be an especially attractive option for the Wavetronix Advance since it does not provide detection at the stop line. Comparisons of Figures 12 and 13 indicate the differences in initial costs. 5.3.2.2 Utah DOT Costs
Cost comparisons by UDOT indicate that the Wavetronix Advance is sometimes less expensive than other alternatives, especially if no stop line detection is needed. In many cases, the cost of video detection is about the same as radar, but UDOT prefers the improvements in safety already noted with the Advance compared to video. If an intersection requires a left-turn phase, video will likely be less expensive than the Advance, since the Advance will need additional detection at the stop line. The cost of intrusive detection is sometimes significantly more than radar due to conduit and junction boxes in addition to the detector cost. Figures 15 through 18 summarize the comparisons conducted by UDOT for different geometries and different design speeds.
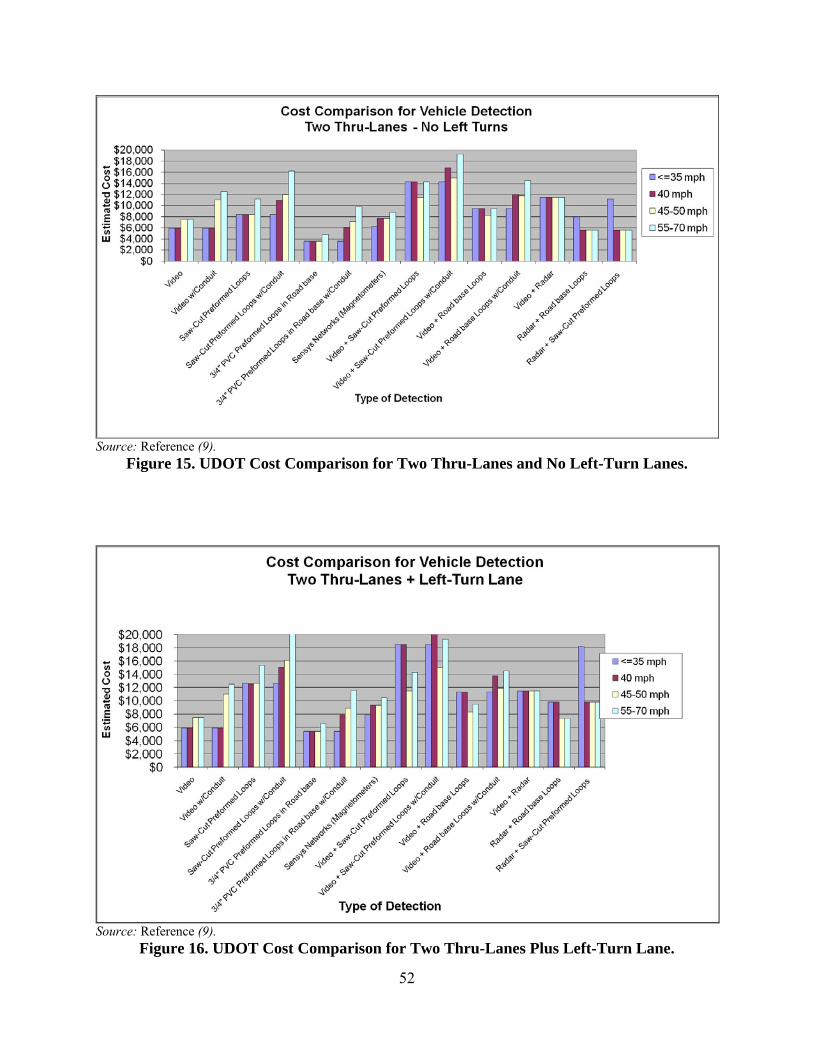
52
Source: Reference (9).
Figure 15. UDOT Cost Comparison for Two Thru-Lanes and No Left-Turn Lanes.
Source: Reference (9).
Figure 16. UDOT Cost Comparison for Two Thru-Lanes Plus Left-Turn Lane.

53
Source: Reference (9).
Figure 17. UDOT Cost Comparison for Three Thru-Lanes and No Left-Turn Lanes.
Source: Reference (9).
Figure 18. UDOT Cost Comparison for Three Thru-Lanes Plus Left-Turn Lane.
54
5.3.3 User-Friendliness
Interfacing with the controller is important, although this research did not offer the opportunity to test this attribute on all three detectors. TTI only set up the Wavetronix Advance to control the intersection in Cedar Park. The two magnetometers would use detector cards in the equipment cabinet to communicate with the controller to indicate the presence of a vehicle. These two detectors would require a different “passage time” value in the controller compared to the Advance due to differences in how point detectors and the radar detector operate. Technicians will not, at first, understand this difference and will need to be trained on this difference, since most will understand passage time from the perspective of point detection.
5.3.3.1 Global Traffic Technologies
In terms of the cabinet aspects of this detector system, the interface provided by the GTT magnetometers is similar to inductive loops. Technicians who have used inductive loops will find this system to be intuitive and will probably not find many surprises in its operation. It is not a fancy system, but it works, and that is what matters most. The adjustments after installation basically boil down to sensitivity of each detector. The depth of installation plays a role in how sensitive they can be. Sensitivity settings that are too high can cause spillover detections from adjacent lanes, especially from tall vehicles such as large trucks. 5.3.3.2 Sensys Networks The Sensys Networks system has several noteworthy features. One is its accuracy for both moving traffic and for stopped vehicles. Its design as a wireless system is both positive and negative. On the plus side, its installation facilitates short traffic disruptions, and the installation procedure is pretty straightforward. Being wireless from the sensor to the roadside and from the repeaters to the Access Point at the cabinet is positive in the fact that it does not need conduit. Conduit is subject to being damaged and can be expensive. Although battery life is often perceived as a concern, early tests indicate life expectancy of the battery to range from 8.5 to 13 years, depending on sampling rate, traffic volume, and environmental elements. Therefore, the battery life in most cases should be acceptable.
One feature that should raise concern for users of the Sensys system is its software. Based on the TTI experience compared to vendor statements, the software does not fully accomplish the manufacturer’s intended purposes and needs considerable work. TTI experienced difficulty getting all the communication elements to function as intended, and that difficulty rendered the system completely useless without technical support. The manufacturer must be willing to provide a substantial amount of on-site support to get a new user comfortable with this system. Many DOTs would be even less likely than research personnel to get this complex system to a state of being fully functional without considerable on-site assistance.
55
5.3.3.3 Wavetronix Advance
Comments on the user-friendliness of this detector come from three installations – two in Cedar Park and one in College Station. The two Cedar Park locations were on R.M. 1431 at the stop line and 175 ft upstream at the intersection of Stone Oak Drive. TTI researchers integrated the detector with the intersection controller to provide dilemma zone protection on the main street approaches to the intersection. Researchers collected data from both installation locations at the R.M. 1431 intersection, but they did not collect data at the College Station site. The only real challenge to installing this detector was getting the correct aim on the detector. Some agencies have developed a sighting device to optimize the aim for best performance and to expedite installation. The user interface for this detector is intuitive and presented no problems during any setups.
Going beyond what most agencies will need in this detector, TTI accessed some of the advanced features of the software to collect the real-time sensor messages (every 10 milliseconds). These messages provide the number of vehicles in the detection zone and the speed and distance from the stop line of each vehicle. TTI researchers used the software once to upgrade the detector’s firmware and found the process to be simple and easy. Overall, TTI researchers found that the software to setup and configure the detection zones and enter the data elements required by the sensor is simple, intuitive, and easy to use, and provides the user with real-time visual feedback on sensor operation. TTI researchers did not have any problems in using the software or the sensor during the data collection process.

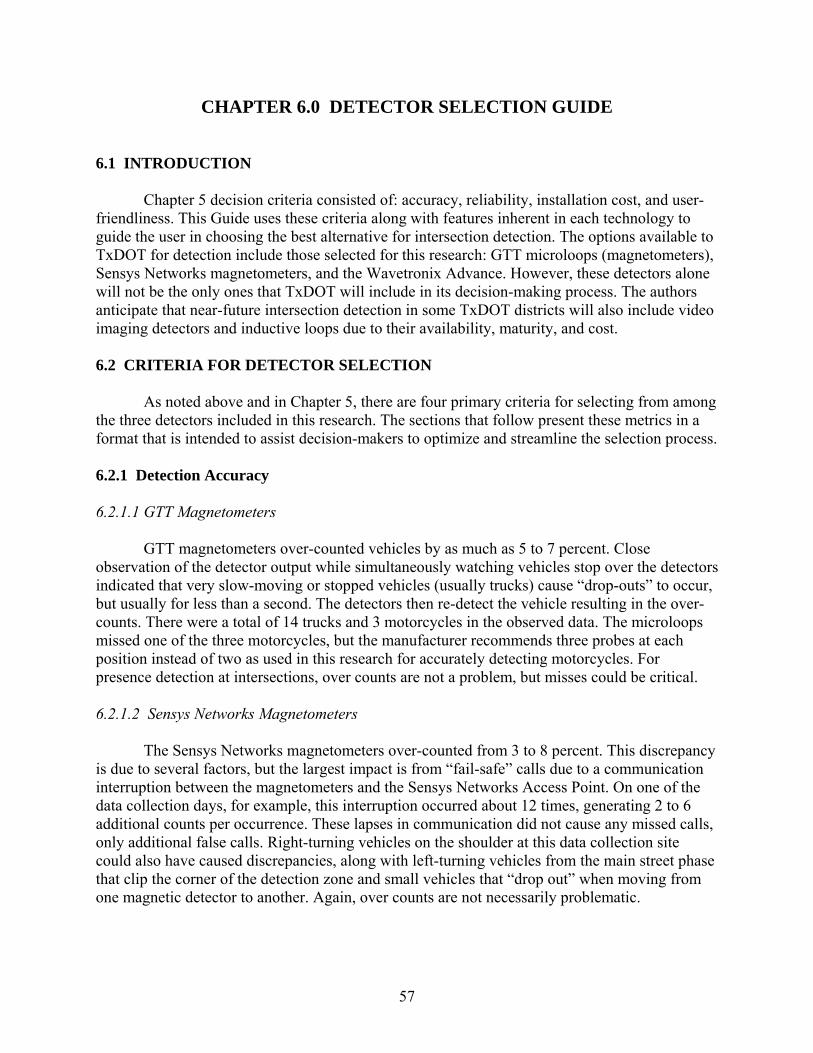
57
CHAPTER 6.0 DETECTOR SELECTION GUIDE 6.1 INTRODUCTION
Chapter 5 decision criteria consisted of: accuracy, reliability, installation cost, and user-friendliness. This Guide uses these criteria along with features inherent in each technology to guide the user in choosing the best alternative for intersection detection. The options available to TxDOT for detection include those selected for this research: GTT microloops (magnetometers), Sensys Networks magnetometers, and the Wavetronix Advance. However, these detectors alone will not be the only ones that TxDOT will include in its decision-making process. The authors anticipate that near-future intersection detection in some TxDOT districts will also include video imaging detectors and inductive loops due to their availability, maturity, and cost.
6.2 CRITERIA FOR DETECTOR SELECTION
As noted above and in Chapter 5, there are four primary criteria for selecting from among
the three detectors included in this research. The sections that follow present these metrics in a format that is intended to assist decision-makers to optimize and streamline the selection process. 6.2.1 Detection Accuracy 6.2.1.1 GTT Magnetometers
GTT magnetometers over-counted vehicles by as much as 5 to 7 percent. Close observation of the detector output while simultaneously watching vehicles stop over the detectors indicated that very slow-moving or stopped vehicles (usually trucks) cause “drop-outs” to occur, but usually for less than a second. The detectors then re-detect the vehicle resulting in the over-counts. There were a total of 14 trucks and 3 motorcycles in the observed data. The microloops missed one of the three motorcycles, but the manufacturer recommends three probes at each position instead of two as used in this research for accurately detecting motorcycles. For presence detection at intersections, over counts are not a problem, but misses could be critical. 6.2.1.2 Sensys Networks Magnetometers
The Sensys Networks magnetometers over-counted from 3 to 8 percent. This discrepancy is due to several factors, but the largest impact is from “fail-safe” calls due to a communication interruption between the magnetometers and the Sensys Networks Access Point. On one of the data collection days, for example, this interruption occurred about 12 times, generating 2 to 6 additional counts per occurrence. These lapses in communication did not cause any missed calls, only additional false calls. Right-turning vehicles on the shoulder at this data collection site could also have caused discrepancies, along with left-turning vehicles from the main street phase that clip the corner of the detection zone and small vehicles that “drop out” when moving from one magnetic detector to another. Again, over counts are not necessarily problematic.
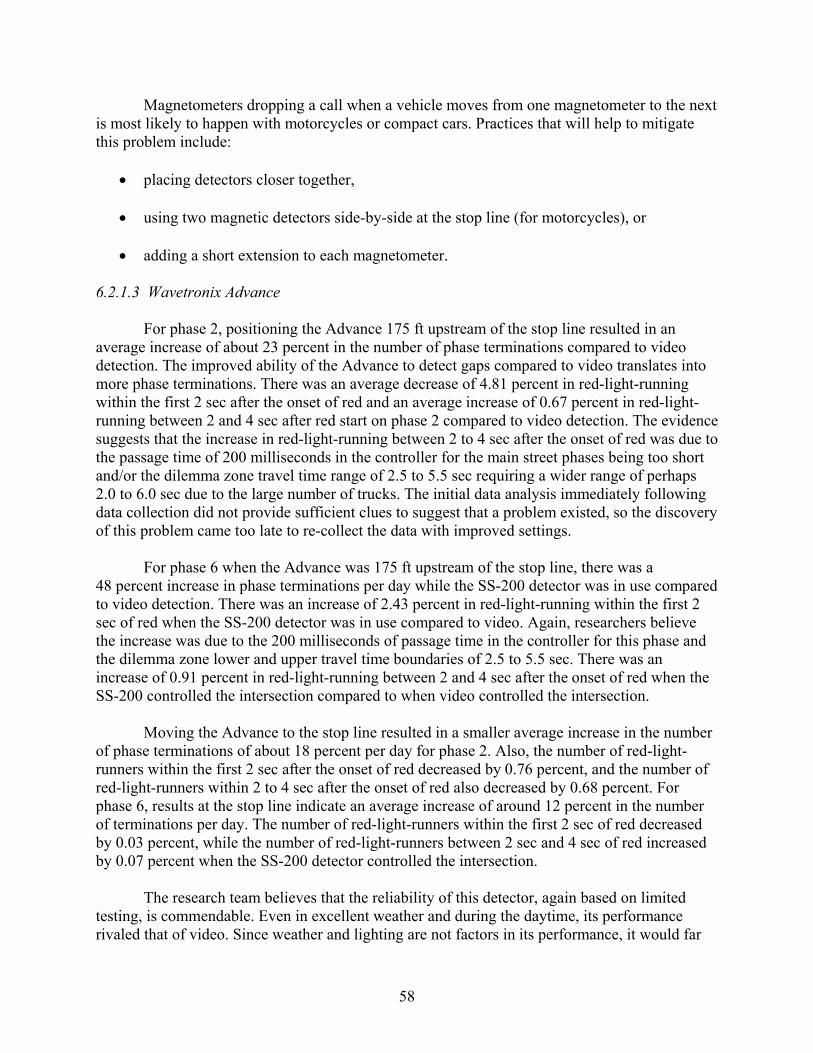
58
Magnetometers dropping a call when a vehicle moves from one magnetometer to the next is most likely to happen with motorcycles or compact cars. Practices that will help to mitigate this problem include:
• placing detectors closer together,
• using two magnetic detectors side-by-side at the stop line (for motorcycles), or
• adding a short extension to each magnetometer.
6.2.1.3 Wavetronix Advance
For phase 2, positioning the Advance 175 ft upstream of the stop line resulted in an average increase of about 23 percent in the number of phase terminations compared to video detection. The improved ability of the Advance to detect gaps compared to video translates into more phase terminations. There was an average decrease of 4.81 percent in red-light-running within the first 2 sec after the onset of red and an average increase of 0.67 percent in red-light-running between 2 and 4 sec after red start on phase 2 compared to video detection. The evidence suggests that the increase in red-light-running between 2 to 4 sec after the onset of red was due to the passage time of 200 milliseconds in the controller for the main street phases being too short and/or the dilemma zone travel time range of 2.5 to 5.5 sec requiring a wider range of perhaps 2.0 to 6.0 sec due to the large number of trucks. The initial data analysis immediately following data collection did not provide sufficient clues to suggest that a problem existed, so the discovery of this problem came too late to re-collect the data with improved settings.
For phase 6 when the Advance was 175 ft upstream of the stop line, there was a 48 percent increase in phase terminations per day while the SS-200 detector was in use compared to video detection. There was an increase of 2.43 percent in red-light-running within the first 2 sec of red when the SS-200 detector was in use compared to video. Again, researchers believe the increase was due to the 200 milliseconds of passage time in the controller for this phase and the dilemma zone lower and upper travel time boundaries of 2.5 to 5.5 sec. There was an increase of 0.91 percent in red-light-running between 2 and 4 sec after the onset of red when the SS-200 controlled the intersection compared to when video controlled the intersection.
Moving the Advance to the stop line resulted in a smaller average increase in the number of phase terminations of about 18 percent per day for phase 2. Also, the number of red-light-runners within the first 2 sec after the onset of red decreased by 0.76 percent, and the number of red-light-runners within 2 to 4 sec after the onset of red also decreased by 0.68 percent. For phase 6, results at the stop line indicate an average increase of around 12 percent in the number of terminations per day. The number of red-light-runners within the first 2 sec of red decreased by 0.03 percent, while the number of red-light-runners between 2 sec and 4 sec of red increased by 0.07 percent when the SS-200 detector controlled the intersection.
The research team believes that the reliability of this detector, again based on limited
testing, is commendable. Even in excellent weather and during the daytime, its performance rivaled that of video. Since weather and lighting are not factors in its performance, it would far
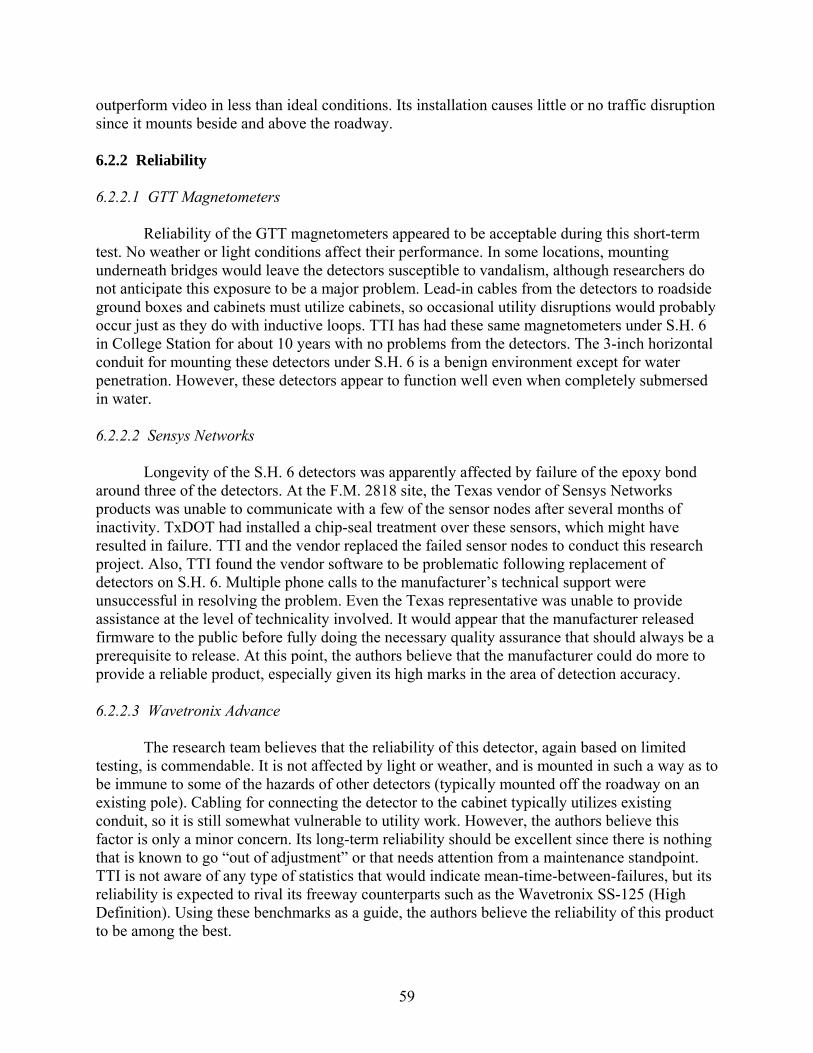
59
outperform video in less than ideal conditions. Its installation causes little or no traffic disruption since it mounts beside and above the roadway. 6.2.2 Reliability 6.2.2.1 GTT Magnetometers
Reliability of the GTT magnetometers appeared to be acceptable during this short-term test. No weather or light conditions affect their performance. In some locations, mounting underneath bridges would leave the detectors susceptible to vandalism, although researchers do not anticipate this exposure to be a major problem. Lead-in cables from the detectors to roadside ground boxes and cabinets must utilize cabinets, so occasional utility disruptions would probably occur just as they do with inductive loops. TTI has had these same magnetometers under S.H. 6 in College Station for about 10 years with no problems from the detectors. The 3-inch horizontal conduit for mounting these detectors under S.H. 6 is a benign environment except for water penetration. However, these detectors appear to function well even when completely submersed in water. 6.2.2.2 Sensys Networks
Longevity of the S.H. 6 detectors was apparently affected by failure of the epoxy bond around three of the detectors. At the F.M. 2818 site, the Texas vendor of Sensys Networks products was unable to communicate with a few of the sensor nodes after several months of inactivity. TxDOT had installed a chip-seal treatment over these sensors, which might have resulted in failure. TTI and the vendor replaced the failed sensor nodes to conduct this research project. Also, TTI found the vendor software to be problematic following replacement of detectors on S.H. 6. Multiple phone calls to the manufacturer’s technical support were unsuccessful in resolving the problem. Even the Texas representative was unable to provide assistance at the level of technicality involved. It would appear that the manufacturer released firmware to the public before fully doing the necessary quality assurance that should always be a prerequisite to release. At this point, the authors believe that the manufacturer could do more to provide a reliable product, especially given its high marks in the area of detection accuracy. 6.2.2.3 Wavetronix Advance
The research team believes that the reliability of this detector, again based on limited testing, is commendable. It is not affected by light or weather, and is mounted in such a way as to be immune to some of the hazards of other detectors (typically mounted off the roadway on an existing pole). Cabling for connecting the detector to the cabinet typically utilizes existing conduit, so it is still somewhat vulnerable to utility work. However, the authors believe this factor is only a minor concern. Its long-term reliability should be excellent since there is nothing that is known to go “out of adjustment” or that needs attention from a maintenance standpoint. TTI is not aware of any type of statistics that would indicate mean-time-between-failures, but its reliability is expected to rival its freeway counterparts such as the Wavetronix SS-125 (High Definition). Using these benchmarks as a guide, the authors believe the reliability of this product to be among the best.

60
6.2.3 Initial Cost
Costs vary for each of the three detectors by number of lanes and, in most cases, according to speeds. Because some agencies operate under a mandatory low-cost policy, this consideration could take precedence over other factors, including accuracy. There are some factors such as user-friendliness, product maturity, and intrusiveness that are difficult to quantify in the cost category. Also, the life-cycle cost is actually a better metric than initial cost, but historical cost information is not available on all detectors at this time. The costs provided in this document are for each intersection approach.
The following cost comparisons include both stop line and dilemma zone detection
combined. For the Wavetronix SmartSensor, the analysis uses Sensys Networks magnetometer costs for the stop line. Other detectors such as inductive loops and video could also provide this coverage but the purpose of this research was to identify and evaluate new detectors. Since the Wavetronix detector does not cover the stop line, some agencies that are using this detector are not using stop line detection at all in limited cases. For consistency with other graphics in this document, Figures 19 through 23 show costs based on n through-lanes and n+1 lanes at the stop line for speeds from 50 mph through 70 mph. Table 13 summarizes these costs. Again, these costs are for both the stop line and the dilemma zone detectors. For 50, 55, and 60 mph, these findings indicate that Sensys Networks magnetometers are the least expensive for all but one lane scenario. The Wavetronix Advance (combined with Sensys magnetometers at the stop line) is the least expensive for three through-lanes (four lanes at the stop line) by a narrow margin. For 65 and 70 mph, Sensys Networks magnetometers are the least expensive for all lane scenarios. Of course, eliminating stop line detection would reduce the costs significantly for all three systems.
Initial Detector Cost for 50 mph
$0$5,000
$10,000$15,000$20,000$25,000$30,000$35,000$40,000
2 3 4 5 6
No. of Lanes at Stop Line
Initi
al C
ost
Sensys Networks GTT Wavetronix Advance
Figure 19. Initial Detector Cost Comparison for 50 mph.
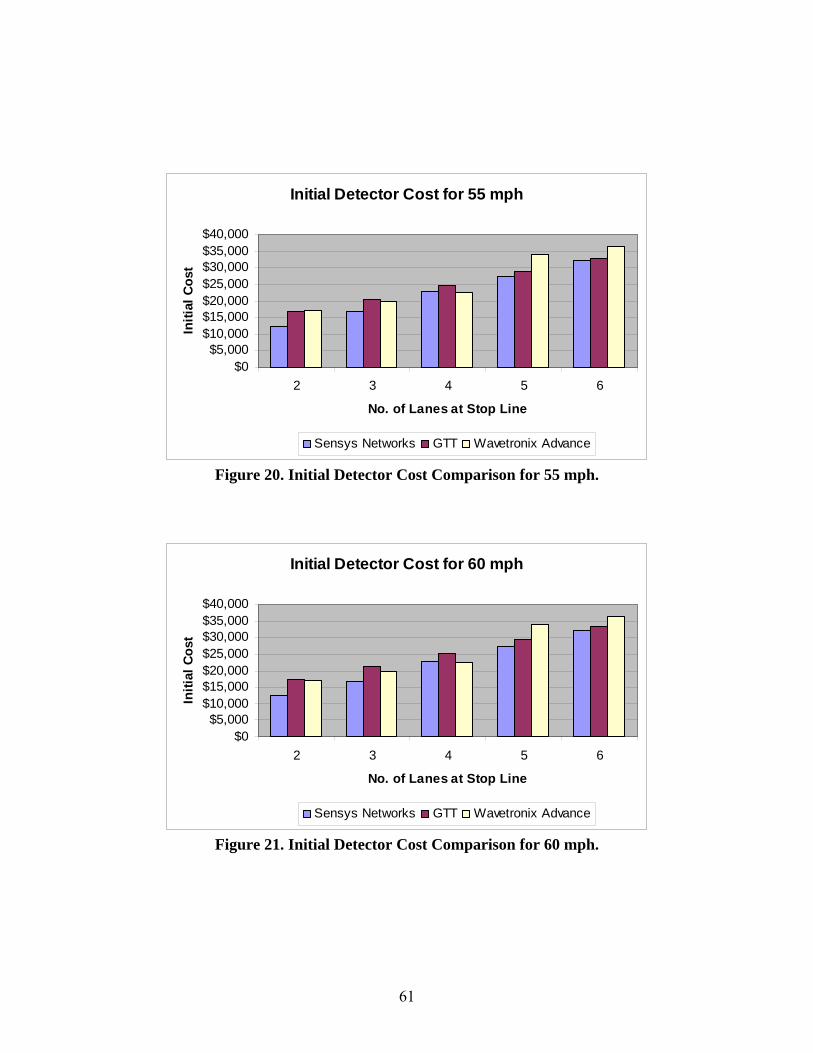
61
Initial Detector Cost for 55 mph
$0$5,000
$10,000$15,000$20,000$25,000$30,000$35,000$40,000
2 3 4 5 6
No. of Lanes at Stop Line
Initi
al C
ost
Sensys Networks GTT Wavetronix Advance
Figure 20. Initial Detector Cost Comparison for 55 mph.
Initial Detector Cost for 60 mph
$0$5,000
$10,000$15,000$20,000$25,000$30,000$35,000$40,000
2 3 4 5 6
No. of Lanes at Stop Line
Initi
al C
ost
Sensys Networks GTT Wavetronix Advance
Figure 21. Initial Detector Cost Comparison for 60 mph.
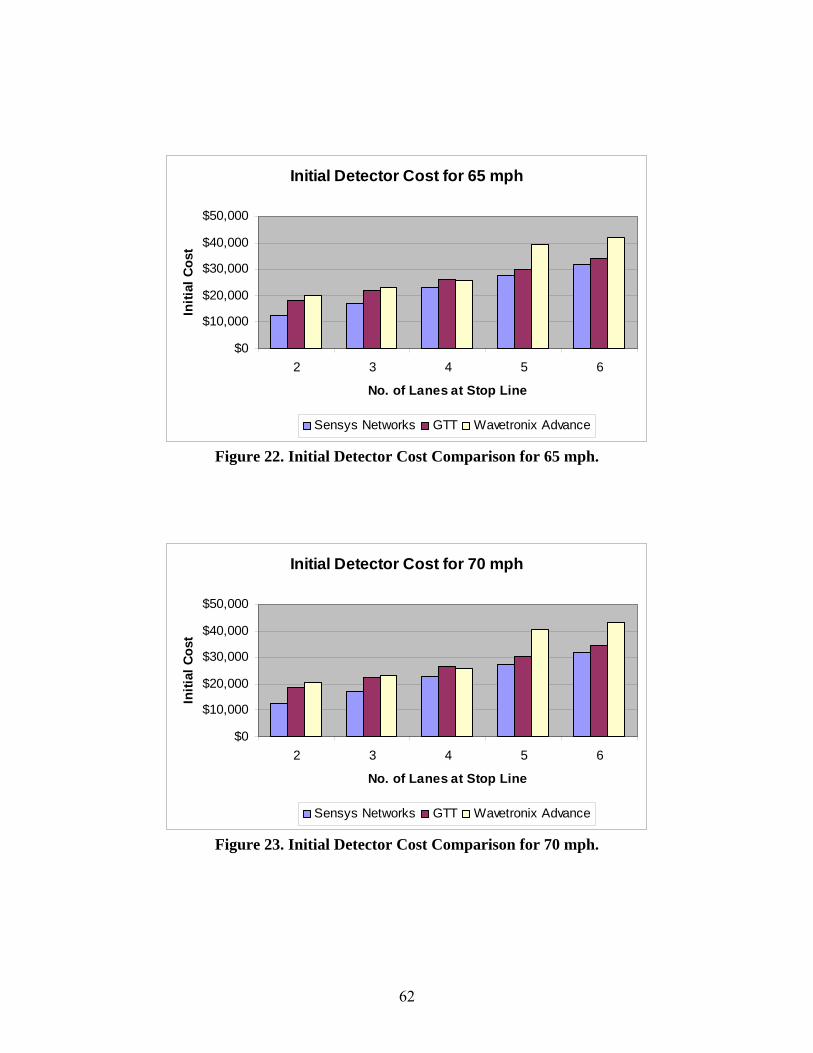
62
Initial Detector Cost for 65 mph
$0
$10,000
$20,000
$30,000
$40,000
$50,000
2 3 4 5 6
No. of Lanes at Stop Line
Initi
al C
ost
Sensys Networks GTT Wavetronix Advance
Figure 22. Initial Detector Cost Comparison for 65 mph.
Initial Detector Cost for 70 mph
$0
$10,000
$20,000
$30,000
$40,000
$50,000
2 3 4 5 6
No. of Lanes at Stop Line
Initi
al C
ost
Sensys Networks GTT Wavetronix Advance
Figure 23. Initial Detector Cost Comparison for 70 mph.
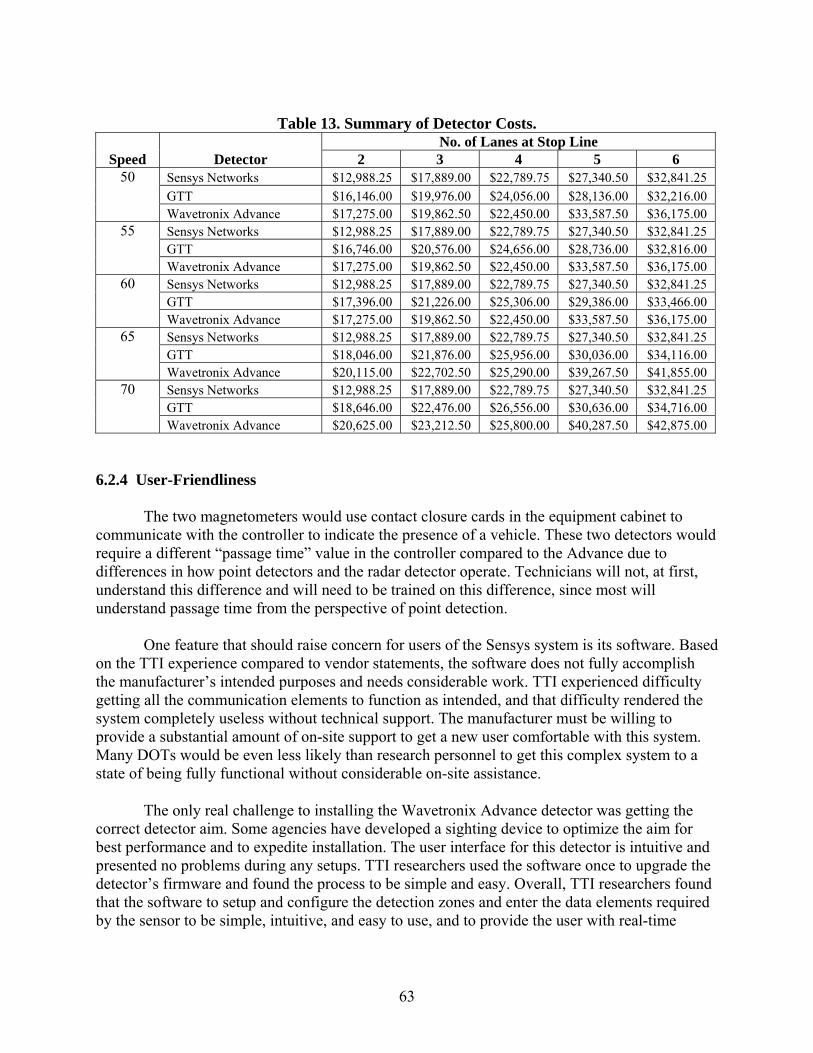
63
Table 13. Summary of Detector Costs.
Speed Detector No. of Lanes at Stop Line
2 3 4 5 6 50 Sensys Networks $12,988.25 $17,889.00 $22,789.75 $27,340.50 $32,841.25
GTT $16,146.00 $19,976.00 $24,056.00 $28,136.00 $32,216.00 Wavetronix Advance $17,275.00 $19,862.50 $22,450.00 $33,587.50 $36,175.00
55 Sensys Networks $12,988.25 $17,889.00 $22,789.75 $27,340.50 $32,841.25 GTT $16,746.00 $20,576.00 $24,656.00 $28,736.00 $32,816.00 Wavetronix Advance $17,275.00 $19,862.50 $22,450.00 $33,587.50 $36,175.00
60 Sensys Networks $12,988.25 $17,889.00 $22,789.75 $27,340.50 $32,841.25 GTT $17,396.00 $21,226.00 $25,306.00 $29,386.00 $33,466.00 Wavetronix Advance $17,275.00 $19,862.50 $22,450.00 $33,587.50 $36,175.00
65 Sensys Networks $12,988.25 $17,889.00 $22,789.75 $27,340.50 $32,841.25 GTT $18,046.00 $21,876.00 $25,956.00 $30,036.00 $34,116.00 Wavetronix Advance $20,115.00 $22,702.50 $25,290.00 $39,267.50 $41,855.00
70 Sensys Networks $12,988.25 $17,889.00 $22,789.75 $27,340.50 $32,841.25 GTT $18,646.00 $22,476.00 $26,556.00 $30,636.00 $34,716.00 Wavetronix Advance $20,625.00 $23,212.50 $25,800.00 $40,287.50 $42,875.00
6.2.4 User-Friendliness The two magnetometers would use contact closure cards in the equipment cabinet to
communicate with the controller to indicate the presence of a vehicle. These two detectors would require a different “passage time” value in the controller compared to the Advance due to differences in how point detectors and the radar detector operate. Technicians will not, at first, understand this difference and will need to be trained on this difference, since most will understand passage time from the perspective of point detection.
One feature that should raise concern for users of the Sensys system is its software. Based
on the TTI experience compared to vendor statements, the software does not fully accomplish the manufacturer’s intended purposes and needs considerable work. TTI experienced difficulty getting all the communication elements to function as intended, and that difficulty rendered the system completely useless without technical support. The manufacturer must be willing to provide a substantial amount of on-site support to get a new user comfortable with this system. Many DOTs would be even less likely than research personnel to get this complex system to a state of being fully functional without considerable on-site assistance.
The only real challenge to installing the Wavetronix Advance detector was getting the correct detector aim. Some agencies have developed a sighting device to optimize the aim for best performance and to expedite installation. The user interface for this detector is intuitive and presented no problems during any setups. TTI researchers used the software once to upgrade the detector’s firmware and found the process to be simple and easy. Overall, TTI researchers found that the software to setup and configure the detection zones and enter the data elements required by the sensor to be simple, intuitive, and easy to use, and to provide the user with real-time

64
visual feedback on sensor operation. TTI researchers did not have any problems in using the software or the sensor during the data collection process.
6.3 DETECTOR SELECTION SUMMARY The following steps will assist TxDOT in determining the candidate detection type that
best fits the situation. These steps should prompt decision-makers to eliminate the least likely detectors to fulfill the need.
Step 1: Determine design speed, intersection geometry, local policy on intrusive detection, and pavement type within 100 ft of stop line.
• Design speed: o 50 mph, o 55 mph, o 60 mph, o 65 mph, or o 70 mph.
• Geometry on each approach:
o one through-lane, one right-turn lane; o two through-lanes, one right-turn lane; o three through-lanes, one right-turn lane; o four through-lanes, one right-turn lane; or o five through-lanes, one right-turn lane.
• Intrusive detection an option? o Yes, or o No.
• Pavement type 100 ft from stop line? o Concrete, or o Asphalt.
• Number of trucks/day? o Low, o Medium, or o High.
• If asphalt, next planned rehab of pavement surface? o < x yr, or o over x yr.
65
• Motorcycle detection: o critical, o important, or o not important.
Step 2: Determine availability of mounting locations for microloop probes. Step 3: Based on steps and considerations above, determine all the detector options. Step 4: Determine costs of the selected option(s) based on local information. If local information is not readily available, use TTI costs in this report or UDOT costs as a general guide. Step 5: Select the best option.
• Formulate final decision criteria: o detection accuracy, o reliability, o cost, o user-friendliness, o other issues
interface with existing detectors or other equipment, or district experience level.
Figure 24 is a flowchart of the detector selection process. Options for stop line detection
are the Sensys Networks magnetometers and GTT magnetometers, whereas options for dilemma zone protection are these two detectors plus the Wavetronix Advance. 6.4 IMPLEMENTATION NEEDS
Based on the findings of this project, there is an urgent need to assist districts in the use of the Wavetronix Advance at high-speed Texas intersections as an implementation project. A few districts have already installed this detector at high-speed intersections without the critically needed information to set the controller passage time and the dilemma zone range. Research findings from this project indicate that the passage time of 200 milliseconds as initially recommended by the manufacturer is too short. It should range from 500 milliseconds to 1 sec. Also, where the number of trucks is high, the range of dilemma zone settings should be increased from the default range of 2.5 to 5.5 sec to a wider range. Therefore, this implementation project would check all the sites that TxDOT has already installed to guide technicians on the appropriate settings. Aiming the device is also not well understood, so the implementation project would include guidance on that aspect as well. The installation and setup of the detector are fairly well understood, but some of the settings need to be checked. TTI recommends an implementation project to check detectors that are already installed at intersections in central Texas (or are being planned for installation). It is anticipated that a range of the following variables will be available:
• traffic volume on main street,

66
• traffic volume on minor street,
• truck volume on the main street,
• speeds on main street from 45 mph to 70 mph,
• left turn volume on main street variable, and
• approaches with special geometric conditions (e.g., horizontal curves).
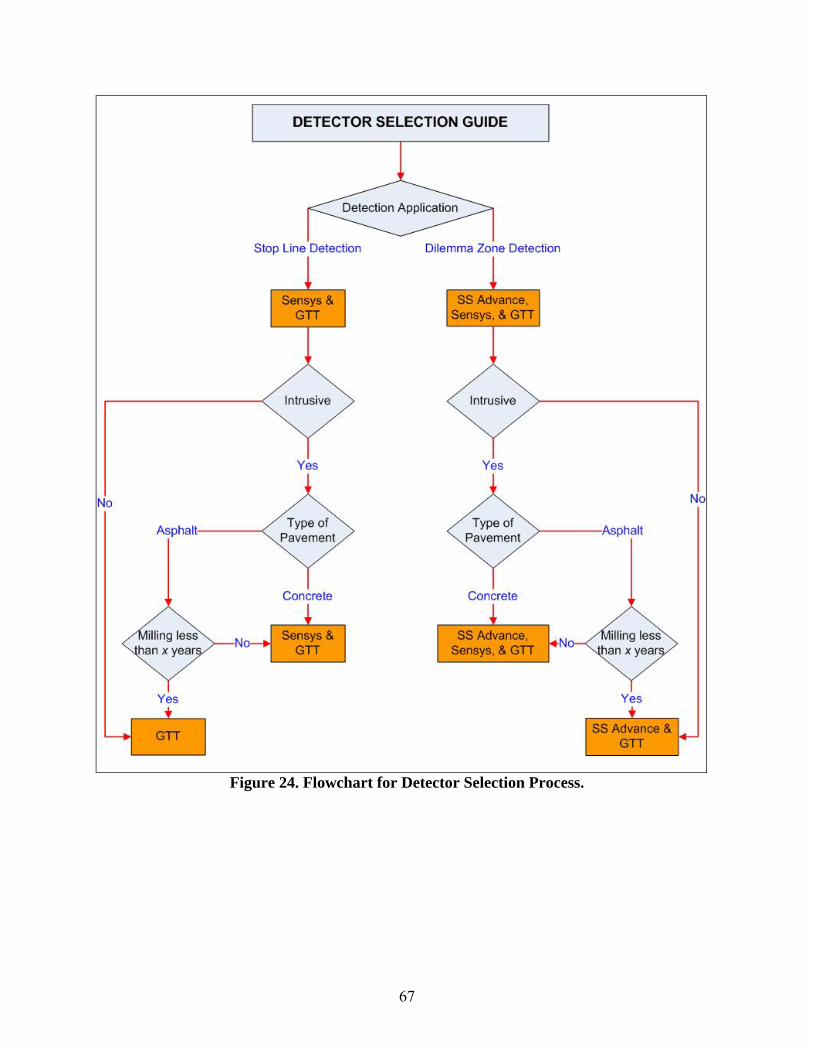
67
Figure 24. Flowchart for Detector Selection Process.


69
REFERENCES
1. Middleton, D., R. Parker, and R. Longmire. Investigation of Vehicle Detector Performance and ATMS Interface. Research Report FHWA/TX-07/0-4750-2, Texas Transportation Institute, The Texas A&M University System, College Station, TX, January 2006.
2. http://www.wavetronix.com/smartsensor/200/, Accessed February 5, 2007. 3. Sharma, A., M. Harding, B. Giles, D. Bullock, J. Sturdevant, and S. Peeta. “Performance
Requirements and Evaluation Procedures for Advance Wide Area Detectors.” Submitted to the Transportation Research Board for publication and presentation at the 87th Annual Meeting, Washington, D.C., 2008.
4. http://paleale.eecs.berkeley.edu/~varaiya/papers_ps.dir/sensors_its_final9.pdf, Accessed
February 5, 2007.
5. 3M Canoga Application Note, Canoga Vehicle Detection System. “Accurate Vehicle Detection at Intersections Using 3M Canoga M702 Non-Invasive Microloops,” TM-2003-11, June 2003.
6. Middleton, D., R. Parker. Initial Evaluation of Selected Detectors to Replace Inductive
Loops on Freeways. Research Report FHWA/TX-00/0-1439-7, Texas Transportation Institute, Texas A&M University, College Station, TX, April 2000.
7. http://www.dot.state.mn.us/guidestar/nitfinal/execsum.htm, Accessed February 6, 2007.
8. http://www.dot.state.mn.us/guidestar/nitfinal/part4.htm, Accessed February 6, 2007.
9. Utah Department of Transportation spreadsheets for detector cost, draft provided by
UDOT, February 2007.

71
APPENDIX A:
UTAH DEPARTMENT OF TRANSPORTATION ESTIMATED DETECTOR COST AND COMPARISON OF DETECTOR TYPES

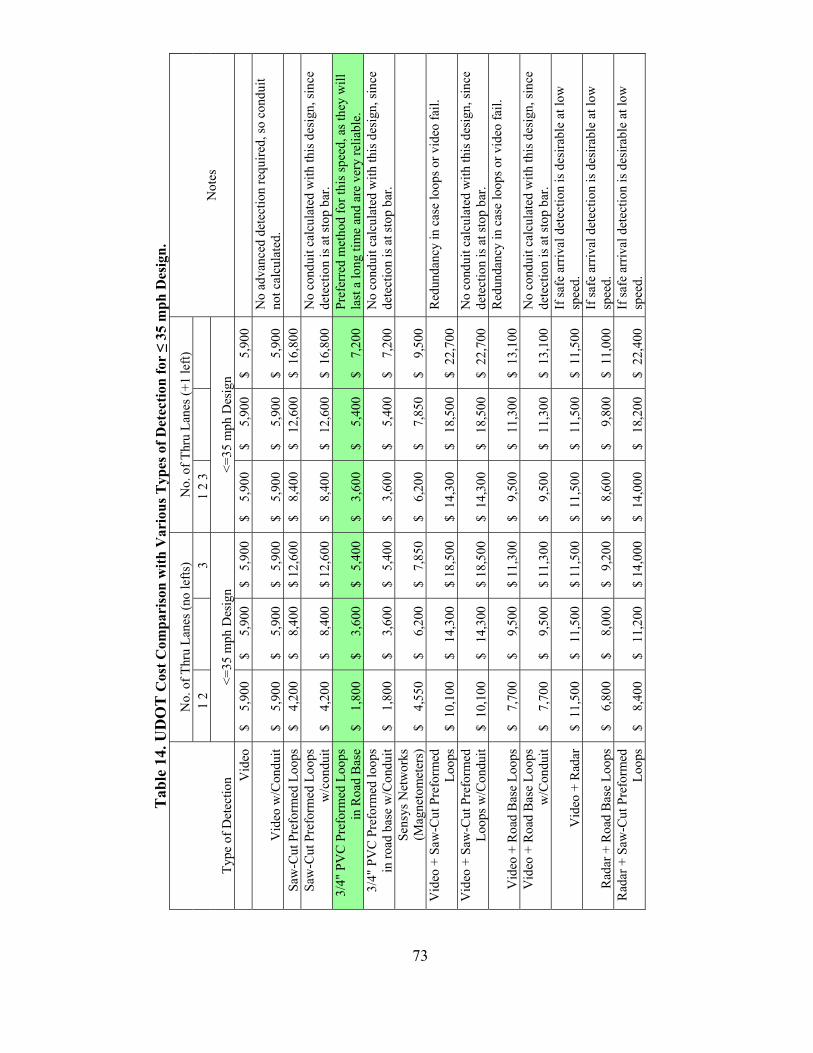
T
able
14.
UD
OT
Cos
t Com
pari
son
with
Var
ious
Typ
es o
f Det
ectio
n fo
r ≤
35 m
ph D
esig
n.
Type
of D
etec
tion
No.
of T
hru
Lane
s (no
lefts
) N
o. o
f Thr
u La
nes (
+1 le
ft)
N
otes
1 2
3 1
2 3
<=35
mph
Des
ign
<=35
mph
Des
ign
Vid
eo
$
5,9
00
$
5,9
00
$
5,90
0 $
5
,900
$
5
,900
$
5
,900
Vid
eo w
/Con
duit
$
5,9
00
$
5,9
00
$
5,90
0 $
5
,900
$
5
,900
$
5
,900
N
o ad
vanc
ed d
etec
tion
requ
ired,
so c
ondu
it no
t cal
cula
ted.
Sa
w-C
ut P
refo
rmed
Loo
ps
$
4,2
00
$
8,4
00
$ 1
2,60
0 $
8
,400
$
12
,600
$
16,
800
Saw
-Cut
Pre
form
ed L
oops
w
/con
duit
$
4,2
00
$
8,4
00
$ 1
2,60
0 $
8
,400
$
12
,600
$
16,
800
N
o co
ndui
t cal
cula
ted
with
this
des
ign,
sinc
e de
tect
ion
is a
t sto
p ba
r.
3/4"
PV
C P
refo
rmed
Loo
ps
in R
oad
Bas
e $
1
,800
$
3
,600
$
5,
400
$
3,6
00
$
5,4
00
$
7,2
00
Pref
erre
d m
etho
d fo
r thi
s spe
ed, a
s the
y w
ill
last
a lo
ng ti
me
and
are
very
relia
ble.
3/
4" P
VC
Pre
form
ed lo
ops
in ro
ad b
ase
w/C
ondu
it $
1
,800
$
3
,600
$
5,
400
$
3,6
00
$
5,4
00
$
7,2
00
No
cond
uit c
alcu
late
d w
ith th
is d
esig
n, si
nce
dete
ctio
n is
at s
top
bar.
Se
nsys
Net
wor
ks
(Mag
neto
met
ers)
$
4
,550
$
6
,200
$
7,
850
$
6,2
00
$
7,8
50
$
9,5
00
V
ideo
+ S
aw-C
ut P
refo
rmed
Lo
ops
$ 1
0,10
0
$
14,3
00
$ 1
8,50
0 $
14,
300
$
18
,500
$
22,
700
R
edun
danc
y in
cas
e lo
ops o
r vid
eo fa
il.
V
ideo
+ S
aw-C
ut P
refo
rmed
Lo
ops w
/Con
duit
$ 1
0,10
0
$
14,3
00
$ 1
8,50
0 $
14,
300
$
18
,500
$
22,
700
N
o co
ndui
t cal
cula
ted
with
this
des
ign,
sinc
e de
tect
ion
is a
t sto
p ba
r.
Vid
eo +
Roa
d B
ase
Loop
s $
7
,700
$
9
,500
$
11,
300
$
9,5
00
$
11,3
00
$ 1
3,10
0
Red
unda
ncy
in c
ase
loop
s or v
ideo
fail.
Vid
eo +
Roa
d B
ase
Loop
s w
/Con
duit
$
7,7
00
$
9,5
00
$ 1
1,30
0 $
9
,500
$
11
,300
$
13,
100
N
o co
ndui
t cal
cula
ted
with
this
des
ign,
sinc
e de
tect
ion
is a
t sto
p ba
r.
Vid
eo +
Rad
ar
$ 1
1,50
0
$
11,5
00
$ 1
1,50
0 $
11,
500
$
11
,500
$
11,
500
If
safe
arr
ival
det
ectio
n is
des
irabl
e at
low
sp
eed.
Rad
ar +
Roa
d B
ase
Loop
s $
6
,800
$
8
,000
$
9,
200
$
8,6
00
$
9,8
00
$ 1
1,00
0
If sa
fe a
rriv
al d
etec
tion
is d
esira
ble
at lo
w
spee
d.
Rad
ar +
Saw
-Cut
Pre
form
ed
Loop
s $
8
,400
$
11
,200
$
14,
000
$ 1
4,00
0
$
18,2
00
$ 2
2,40
0
If sa
fe a
rriv
al d
etec
tion
is d
esira
ble
at lo
w
spee
d.
73
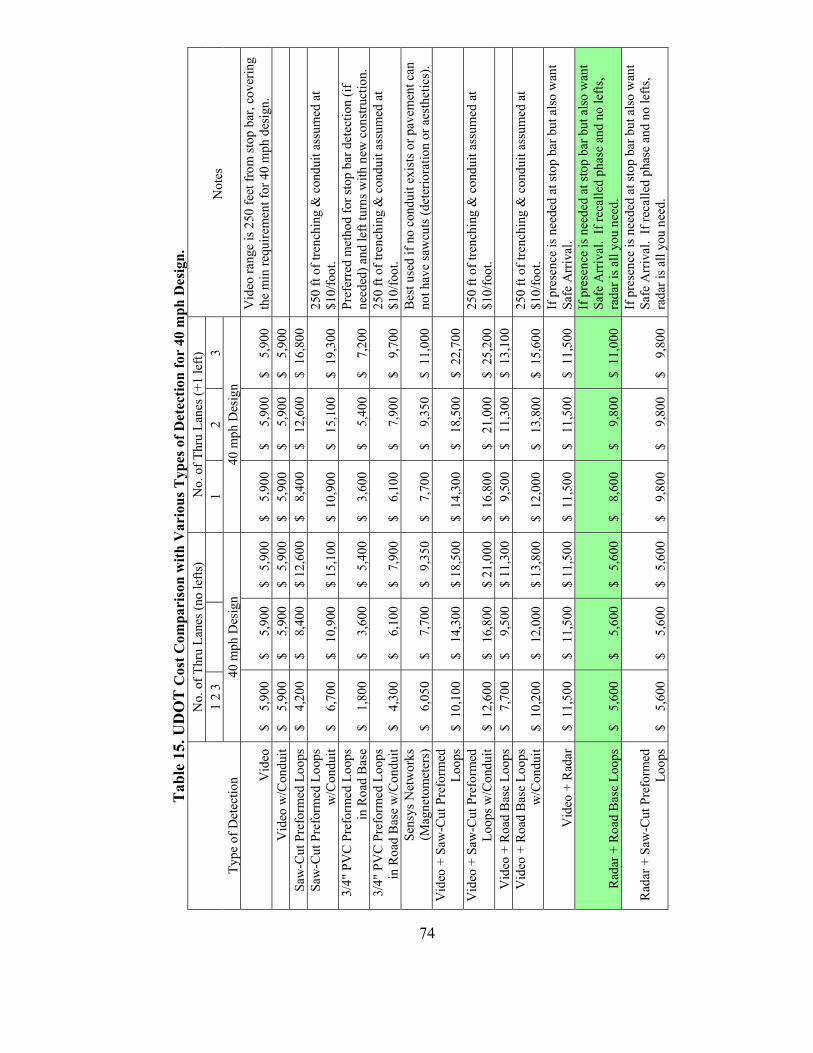
T
able
15.
UD
OT
Cos
t Com
pari
son
with
Var
ious
Typ
es o
f Det
ectio
n fo
r 40
mph
Des
ign.
Type
of D
etec
tion
No.
of T
hru
Lane
s (no
lefts
) N
o. o
f Thr
u La
nes (
+1 le
ft)
Not
es
1
2 3
1 2
3 40
mph
Des
ign
40 m
ph D
esig
n
Vid
eo
$
5,9
00
$
5,9
00
$
5,90
0 $
5
,900
$
5
,900
$
5
,900
V
ideo
rang
e is
250
feet
from
stop
bar
, cov
erin
g th
e m
in re
quire
men
t for
40
mph
des
ign.
V
ideo
w/C
ondu
it $
5
,900
$
5
,900
$
5,
900
$
5,9
00
$
5,9
00
$
5,9
00
Sa
w-C
ut P
refo
rmed
Loo
ps
$
4,2
00
$
8,4
00
$ 1
2,60
0 $
8
,400
$
12
,600
$
16,
800
Saw
-Cut
Pre
form
ed L
oops
w
/Con
duit
$
6,7
00
$
10,9
00
$ 1
5,10
0 $
10,
900
$
15
,100
$
19,
300
25
0 ft
of tr
ench
ing
& c
ondu
it as
sum
ed a
t $1
0/fo
ot.
3/4"
PV
C P
refo
rmed
Loo
ps
in R
oad
Bas
e $
1
,800
$
3
,600
$
5,
400
$
3,6
00
$
5,4
00
$
7,2
00
Pref
erre
d m
etho
d fo
r sto
p ba
r det
ectio
n (if
ne
eded
) and
left
turn
s with
new
con
stru
ctio
n.
3/4"
PV
C P
refo
rmed
Loo
ps
in R
oad
Bas
e w
/Con
duit
$
4,3
00
$
6,1
00
$
7,90
0 $
6
,100
$
7
,900
$
9
,700
25
0 ft
of tr
ench
ing
& c
ondu
it as
sum
ed a
t $1
0/fo
ot.
Sens
ys N
etw
orks
(M
agne
tom
eter
s)
$
6,0
50
$
7,7
00
$
9,35
0 $
7
,700
$
9
,350
$
11,
000
B
est u
sed
if no
con
duit
exis
ts o
r pav
emen
t can
no
t hav
e sa
wcu
ts (d
eter
iora
tion
or a
esth
etic
s).
Vid
eo +
Saw
-Cut
Pre
form
ed
Loop
s $
10,
100
$
14
,300
$
18,
500
$ 1
4,30
0
$
18,5
00
$ 2
2,70
0
V
ideo
+ S
aw-C
ut P
refo
rmed
Lo
ops w
/Con
duit
$ 1
2,60
0
$
16,8
00
$ 2
1,00
0 $
16,
800
$
21
,000
$
25,
200
25
0 ft
of tr
ench
ing
& c
ondu
it as
sum
ed a
t $1
0/fo
ot.
Vid
eo +
Roa
d B
ase
Loop
s $
7
,700
$
9
,500
$
11,
300
$
9,5
00
$
11,3
00
$ 1
3,10
0
V
ideo
+ R
oad
Bas
e Lo
ops
w/C
ondu
it $
10,
200
$
12
,000
$
13,
800
$ 1
2,00
0
$
13,8
00
$ 1
5,60
0
250
ft of
tren
chin
g &
con
duit
assu
med
at
$10/
foot
.
Vid
eo +
Rad
ar
$ 1
1,50
0
$
11,5
00
$ 1
1,50
0 $
11,
500
$
11
,500
$
11,
500
If
pre
senc
e is
nee
ded
at st
op b
ar b
ut a
lso
wan
t Sa
fe A
rriv
al.
Rad
ar +
Roa
d B
ase
Loop
s $
5
,600
$
5
,600
$
5,
600
$
8,6
00
$
9,8
00
$ 1
1,00
0
If p
rese
nce
is n
eede
d at
stop
bar
but
als
o w
ant
Safe
Arr
ival
. If
reca
lled
phas
e an
d no
lefts
, ra
dar i
s all
you
need
.
Rad
ar +
Saw
-Cut
Pre
form
ed
Loop
s $
5
,600
$
5
,600
$
5,
600
$
9,8
00
$
9,8
00
$
9,8
00
If p
rese
nce
is n
eede
d at
stop
bar
but
als
o w
ant
Safe
Arr
ival
. If
reca
lled
phas
e an
d no
lefts
, ra
dar i
s all
you
need
.
74
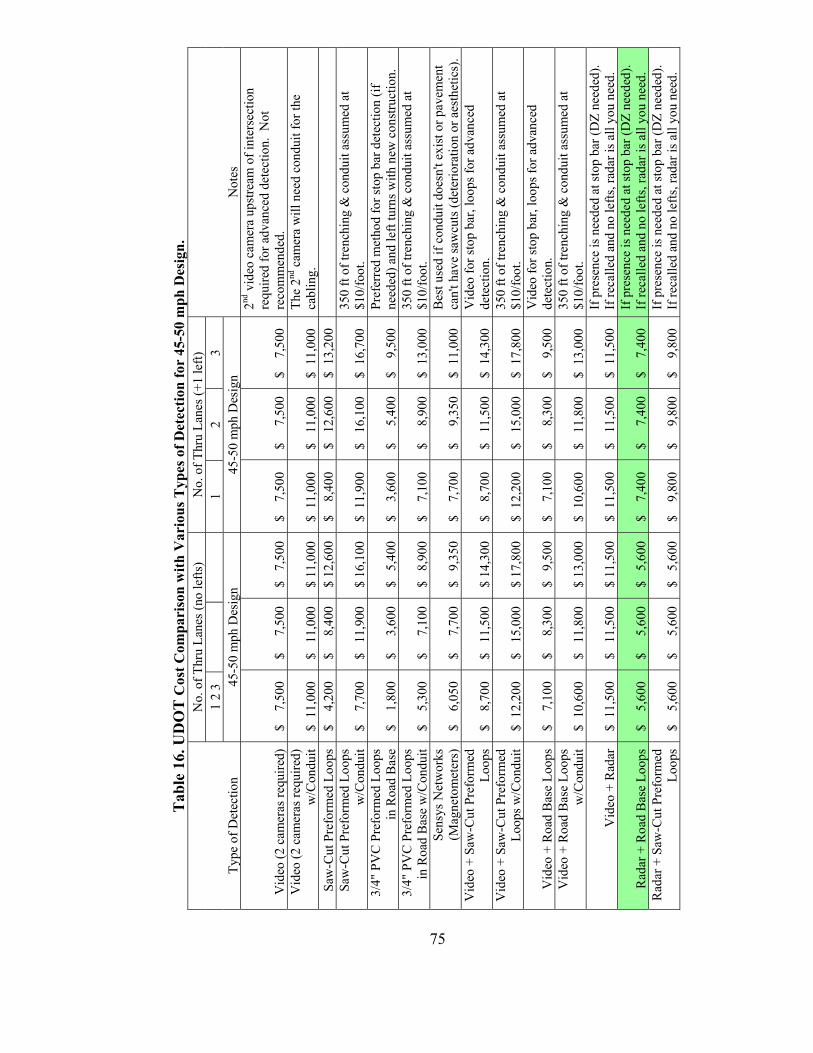
T
able
16.
UD
OT
Cos
t Com
pari
son
with
Var
ious
Typ
es o
f Det
ectio
n fo
r 45
-50
mph
Des
ign.
Type
of D
etec
tion
No.
of T
hru
Lane
s (no
lefts
) N
o. o
f Thr
u La
nes (
+1 le
ft)
N
otes
1
2 3
1 2
3 45
-50
mph
Des
ign
45-5
0 m
ph D
esig
n
Vid
eo (2
cam
eras
requ
ired)
$
7
,500
$
7
,500
$
7,
500
$
7,5
00
$
7,5
00
$
7,5
00
2nd v
ideo
cam
era
upst
ream
of i
nter
sect
ion
requ
ired
for a
dvan
ced
dete
ctio
n. N
ot
reco
mm
ende
d.
Vid
eo (2
cam
eras
requ
ired)
w
/Con
duit
$ 1
1,00
0
$
11,0
00
$ 1
1,00
0 $
11,
000
$
11
,000
$
11,
000
Th
e 2nd
cam
era
will
nee
d co
ndui
t for
the
cabl
ing.
Sa
w-C
ut P
refo
rmed
Loo
ps
$
4,2
00
$
8,4
00
$ 1
2,60
0 $
8
,400
$
12
,600
$
13,
200
Saw
-Cut
Pre
form
ed L
oops
w
/Con
duit
$
7,7
00
$
11,9
00
$ 1
6,10
0 $
11,
900
$
16
,100
$
16,
700
35
0 ft
of tr
ench
ing
& c
ondu
it as
sum
ed a
t $1
0/fo
ot.
3/4"
PV
C P
refo
rmed
Loo
ps
in R
oad
Bas
e $
1
,800
$
3
,600
$
5,
400
$
3,6
00
$
5,4
00
$
9,5
00
Pref
erre
d m
etho
d fo
r sto
p ba
r det
ectio
n (if
ne
eded
) and
left
turn
s with
new
con
stru
ctio
n.
3/4"
PV
C P
refo
rmed
Loo
ps
in R
oad
Bas
e w
/Con
duit
$
5,3
00
$
7,1
00
$
8,90
0 $
7
,100
$
8
,900
$
13,
000
35
0 ft
of tr
ench
ing
& c
ondu
it as
sum
ed a
t $1
0/fo
ot.
Sens
ys N
etw
orks
(M
agne
tom
eter
s)
$
6,0
50
$
7,7
00
$
9,35
0 $
7
,700
$
9
,350
$
11,
000
B
est u
sed
if co
ndui
t doe
sn't
exis
t or p
avem
ent
can'
t hav
e sa
wcu
ts (d
eter
iora
tion
or a
esth
etic
s).
Vid
eo +
Saw
-Cut
Pre
form
ed
Loop
s $
8
,700
$
11
,500
$
14,
300
$
8,7
00
$
11,5
00
$ 1
4,30
0
Vid
eo fo
r sto
p ba
r, lo
ops f
or a
dvan
ced
dete
ctio
n.
Vid
eo +
Saw
-Cut
Pre
form
ed
Loop
s w/C
ondu
it $
12,
200
$
15
,000
$
17,
800
$ 1
2,20
0
$
15,0
00
$ 1
7,80
0
350
ft of
tren
chin
g &
con
duit
assu
med
at
$10/
foot
.
Vid
eo +
Roa
d B
ase
Loop
s $
7
,100
$
8
,300
$
9,
500
$
7,1
00
$
8,3
00
$
9,5
00
Vid
eo fo
r sto
p ba
r, lo
ops f
or a
dvan
ced
dete
ctio
n.
Vid
eo +
Roa
d B
ase
Loop
s w
/Con
duit
$ 1
0,60
0
$
11,8
00
$ 1
3,00
0 $
10,
600
$
11
,800
$
13,
000
35
0 ft
of tr
ench
ing
& c
ondu
it as
sum
ed a
t $1
0/fo
ot.
Vid
eo +
Rad
ar
$ 1
1,50
0
$
11,5
00
$ 1
1,50
0 $
11,
500
$
11
,500
$
11,
500
If
pre
senc
e is
nee
ded
at st
op b
ar (D
Z ne
eded
).
If re
calle
d an
d no
lefts
, rad
ar is
all
you
need
.
Rad
ar +
Roa
d B
ase
Loop
s $
5
,600
$
5
,600
$
5,
600
$
7,4
00
$
7,4
00
$
7,4
00
If p
rese
nce
is n
eede
d at
stop
bar
(DZ
need
ed).
If
reca
lled
and
no le
fts, r
adar
is a
ll yo
u ne
ed.
Rad
ar +
Saw
-Cut
Pre
form
ed
Loop
s $
5
,600
$
5
,600
$
5,
600
$
9,8
00
$
9,8
00
$
9,8
00
If p
rese
nce
is n
eede
d at
stop
bar
(DZ
need
ed).
If
reca
lled
and
no le
fts, r
adar
is a
ll yo
u ne
ed.
75

T
able
17.
UD
OT
Cos
t Com
pari
son
with
Var
ious
Typ
es o
f Det
ectio
n fo
r 55
-70
mph
Des
ign.
Type
of D
etec
tion
No.
of T
hru
Lane
s (no
lefts
) N
o. o
f Thr
u La
nes (
+1 le
ft)
N
otes
1
2 3
1 2
3 55
-70
mph
Des
ign
55-7
0 m
ph D
esig
n
Vid
eo (2
cam
eras
requ
ired)
$
7
,500
$
7
,500
$
7,
500
$
7,5
00
$
7,5
00
$
7,5
00
2nd v
ideo
cam
era
upst
ream
of i
nter
sect
ion
requ
ired
for a
dvan
ced
dete
ctio
n. N
ot
reco
mm
ende
d.
Vid
eo (2
cam
eras
requ
ired)
w
/con
duit
$ 1
2,50
0
$
12,5
00
$ 1
2,50
0 $
12,
500
$
12
,500
$
12,
500
Th
e 2nd
cam
era
will
nee
d co
ndui
t for
the
cabl
ing.
Saw
-Cut
Pre
form
ed L
oops
$
5
,600
$
11
,200
$
16,
800
$
9,8
00
$
15,4
00
$ 1
6,50
0
OK
for s
top
bar d
etec
tion
and
left
turn
s with
ex
istin
g co
nditi
ons.
Use
rada
r for
adv
ance
d de
tect
ion.
Sa
w-C
ut P
refo
rmed
Loo
ps
w/C
ondu
it $
10,
600
$
16
,200
$
21,
800
$ 1
4,80
0
$
20,4
00
$ 2
1,50
0
500
ft of
tren
chin
g &
con
duit
assu
med
at
$10/
foot
.
3/4"
PV
C P
refo
rmed
Loo
ps
in R
oad
Bas
e $
2
,400
$
4
,800
$
7,
200
$
4,2
00
$
6,6
00
$
9,0
00
OK
for s
top
bar d
etec
tion
and
left
turn
s with
ne
w c
onst
ruct
ion.
Use
rada
r for
adv
ance
d de
tect
ion.
3/
4" P
VC
Pre
form
ed L
oops
in
Roa
d B
ase
w/C
ondu
it $
7
,400
$
9
,800
$
12,
200
$
9,2
00
$
11,6
00
$ 1
4,00
0
500
ft of
tren
chin
g &
con
duit
assu
med
at
$10/
foot
. Se
nsys
Net
wor
ks
(Mag
neto
met
ers)
$
6
,600
$
8
,800
$
11,
000
$
8,2
50
$
10,4
50
$ 1
1,55
0
Bes
t use
d if
no c
ondu
it ex
ists
or p
avem
ent c
an
not h
ave
saw
cut
s (de
terio
ratio
n or
aes
thet
ics)
. V
ideo
+ S
aw-C
ut P
refo
rmed
Lo
ops
$ 1
0,10
0
$
14,3
00
$ 1
8,50
0 $
10,
100
$
14
,300
$
18,
500
V
ideo
for s
top
bar,
loop
s for
adv
ance
d de
tect
ion.
V
ideo
+ S
aw-C
ut P
refo
rmed
Lo
ops w
/Con
duit
$ 1
5,10
0
$
19,3
00
$ 2
3,50
0 $
15,
100
$
19
,300
$
23,
500
50
0 ft
of tr
ench
ing
& c
ondu
it as
sum
ed a
t $1
0/fo
ot.
Vid
eo +
Roa
d B
ase
Loop
s $
7
,700
$
9
,500
$
11,
300
$
7,7
00
$
9,5
00
$ 1
1,30
0
Onl
y us
e if
rada
r will
not
wor
k du
e to
site
visi
t, as
rada
r is s
afer
and
mor
e ef
ficie
nt.
Vid
eo +
Roa
d B
ase
Loop
s w
/Con
duit
$ 1
2,70
0
$
14,5
00
$ 1
6,30
0 $
12,
700
$
14
,500
$
16,
300
50
0 ft
of tr
ench
ing
& c
ondu
it as
sum
ed a
t $1
0/fo
ot.
Vid
eo +
Rad
ar
$ 1
1,50
0
$
11,5
00
$ 1
1,50
0 $
11,
500
$
11
,500
$
11,
500
OK
to u
se v
ideo
afte
r site
eva
luat
ion
for s
top
bar d
etec
tion
(if n
eede
d) a
nd le
ft tu
rns w
ith
exis
ting
cons
truct
ion.
Rad
ar +
Roa
d B
ase
Loop
s $
5
,600
$
5
,600
$
5,
600
$
7,4
00
$
7,4
00
$
7,4
00
Pref
erre
d m
etho
d fo
r sto
p ba
r det
ectio
n (if
ne
eded
) and
left
turn
s with
new
con
stru
ctio
n.
76
APPENDIX B:
GTT TECHNICAL BULLETIN: TRAFFIC SENSORS UNDER BRIDGE DECKS
77

79
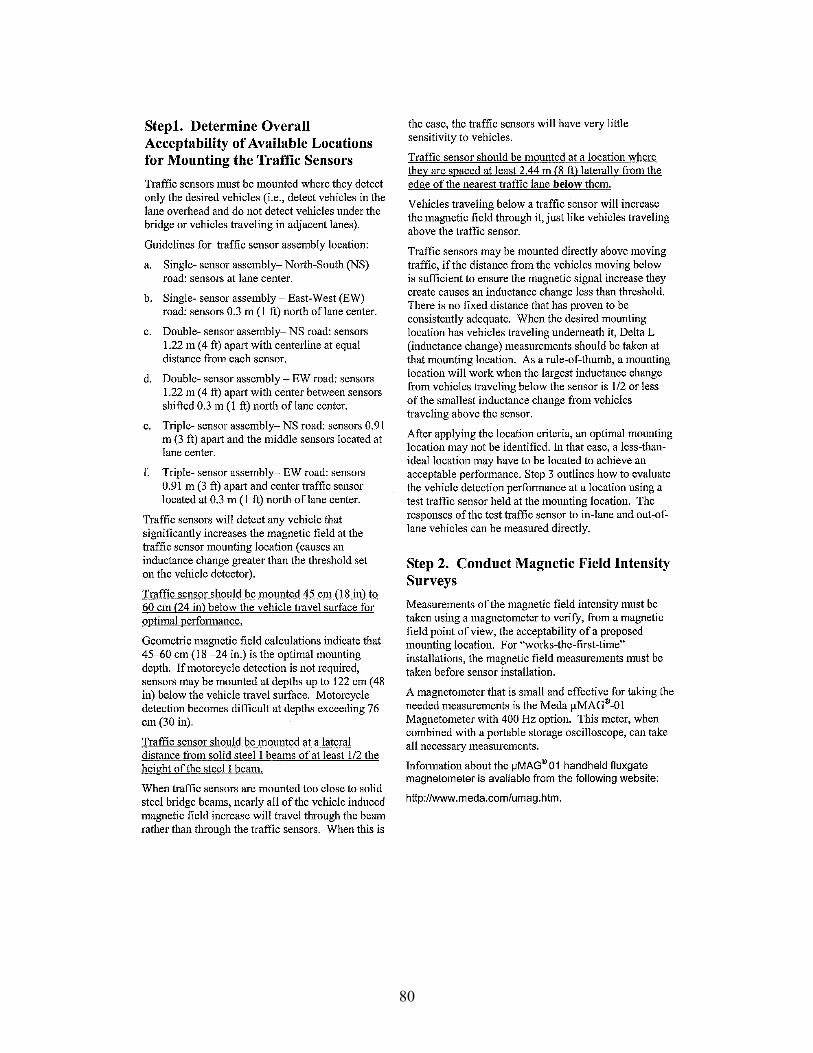
80
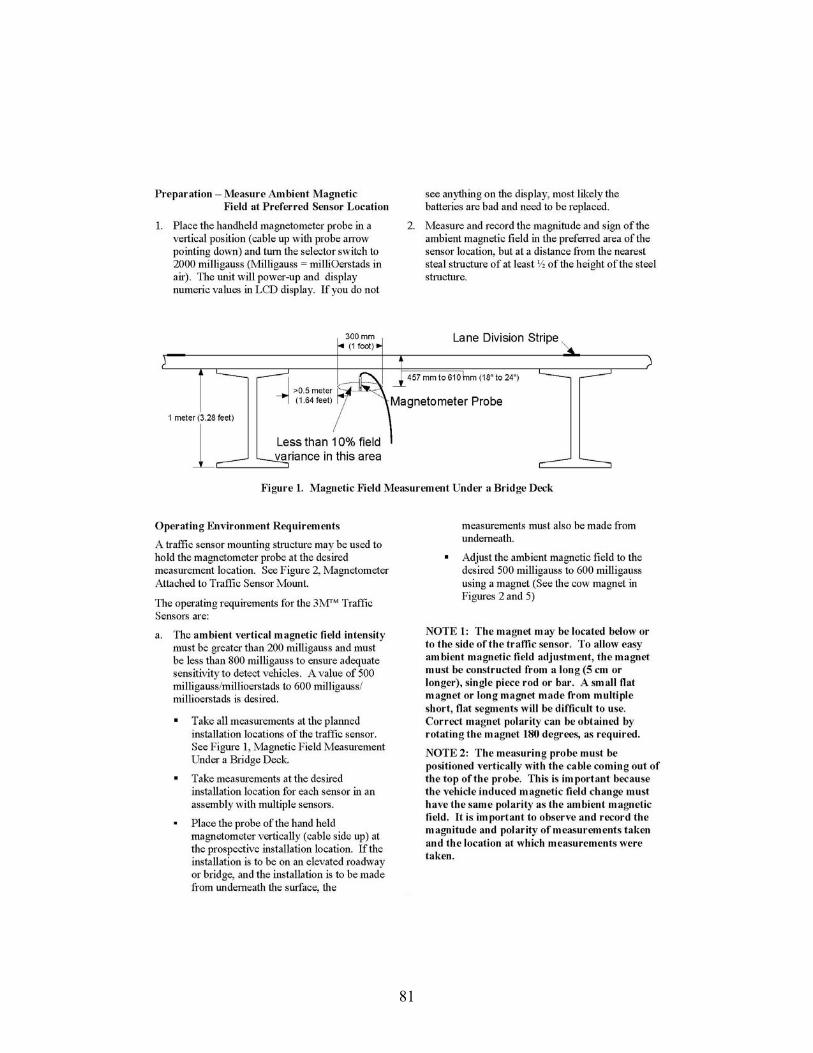
81
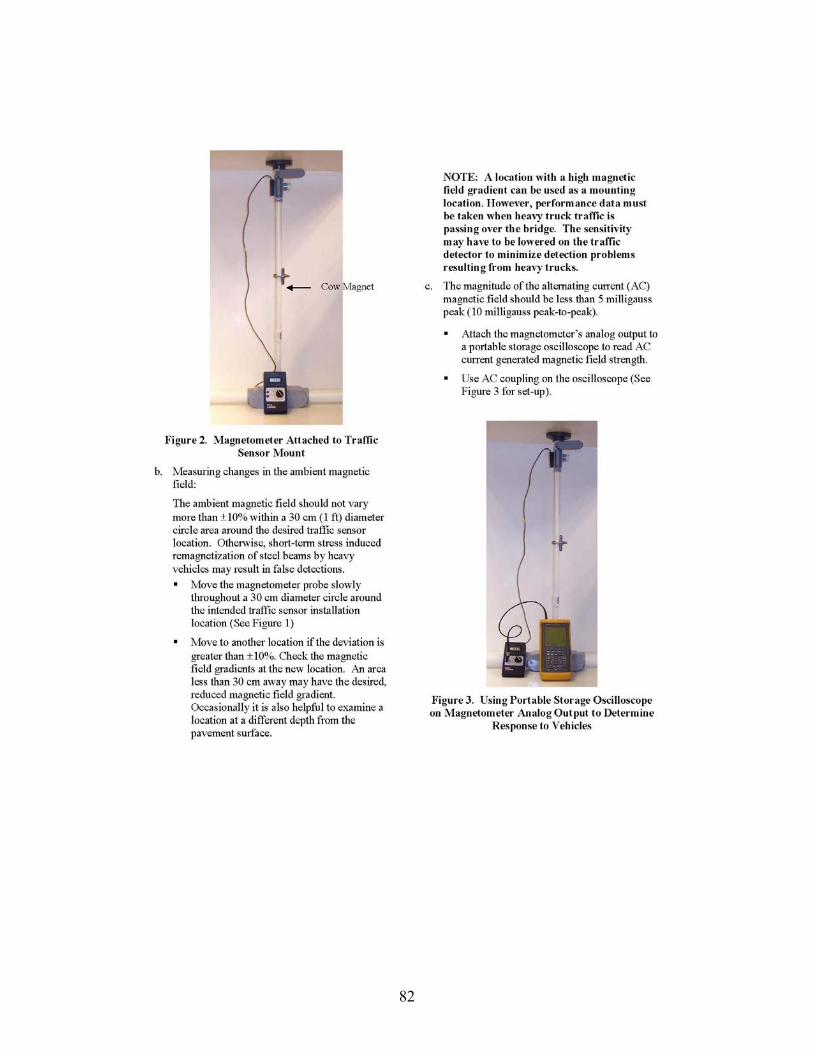
82
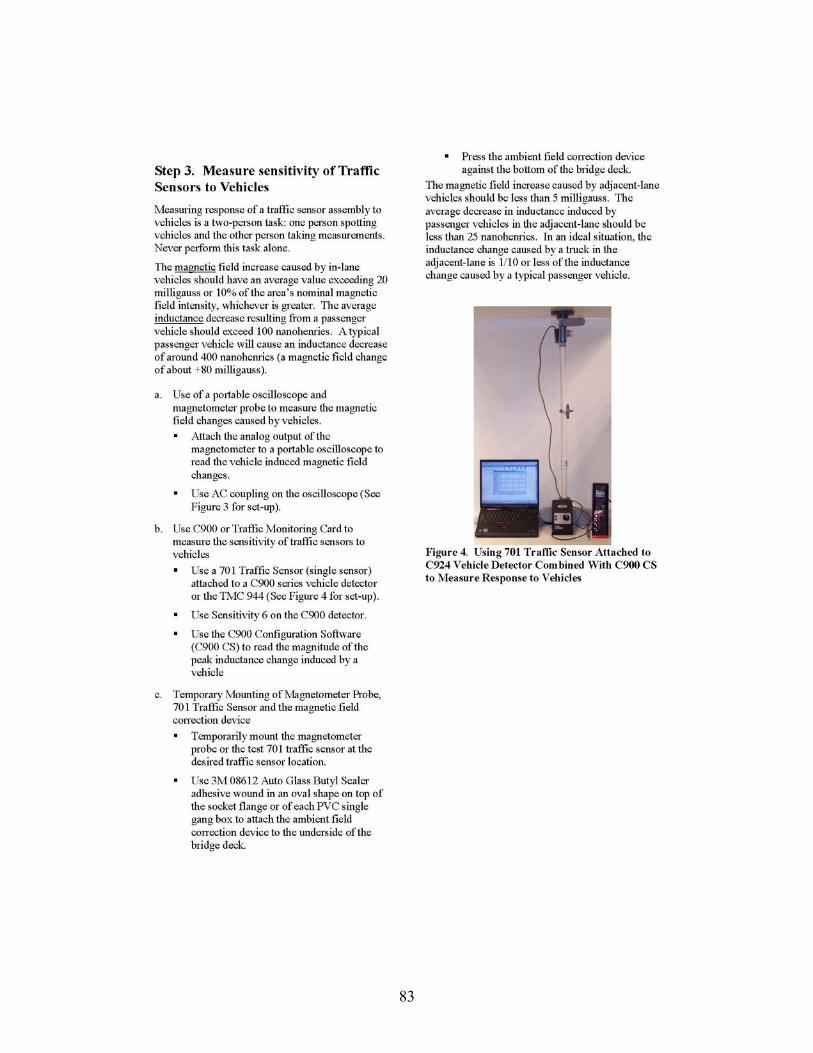
83
84
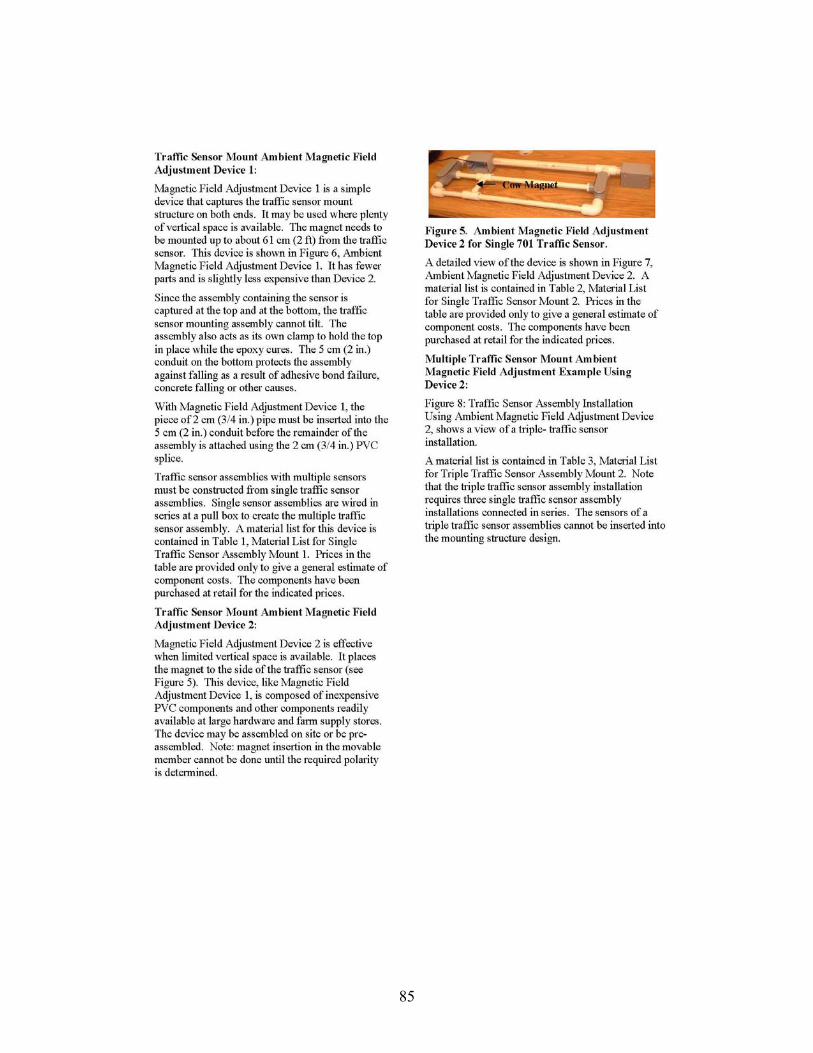
85

86

87

88
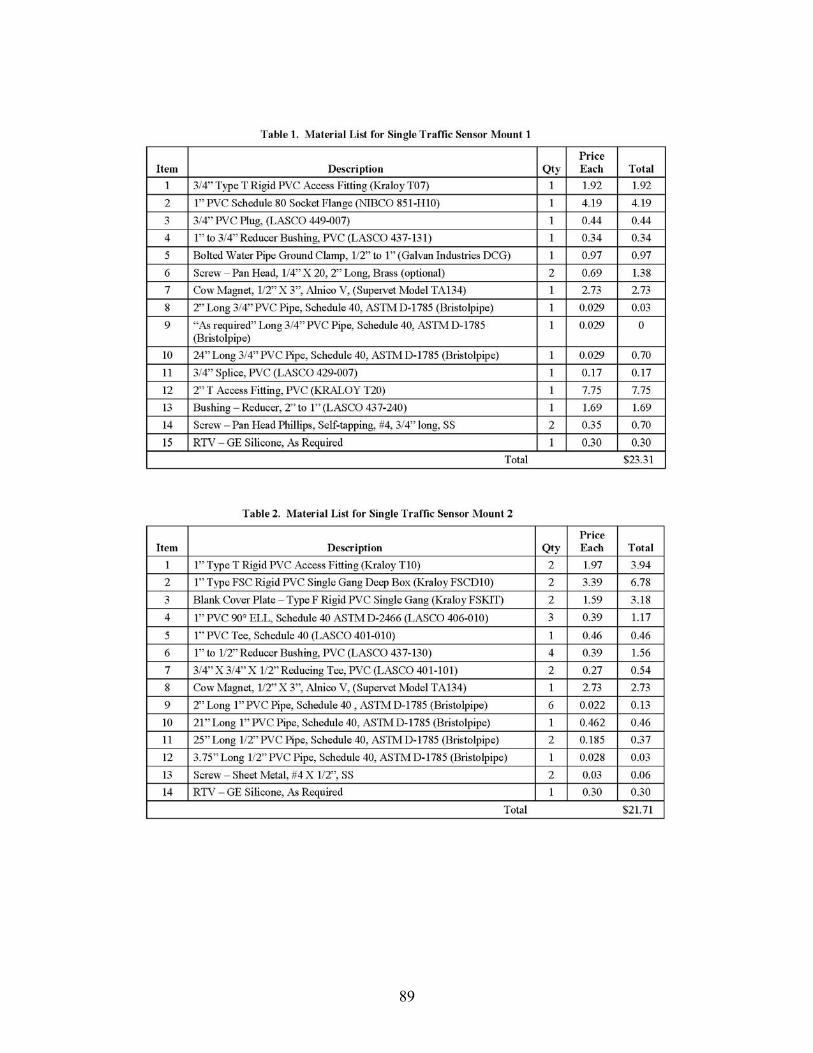
89

90
91

93
APPENDIX C:
RAW DATA PLOTS FROM GTT MAGNETOMETERS

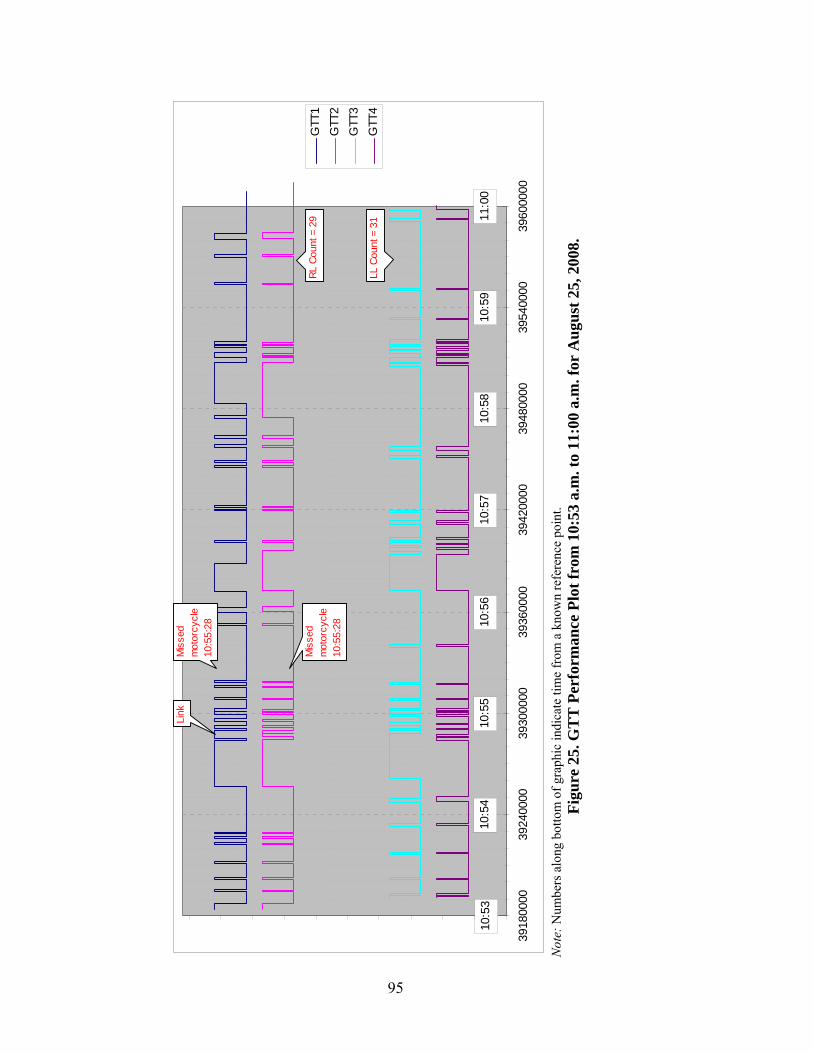
10:5
310
:54
10:5
510
:56
10:5
710
:58
10:5
911
:00
3918
0000
3924
0000
3930
0000
3936
0000
3942
0000
3948
0000
3954
0000
3960
0000
GTT
1G
TT2
GTT
3G
TT4
Mis
sed
mot
orcy
cle
10:5
5:28
Mis
sed
mot
orcy
cle
10:5
5:28
Link
LL C
ount
= 3
1
RL C
ount
= 2
9
N
ote:
Num
bers
alo
ng b
otto
m o
f gra
phic
indi
cate
tim
e fr
om a
kno
wn
refe
renc
e po
int.
Figu
re 2
5. G
TT
Per
form
ance
Plo
t fro
m 1
0:53
a.m
. to
11:0
0 a.
m. f
or A
ugus
t 25,
200
8.
95
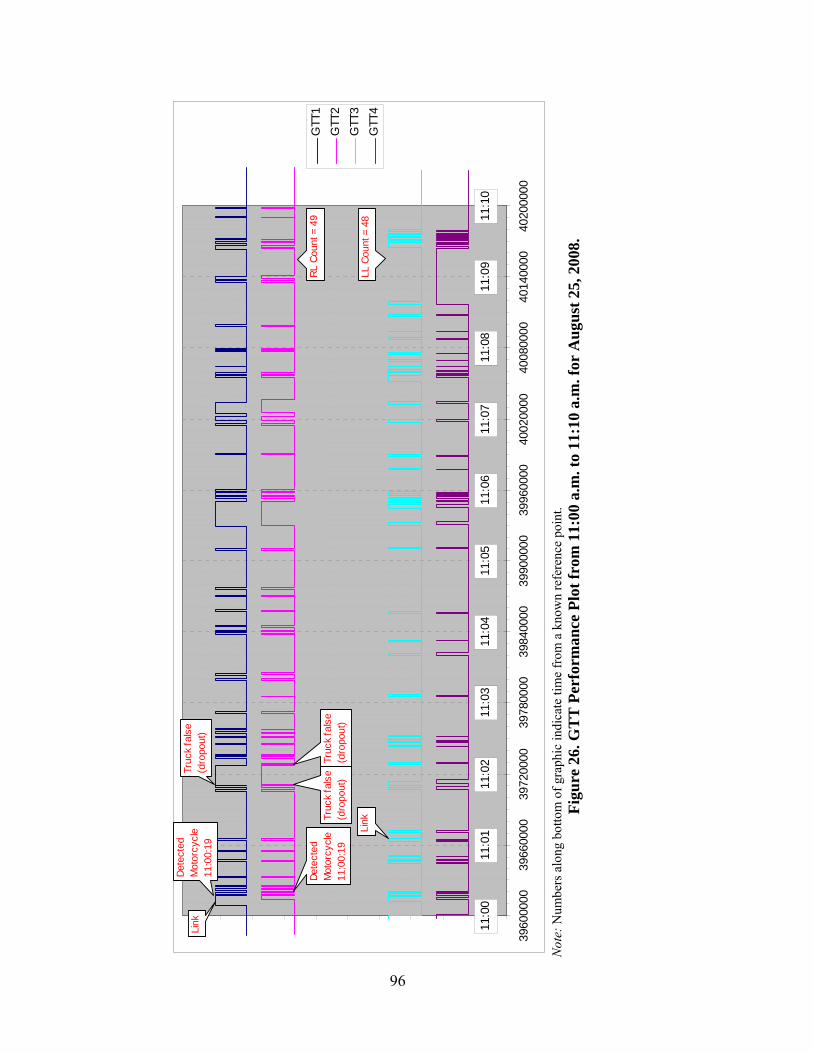
11:0
011
:01
11:0
211
:03
11:0
411
:05
11:0
611
:07
11:0
811
:09
11:1
0
3960
0000
3966
0000
3972
0000
3978
0000
3984
0000
3990
0000
3996
0000
4002
0000
4008
0000
4014
0000
4020
0000
GTT
1G
TT2
GTT
3G
TT4
Dete
cted
M
otor
cycl
e11
:00:
19
Dete
cted
M
otor
cycl
e11
:00:
19Li
nk
Truc
k fa
lse
(dro
pout
)
Truc
k fa
lse
(dro
pout
)
Truc
k fa
lse
(dro
pout
)
Link
LL C
ount
= 4
8
RL C
ount
= 4
9
N
ote:
Num
bers
alo
ng b
otto
m o
f gra
phic
indi
cate
tim
e fr
om a
kno
wn
refe
renc
e po
int.
Figu
re 2
6. G
TT
Per
form
ance
Plo
t fro
m 1
1:00
a.m
. to
11:1
0 a.
m. f
or A
ugus
t 25,
200
8.
96

11:1
011
:11
11:1
211
:13
11:1
411
:15
11:1
611
:17
11:1
811
:19
11:2
0
4020
0000
4026
0000
4032
0000
4038
0000
4044
0000
4050
0000
4056
0000
4062
0000
4068
0000
4074
0000
4080
0000
GTT
1G
TT2
GTT
3G
TT4
Truc
kTr
uck
Truc
kTr
uck
Truc
k
Truc
k fa
lse
RL C
ount
= 4
8
LL C
ount
= 4
4
N
ote:
Num
bers
alo
ng b
otto
m o
f gra
phic
indi
cate
tim
e fr
om a
kno
wn
refe
renc
e po
int.
Figu
re 2
7. G
TT
Per
form
ance
Plo
t fro
m 1
1:10
a.m
. to
11:2
0 a.
m. f
or A
ugus
t 25,
200
8.
97
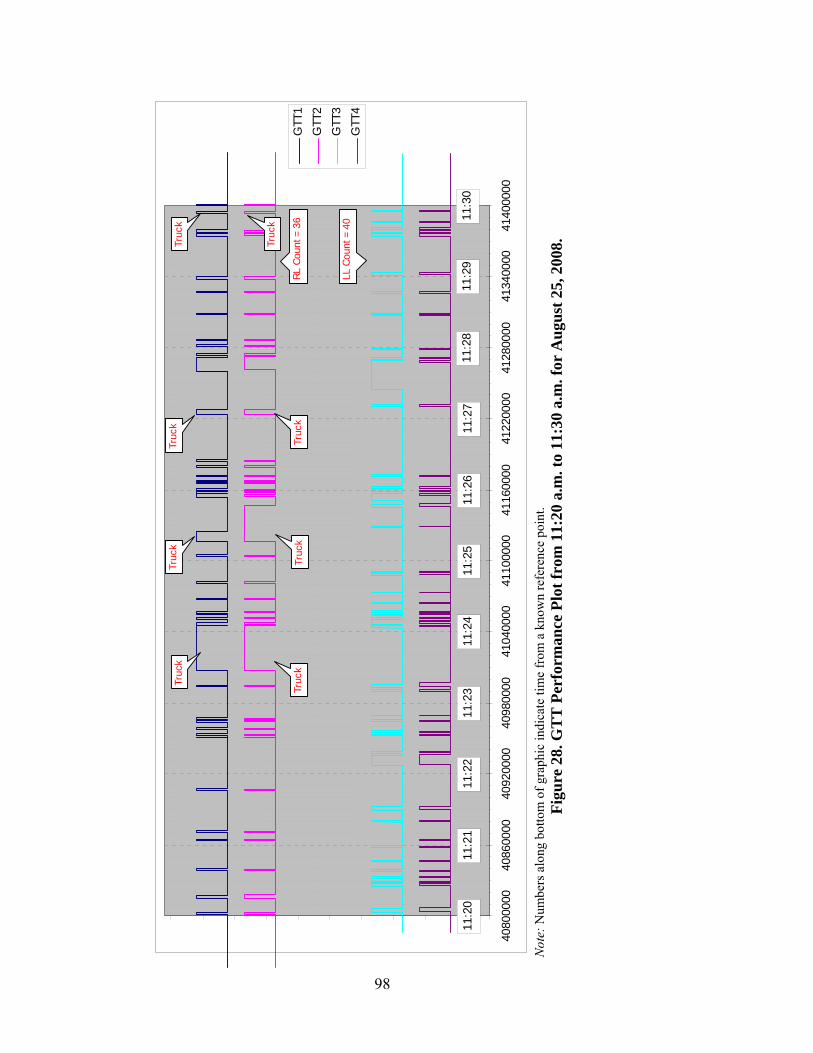
11:2
011
:21
11:2
211
:23
11:2
411
:25
11:2
611
:27
11:2
811
:29
11:3
0
4080
0000
4086
0000
4092
0000
4098
0000
4104
0000
4110
0000
4116
0000
4122
0000
4128
0000
4134
0000
4140
0000
GTT
1G
TT2
GTT
3G
TT4
Truc
k
Truc
k
Truc
k
Truc
k
Truc
k
Truc
k
RL C
ount
= 3
6
LL C
ount
= 4
0
Truc
k
Truc
k
N
ote:
Num
bers
alo
ng b
otto
m o
f gra
phic
indi
cate
tim
e fr
om a
kno
wn
refe
renc
e po
int.
Figu
re 2
8. G
TT
Per
form
ance
Plo
t fro
m 1
1:20
a.m
. to
11:3
0 a.
m. f
or A
ugus
t 25,
200
8.
98