alternative schools - dallas isd · woodcock-muñoz language survey college readiness ... advanced...
TRANSCRIPT

Evaluation & Accountability Data Analysis, Reporting, and Research Services https://mydata.dallasisd.org [email protected] Published July 27, 2011
ALTERNATIVE SCHOOLS

Table of Contents2011-12 Data Packet: Standard Issue
2. Contents .................. Table of Contents 3. Notes ....................... Notes and Data Descriptions
STUDENTS AND STAFF5. Summary ................. Summary of Student and Teacher Statistics 6. Enrollment (1) .......... Enrollment Statistics by Ethnicity
9. Enrollment (2) .......... Enrollment Statistics by Select Student Group 12. Attendance .............. Student Attendance Statistics
15. Teachers ................. Teacher Statistics
TAKS / TAKS (ACCOMMODATED)16. TAKS Read ............. TAKS/TAKS(Acc) Reading/ELA 27. TAKS Math .............. TAKS/TAKS(Acc) Mathematics
38. TAKS SS ................. TAKS/TAKS(Acc) Social Studies 42. TAKS Science ......... TAKS/TAKS(Acc) Science
ITBS / LOGRAMOS48. ITBS Read ............... ITBS/ITED Reading 52. ITBS Math ............... ITBS/ITED Mathematics
ENGLISH PROFICIENCY60. WMLS ...................... Woodcock-Muñoz Language Survey
COLLEGE READINESS61. SAT/ACT ................. SAT/ACT Average Scores for Seniors 62. PSAT ....................... PSAT Average Scores for Juniors
63. AP ............................ Advanced Placement (AP) Exams
LOCAL ASSESSMENT64. ACP ......................... Assessments of Course Performance
July 29, 2011 Dallas ISD Evaluation & Accountability (Data Analysis, Research, and Reporting Services) V:\CILT\1112\CILT_1012.mdb rpt_CONTENTS 2011-12 Campus Data Packet
ALTERNATIVE SCHOOLS 2

Notes, Definitions, and Data DescriptionsNotes
Statistics computed for the Learning Community are based on 2010-11 assignments.•
Student percentages are computed as the percentage of total student enrollment.•
Additional statistics are available in ENROLLMENT and TEACHER reports.•
“Economically disadvantaged” students are those who qualify for free or reduced-price lunch through the federal government's program.•Teacher demographics and assignments are those reported to the TEA in the Public Education Information Management System (PEIMS) submission for the district.•
ALTERNATIVE LEARNING COMMUNITY STATISTICS
2010-11 SCHOOL SUMMARY
Race/ethnic categories are based on the newest federal standards for ethinicity and race reporting, though some categories have been combined because of small group sizes. Students reporting their ethinicity as “Hispanic” are not counted in any race category.
•
Statistics are based on the school's enrollment at the end of the fifth six-weeks grading period.•
“Economically disadvantaged” students are those receiving free or reduced-price lunches.•
The “retention rate” is the percentage of students in the same grade at the end of the fifth six-weeks grading period for both 2009-10 and 2010-11.•“New” students were new to the district in 2010-11. They are counted as new if not enrolled in a district campus before the last day of the 2009-10 school year.•
ENROLLMENT
For 2010-11, race/ethnic categories are based on the newest federal standards for ethinicity and race reporting, though some categories have been combined because of small group sizes; students reporting their ethinicity as “Hispanic” are not counted in any race category. For prior years, race/ethnicity is based on the previous categories.
•
• Statistics are based on student attendance through the end of the sixth six-weeks grading period (the end of the school year).• “Average daily membership” is the total number of school days students were ENROLLED divided by the number of school days in the year.• The “average daily attendance” number (N) is the total number of school days students were IN ATTENDANCE divided by the number of school days in the year. The “average
daily attendance” percentage (%) is the average attendance rate. For each student, the number of days attended is divided by the number of days enrolled. This rate is then averaged across students.
• The number (N) of “yearly transactions” is the total number of transfer and withdrawal transactions in the school year. The percentage (%) is the number of transactions divided by “average daily membership,” which gives (on average) the percentage of the membership associated with a transaction.
• “Continuously enrolled” students are enrolled for a minimum number of instructional days between the beginning of the school year and the first day of the main TAKS testing period. This number varies from 125 to 130 depending on the calendar in a particular school year.
• The “stability rate” is the number of continuously enrolled students divided by “average daily membership.”
ATTENDANCE
• Teacher demographics and assignments are those reported to the TEA in the Public Education Information Management System (PEIMS) submission for the district.
TEACHERS
• Teacher absences counted towards the average DO NOT include vacation days (coded as VAC in personnel database).• Retention rate for a school year is computed with numerator “# teachers assigned to the school both that year and the year prior” and denominator “# of teachers assigned to
the school for the prior year”. That is, the retention rate is the percentage of the prior year's teachers who continued at the school.
July 29, 2011 Dallas ISD Evaluation & Accountability (Data Analysis, Research, and Reporting Services) V:\CILT\1112\CILT_1012.mdb rpt_NOTES 2011-12 Campus Data Packet
ALTERNATIVE SCHOOLS 3
Notes, Definitions, and Data DescriptionsNotes
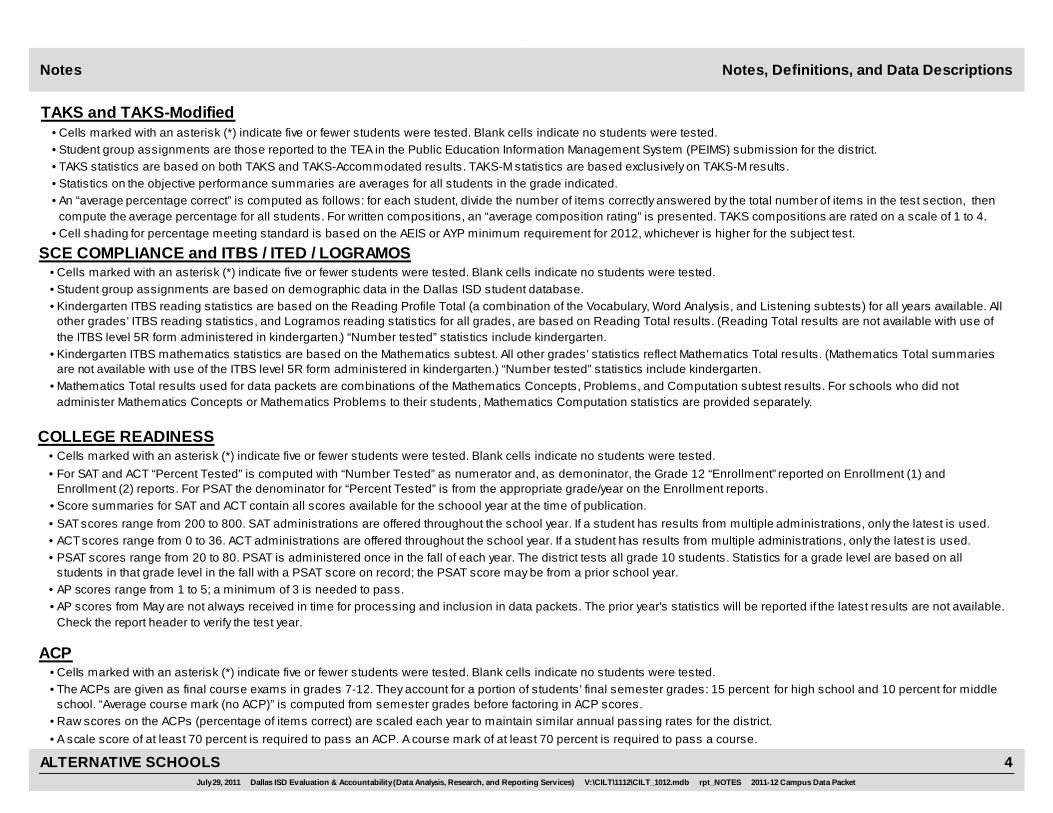
Cells marked with an asterisk (*) indicate five or fewer students were tested. Blank cells indicate no students were tested.••
•
••
Student group assignments are those reported to the TEA in the Public Education Information Management System (PEIMS) submission for the district.
Cell shading for percentage meeting standard is based on the AEIS or AYP minimum requirement for 2012, whichever is higher for the subject test.
Statistics on the objective performance summaries are averages for all students in the grade indicated.An “average percentage correct” is computed as follows: for each student, divide the number of items correctly answered by the total number of items in the test section, then compute the average percentage for all students. For written compositions, an “average composition rating” is presented. TAKS compositions are rated on a scale of 1 to 4.
• TAKS statistics are based on both TAKS and TAKS-Accommodated results. TAKS-M statistics are based exclusively on TAKS-M results.
TAKS and TAKS-Modified
••
Cells marked with an asterisk (*) indicate five or fewer students were tested. Blank cells indicate no students were tested.Student group assignments are based on demographic data in the Dallas ISD student database.
• Kindergarten ITBS reading statistics are based on the Reading Profile Total (a combination of the Vocabulary, Word Analysis, and Listening subtests) for all years available. All other grades' ITBS reading statistics, and Logramos reading statistics for all grades, are based on Reading Total results. (Reading Total results are not available with use of the ITBS level 5R form administered in kindergarten.) “Number tested” statistics include kindergarten.
• Kindergarten ITBS mathematics statistics are based on the Mathematics subtest. All other grades' statistics reflect Mathematics Total results. (Mathematics Total summaries are not available with use of the ITBS level 5R form administered in kindergarten.) “Number tested” statistics include kindergarten.
• Mathematics Total results used for data packets are combinations of the Mathematics Concepts, Problems, and Computation subtest results. For schools who did not administer Mathematics Concepts or Mathematics Problems to their students, Mathematics Computation statistics are provided separately.
SCE COMPLIANCE and ITBS / ITED / LOGRAMOS
• For SAT and ACT “Percent Tested” is computed with “Number Tested” as numerator and, as demoninator, the Grade 12 “Enrollment” reported on Enrollment (1) and Enrollment (2) reports. For PSAT the denominator for “Percent Tested” is from the appropriate grade/year on the Enrollment reports.
• SAT scores range from 200 to 800. SAT administrations are offered throughout the school year. If a student has results from multiple administrations, only the latest is used.• ACT scores range from 0 to 36. ACT administrations are offered throughout the school year. If a student has results from multiple administrations, only the latest is used.• PSAT scores range from 20 to 80. PSAT is administered once in the fall of each year. The district tests all grade 10 students. Statistics for a grade level are based on all
students in that grade level in the fall with a PSAT score on record; the PSAT score may be from a prior school year.• AP scores range from 1 to 5; a minimum of 3 is needed to pass.
Cells marked with an asterisk (*) indicate five or fewer students were tested. Blank cells indicate no students were tested.•
• Score summaries for SAT and ACT contain all scores available for the schoool year at the time of publication.
• AP scores from May are not always received in time for processing and inclusion in data packets. The prior year's statistics will be reported if the latest results are not available. Check the report header to verify the test year.
COLLEGE READINESS
•
• Raw scores on the ACPs (percentage of items correct) are scaled each year to maintain similar annual passing rates for the district.
The ACPs are given as final course exams in grades 7-12. They account for a portion of students' final semester grades: 15 percent for high school and 10 percent for middle school. “Average course mark (no ACP)” is computed from semester grades before factoring in ACP scores.
• A scale score of at least 70 percent is required to pass an ACP. A course mark of at least 70 percent is required to pass a course.
Cells marked with an asterisk (*) indicate five or fewer students were tested. Blank cells indicate no students were tested.•
ACP
July 29, 2011 Dallas ISD Evaluation & Accountability (Data Analysis, Research, and Reporting Services) V:\CILT\1112\CILT_1012.mdb rpt_NOTES 2011-12 Campus Data Packet
ALTERNATIVE SCHOOLS 4

Summary 2010-11 Group Summary Statistics
Grade
STUDENT ENROLLMENT
Enrollment
KN 6
1 10
2 4
3 12
4 6
5 7
6 73
7 119
8 179
9 270
10 216
11 77
12 91
ALL 1,070
STUDENT AND TEACHER RACE/ETHNICITY
Students
Number Percent Number PercentEthnicity/Race
Black/African American
American Indian/Alaska Native
Asian/Hawaiian/Pacific Islander
Hispanic
White
Multiple
500 46.7
13 1.2
4 0.4
524 49.0
20 1.9
71 64.0
4 3.6
30 27.0
2 1.8
* *
* *
7 0.7
SELECT STUDENT GROUP ENROLLMENT
Number PercentGroup
Economically disadvantaged
Limited English proficient (LEP)
Special education
811 75.8
163 15.2
132 12.3
*For teachers, “Other” category includes American Indican/Alaska Native and Asian/Haw aiian/Pacif ic Islander.
Not reported (students only) — —2 0.2
Other* (teachers only) 4 3.6— —
Talented and Gifted (TAG) 0 0.0
At-Risk 804 75.1
Teachers
July 29, 2011 Dallas ISD Evaluation & Accountability (Data Analysis, Research, and Reporting Services) V:\CILT\1112\CILT_1012.mdb rpt_SUMMARY 2011-12 Campus Data Packet
ALTERNATIVE SCHOOLS 5

N %
Asian
%NN %%
Hispanic
N N %Grade Year
African American American Indian
Enrollment
White
Enrolllment Statistics by Race/EthnicityEnrollment (1)
N %
Multiple category
2011
2009
2010
0.0
0.0
0.0
0
0
0
0.0
0.0
0.0
0
0
0
20.0
0.0
16.7
1
0
1
80.0
100.0
83.3
4
1
5
0.0
0.0
0.0
0
0
0
KN
6
1
5 —
—
0.0
—
—
0
2011
2009
2010
0.0
0.0
0.0
0
0
0
0.0
0.0
0.0
0
0
0
44.4
20.0
40.0
8
1
4
50.0
80.0
50.0
9
4
5
5.6
0.0
0.0
1
0
0
1
10
5
18 —
—
10.0
—
—
1
2011
2009
2010
0.0
5.3
0.0
0
1
0
0.0
0.0
0.0
0
0
0
22.2
21.1
50.0
4
4
2
72.2
73.7
50.0
13
14
2
5.6
0.0
0.0
1
0
0
2
4
19
18 —
—
0.0
—
—
0
2011
2009
2010
0.0
0.0
0.0
0
0
0
0.0
0.0
0.0
0
0
0
25.0
0.0
25.0
4
0
3
75.0
91.7
75.0
12
11
9
0.0
8.3
0.0
0
1
0
3
12
12
16 —
—
0.0
—
—
0
2011
2009
2010
0.0
0.0
0.0
0
0
0
0.0
0.0
0.0
0
0
0
14.8
25.0
16.7
4
2
1
77.8
75.0
83.3
21
6
5
7.4
0.0
0.0
2
0
0
4
6
8
27 —
—
0.0
—
—
0
2011
2009
2010
0.0
0.0
0.0
0
0
0
4.0
5.6
0.0
1
1
0
24.0
44.4
71.4
6
8
5
68.0
50.0
28.6
17
9
2
4.0
0.0
0.0
1
0
0
5
7
18
25 —
—
0.0
—
—
0
2011
2009
2010
0.0
1.6
0.0
0
1
0
0.9
1.6
0.0
1
1
0
24.8
23.8
35.6
27
15
16
69.7
71.4
62.2
76
45
28
4.6
1.6
0.0
5
1
0
KN-5
45
63
109 —
—
2.2
—
—
1
July 29, 2011 Dallas ISD Evaluation & Accountability (Data Analysis, Research, and Reporting Services) V:\CILT\1112\CILT_1012.mdb rpt_ENROLL_ETH 2011-12 Campus Data Packet
ALTERNATIVE SCHOOLS 6

N %
Asian
%NN %%
Hispanic
N N %Grade Year
African American American Indian
Enrollment
White
Enrolllment Statistics by Race/EthnicityEnrollment (1)
N %
Multiple category
2011
2009
2010
0.0
0.0
0.0
0
0
0
0.0
0.0
0.0
0
0
0
42.1
48.3
50.7
24
42
37
56.1
50.6
46.6
32
44
34
1.8
1.1
1.4
1
1
1
6
73
87
57 —
—
1.4
—
—
1
2011
2009
2010
0.0
0.0
0.0
0
0
0
0.0
0.0
0.8
0
0
1
43.2
58.5
50.4
64
79
60
53.4
40.7
42.0
79
55
50
3.4
0.7
5.0
5
1
6
7
119
135
148 —
—
1.7
—
—
2
2011
2009
2010
0.5
0.6
0.0
1
1
0
0.0
0.0
0.0
0
0
0
52.7
51.2
59.8
99
83
107
45.2
45.7
39.7
85
74
71
1.6
2.5
0.6
3
4
1
8
179
162
188 —
—
0.0
—
—
0
2011
2009
2010
0.3
0.3
0.0
1
1
0
0.0
0.0
0.3
0
0
1
47.6
53.1
55.0
187
204
204
49.9
45.1
41.8
196
173
155
2.3
1.6
2.2
9
6
8
6-8
371
384
393 —
—
0.8
—
—
3
July 29, 2011 Dallas ISD Evaluation & Accountability (Data Analysis, Research, and Reporting Services) V:\CILT\1112\CILT_1012.mdb rpt_ENROLL_ETH 2011-12 Campus Data Packet
ALTERNATIVE SCHOOLS 7

N %
Asian
%NN %%
Hispanic
N N %Grade Year
African American American Indian
Enrollment
White
Enrolllment Statistics by Race/EthnicityEnrollment (1)
N %
Multiple category
2011
2009
2010
0.7
0.0
0.0
2
0
0
0.0
0.8
1.5
0
2
4
60.6
54.2
48.1
172
137
130
37.3
43.5
48.1
106
110
130
1.4
1.6
2.2
4
4
6
9
270
253
284 —
—
0.0
—
—
0
2011
2009
2010
1.2
0.0
0.9
1
0
2
0.0
0.0
1.9
0
0
4
45.1
48.9
43.5
37
43
94
51.2
50.0
51.9
42
44
112
2.4
1.1
0.5
2
1
1
10
216
88
82 —
—
0.9
—
—
2
2011
2009
2010
0.0
1.7
1.3
0
1
1
0.0
0.0
2.6
0
0
2
42.9
44.8
48.1
24
26
37
57.1
51.7
45.5
32
30
35
0.0
1.7
1.3
0
1
1
11
77
58
56 —
—
0.0
—
—
0
2011
2009
2010
0.0
0.0
1.1
0
0
1
0.0
0.0
2.2
0
0
2
29.4
36.4
47.3
5
4
43
64.7
54.5
44.0
11
6
40
5.9
9.1
4.4
1
1
4
12
91
11
17 —
—
1.1
—
—
1
2011
2009
2010
0.7
0.2
0.6
3
1
4
0.0
0.5
1.8
0
2
12
54.2
51.2
46.5
238
210
304
43.5
46.3
48.5
191
190
317
1.6
1.7
1.8
7
7
12
9-12
654
410
439 —
—
0.5
—
—
3
2011
2009
2010
0.4
0.4
0.4
4
3
4
0.1
0.4
1.2
1
3
13
48.0
50.1
49.0
452
429
524
49.2
47.6
46.7
463
408
500
2.2
1.6
1.9
21
14
20
ALL
1,070
857
941 —
—
0.7
—
—
7
July 29, 2011 Dallas ISD Evaluation & Accountability (Data Analysis, Research, and Reporting Services) V:\CILT\1112\CILT_1012.mdb rpt_ENROLL_ETH 2011-12 Campus Data Packet
ALTERNATIVE SCHOOLS 8
N %
At RIsk New (to District)
N %
TAG
N %
Economically Disadvantaged
Grade Year
LEP Special Education
N % N % N %
Retention Rate (%)
Enrollment
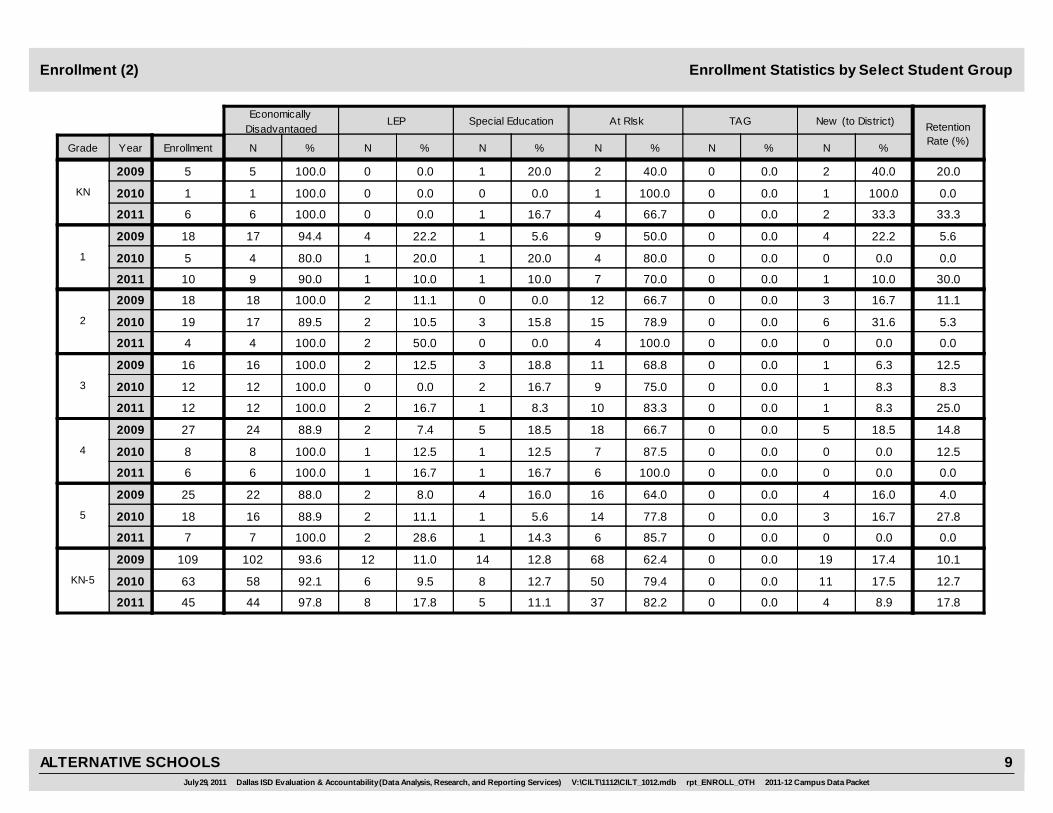
Enrollment Statistics by Select Student GroupEnrollment (2)
40.0
100.0
66.7
2
1
4
40.0
100.0
33.3
KN
2011 6
1
5 100.0
100.0
100.0
5
1
6
0.0
0.0
0.0
0
0
0
20.0
0.0
16.7
1
0
1
0.0
0.0
0.0
0
0
0
20.0
0.0
33.3
2009
2010
2
1
2
50.0
80.0
70.0
9
4
7
22.2
0.0
10.0
1
2011 10
5
18 94.4
80.0
90.0
17
4
9
22.2
20.0
10.0
4
1
1
5.6
20.0
10.0
1
1
1
0.0
0.0
0.0
0
0
0
5.6
0.0
30.0
2009
2010
4
0
1
66.7
78.9
100.0
12
15
4
16.7
31.6
0.0
2
2011 4
19
18 100.0
89.5
100.0
18
17
4
11.1
10.5
50.0
2
2
2
0.0
15.8
0.0
0
3
0
0.0
0.0
0.0
0
0
0
11.1
5.3
0.0
2009
2010
3
6
0
68.8
75.0
83.3
11
9
10
6.3
8.3
8.3
3
2011 12
12
16 100.0
100.0
100.0
16
12
12
12.5
0.0
16.7
2
0
2
18.8
16.7
8.3
3
2
1
0.0
0.0
0.0
0
0
0
12.5
8.3
25.0
2009
2010
1
1
1
66.7
87.5
100.0
18
7
6
18.5
0.0
0.0
4
2011 6
8
27 88.9
100.0
100.0
24
8
6
7.4
12.5
16.7
2
1
1
18.5
12.5
16.7
5
1
1
0.0
0.0
0.0
0
0
0
14.8
12.5
0.0
2009
2010
5
0
0
64.0
77.8
85.7
16
14
6
16.0
16.7
0.0
5
2011 7
18
25 88.0
88.9
100.0
22
16
7
8.0
11.1
28.6
2
2
2
16.0
5.6
14.3
4
1
1
0.0
0.0
0.0
0
0
0
4.0
27.8
0.0
2009
2010
4
3
0
62.4
79.4
82.2
68
50
37
17.4
17.5
8.9
KN-5
2011 45
63
109 93.6
92.1
97.8
102
58
44
11.0
9.5
17.8
12
6
8
12.8
12.7
11.1
14
8
5
0.0
0.0
0.0
0
0
0
10.1
12.7
17.8
2009
2010
19
11
4
July 29, 2011 Dallas ISD Evaluation & Accountability (Data Analysis, Research, and Reporting Services) V:\CILT\1112\CILT_1012.mdb rpt_ENROLL_OTH 2011-12 Campus Data Packet
ALTERNATIVE SCHOOLS 9

N %
At RIsk New (to District)
N %
TAG
N %
Economically Disadvantaged
Grade Year
LEP Special Education
N % N % N %
Retention Rate (%)
Enrollment
Enrollment Statistics by Select Student GroupEnrollment (2)
84.2
63.2
63.0
48
55
46
8.8
10.3
15.1
6
2011 73
87
57 86.0
88.5
87.7
49
77
64
19.3
17.2
16.4
11
15
12
19.3
23.0
15.1
11
20
11
0.0
0.0
0.0
0
0
0
10.5
9.2
12.3
2009
2010
5
9
11
83.1
78.5
82.4
123
106
98
6.8
3.7
3.4
7
2011 119
135
148 76.4
86.7
84.0
113
117
100
18.9
26.7
16.8
28
36
20
20.3
16.3
21.8
30
22
26
0.0
0.0
0.0
0
0
0
12.8
22.2
18.5
2009
2010
10
5
4
82.4
81.5
83.8
155
132
150
7.4
7.4
2.8
8
2011 179
162
188 76.6
87.0
85.5
144
141
153
16.0
20.4
26.8
30
33
48
19.7
19.8
11.2
37
32
20
0.5
0.6
0.0
1
1
0
11.7
8.6
17.9
2009
2010
14
12
5
83.0
76.3
79.2
326
293
294
7.4
6.8
5.4
6-8
2011 371
384
393 77.9
87.2
85.4
306
335
317
17.6
21.9
21.6
69
84
80
19.8
19.3
15.4
78
74
57
0.3
0.3
0.0
1
1
0
12.0
13.5
17.0
2009
2010
29
26
20
July 29, 2011 Dallas ISD Evaluation & Accountability (Data Analysis, Research, and Reporting Services) V:\CILT\1112\CILT_1012.mdb rpt_ENROLL_OTH 2011-12 Campus Data Packet
ALTERNATIVE SCHOOLS 10

N %
At RIsk New (to District)
N %
TAG
N %
Economically Disadvantaged
Grade Year
LEP Special Education
N % N % N %
Retention Rate (%)
Enrollment
Enrollment Statistics by Select Student GroupEnrollment (2)
79.9
79.4
73.3
227
201
198
8.8
9.9
25.6
9
2011 270
253
284 68.0
80.6
67.8
193
204
183
18.7
15.4
11.1
53
39
30
18.3
17.8
12.6
52
45
34
0.0
0.0
0.0
0
0
0
34.5
33.2
30.7
2009
2010
25
25
69
76.8
81.8
71.8
63
72
155
7.3
8.0
21.3
10
2011 216
88
82 74.4
72.7
70.4
61
64
152
13.4
11.4
11.6
11
10
25
18.3
8.0
11.1
15
7
24
0.0
2.3
0.0
0
2
0
23.2
23.9
23.1
2009
2010
6
7
46
75.0
84.5
74.0
42
49
57
12.5
10.3
18.2
11
2011 77
58
56 69.6
75.9
71.4
39
44
55
7.1
12.1
14.3
4
7
11
14.3
19.0
13.0
8
11
10
0.0
1.7
0.0
0
1
0
8.9
13.8
9.1
2009
2010
7
6
14
64.7
27.3
69.2
11
3
63
0.0
0.0
31.9
12
2011 91
11
17 47.1
81.8
65.9
8
9
60
0.0
18.2
9.9
0
2
9
11.8
9.1
2.2
2
1
2
0.0
0.0
0.0
0
0
0
11.8
0.0
7.7
2009
2010
0
0
29
78.1
79.3
72.3
343
325
473
8.7
9.3
24.2
9-12
2011 654
410
439 68.6
78.3
68.8
301
321
450
15.5
14.1
11.5
68
58
75
17.5
15.6
10.7
77
64
70
0.0
0.7
0.0
0
3
0
28.2
27.6
22.5
2009
2010
38
38
158
78.3
77.9
75.1
737
668
804
9.1
8.8
17.0
ALL
2011 1,070
857
941 75.3
83.3
75.8
709
714
811
15.8
17.3
15.2
149
148
163
18.0
17.0
12.3
169
146
132
0.1
0.5
0.0
1
4
0
19.3
20.2
20.4
2009
2010
86
75
182
July 29, 2011 Dallas ISD Evaluation & Accountability (Data Analysis, Research, and Reporting Services) V:\CILT\1112\CILT_1012.mdb rpt_ENROLL_OTH 2011-12 Campus Data Packet
ALTERNATIVE SCHOOLS 11

Stability Rate (%)
Area
ContinuouslyEnrolled (N)
Area DistrictArea (N)Area
Average DailyMembership (N)
Average Daily Attendance Yearly TransactionsGrade Year
Area (N) Area (%)District District (N) District (%) Area (%) District (%) District
Student Attendance StatisticsAttendance
0.0
0.0
0
0
11,501
11,602
11,233
18
20KN
2009 22.3
2010
2011 93.45.4 100.0 21.5
98.61.2 100.0 21.7
13,515.0
13,210.6
13,234.2
95.7
95.7
95.3
12,939.1
12,645.0
12,616.4
85.1
87.8
84.9
5.8
1.3
0.0
0.0
0
0
12,300
12,047
11,978
35
401
2009 20.5
2010
2011 92.810.8 100.0 19.0
93.95.5 100.0 20.3
14,250.8
13,458.2
13,848.4
96.3
96.4
95.9
13,719.9
12,967.0
13,286.3
86.3
89.5
86.5
11.6
5.8
0.0
0.0
0
0
12,231
11,853
11,794
34
592
2009 18.5
2010
2011 97.25.5 100.0 17.1
93.320.1 100.0 19.2
13,950.1
13,012.8
13,440.8
96.8
96.8
96.3
13,499.0
12,592.7
12,947.4
87.7
91.1
87.7
5.7
21.6
0.0
0.0
0
0
11,634
11,604
11,815
48
713
2009 18.2
2010
2011 94.511.8 100.0 16.7
94.013.5 100.0 17.8
13,095.5
12,619.0
13,291.1
97.1
97.1
96.7
12,710.6
12,254.0
12,853.9
88.8
92.0
88.9
12.5
14.4
0.0
0.0
0.0
0
0
0
10,731
11,544
10,987
87
45
664
2009 86.24.0 100.0 17.9
2010
2011 95.44.9 100.0 15.7
93.89.3 100.0 17.3
12,156.4
12,506.4
12,299.7
97.0
97.1
96.8
11,789.9
12,149.9
11,900.0
88.3
92.3
89.3
4.7
5.2
9.9
19.0
0.0
0.0
1
0
0
10,563
10,892
10,453
105
51
955
2009 87.84.6 100.0 17.3
2010
2011 94.57.3 100.0 8.3
95.218.0 100.0 17.1
11,903.5
11,742.5
11,687.8
97.1
97.2
96.8
11,552.9
11,419.3
11,310.1
88.7
92.8
89.4
5.3
7.7
18.9
10.1
0.0
0.0
1
0
0
76,517
69,542
68,260
390
231
351KN-5
2009 87.18.7 100.0 30.6
2010
2011 94.345.8 100.0 16.6
94.267.7 100.0 18.9
83,476.5
76,549.5
77,802.0
96.5
96.7
96.3
80,586.5
74,027.9
74,914.0
91.7
90.8
87.7
9.9
48.5
71.9
July 29, 2011 Dallas ISD Evaluation & Accountability (Data Analysis, Research, and Reporting Services) V:\CILT\1112\CILT_1012.mdb rpt_ATTENDANCE 2011-12 Campus Data Packet
ALTERNATIVE SCHOOLS 12

Stability Rate (%)
Area
ContinuouslyEnrolled (N)
Area DistrictArea (N)Area
Average DailyMembership (N)
Average Daily Attendance Yearly TransactionsGrade Year
Area (N) Area (%)District District (N) District (%) Area (%) District (%) District
Student Attendance StatisticsAttendance
0.0
0.0
0.0
0
0
0
9,131
9,074
9,083
189
193
2026
2009 90.98.4 100.0 19.9
2010
2011 84.957.1 100.0 17.3
86.181.0 100.0 18.6
10,588.3
10,126.2
10,602.4
96.0
96.2
95.4
10,165.3
9,742.1
10,110.8
86.2
89.6
85.7
9.2
67.2
94.1
0.0
0.0
0.0
0
0
0
8,389
8,791
8,310
412
318
3077
2009 81.915.8 100.0 26.0
2010
2011 76.286.7 100.0 22.8
76.0108.2 100.0 22.4
10,135.8
10,058.0
10,258.0
94.7
95.3
93.9
9,601.8
9,588.9
9,636.4
82.8
87.4
81.0
19.2
113.7
142.3
0.0
1.1
0.6
0
2
1
8,477
8,465
7,894
571
459
4108
2009 78.517.9 100.0 28.2
2010
2011 79.5140.3 100.0 17.7
76.3134.9 100.0 15.6
10,551.1
9,906.7
9,995.5
94.3
94.8
93.3
9,945.8
9,388.4
9,325.9
80.3
85.4
79.0
22.8
176.4
176.7
0.0
0.6
0.2
0
2
1
25,997
26,330
25,287
1,172
970
9196-8
2009 82.042.0 100.0 24.7
2010
2011 79.5284.0 100.0 19.3
78.5324.1 100.0 18.9
31,275.2
30,090.9
30,855.9
95.0
95.4
94.2
29,712.9
28,719.4
29,073.2
83.1
87.5
82.0
51.2
357.3
413.1
July 29, 2011 Dallas ISD Evaluation & Accountability (Data Analysis, Research, and Reporting Services) V:\CILT\1112\CILT_1012.mdb rpt_ATTENDANCE 2011-12 Campus Data Packet
ALTERNATIVE SCHOOLS 13

Stability Rate (%)
Area
ContinuouslyEnrolled (N)
Area DistrictArea (N)Area
Average DailyMembership (N)
Average Daily Attendance Yearly TransactionsGrade Year
Area (N) Area (%)District District (N) District (%) Area (%) District (%) District
Student Attendance StatisticsAttendance
5.3
12.6
1.1
2
34
3
8,973
8,460
8,320
757
567
5329
2009 76.629.1 100.0 39.0
2010
2011 76.3205.9 100.0 30.2
69.5182.3 100.0 32.9
12,462.6
10,654.7
11,951.9
91.5
92.7
90.1
11,404.9
9,881.3
10,769.5
72.0
79.4
69.6
38.0
269.6
262.2
15.4
26.3
4.0
2
53
4
7,250
8,048
6,991
260
574
47610
2009 87.011.3 100.0 22.4
2010
2011 80.4162.1 100.0 21.9
75.474.8 100.0 23.8
9,294.3
9,678.7
9,504.1
92.7
93.3
91.0
8,619.9
9,027.4
8,652.0
78.0
83.2
73.6
13.0
201.7
99.2
0.0
17.5
3.4
0
13
2
6,194
6,764
6,143
149
499
44411
2009 79.05.6 100.0 17.0
2010
2011 83.862.1 100.0 18.7
72.542.3 100.0 19.1
7,512.5
8,013.0
8,136.9
93.0
93.3
91.1
6,985.9
7,476.3
7,411.5
82.4
84.4
75.5
7.1
74.1
58.4
20.6
39.3
6.9
1
33
1
6,098
6,655
6,040
69
638
44712
2009 79.93.9 100.0 14.8
2010
2011 87.473.3 100.0 17.6
86.712.5 100.0 17.6
7,701.9
7,835.5
7,621.1
92.8
93.2
92.2
7,148.0
7,299.5
7,023.7
79.2
84.9
79.3
4.9
83.9
14.4
7.9
21.1
2.3
5
133
10
28,515
29,927
27,494
1,235
2,278
1,8999-12
2009 79.350.0 100.0 25.3
2010
2011 80.0503.4 100.0 22.7
71.8311.9 100.0 24.4
36,971.3
36,181.9
37,214.0
92.4
93.1
91.0
34,158.7
33,684.5
33,856.7
77.1
82.7
73.9
63.0
629.3
434.2
4.8
13.0
1.2
6
135
11
131,029
125,799
121,041
2,797
3,479
3,169ALL
2009 81.0100.6 100.0 28.1
2010
2011 80.5833.2 100.0 18.7
76.6703.7 100.0 20.3
151,723.0
142,822.2
145,872.0
95.2
95.5
94.5
144,458.0
136,431.8
137,843.9
86.4
88.1
83.0
124.2
1,035.2
919.2
July 29, 2011 Dallas ISD Evaluation & Accountability (Data Analysis, Research, and Reporting Services) V:\CILT\1112\CILT_1012.mdb rpt_ATTENDANCE 2011-12 Campus Data Packet
ALTERNATIVE SCHOOLS 14

Teacher StatisticsTeachers
6.3
Percentage
7Beginning (0)
401 - 5
246 - 10
2411 - 20
16More than 20
Years Number
92.6
NA
NA
2
53.259
46.852
1.8
3.64
64.071
27.030White
African American
Hispanic
Multiple categories
Male
Female
8.8
Number PercentageEthnicity/Race
DISTRIBUTIONS YEARS EXPERIENCE
Teachers: 111
7.9
Average Absences
RetentionRate
36.0
21.6
21.6
14.4
2008-09
2009-10
2010-11
Number PercentageGender
9.0101
9.9112
3.643
22.5251-3
8.194
5.465
79More than 3 71.2
4 3.6Other
ATTENDANCE / RETENTION
July 29, 2011 Dallas ISD Evaluation & Accountability (Data Analysis, Research, and Reporting Services) V:\CILT\1112\CILT_1012.mdb rpt_TEACHER 2011-12 Campus Data Packet
ALTERNATIVE SCHOOLS 15

FemaleMigrant MaleAt RiskWhite AfricanAmer
Hispanic EconDisadv
SpecialEduc
LEP All DistrictYearGrade Number Tested(All Students)
Texas Assessment of Knowledge and Skills: READING / ENGLISH LANGUAGE ARTS
PERCENTAGE MEETING STANDARD
TAKS Read (1)
*
76.42011 0
6
86.42009 * * * 1
78.32010 0
*
80.62011 0
6-8
85.02009 * * * 1
81.32010 0
0 0 0
0 1 0
0 0 0
28,5842011 0 00 0 0 0 00
28,0102009 0 10 1 0 0 10
NUMBER TESTED IN GRADES 6-8
28,4352010 0 00 0 0 0 00
Shaded cells indicate percentages below 70 percent, the 2010-11 AEIS minimum for an Academically Acceptable rating.
July 29, 2011 Dallas ISD Evaluation & Accountability (Data Analysis, Research, and Reporting Services) V:\CILT\1112\CILT_1012.mdb rpt_TAKS_E_read_1_per_meet 2011-12 Campus Data Packet
ALTERNATIVE SCHOOLS 16

FemaleMigrant MaleAt RiskWhite AfricanAmer
Hispanic EconDisadv
SpecialEduc
LEP All DistrictYearGrade Number Tested(All Students)
Texas Assessment of Knowledge and Skills: READING / ENGLISH LANGUAGE ARTS
PERCENTAGE MEETING STANDARD
TAKS Read (1)
* 51.4 55.2 82.82011 45.5 58.6 60.6 42.9 53.7 6751.1
9
83.02009 0
87.32010 0
58.3 61.5 87.22011 54.5 68.4 69.2 * 50.0 60.0 7561.0
10
83.32009 0
87.22010 0
63.6 * 92.32011 66.7 * 77.8 * 66.7 1272.7
11
89.82009 0
91.02010 0
* 56.0 59.4 87.02011 51.4 63.9 66.7 * 45.0 57.8 15458.3
9-11
84.92009 0
88.32010 0
1 84 69
0 0 0
0 0 0
25,8922011 0 7272 81 4 20 154115
25,2842009 0 00 0 0 0 00
NUMBER TESTED IN GRADES 9-11
25,7122010 0 00 0 0 0 00
Shaded cells indicate percentages below 70 percent, the 2010-11 AEIS minimum for an Academically Acceptable rating.
July 29, 2011 Dallas ISD Evaluation & Accountability (Data Analysis, Research, and Reporting Services) V:\CILT\1112\CILT_1012.mdb rpt_TAKS_E_read_1_per_meet 2011-12 Campus Data Packet
ALTERNATIVE SCHOOLS 17

FemaleMigrant MaleAt RiskWhite AfricanAmer
Hispanic EconDisadv
SpecialEduc
LEP All DistrictYearGrade Number Tested(All Students)
Texas Assessment of Knowledge and Skills: READING / ENGLISH LANGUAGE ARTS
PERCENTAGE MEETING STANDARD
TAKS Read (1)
* 56.0 59.4
*
83.62011 51.4 63.9 66.7 * 45.0 57.8 15458.3
3-11
83.82009 * * * 1
84.22010 0
1 84 69
0 1 0
0 0 0
76,6572011 0 7272 81 4 20 154115
81,4202009 0 10 1 0 0 10
NUMBER TESTED IN GRADES 3-11
78,8982010 0 00 0 0 0 00
Shaded cells indicate percentages below 70 percent, the 2010-11 AEIS minimum for an Academically Acceptable rating.
July 29, 2011 Dallas ISD Evaluation & Accountability (Data Analysis, Research, and Reporting Services) V:\CILT\1112\CILT_1012.mdb rpt_TAKS_E_read_1_per_meet 2011-12 Campus Data Packet
ALTERNATIVE SCHOOLS 18

FemaleMigrant MaleAt RiskWhite AfricanAmer
Hispanic EconDisadv
SpecialEduc
LEP All DistrictYearGrade
NUMBER NOT MEETING STANDARD
Number Tested(All Students)
Texas Assessment of Knowledge and Skills: READING / ENGLISH LANGUAGE ARTSTAKS Read (2)
*
2,2582011 0
6
1,2952009 * * * 1
2,1232010 0
*
5,5472011 0
6-8
4,1942009 * * * 1
5,3152010 0
0 0 0
0 1 0
0 0 0
28,5842011 0 00 0 0 0 00
28,0102009 0 10 1 0 0 10
NUMBER TESTED IN GRADES 6-8
28,4352010 0 00 0 0 0 00
July 29, 2011 Dallas ISD Evaluation & Accountability (Data Analysis, Research, and Reporting Services) V:\CILT\1112\CILT_1012.mdb rpt_TAKS_E_read_2_num_not_meet 2011-12 Campus Data Packet
ALTERNATIVE SCHOOLS 19

FemaleMigrant MaleAt RiskWhite AfricanAmer
Hispanic EconDisadv
SpecialEduc
LEP All DistrictYearGrade
NUMBER NOT MEETING STANDARD
Number Tested(All Students)
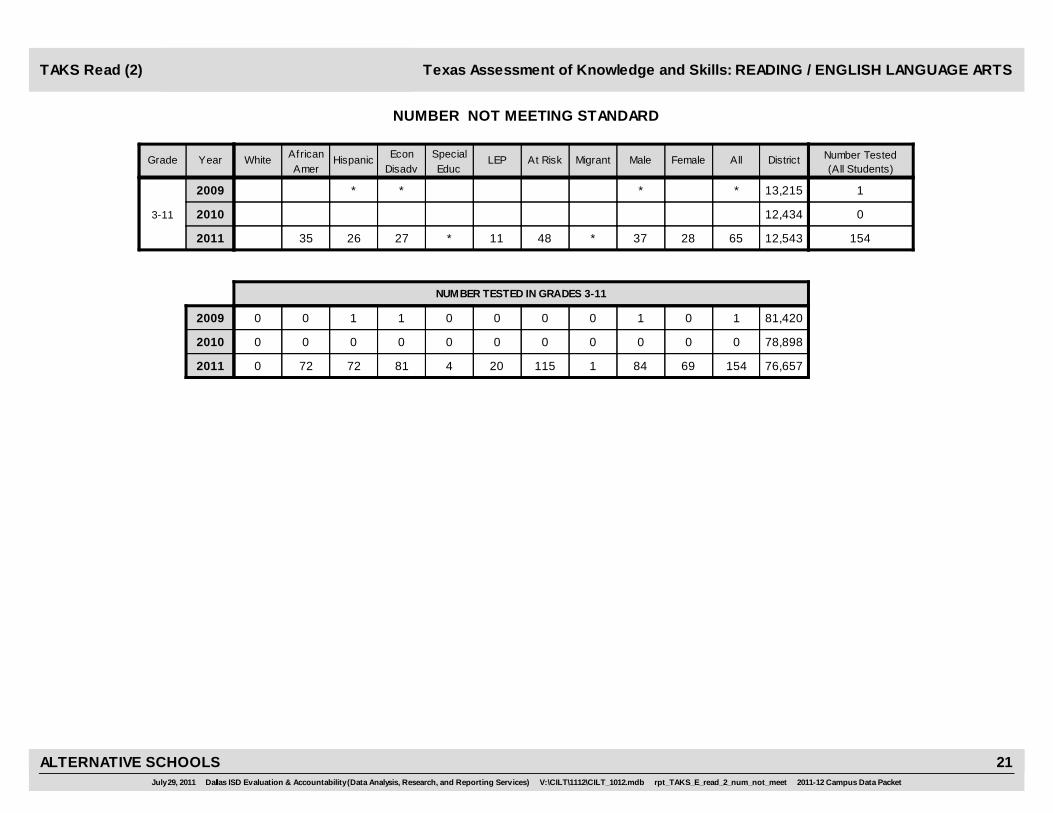
Texas Assessment of Knowledge and Skills: READING / ENGLISH LANGUAGE ARTSTAKS Read (2)
* 18 13 1,6332011 18 12 13 4 31 6722
9
1,7572009 0
1,2952010 0
15 15 1,1602011 15 12 12 * 5 30 7523
10
1,3832009 0
1,0862010 0
4 * 5642011 2 * 2 * 4 123
11
6792009 0
6322010 0
* 37 28 3,3572011 35 26 27 * 11 65 15448
9-11
3,8192009 0
3,0132010 0
1 84 69
0 0 0
0 0 0
25,8922011 0 7272 81 4 20 154115
25,2842009 0 00 0 0 0 00
NUMBER TESTED IN GRADES 9-11
25,7122010 0 00 0 0 0 00
July 29, 2011 Dallas ISD Evaluation & Accountability (Data Analysis, Research, and Reporting Services) V:\CILT\1112\CILT_1012.mdb rpt_TAKS_E_read_2_num_not_meet 2011-12 Campus Data Packet
ALTERNATIVE SCHOOLS 20
FemaleMigrant MaleAt RiskWhite AfricanAmer
Hispanic EconDisadv
SpecialEduc
LEP All DistrictYearGrade
NUMBER NOT MEETING STANDARD
Number Tested(All Students)
Texas Assessment of Knowledge and Skills: READING / ENGLISH LANGUAGE ARTSTAKS Read (2)
* 37 28
*
12,5432011 35 26 27 * 11 65 15448
3-11
13,2152009 * * * 1
12,4342010 0
1 84 69
0 1 0
0 0 0
76,6572011 0 7272 81 4 20 154115
81,4202009 0 10 1 0 0 10
NUMBER TESTED IN GRADES 3-11
78,8982010 0 00 0 0 0 00
July 29, 2011 Dallas ISD Evaluation & Accountability (Data Analysis, Research, and Reporting Services) V:\CILT\1112\CILT_1012.mdb rpt_TAKS_E_read_2_num_not_meet 2011-12 Campus Data Packet
ALTERNATIVE SCHOOLS 21

Written Composition:Effectiveness / Command
of Conventions¹Basic Understanding
Literary Elementsand Techniques Analysis and Evaluation Revising and EditingYearGrade
OBJECTIVE
AVERAGE PERCENTAGE OF ITEMS CORRECT BY OBJECTIVE
Texas Assessment of Knowledge and Skills: READING / ENGLISH LANGUAGE ARTSTAKS Read (3)
2009
2010
2011 58.679.1 63.4
9
2009
2010
2011 54.7 1.8 70.174.3 62.1
10
2009
2010
2011 61.6 2.3 68.886.5 70.5
11
2009
2010
2011 57.0 1.9 69.977.4 63.3
9-11
¹Average rating on w ritten composition. TAKS compositions are rated on a scale of 1 to 4.
July 29, 2011 Dallas ISD Evaluation & Accountability (Data Analysis, Research, and Reporting Services) V:\CILT\1112\CILT_1012.mdb rpt_TAKS_E_read_3_obj_high 2011-12 Campus Data Packet
ALTERNATIVE SCHOOLS 22

FemaleMigrant MaleAt RiskWhite AfricanAmer
Hispanic EconDisadv
SpecialEduc
LEP All DistrictYearGrade Number Tested(All Students)
Texas Assessment of Knowledge and Skills: READING / ENGLISH LANGUAGE ARTS
PERCENTAGE DEMONSTRATING COMMENDED PERFORMANCE
TAKS Read (4)
*
26.02011 0
6
30.22009 * * * 1
22.12010 0
*
25.02011 0
6-8
29.02009 * * * 1
23.72010 0
0 0 0
0 1 0
0 0 0
28,5842011 0 00 0 0 0 00
28,0102009 0 10 1 0 0 10
NUMBER TESTED IN GRADES 6-8
28,4352010 0 00 0 0 0 00
Shaded cells indicate percentages at or above 30 percent, the Gold Performance Acknow ledgment Standard for 2010-11.
July 29, 2011 Dallas ISD Evaluation & Accountability (Data Analysis, Research, and Reporting Services) V:\CILT\1112\CILT_1012.mdb rpt_TAKS_E_read_4_per_comm 2011-12 Campus Data Packet
ALTERNATIVE SCHOOLS 24

FemaleMigrant MaleAt RiskWhite AfricanAmer
Hispanic EconDisadv
SpecialEduc
LEP All DistrictYearGrade Number Tested(All Students)
Texas Assessment of Knowledge and Skills: READING / ENGLISH LANGUAGE ARTS
PERCENTAGE DEMONSTRATING COMMENDED PERFORMANCE
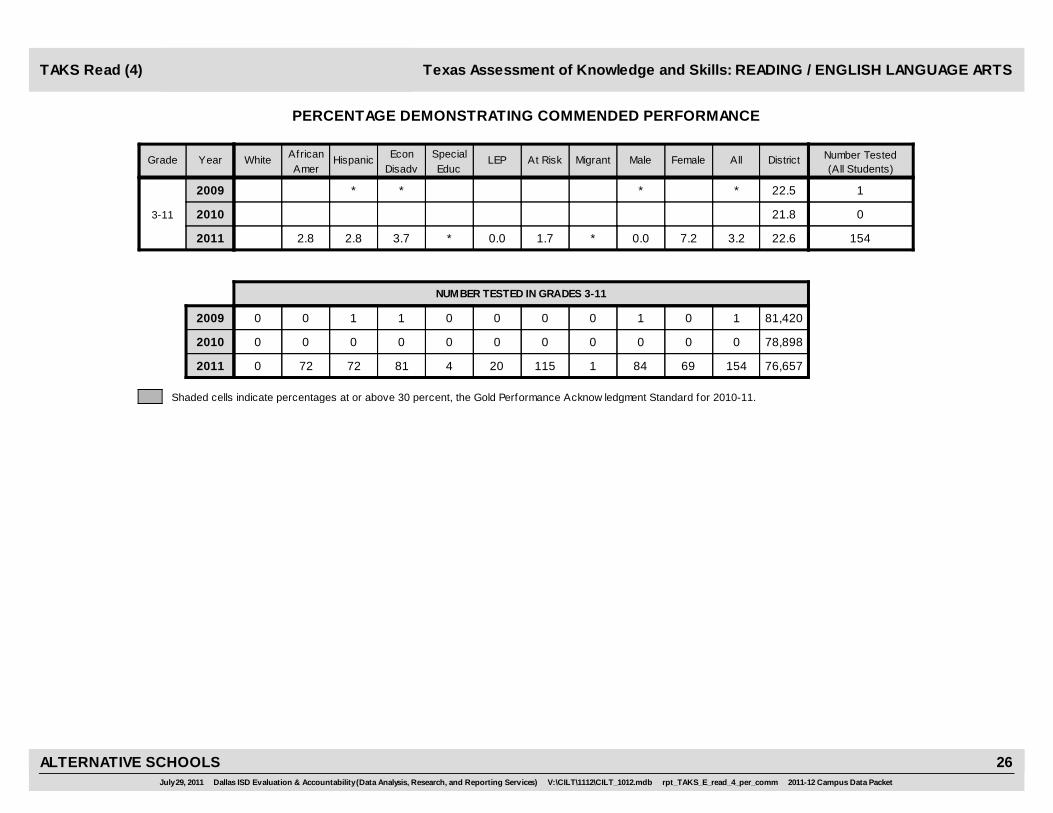
TAKS Read (4)
* 0.0 17.2 20.82011 6.1 6.9 9.1 0.0 7.5 674.4
9
13.32009 0
16.92010 0
0.0 0.0 8.22011 0.0 0.0 0.0 * 0.0 0.0 750.0
10
11.52009 0
9.12010 0
0.0 * 11.82011 0.0 * 0.0 * 0.0 120.0
11
22.22009 0
20.92010 0
* 0.0 7.2 13.92011 2.8 2.8 3.7 * 0.0 3.2 1541.7
9-11
15.12009 0
15.42010 0
1 84 69
0 0 0
0 0 0
25,8922011 0 7272 81 4 20 154115
25,2842009 0 00 0 0 0 00
NUMBER TESTED IN GRADES 9-11
25,7122010 0 00 0 0 0 00
Shaded cells indicate percentages at or above 30 percent, the Gold Performance Acknow ledgment Standard for 2010-11.
July 29, 2011 Dallas ISD Evaluation & Accountability (Data Analysis, Research, and Reporting Services) V:\CILT\1112\CILT_1012.mdb rpt_TAKS_E_read_4_per_comm 2011-12 Campus Data Packet
ALTERNATIVE SCHOOLS 25
FemaleMigrant MaleAt RiskWhite AfricanAmer
Hispanic EconDisadv
SpecialEduc
LEP All DistrictYearGrade Number Tested(All Students)
Texas Assessment of Knowledge and Skills: READING / ENGLISH LANGUAGE ARTS
PERCENTAGE DEMONSTRATING COMMENDED PERFORMANCE
TAKS Read (4)
* 0.0 7.2
*
22.62011 2.8 2.8 3.7 * 0.0 3.2 1541.7
3-11
22.52009 * * * 1
21.82010 0
1 84 69
0 1 0
0 0 0
76,6572011 0 7272 81 4 20 154115
81,4202009 0 10 1 0 0 10
NUMBER TESTED IN GRADES 3-11
78,8982010 0 00 0 0 0 00
Shaded cells indicate percentages at or above 30 percent, the Gold Performance Acknow ledgment Standard for 2010-11.
July 29, 2011 Dallas ISD Evaluation & Accountability (Data Analysis, Research, and Reporting Services) V:\CILT\1112\CILT_1012.mdb rpt_TAKS_E_read_4_per_comm 2011-12 Campus Data Packet
ALTERNATIVE SCHOOLS 26

FemaleMigrant MaleAt RiskWhiteAfricanAmer
HispanicEcon
DisadvSpecialEduc
LEP All DistrictYearGradeNumber Tested(All Students)
Texas Assessment of Knowledge and Skills: MATHEMATICS
PERCENTAGE MEETING STANDARD
TAKS Math (1)
*
74.52011 0
6
73.32009 * * * 1
72.72010 0
*
74.22011 0
6-8
71.02009 * * * 1
72.52010 0
0 0 0
0 1 0
0 0 0
28,6372011 0 00 0 0 0 00
27,7382009 0 10 1 0 0 10
NUMBER TESTED IN GRADES 6-8
28,4332010 0 00 0 0 0 00
Shaded cells indicate percentages below 65 percent, the 2010-11 AEIS minimum for an Academically Acceptable rating.
July 29, 2011 Dallas ISD Evaluation & Accountability (Data Analysis, Research, and Reporting Services) V:\CILT\1112\CILT_1012.mdb rpt_TAKS_E_math_1_per_meet 2011-12 Campus Data Packet
ALTERNATIVE SCHOOLS 27

FemaleMigrant MaleAt RiskWhiteAfricanAmer
HispanicEcon
DisadvSpecialEduc
LEP All DistrictYearGradeNumber Tested(All Students)
Texas Assessment of Knowledge and Skills: MATHEMATICS
PERCENTAGE MEETING STANDARD
TAKS Math (1)
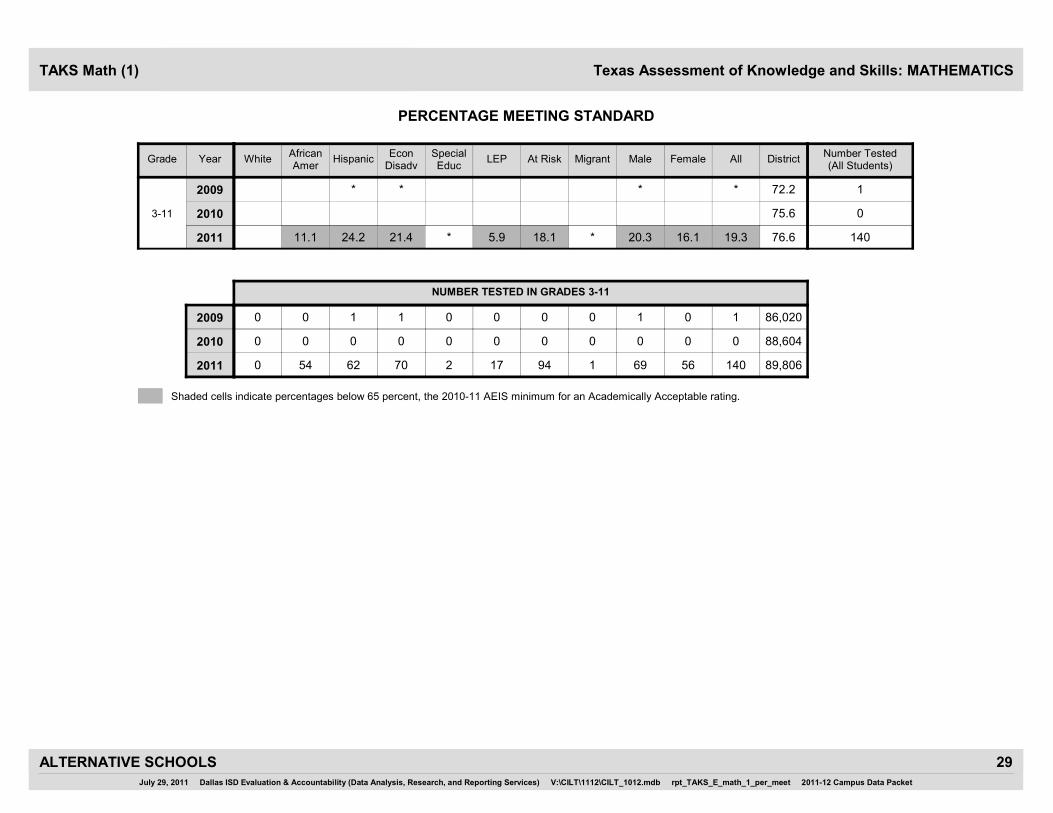
* 10.3 17.4 59.72011 0.0 25.0 14.8 0.0 15.8 5713.2
9
56.52009 0
60.42010 0
16.7 12.9 64.32011 12.5 18.2 17.6 * 0.0 14.7 6813.0
10
55.82009 0
67.82010 0
60.0 * 87.32011 * * 55.6 * 53.3 1560.0
11
77.02009 0
85.62010 0
* 20.3 16.1 69.12011 11.1 24.2 21.4 * 5.9 19.3 14018.1
9-11
61.72009 0
69.72010 0
1 69 56
0 0 0
0 0 0
25,5272011 0 6254 70 2 17 14094
24,7362009 0 00 0 0 0 00
NUMBER TESTED IN GRADES 9-11
25,3372010 0 00 0 0 0 00
Shaded cells indicate percentages below 65 percent, the 2010-11 AEIS minimum for an Academically Acceptable rating.
July 29, 2011 Dallas ISD Evaluation & Accountability (Data Analysis, Research, and Reporting Services) V:\CILT\1112\CILT_1012.mdb rpt_TAKS_E_math_1_per_meet 2011-12 Campus Data Packet
ALTERNATIVE SCHOOLS 28
FemaleMigrant MaleAt RiskWhiteAfricanAmer
HispanicEcon
DisadvSpecialEduc
LEP All DistrictYearGradeNumber Tested(All Students)
Texas Assessment of Knowledge and Skills: MATHEMATICS
PERCENTAGE MEETING STANDARD
TAKS Math (1)
* 20.3 16.1
*
76.62011 11.1 24.2 21.4 * 5.9 19.3 14018.1
3-11
72.22009 * * * 1
75.62010 0
1 69 56
0 1 0
0 0 0
89,8062011 0 6254 70 2 17 14094
86,0202009 0 10 1 0 0 10
NUMBER TESTED IN GRADES 3-11
88,6042010 0 00 0 0 0 00
Shaded cells indicate percentages below 65 percent, the 2010-11 AEIS minimum for an Academically Acceptable rating.
July 29, 2011 Dallas ISD Evaluation & Accountability (Data Analysis, Research, and Reporting Services) V:\CILT\1112\CILT_1012.mdb rpt_TAKS_E_math_1_per_meet 2011-12 Campus Data Packet
ALTERNATIVE SCHOOLS 29

FemaleMigrant MaleAt RiskWhite AfricanAmer
Hispanic EconDisadv
SpecialEduc
LEP All DistrictYearGrade Number Tested(All Students)
Texas Assessment of Knowledge and Skills: MATHEMATICS
NUMBER NOT MEETING STANDARD
TAKS Math (2)
2011
2009
2010
*
2,444 0
6
2,552* * * 1
2,673 0
2011
2009
2010
*
7,395 0
6-8
8,048* * * 1
7,821 0
0 0 0
0 1 0
0 0 0
28,6372011 0 00 0 0 0 00
27,7382009 0 10 1 0 0 10
NUMBER TESTED IN GRADES 6-8
28,4332010 0 00 0 0 0 00
July 29, 2011 Dallas ISD Evaluation & Accountability (Data Analysis, Research, and Reporting Services) V:\CILT\1112\CILT_1012.mdb rpt_TAKS_E_math_2_num_not_meet 2011-12 Campus Data Packet
ALTERNATIVE SCHOOLS 30

FemaleMigrant MaleAt RiskWhite AfricanAmer
Hispanic EconDisadv
SpecialEduc
LEP All DistrictYearGrade Number Tested(All Students)
Texas Assessment of Knowledge and Skills: MATHEMATICS
NUMBER NOT MEETING STANDARD
TAKS Math (2)
2011
2009
2010
* 26 19 3,76425 18 23 6 48 5733
9
4,403 0
3,992 0
2011
2009
2010
25 27 3,19221 27 28 * 8 58 6840
10
3,568 0
2,682 0
2011
2009
2010
4 * 923* * 4 * 7 154
11
1,508 0
998 0
2011
2009
2010
* 55 47 7,87948 47 55 * 16 113 14077
9-11
9,479 0
7,672 0
1 69 56
0 0 0
0 0 0
25,5272011 0 6254 70 2 17 14094
24,7362009 0 00 0 0 0 00
NUMBER TESTED IN GRADES 9-11
25,3372010 0 00 0 0 0 00
July 29, 2011 Dallas ISD Evaluation & Accountability (Data Analysis, Research, and Reporting Services) V:\CILT\1112\CILT_1012.mdb rpt_TAKS_E_math_2_num_not_meet 2011-12 Campus Data Packet
ALTERNATIVE SCHOOLS 31

FemaleMigrant MaleAt RiskWhite AfricanAmer
Hispanic EconDisadv
SpecialEduc
LEP All DistrictYearGrade Number Tested(All Students)
Texas Assessment of Knowledge and Skills: MATHEMATICS
NUMBER NOT MEETING STANDARD
TAKS Math (2)
2011
2009
2010
* 55 47
*
21,01848 47 55 * 16 113 14077
3-11
23,890* * * 1
21,647 0
1 69 56
0 1 0
0 0 0
89,8062011 0 6254 70 2 17 14094
86,0202009 0 10 1 0 0 10
NUMBER TESTED IN GRADES 3-11
88,6042010 0 00 0 0 0 00
July 29, 2011 Dallas ISD Evaluation & Accountability (Data Analysis, Research, and Reporting Services) V:\CILT\1112\CILT_1012.mdb rpt_TAKS_E_math_2_num_not_meet 2011-12 Campus Data Packet
ALTERNATIVE SCHOOLS 32

GeometricRelationshipsand SpatialReasoning
Tw o- and Three-Dimensional
Representations
Measurementand Similarity
Percents,Proportions,Probability,
and Statistics
MathematicalProcessesand Tools
FunctionalRelationships
Properties andAttributes of
Functions
LinearFunctions
LinearEquations and
Inequalities
Quadratic andOther Nonlinear
Functions
YearGrade
OBJECTIVE
Texas Assessment of Knowledge and Skills: MATHEMATICS
AVERAGE PERCENTAGE OF ITEMS CORRECT BY OBJECTIVE
TAKS Math (3)
2011 35.540.7 34.7 37.5 38.6 39.0 39.0 36.0 29.2 33.7
2009
20109
2011 33.353.8 36.2 45.9 40.0 44.4 43.5 44.7 30.9 32.6
2009
201010
2011 43.754.7 50.7 50.7 49.3 62.7 42.9 54.3 46.7 40.0
2009
201011
2011 35.348.6 37.1 43.0 40.4 44.2 41.6 42.2 31.9 33.9
2009
20109-11
July 29, 2011 Dallas ISD Evaluation & Accountability (Data Analysis, Research, and Reporting Services) V:\CILT\1112\CILT_1012.mdb rpt_TAKS_E_math_3_obj_high 2011-12 Campus Data Packet
ALTERNATIVE SCHOOLS 33

FemaleMigrant MaleAt RiskWhite AfricanAmer
Hispanic EconDisadv
SpecialEduc
LEP All DistrictYearGrade Number Tested(All Students)
Texas Assessment of Knowledge and Skills: MATHEMATICS
PERCENTAGE DEMONSTRATING COMMENDED PERFORMANCE
TAKS Math (4)
*
24.52011 0
6
29.02009 * * * 1
22.42010 0
*
18.32011 0
6-8
18.72009 * * * 1
17.22010 0
0 0 0
0 1 0
0 0 0
28,6372011 0 00 0 0 0 00
27,7382009 0 10 1 0 0 10
NUMBER TESTED IN GRADES 6-8
28,4332010 0 00 0 0 0 00
Shaded cells indicate percentages at or above 30 percent, the Gold Performance Acknow ledgment Standard for 2010-11.
July 29, 2011 Dallas ISD Evaluation & Accountability (Data Analysis, Research, and Reporting Services) V:\CILT\1112\CILT_1012.mdb rpt_TAKS_E_math_4_per_comm 2011-12 Campus Data Packet
ALTERNATIVE SCHOOLS 35

FemaleMigrant MaleAt RiskWhite AfricanAmer
Hispanic EconDisadv
SpecialEduc
LEP All DistrictYearGrade Number Tested(All Students)
Texas Assessment of Knowledge and Skills: MATHEMATICS
PERCENTAGE DEMONSTRATING COMMENDED PERFORMANCE
TAKS Math (4)
* 0.0 0.0 15.42011 0.0 0.0 0.0 0.0 0.0 570.0
9
15.22009 0
15.92010 0
0.0 0.0 11.92011 0.0 0.0 0.0 * 0.0 0.0 680.0
10
9.02009 0
12.22010 0
0.0 * 19.42011 * * 0.0 * 0.0 150.0
11
20.62009 0
18.12010 0
* 0.0 0.0 15.32011 0.0 0.0 0.0 * 0.0 0.0 1400.0
9-11
14.62009 0
15.32010 0
1 69 56
0 0 0
0 0 0
25,5272011 0 6254 70 2 17 14094
24,7362009 0 00 0 0 0 00
NUMBER TESTED IN GRADES 9-11
25,3372010 0 00 0 0 0 00
Shaded cells indicate percentages at or above 30 percent, the Gold Performance Acknow ledgment Standard for 2010-11.
July 29, 2011 Dallas ISD Evaluation & Accountability (Data Analysis, Research, and Reporting Services) V:\CILT\1112\CILT_1012.mdb rpt_TAKS_E_math_4_per_comm 2011-12 Campus Data Packet
ALTERNATIVE SCHOOLS 36

FemaleMigrant MaleAt RiskWhite AfricanAmer
Hispanic EconDisadv
SpecialEduc
LEP All DistrictYearGrade Number Tested(All Students)
Texas Assessment of Knowledge and Skills: MATHEMATICS
PERCENTAGE DEMONSTRATING COMMENDED PERFORMANCE
TAKS Math (4)
* 0.0 0.0
*
21.82011 0.0 0.0 0.0 * 0.0 0.0 1400.0
3-11
23.12009 * * * 1
20.92010 0
1 69 56
0 1 0
0 0 0
89,8062011 0 6254 70 2 17 14094
86,0202009 0 10 1 0 0 10
NUMBER TESTED IN GRADES 3-11
88,6042010 0 00 0 0 0 00
Shaded cells indicate percentages at or above 30 percent, the Gold Performance Acknow ledgment Standard for 2010-11.
July 29, 2011 Dallas ISD Evaluation & Accountability (Data Analysis, Research, and Reporting Services) V:\CILT\1112\CILT_1012.mdb rpt_TAKS_E_math_4_per_comm 2011-12 Campus Data Packet
ALTERNATIVE SCHOOLS 37

FemaleMigrant MaleAt RiskWhite AfricanAmer
Hispanic EconDisadv
SpecialEduc
LEP All DistrictYearGrade Number Tested(All Students)
Texas Assessment of Knowledge and Skills: SOCIAL STUDIES
PERCENTAGE MEETING STANDARD
TAKS SS (1)
75.0 74.1 91.92011 52.4 86.7 67.7 * 75.0 74.2 6269.8
10
87.72009 0
92.22010 0
100.0 * 98.32011 * * 100.0 * 100.0 14100.0
11
96.72009 0
97.72010 0
81.6 75.9 94.82011 61.5 88.6 75.0 * 81.8 78.9 7675.5
10-11
91.82009 0
94.72010 0
0 38 29
0 0 0
0 0 0
16,0812011 0 3526 40 2 11 7653
14,4912009 0 00 0 0 0 00
NUMBER TESTED IN GRADES 10-11
15,1662010 0 00 0 0 0 00
Shaded cells indicate percentages below 70 percent, the 2010-11 AEIS minimum for an Academically Acceptable rating.
July 29, 2011 Dallas ISD Evaluation & Accountability (Data Analysis, Research, and Reporting Services) V:\CILT\1112\CILT_1012.mdb rpt_TAKS_E_ss_1_per_meet 2011-12 Campus Data Packet
ALTERNATIVE SCHOOLS 38

FemaleMigrant MaleAt RiskWhite AfricanAmer
Hispanic EconDisadv
SpecialEduc
LEP All DistrictYearGrade Number Tested(All Students)
Texas Assessment of Knowledge and Skills: SOCIAL STUDIES
NUMBER NOT MEETING STANDARD
TAKS SS (2)
7 7 7182011 10 4 10 * 2 16 6213
10
9762009 0
6442010 0
0 * 1262011 * * 0 * 0 140
11
2132009 0
1592010 0
7 7 8442011 10 4 10 * 2 16 7613
10-11
1,1892009 0
8032010 0
0 38 29
0 0 0
0 0 0
16,0812011 0 3526 40 2 11 7653
14,4912009 0 00 0 0 0 00
NUMBER TESTED IN GRADES 10-11
15,1662010 0 00 0 0 0 00
July 29, 2011 Dallas ISD Evaluation & Accountability (Data Analysis, Research, and Reporting Services) V:\CILT\1112\CILT_1012.mdb rpt_TAKS_E_ss_2_num_not_meet 2011-12 Campus Data Packet
ALTERNATIVE SCHOOLS 39

Issues and Eventsin U.S. History
Geographic Inf luenceson History
Economic and SocialInf luences on History
Political Inf luenceson History Critical-Thinking SkillsYearGrade
OBJECTIVE
Texas Assessment of Knowledge and Skills: SOCIAL STUDIES
AVERAGE PERCENTAGE OF ITEMS CORRECT BY OBJECTIVE
TAKS SS (3)
2011 57.1 66.0 62.0 59.0 61.0
2009
10 2010
2011 48.9 64.3 71.4 66.7 72.7
2009
11 2010
2011 55.6 65.7 63.7 60.4 63.2
2009
10-11 2010
July 29, 2011 Dallas ISD Evaluation & Accountability (Data Analysis, Research, and Reporting Services) V:\CILT\1112\CILT_1012.mdb rpt_TAKS_E_ss_3_obj 2011-12 Campus Data Packet
ALTERNATIVE SCHOOLS 40

FemaleMigrant MaleAt RiskWhite AfricanAmer
Hispanic EconDisadv
SpecialEduc
LEP All DistrictYearGrade Number Tested(All Students)
Texas Assessment of Knowledge and Skills: SOCIAL STUDIES
PERCENTAGE DEMONSTRATING COMMENDED PERFORMANCE
TAKS SS (4)
3.6 0.0 36.72011 0.0 3.3 3.2 * 0.0 1.6 622.3
10
29.82009 0
36.02010 0
20.0 * 51.22011 * * 22.2 * 14.3 1420.0
11
39.62009 0
46.12010 0
7.9 0.0 43.32011 3.8 5.7 7.5 * 0.0 3.9 765.7
10-11
34.22009 0
40.62010 0
0 38 29
0 0 0
0 0 0
16,0812011 0 3526 40 2 11 7653
14,4912009 0 00 0 0 0 00
NUMBER TESTED IN GRADES 10-11
15,1662010 0 00 0 0 0 00
Shaded cells indicate percentages at or above 30 percent, the Gold Performance Acknow ledgment Standard for 2010-11.
July 29, 2011 Dallas ISD Evaluation & Accountability (Data Analysis, Research, and Reporting Services) V:\CILT\1112\CILT_1012.mdb rpt_TAKS_E_ss_4_per_comm 2011-12 Campus Data Packet
ALTERNATIVE SCHOOLS 41

FemaleMigrant MaleAt RiskWhite AfricanAmer
Hispanic EconDisadv
SpecialEduc
LEP All DistrictYearGrade Number Tested(All Students)
Texas Assessment of Knowledge and Skills: SCIENCE
PERCENTAGE MEETING STANDARD
TAKS Science (1)
25.9 13.8 65.72011 17.4 24.1 21.9 * 0.0 17.7 6218.6
10
52.32009
65.12010 0
44.4 * 87.72011 * * 37.5 * 35.7 1444.4
11
82.22009
87.92010 0
30.6 16.1 75.62011 22.2 26.5 25.0 * 10.0 21.1 7623.1
10-11
65.72009
75.42010 0
0 36 31
0 0 0
0 0 0
16,1572011 0 3427 40 2 10 7652
14,5892009 0 00 0 0 0 00
NUMBER TESTED IN GRADES 10-11
15,2512010 0 00 0 0 0 00
Shaded cells indicate percentages below 60 percent, the 2010-11 AEIS minimum for an Academically Acceptable rating.
July 29, 2011 Dallas ISD Evaluation & Accountability (Data Analysis, Research, and Reporting Services) V:\CILT\1112\CILT_1012.mdb rpt_TAKS_E_sc_1_per_meet 2011-12 Campus Data Packet
ALTERNATIVE SCHOOLS 42

FemaleMigrant MaleAt RiskWhite AfricanAmer
Hispanic EconDisadv
SpecialEduc
LEP All DistrictYearGrade Number Tested(All Students)
Texas Assessment of Knowledge and Skills: SCIENCE
NUMBER NOT MEETING STANDARD
TAKS Science (2)
20 25 3,0582011 19 22 25 * 7 51 6235
10
3,8412009
2,9102010 0
5 * 8882011 * * 5 * 9 145
11
1,1622009
8382010 0
25 26 3,9462011 21 25 30 * 9 60 7640
10-11
5,0032009
3,7482010 0
0 36 31
0 0 0
0 0 0
16,1572011 0 3427 40 2 10 7652
14,5892009 0 00 0 0 00
NUMBER TESTED IN GRADES 10-11
15,2512010 0 00 0 0 0 00
July 29, 2011 Dallas ISD Evaluation & Accountability (Data Analysis, Research, and Reporting Services) V:\CILT\1112\CILT_1012.mdb rpt_TAKS_E_sc_2_num_not_meet 2011-12 Campus Data Packet
ALTERNATIVE SCHOOLS 43

Nature of ScienceOrganization ofLiving Systems
Interdependence ofOrganisms andthe Environment
Structures andProperties of Matter
Motion, Forces,and Energy
YearGrade
OBJECTIVE
Texas Assessment of Knowledge and Skills: SCIENCE
AVERAGE PERCENTAGE OF ITEMS CORRECT BY OBJECTIVE
TAKS Science (3)
2011 53.7 42.7 49.4 38.7 38.7
2009
10 2010
2011 51.7 50.0 48.2 44.2 46.1
2009
11 2010
2011 53.3 44.0 49.2 39.7 40.1
2009
10-11 2010
July 29, 2011 Dallas ISD Evaluation & Accountability (Data Analysis, Research, and Reporting Services) V:\CILT\1112\CILT_1012.mdb rpt_TAKS_E_sc_3_obj_high 2011-12 Campus Data Packet
ALTERNATIVE SCHOOLS 44

FemaleMigrant MaleAt RiskWhite AfricanAmer
Hispanic EconDisadv
SpecialEduc
LEP All DistrictYearGrade Number Tested(All Students)
Texas Assessment of Knowledge and Skills: SCIENCE
PERCENTAGE DEMONSTRATING COMMENDED PERFORMANCE
TAKS Science (4)
0.0 0.0 11.02011 0.0 0.0 0.0 * 0.0 0.0 620.0
10
5.72009
10.42010 0
0.0 * 17.32011 * * 0.0 * 0.0 140.0
11
12.92009
10.92010 0
0.0 0.0 13.82011 0.0 0.0 0.0 * 0.0 0.0 760.0
10-11
9.02009
10.62010 0
0 36 31
0 0 0
0 0 0
16,1572011 0 3427 40 2 10 7652
14,5892009 0 00 0 0 0 00
NUMBER TESTED IN GRADES 10-11
15,2512010 0 00 0 0 0 00
Shaded cells indicate percentages at or above 30 percent, the Gold Performance Acknow ledgment Standard for 2010-11.
July 29, 2011 Dallas ISD Evaluation & Accountability (Data Analysis, Research, and Reporting Services) V:\CILT\1112\CILT_1012.mdb rpt_TAKS_E_sc_4_per_comm 2011-12 Campus Data Packet
ALTERNATIVE SCHOOLS 45

Number Tested(All Students)
Number Tested(All Students)
DistrictAt Risk Not At Risk All DistrictYearGrade At Risk Not At Risk All
State Compensatory Education (SCE) Compliance for At-Risk StudentsCompliance
PERCENTAGE AT OR ABOVE THE 40th PERCENTILE on the ITBS
YearGrade
MATHEMATICS TOTAL (**MATHEMATICS )READING TOTAL (**READING PROFILE TOTAL )
2009
K**
56.8 563.32011 * * * 5 * * *
52.8
51.2
0
4
54.4 0
61.22010 * * 3 * *
2009
K**
2011
2010
2009
1
53.1 358.12011 * * 2 * *
50.4
48.8
0
5
54.2 0
55.22010 * * 5 * *
2009
1
2011
2010
2009
2
56.8 750.72011 28.6 28.6 7 28.6 28.6
53.2
54.6
0
7
47.9 0
48.62010 * * * 5 50.0 * 57.1
2009
2
2011
2010
2009
5
44.8 336.22011 * * 4 * *
0
0
0
2010 0
2009
5
2011
2010
2009
1-5
53.3 1847.22011 30.8 30.8 13 33.3 * 27.8
52.3
51.5
0
16
51.0 0
51.92010 11.1 * 20.0 10 27.3 * 43.8
2009
K-5
2011
2010
29,7632011 15 3 18 51,01915 3 18
15,9252009 0 0 0
20,2522010 9 4 13
30,5630 0 0
40,16311 5 16NumberTested
2011
2009
2010NumberTested
filler
July 29, 2011 Dallas ISD Evaluation & Accountability (Data Analysis, Research, and Reporting Services) V:\CILT\1112\CILT_1012.mdb rpt_SCE_COMPLIANCE 2011-12 Campus Data Packet
ALTERNATIVE SCHOOLS 46

Number Tested(All Students)
Number Tested(All Students)
DistrictAt Risk Not At Risk All DistrictYearGrade At Risk Not At Risk All
State Compensatory Education (SCE) Compliance for At-Risk StudentsCompliance
PERCENTAGE AT OR ABOVE THE 40th PERCENTILE on the ITBS
YearGrade
MATHEMATICS TOTAL (**MATHEMATICS )READING TOTAL (**READING PROFILE TOTAL )
2009
8
42.1 5833.32011 4.3 * 4.0 50 16.4 * 15.5
48.3
45.5
0
72
33.6 0
33.92010 14.1 * 13.7 73 22.9 * 22.2
2009
8
2011
2010
9,4232011 47 3 50 9,26255 3 58
9,8132009 0 0 0
9,4162010 71 2 73
9,7370 0 0
9,13570 2 72NumberTested
2011
2009
2010NumberTested
filler
July 29, 2011 Dallas ISD Evaluation & Accountability (Data Analysis, Research, and Reporting Services) V:\CILT\1112\CILT_1012.mdb rpt_SCE_COMPLIANCE 2011-12 Campus Data Packet
ALTERNATIVE SCHOOLS 47

FemaleMigrant MaleAt RiskWhite AfricanAmer
Hispanic EconDisadv
SpecialEduc
LEP All DistrictYearGrade Number Tested(All Students)
ITBS: READING TOTAL (**READING PROFILE TOTAL)ITBS Read (1)
PERCENTAGE AT OR ABOVE THE 40th PERCENTILE
* *
*
63.32011 * * * 5*
K**
54.42009 0
61.22010 * * * * 3
* *
*
58.12011 * * * * * 2*
1
54.22009 0
55.22010 * * * * * * 5*
* *
* *
50.72011 33.3 * 28.6 * 28.6 728.6
2
47.92009 0
48.62010 * * * * 5*
33.3 *
11.1 *
54.42011 28.6 * 33.3 * 33.3 933.3
1-2
51.02009 0
51.92010 * 14.3 * 20.0 * 20.0 1011.1
* 36.22011 * * * * * 4*
5
2009 0
2010 0
30.0 *
11.1 *
47.22011 37.5 * 33.3 * 30.8 1330.8
1-5
51.02009 0
51.92010 * 14.3 * 20.0 * 20.0 1011.1
0 10 3
0 0 0
0 9 1
23,0022011 0 58 12 0 4 1313
14,6372009 0 00 0 0 0 00NumberTested
13,9902010 2 17 10 1 0 109
filler
July 29, 2011 Dallas ISD Evaluation & Accountability (Data Analysis, Research, and Reporting Services) V:\CILT\1112\CILT_1012.mdb rpt_ITBS_read_1_perGE40 2011-12 Campus Data Packet
ALTERNATIVE SCHOOLS 48

FemaleMigrant MaleAt RiskWhite AfricanAmer
Hispanic EconDisadv
SpecialEduc
LEP All DistrictYearGrade Number Tested(All Students)
ITBS: READING TOTAL (**READING PROFILE TOTAL)ITBS Read (1)
PERCENTAGE AT OR ABOVE THE 40th PERCENTILE
0.0 16.7
* 13.0 16.7
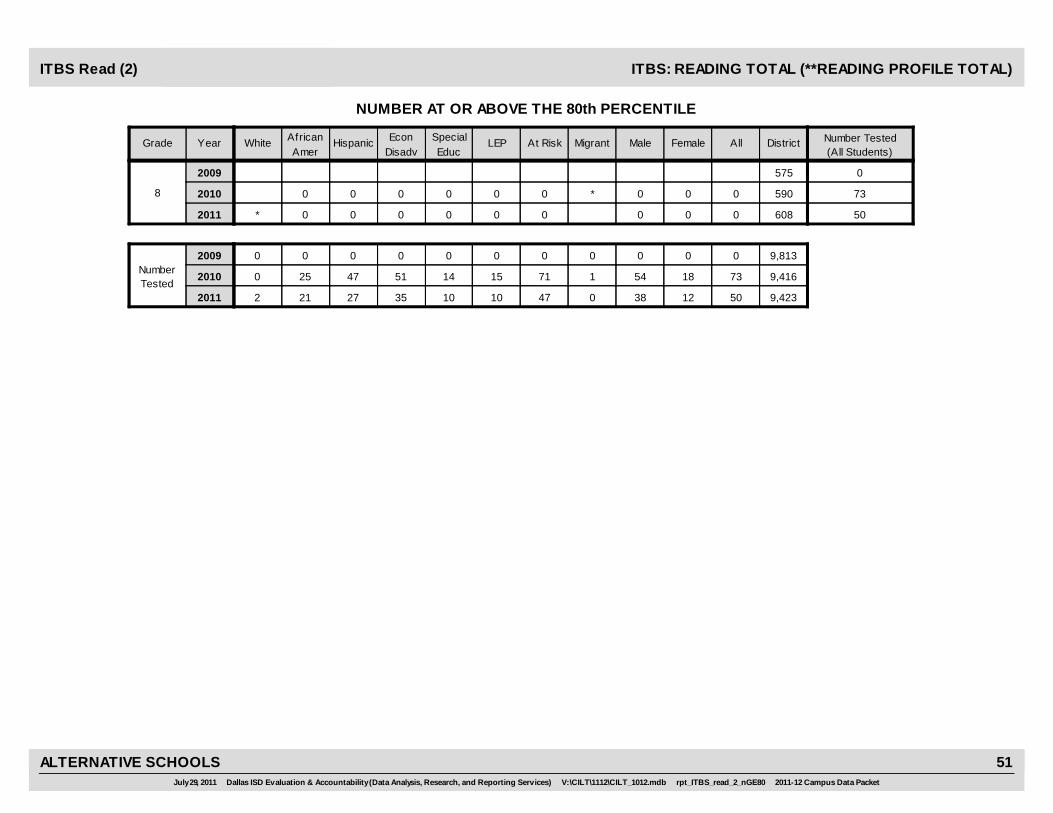
33.32011 * 4.8 0.0 2.9 0.0 0.0 4.0 504.3
8
33.62009 0
33.92010 20.0 10.6 15.7 0.0 0.0 13.7 7314.1
0 38 12
0 0 0
1 54 18
9,4232011 2 2721 35 10 10 5047
9,8132009 0 00 0 0 0 00NumberTested
9,4162010 0 4725 51 14 15 7371
filler
July 29, 2011 Dallas ISD Evaluation & Accountability (Data Analysis, Research, and Reporting Services) V:\CILT\1112\CILT_1012.mdb rpt_ITBS_read_1_perGE40 2011-12 Campus Data Packet
ALTERNATIVE SCHOOLS 49

FemaleMigrant MaleAt RiskWhite AfricanAmer
Hispanic EconDisadv
SpecialEduc
LEP All DistrictYearGrade Number Tested(All Students)
ITBS: READING TOTAL (**READING PROFILE TOTAL)ITBS Read (2)
NUMBER AT OR ABOVE THE 80th PERCENTILE
* *
*
2,1062011 * * * 5*
K**
3042009 0
1,7172010 * * * * 3
* *
*
1,9632011 * * * * * 2*
1
1,6592009 0
1,7292010 * * * * * * 5*
* *
* *
1,0202011 0 * 0 * 0 70
2
1,0272009 0
9542010 * * * * 5*
0 *
0 *
2,9832011 0 * 0 * 0 90
1-2
2,6882009 0
2,6832010 * 0 * 0 * 0 100
* 7012011 * * * * * 4*
5
2009 0
2010 0
0 *
0 *
3,6942011 0 * 0 * 0 130
1-5
2,6882009 0
2,6832010 * 0 * 0 * 0 100
0 10 3
0 0 0
0 9 1
23,0022011 0 58 12 0 4 1313
14,6372009 0 00 0 0 0 00NumberTested
13,9902010 2 17 10 1 0 109
filler
July 29, 2011 Dallas ISD Evaluation & Accountability (Data Analysis, Research, and Reporting Services) V:\CILT\1112\CILT_1012.mdb rpt_ITBS_read_2_nGE80 2011-12 Campus Data Packet
ALTERNATIVE SCHOOLS 50
FemaleMigrant MaleAt RiskWhite AfricanAmer
Hispanic EconDisadv
SpecialEduc
LEP All DistrictYearGrade Number Tested(All Students)
ITBS: READING TOTAL (**READING PROFILE TOTAL)ITBS Read (2)
NUMBER AT OR ABOVE THE 80th PERCENTILE
0 0
* 0 0
6082011 * 0 0 0 0 0 0 500
8
5752009 0
5902010 0 0 0 0 0 0 730
0 38 12
0 0 0
1 54 18
9,4232011 2 2721 35 10 10 5047
9,8132009 0 00 0 0 0 00NumberTested
9,4162010 0 4725 51 14 15 7371
filler
July 29, 2011 Dallas ISD Evaluation & Accountability (Data Analysis, Research, and Reporting Services) V:\CILT\1112\CILT_1012.mdb rpt_ITBS_read_2_nGE80 2011-12 Campus Data Packet
ALTERNATIVE SCHOOLS 51

FemaleMigrant MaleAt RiskWhite AfricanAmer
Hispanic EconDisadv
SpecialEduc
LEP All DistrictYearGrade Number Tested(All Students)
ITBS: MATHEMATICS TOTAL (**MATHEMATICS)ITBS Math (1)
PERCENTAGE AT OR ABOVE THE 40th PERCENTILE
* *
*
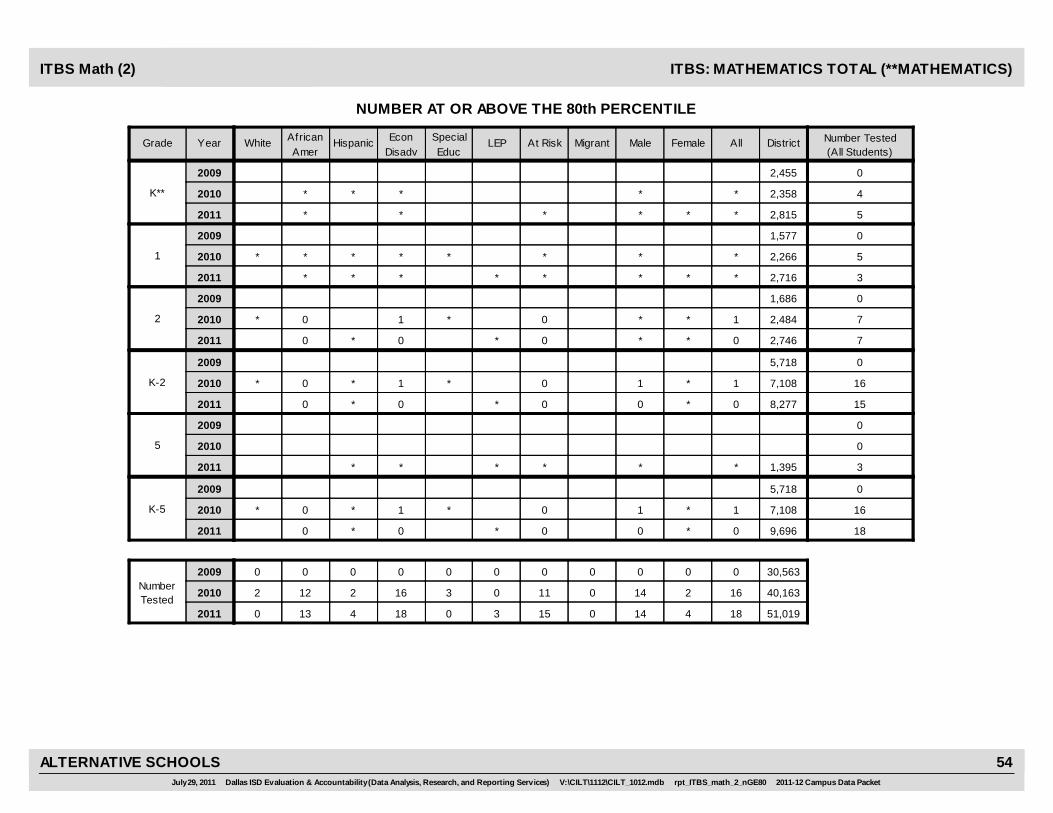
56.82011 * * * 5*
K**
52.82009 0
51.22010 * * * * 4
* *
*
53.12011 * * * * * 3*
1
50.42009 0
48.82010 * * * * * * 5*
* *
* *
56.82011 33.3 * 28.6 * 28.6 728.6
2
53.22009 0
54.62010 * 50.0 57.1 * 57.1 750.0
27.3 *
42.9 *
55.62011 23.1 * 26.7 * 26.7 1533.3
K-2
52.32009 0
51.52010 * 41.7 * 43.8 * 43.8 1627.3
* 44.82011 * * * * 3*
5
2009 0
2010 0
28.6 *
42.9 *
53.32011 23.1 * 27.8 * 27.8 1833.3
K-5
52.32009 0
51.52010 * 41.7 * 43.8 * 43.8 1627.3
0 14 4
0 0 0
0 14 2
51,0192011 0 413 18 0 3 1815
30,5632009 0 00 0 0 0 00NumberTested
40,1632010 2 212 16 3 0 1611
filler
July 29, 2011 Dallas ISD Evaluation & Accountability (Data Analysis, Research, and Reporting Services) V:\CILT\1112\CILT_1012.mdb rpt_ITBS_math_1_perGE40 2011-12 Campus Data Packet
ALTERNATIVE SCHOOLS 52

FemaleMigrant MaleAt RiskWhite AfricanAmer
Hispanic EconDisadv
SpecialEduc
LEP All DistrictYearGrade Number Tested(All Students)
ITBS: MATHEMATICS TOTAL (**MATHEMATICS)ITBS Math (1)
PERCENTAGE AT OR ABOVE THE 40th PERCENTILE
15.0 16.7
* 17.9 40.0
42.12011 * 9.5 17.1 14.0 10.0 8.3 15.5 5816.4
8
48.32009 0
45.52010 22.2 22.7 23.4 7.1 7.1 22.2 7222.9
0 40 18
0 0 0
1 56 15
9,2622011 2 3521 43 10 12 5855
9,7372009 0 00 0 0 0 00NumberTested
9,1352010 0 4427 47 14 14 7270
filler
July 29, 2011 Dallas ISD Evaluation & Accountability (Data Analysis, Research, and Reporting Services) V:\CILT\1112\CILT_1012.mdb rpt_ITBS_math_1_perGE40 2011-12 Campus Data Packet
ALTERNATIVE SCHOOLS 53
FemaleMigrant MaleAt RiskWhite AfricanAmer
Hispanic EconDisadv
SpecialEduc
LEP All DistrictYearGrade Number Tested(All Students)
ITBS: MATHEMATICS TOTAL (**MATHEMATICS)ITBS Math (2)
NUMBER AT OR ABOVE THE 80th PERCENTILE
* *
*
2,8152011 * * * 5*
K**
2,4552009 0
2,3582010 * * * * 4
* *
*
2,7162011 * * * * * 3*
1
1,5772009 0
2,2662010 * * * * * * 5*
* *
* *
2,7462011 0 * 0 * 0 70
2
1,6862009 0
2,4842010 * 0 1 * 1 70
0 *
1 *
8,2772011 0 * 0 * 0 150
K-2
5,7182009 0
7,1082010 * 0 * 1 * 1 160
* 1,3952011 * * * * 3*
5
2009 0
2010 0
0 *
1 *
9,6962011 0 * 0 * 0 180
K-5
5,7182009 0
7,1082010 * 0 * 1 * 1 160
0 14 4
0 0 0
0 14 2
51,0192011 0 413 18 0 3 1815
30,5632009 0 00 0 0 0 00NumberTested
40,1632010 2 212 16 3 0 1611
filler
July 29, 2011 Dallas ISD Evaluation & Accountability (Data Analysis, Research, and Reporting Services) V:\CILT\1112\CILT_1012.mdb rpt_ITBS_math_2_nGE80 2011-12 Campus Data Packet
ALTERNATIVE SCHOOLS 54

FemaleMigrant MaleAt RiskWhite AfricanAmer
Hispanic EconDisadv
SpecialEduc
LEP All DistrictYearGrade Number Tested(All Students)
ITBS: MATHEMATICS TOTAL (**MATHEMATICS)ITBS Math (2)
NUMBER AT OR ABOVE THE 80th PERCENTILE
0 0
* 0 2
9432011 * 0 0 0 0 0 0 580
8
1,2192009 0
9842010 1 1 1 0 0 2 722
0 40 18
0 0 0
1 56 15
9,2622011 2 3521 43 10 12 5855
9,7372009 0 00 0 0 0 00NumberTested
9,1352010 0 4427 47 14 14 7270
filler
July 29, 2011 Dallas ISD Evaluation & Accountability (Data Analysis, Research, and Reporting Services) V:\CILT\1112\CILT_1012.mdb rpt_ITBS_math_2_nGE80 2011-12 Campus Data Packet
ALTERNATIVE SCHOOLS 55
FemaleMigrant MaleAt RiskWhite AfricanAmer
Hispanic EconDisadv
SpecialEduc
LEP All DistrictYearGrade Number Tested(All Students)
ITBS: MATHEMATICS COMPUTATIONITBS Math (3)
PERCENTAGE AT OR ABOVE THE 40th PERCENTILE
* *
16.7
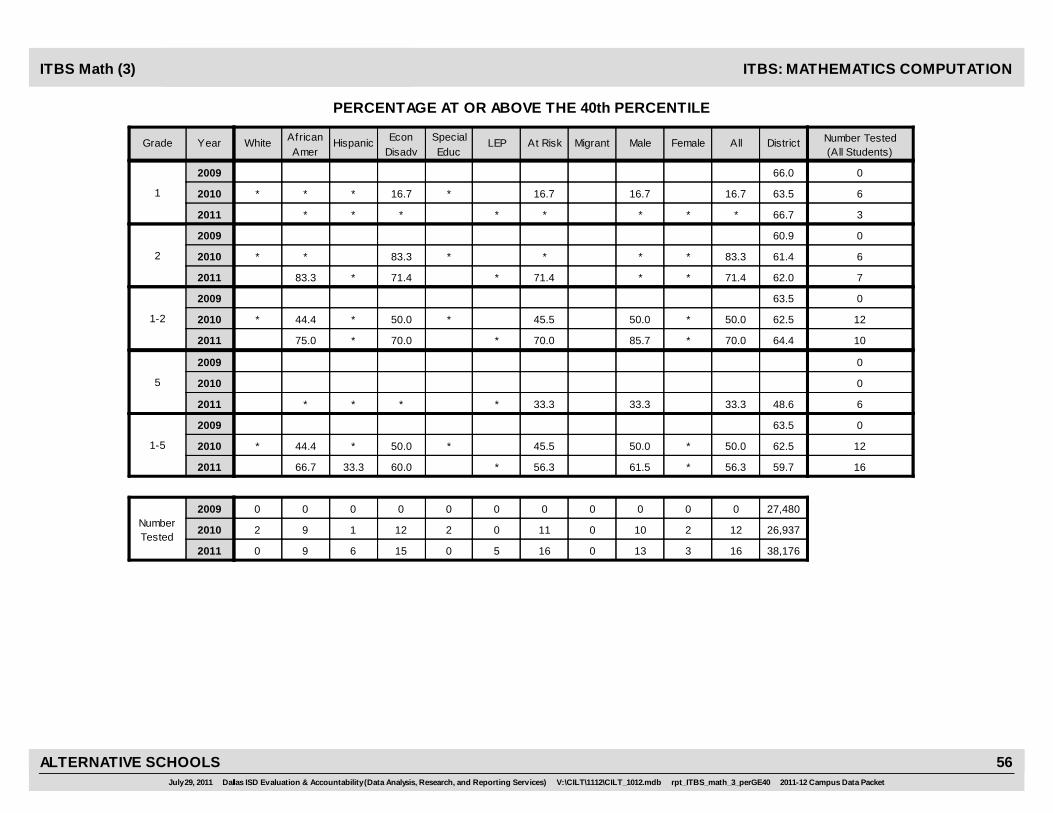
66.72011 * * * * * 3*
1
66.02009 0
63.52010 * * * 16.7 * 16.7 616.7
* *
* *
62.02011 83.3 * 71.4 * 71.4 771.4
2
60.92009 0
61.42010 * * 83.3 * 83.3 6*
85.7 *
50.0 *
64.42011 75.0 * 70.0 * 70.0 1070.0
1-2
63.52009 0
62.52010 * 44.4 * 50.0 * 50.0 1245.5
33.3 48.62011 * * * * 33.3 633.3
5
2009 0
2010 0
61.5 *
50.0 *
59.72011 66.7 33.3 60.0 * 56.3 1656.3
1-5
63.52009 0
62.52010 * 44.4 * 50.0 * 50.0 1245.5
0 13 3
0 0 0
0 10 2
38,1762011 0 69 15 0 5 1616
27,4802009 0 00 0 0 0 00NumberTested
26,9372010 2 19 12 2 0 1211
filler
July 29, 2011 Dallas ISD Evaluation & Accountability (Data Analysis, Research, and Reporting Services) V:\CILT\1112\CILT_1012.mdb rpt_ITBS_math_3_perGE40 2011-12 Campus Data Packet
ALTERNATIVE SCHOOLS 56

FemaleMigrant MaleAt RiskWhite AfricanAmer
Hispanic EconDisadv
SpecialEduc
LEP All DistrictYearGrade Number Tested(All Students)
ITBS: MATHEMATICS COMPUTATIONITBS Math (3)
PERCENTAGE AT OR ABOVE THE 40th PERCENTILE
15.9 10.5
* 15.3 42.1
34.42011 * 12.5 13.5 12.8 9.1 8.3 14.3 6315.0
8
44.62009 0
37.32010 21.4 22.0 22.2 12.5 23.5 21.5 7920.8
0 44 19
0 0 0
1 59 19
9,5302011 2 3724 47 11 12 6360
10,0122009 0 00 0 0 0 00NumberTested
9,5192010 0 5028 54 16 17 7977
filler
July 29, 2011 Dallas ISD Evaluation & Accountability (Data Analysis, Research, and Reporting Services) V:\CILT\1112\CILT_1012.mdb rpt_ITBS_math_3_perGE40 2011-12 Campus Data Packet
ALTERNATIVE SCHOOLS 57

FemaleMigrant MaleAt RiskWhite AfricanAmer
Hispanic EconDisadv
SpecialEduc
LEP All DistrictYearGrade Number Tested(All Students)
ITBS: MATHEMATICS COMPUTATIONITBS Math (4)
NUMBER AT OR ABOVE THE 80th PERCENTILE
* *
0
4,4272011 * * * * * 3*
1
4,5972009 0
4,1292010 * * * 0 * 0 60
* *
* *
3,8102011 1 * 1 * 1 71
2
3,8222009 0
3,7762010 * * 1 * 1 6*
2 *
1 *
8,2372011 2 * 3 * 3 103
1-2
8,4192009 0
7,9052010 * 0 * 1 * 1 120
1 1,4162011 * * * * 1 61
5
2009 0
2010 0
3 *
1 *
9,6602011 2 1 4 * 4 164
1-5
8,4192009 0
7,9052010 * 0 * 1 * 1 120
0 13 3
0 0 0
0 10 2
38,1762011 0 69 15 0 5 1616
27,4802009 0 00 0 0 0 00NumberTested
26,9372010 2 19 12 2 0 1211
filler
July 29, 2011 Dallas ISD Evaluation & Accountability (Data Analysis, Research, and Reporting Services) V:\CILT\1112\CILT_1012.mdb rpt_ITBS_math_4_nGE80 2011-12 Campus Data Packet
ALTERNATIVE SCHOOLS 58

FemaleMigrant MaleAt RiskWhite AfricanAmer
Hispanic EconDisadv
SpecialEduc
LEP All DistrictYearGrade Number Tested(All Students)
ITBS: MATHEMATICS COMPUTATIONITBS Math (4)
NUMBER AT OR ABOVE THE 80th PERCENTILE
3 0
* 2 1
7552011 * 1 2 2 0 0 3 633
8
1,2882009 0
8602010 1 2 2 0 0 3 793
0 44 19
0 0 0
1 59 19
9,5302011 2 3724 47 11 12 6360
10,0122009 0 00 0 0 0 00NumberTested
9,5192010 0 5028 54 16 17 7977
filler
July 29, 2011 Dallas ISD Evaluation & Accountability (Data Analysis, Research, and Reporting Services) V:\CILT\1112\CILT_1012.mdb rpt_ITBS_math_4_nGE80 2011-12 Campus Data Packet
ALTERNATIVE SCHOOLS 59

PercentageImprovedin 2011
PercentageImprovedin 2011
PercentageImprovedin 2011
PercentageImprovedin 2011
Level 1 in 2010 Level 2 in 2010 Level 3 in 2010 Levels 1-3 in 2010
NumberTested
Both Years
NumberTested
Both Years
GradeNumberTested
Both Years
NumberTested
Both Years
Woodcock-Muñoz Language Survey
PERCENTAGE DEMONSTRATING IMPROVEMENT
WMLS
17 0 - 100.0 0 - 1 100.0
18 1 0.0 100.0 0 - 2 50.0
19 0 - 100.0 0 - 1 100.0
3ALL 1 0.0 100.0 0 - 4 75.0
July 29, 2011 Dallas ISD Evaluation & Accountab ility (Data Analysis, Research, and Reporting Servi ces) V:\CILT\1112\CILT_1012.mdb rpt_W MLS 2011-12 Campus Data Packet
ALTERNATIVE SCHOOLS 60
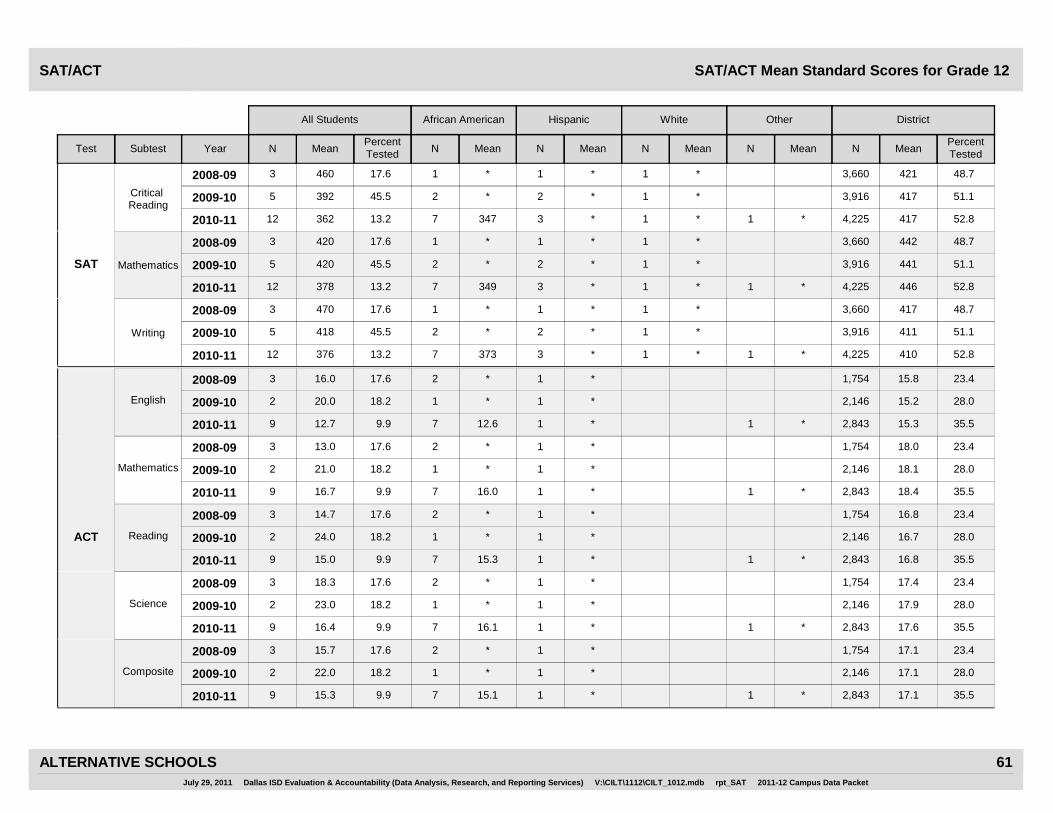
SAT/ACT Mean Standard Scores for Grade 12 SAT/ACT
All Students Hispanic White Other DistrictAfrican American
Subtest YearPercentTestedMeanN N Mean MeanNN MeanMeanN N MeanTest
PercentTested
English 2,146*1*120.02 18.2 15.2
1,754*1*216.03 17.6 15.8
2,843*1*112.6712.79 9.9 15.3
2008-09
2009-10
2010-11
28.0
23.4
35.5
Mathematics 2,146*1*121.02 18.2 18.1
1,754*1*213.03 17.6 18.0
2,843*1*116.0716.79 9.9 18.4
2008-09
2009-10
2010-11
28.0
23.4
35.5
ACT Reading 2,146*1*124.02 18.2 16.7
1,754*1*214.73 17.6 16.8
2,843*1*115.3715.09 9.9 16.8
2008-09
2009-10
2010-11
28.0
23.4
35.5
Science 2,146*1*123.02 18.2 17.9
1,754*1*218.33 17.6 17.4
2,843*1*116.1716.49 9.9 17.6
2008-09
2009-10
2010-11
28.0
23.4
35.5
Composite 2,146*1*122.02 18.2 17.1
1,754*1*215.73 17.6 17.1
2,843*1*115.1715.39 9.9 17.1
2008-09
2009-10
2010-11
28.0
23.4
35.5
4,225*1*1*3347736212 13.2 417
3,916*1*2*23925 45.5 417
3,660*1*1*14603 17.6 421
Critical Reading
2008-09
2009-10
2010-11 52.8
51.1
48.7
SAT
4,225*1*1*3349737812 13.2 446
3,916*1*2*24205 45.5 441
3,660*1*1*14203 17.6 442
Mathematics
2008-09
2009-10
2010-11 52.8
51.1
48.7
4,225*1*1*3373737612 13.2 410
3,916*1*2*24185 45.5 411
3,660*1*1*14703 17.6 417
Writing
2008-09
2009-10
2010-11 52.8
51.1
48.7
July 29, 2011 Dallas ISD Evaluation & Accountability (Data Analysis, Research, and Reporting Services) V:\CILT\1112\CILT_1012.mdb rpt_SAT 2011-12 Campus Data Packet
ALTERNATIVE SCHOOLS 61

PSAT Mean Standard ScoresPSAT
All White OtherAfrican American Hispanic District
Mean MeanNN MeanMeanN N MeanMean NNGrade Subtest Year
Critical Reading
*128.722 *128.317 30.51,21241 28.8
*128.625 030.822 29.21,31748 29.6
26.725 *129.326 0 35.14,66052 27.9
2008
2009
2010
Mathematics *133.522 *130.417 33.31,21241 32.4
*133.925 030.422 31.81,31748 32.0
9
30.825 *129.226 0 38.14,66052 29.9
2008
2009
2010
Writing *130.622 *125.117 30.71,21241 28.7
*128.625 025.322 29.71,31748 27.1
24.225 *129.426 0 33.64,66052 27.1
2008
2009
2010
Critical Reading
*331.228 031.319 33.13,91450 31.7
*129.513 027.917 32.53,67531 28.9
28.949 *233.044 0 35.89,11695 31.1
2008
2009
2010
Mathematics *335.828 032.419 36.33,91450 34.7
*131.313 031.817 35.83,67531 31.6
10
30.749 *236.244 0 39.19,11695 33.4
2008
2009
2010
Writing *331.428 029.619 33.03,91450 31.4
*131.513 028.917 33.73,67531 30.4
27.149 *232.744 0 33.89,11695 29.9
2008
2009
2010
Critical Reading *131.616 030.920 36.57,76737 32.1
036.012 *131.815 36.17,36628 33.6
30.039 *231.742 *1 37.67,86984 30.9
2008
2009
2010
Mathematics *136.316 033.120 40.27,76737 35.3
037.812 *132.915 39.17,36628 35.3
11
32.239 *235.442 *1 41.27,86984 34.0
2008
2009
2010
Writing *133.516 031.820 37.27,76737 33.4
036.812 *131.515 37.47,36628 34.1
31.339 *230.642 *1 36.57,86984 30.7
2008
2009
2010
July 29, 2011 Dallas ISD Evaluation & Accountability (Data Analysis, Research, and Reporting Services) V:\CILT\1112\CILT_1012.mdb rpt_PSAT 2011-12 Campus Data Packet
ALTERNATIVE SCHOOLS 62

2011 Advanced Placement ExamsAP
Dist School
Mean Score
DistSchool
% Passed
SchoolDistSchool
Exams Taken # Passed
Dist School
Mean Score
DistSchool
% Passed
SchoolDistSchool
Exams Taken # Passed
Dist School
Mean Score
DistSchool
% Passed
SchoolDistSchool
Exams Taken # Passed
2,593 *1 * 18.11.8
English Language & Composition
* 1,035 *1 * 63.53.0
Spanish Language
* 413 *1 * 31.72.0
Statistics
*
1,851 *2 * 8.41.4
United States History
* 830 *1 * 18.61.7
World History
*
July 29, 2011 Dallas ISD Evaluation & Accountability (Data Analysis, Research, and Reporting Services) V:\CILT\1112\CILT_1012.mdb rpt_AP 2011-12 Campus Data Packet
ALTERNATIVE SCHOOLS 63
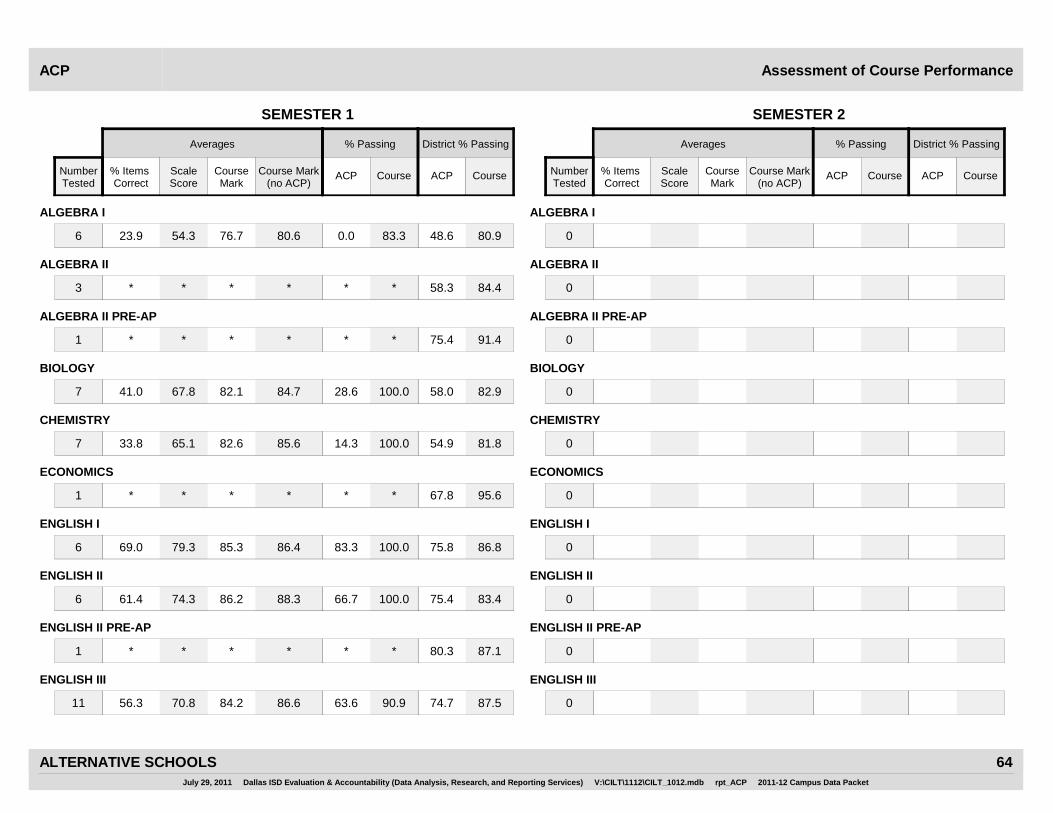
Course% Items Correct
CourseMark
ACP ACP
Averages % Passing District % Passing
Course Mark(no ACP)
ScaleScore
NumberTested
Course
Assessment of Course Performance
SEMESTER 1
ACP
Course% Items Correct
CourseMark
ACP ACP
Averages % Passing District % Passing
Course Mark(no ACP)
ScaleScore
NumberTested
Course
SEMESTER 2
ALGEBRA I ALGEBRA I
80.66 23.9 54.3 76.7 0.0 83.3 48.6 80.9 0
ALGEBRA II ALGEBRA II
*3 * * * * * 58.3 84.4 0
ALGEBRA II PRE-AP ALGEBRA II PRE-AP
*1 * * * * * 75.4 91.4 0
BIOLOGY BIOLOGY
84.77 41.0 67.8 82.1 28.6 100.0 58.0 82.9 0
CHEMISTRY CHEMISTRY
85.67 33.8 65.1 82.6 14.3 100.0 54.9 81.8 0
ECONOMICS ECONOMICS
*1 * * * * * 67.8 95.6 0
ENGLISH I ENGLISH I
86.46 69.0 79.3 85.3 83.3 100.0 75.8 86.8 0
ENGLISH II ENGLISH II
88.36 61.4 74.3 86.2 66.7 100.0 75.4 83.4 0
ENGLISH II PRE-AP ENGLISH II PRE-AP
*1 * * * * * 80.3 87.1 0
ENGLISH III ENGLISH III
86.611 56.3 70.8 84.2 63.6 90.9 74.7 87.5 0
July 29, 2011 Dallas ISD Evaluation & Accountability (Data Analysis, Research, and Reporting Services) V:\CILT\1112\CILT_1012.mdb rpt_ACP 2011-12 Campus Data Packet
ALTERNATIVE SCHOOLS 64

Course% Items Correct
CourseMark
ACP ACP
Averages % Passing District % Passing
Course Mark(no ACP)
ScaleScore
NumberTested
Course
Assessment of Course Performance
SEMESTER 1
ACP
Course% Items Correct
CourseMark
ACP ACP
Averages % Passing District % Passing
Course Mark(no ACP)
ScaleScore
NumberTested
Course
SEMESTER 2
ENGLISH IV ENGLISH IV
*4 * * * * * 79.6 92.7 0
ENVIRONMENTAL SYSTEMS ENVIRONMENTAL SYSTEMS
91.88 43.8 62.6 87.4 25.0 100.0 72.1 93.6 0
GEOMETRY GEOMETRY
83.28 44.2 64.4 80.4 37.5 87.5 61.8 83.0 0
GOVERNMENT GOVERNMENT
82.98 42.8 67.0 80.5 37.5 100.0 64.7 95.6 0
HEALTH EDUCATION HEALTH EDUCATION
*2 * * * * * 77.3 96.0 0
HEALTH I HEALTH I
*4 * * * * * 68.9 96.0 0
INTEGRATED PHYSICS & CHEMISTRY INTEGRATED PHYSICS & CHEMISTRY
95.76 39.1 61.1 90.5 16.7 100.0 47.2 84.6 0
LANGUAGE ARTS 7 LANGUAGE ARTS 7
74.063 50.4 70.2 73.7 49.2 65.1 63.5 88.7 71.186 53.1 68.7 70.9 57.0 64.0 78.9 89.4
LANGUAGE ARTS 8 LANGUAGE ARTS 8
69.988 49.0 66.0 69.5 43.2 56.8 72.2 86.0 69.593 46.3 68.4 69.4 48.4 55.9 75.3 86.9
MATHEMATICAL MODELS W/APPLICATIONS MATHEMATICAL MODELS W/APPLICATIONS
88.56 53.9 70.6 85.8 66.7 100.0 58.2 86.2 0
July 29, 2011 Dallas ISD Evaluation & Accountability (Data Analysis, Research, and Reporting Services) V:\CILT\1112\CILT_1012.mdb rpt_ACP 2011-12 Campus Data Packet
ALTERNATIVE SCHOOLS 65

Course% Items Correct
CourseMark
ACP ACP
Averages % Passing District % Passing
Course Mark(no ACP)
ScaleScore
NumberTested
Course
Assessment of Course Performance
SEMESTER 1
ACP
Course% Items Correct
CourseMark
ACP ACP
Averages % Passing District % Passing
Course Mark(no ACP)
ScaleScore
NumberTested
Course
SEMESTER 2
MATHEMATICS 7 MATHEMATICS 7
69.365 41.7 63.6 68.7 27.7 50.8 54.0 85.1 69.879 39.0 61.8 69.0 21.5 54.4 61.9 86.0
MATHEMATICS 8 MATHEMATICS 8
70.191 38.4 64.5 69.5 25.3 51.6 56.7 83.2 69.990 40.2 60.1 68.9 22.2 55.6 57.2 85.0
MS INTERMEDIATE LA FOR ESL MS INTERMEDIATE LA FOR ESL
0 *1 * * * * * 62.2 98.4
READING I READING I
*3 * * * * * 78.8 91.3 0
READING MASTERY 7 READING MASTERY 7
*1 * * * * * 69.0 89.6 0
READING MASTERY 8 READING MASTERY 8
80.68 61.6 76.0 80.1 62.5 75.0 72.3 87.1 0
SCIENCE 7 & SCIENCE 7 PRE-AP SCIENCE 7 & SCIENCE 7 PRE-AP
71.459 44.7 66.8 70.9 32.2 62.7 71.0 88.8 69.287 46.8 64.5 68.8 33.3 57.5 76.4 89.0
SCIENCE 8 & SCIENCE 8 PRE-AP SCIENCE 8 & SCIENCE 8 PRE-AP
72.794 36.0 63.1 71.8 20.2 64.9 65.7 89.3 73.296 44.8 63.2 72.2 34.4 74.0 74.9 91.6
TEXAS STUDIES 7 TEXAS STUDIES 7
70.661 42.8 64.2 70.0 24.6 59.0 55.3 87.7 68.582 40.1 65.5 68.2 25.6 50.0 63.4 87.1
U.S. HISTORY U.S. HISTORY
84.610 43.6 63.2 81.4 30.0 90.0 69.4 91.7 0
July 29, 2011 Dallas ISD Evaluation & Accountability (Data Analysis, Research, and Reporting Services) V:\CILT\1112\CILT_1012.mdb rpt_ACP 2011-12 Campus Data Packet
ALTERNATIVE SCHOOLS 66
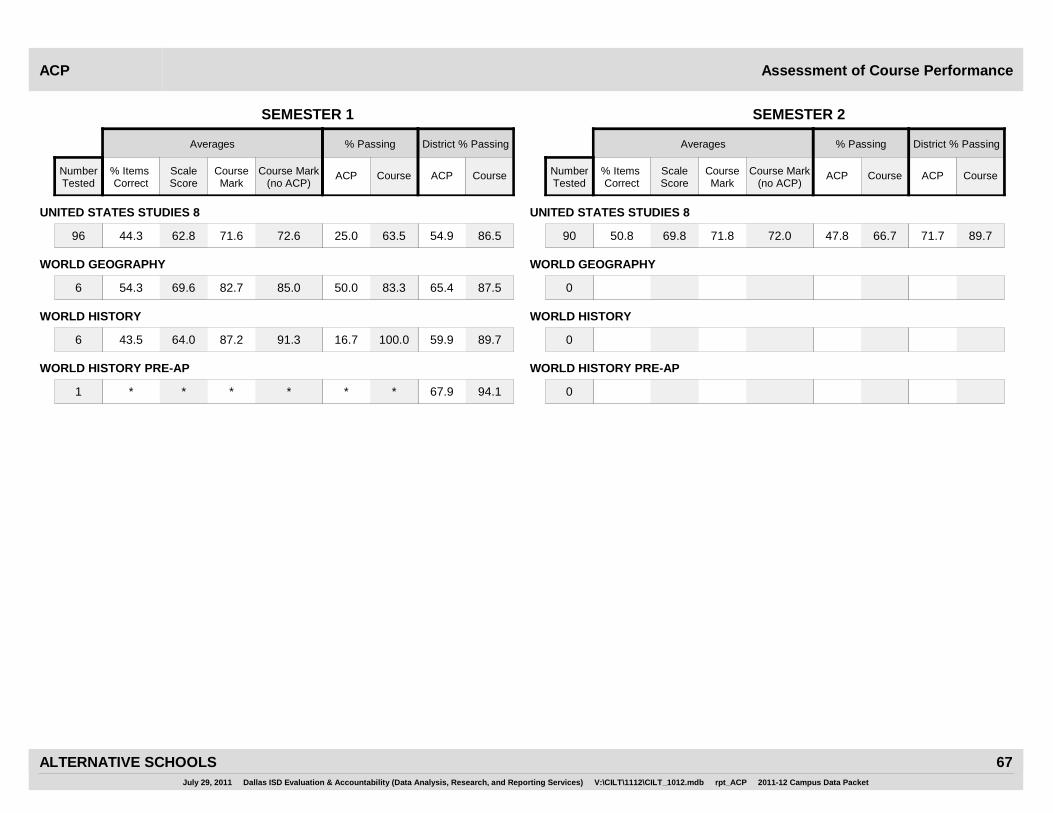
Course% Items Correct
CourseMark
ACP ACP
Averages % Passing District % Passing
Course Mark(no ACP)
ScaleScore
NumberTested
Course
Assessment of Course Performance
SEMESTER 1
ACP
Course% Items Correct
CourseMark
ACP ACP
Averages % Passing District % Passing
Course Mark(no ACP)
ScaleScore
NumberTested
Course
SEMESTER 2
UNITED STATES STUDIES 8 UNITED STATES STUDIES 8
72.696 44.3 62.8 71.6 25.0 63.5 54.9 86.5 72.090 50.8 69.8 71.8 47.8 66.7 71.7 89.7
WORLD GEOGRAPHY WORLD GEOGRAPHY
85.06 54.3 69.6 82.7 50.0 83.3 65.4 87.5 0
WORLD HISTORY WORLD HISTORY
91.36 43.5 64.0 87.2 16.7 100.0 59.9 89.7 0
WORLD HISTORY PRE-AP WORLD HISTORY PRE-AP
*1 * * * * * 67.9 94.1 0
July 29, 2011 Dallas ISD Evaluation & Accountability (Data Analysis, Research, and Reporting Services) V:\CILT\1112\CILT_1012.mdb rpt_ACP 2011-12 Campus Data Packet
ALTERNATIVE SCHOOLS 67