alternative investments: risks & returns
TRANSCRIPT
29 South Pleasant St, Amherst, MA 01002Tel: 413-253-4601
Alternative Investments: Risks & Returns
Hossein Kazemi, PhD, CFAManaging Partner, AIAProfessor of Finance, Univ of [email protected]
THE FAMILY ALTERNATIVE INVESTMENT CONFERENCEFebruary 2007, Monaco
2
Outline
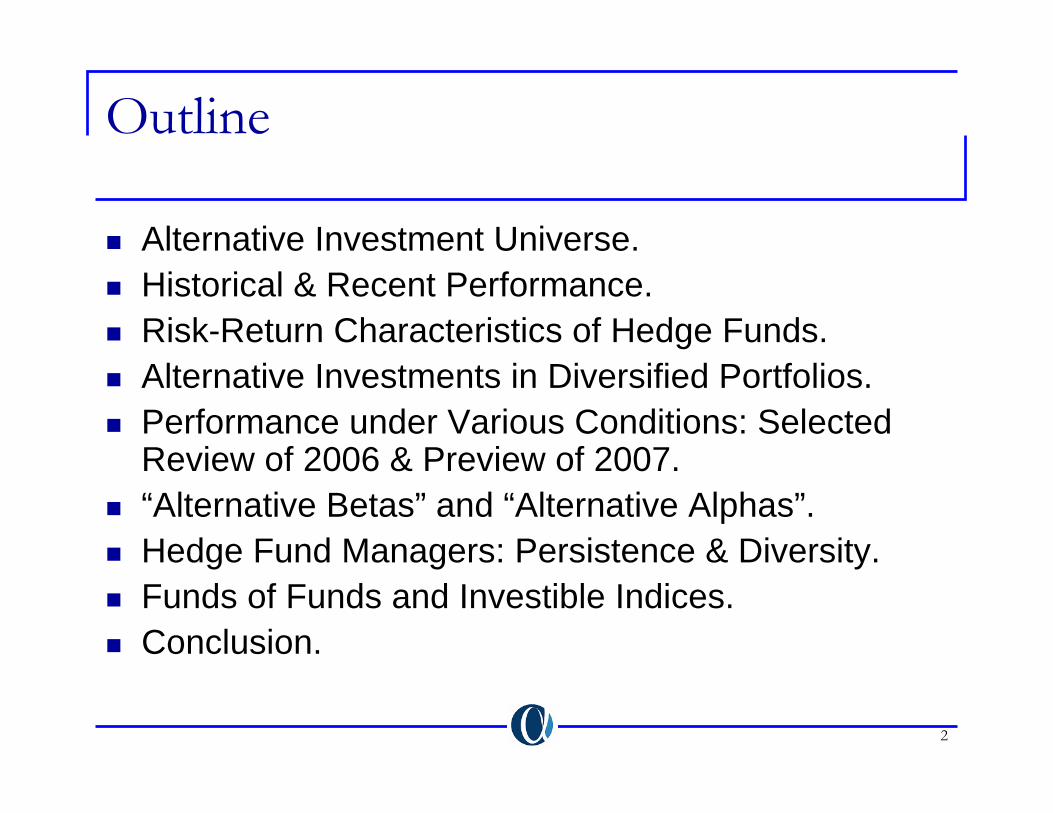
Alternative Investment Universe.Historical & Recent Performance.Risk-Return Characteristics of Hedge Funds.Alternative Investments in Diversified Portfolios.Performance under Various Conditions: Selected Review of 2006 & Preview of 2007.“Alternative Betas” and “Alternative Alphas”.Hedge Fund Managers: Persistence & Diversity.Funds of Funds and Investible Indices.Conclusion.
3
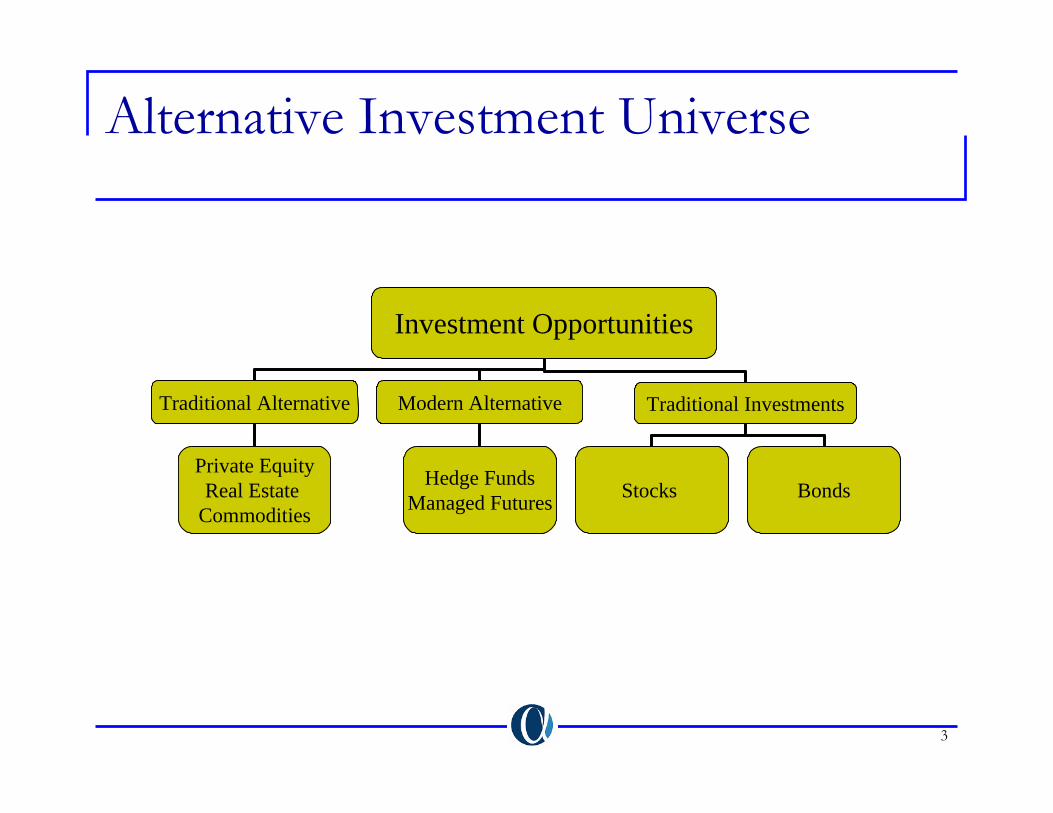
Alternative Investment Universe
Investment Opportunities
Traditional Alternative Modern Alternative Traditional Investments
Stocks BondsHedge FundsManaged Futures
Private EquityReal Estate
Commodities
Investment Opportunities
Traditional Alternative Modern Alternative Traditional Investments
Stocks BondsHedge FundsManaged Futures
Private EquityReal Estate
Commodities
4
Why Alternatives?
Alternative Sources of ReturnAccess to broader set of asset classes (e.g., private equity, real estate, commodities).Access to broader set of trading strategies (hedge funds, CTAs).
Diversifying risk of portfolios dominated by traditional assets.Enhancing the performance of portfolios dominated by traditional assets.
5
Traditional Assets: 90-06
50
100
150
200
250
300
350
400
450
500
Jan-
90
Jan-
91
Jan-
92
Jan-
93
Jan-
94
Jan-
95
Jan-
96
Jan-
97
Jan-
98
Jan-
99
Jan-
00
Jan-
01
Jan-
02
Jan-
03
Jan-
04
Jan-
05
Jan-
06
Hi Yld Global MSCI World Lehman Global
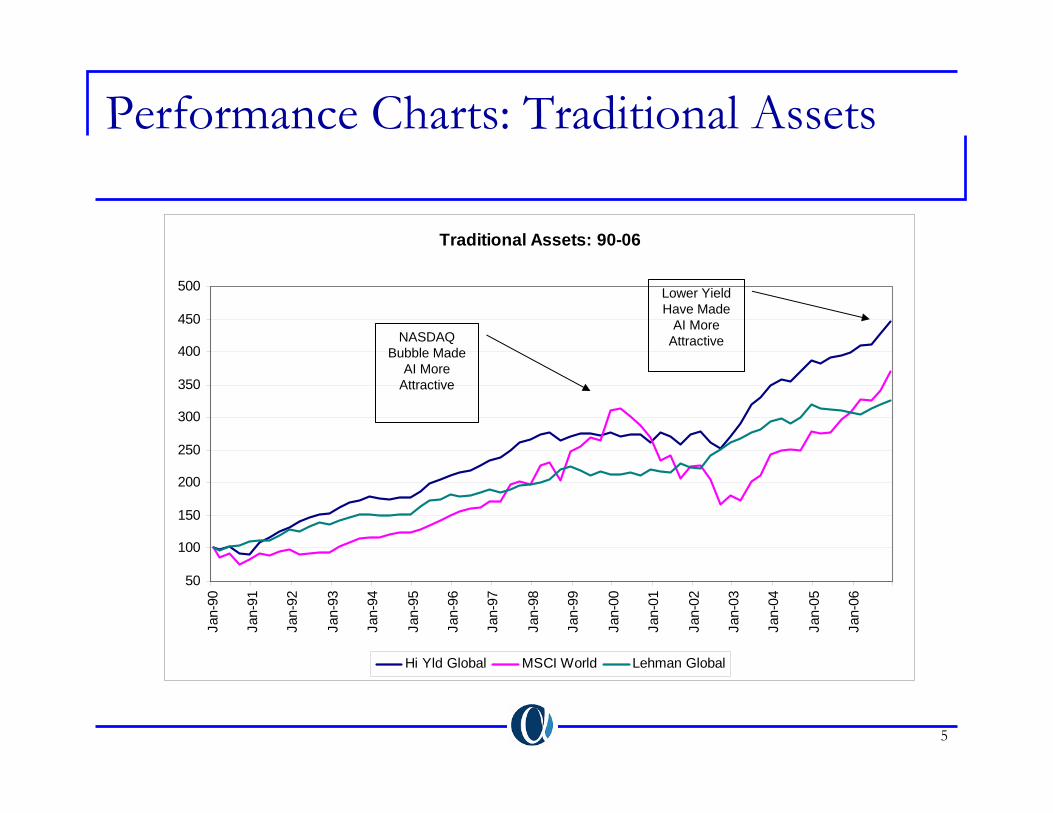
Performance Charts: Traditional Assets
NASDAQ Bubble Made
AI More Attractive
Lower Yield Have Made
AI More Attractive
6
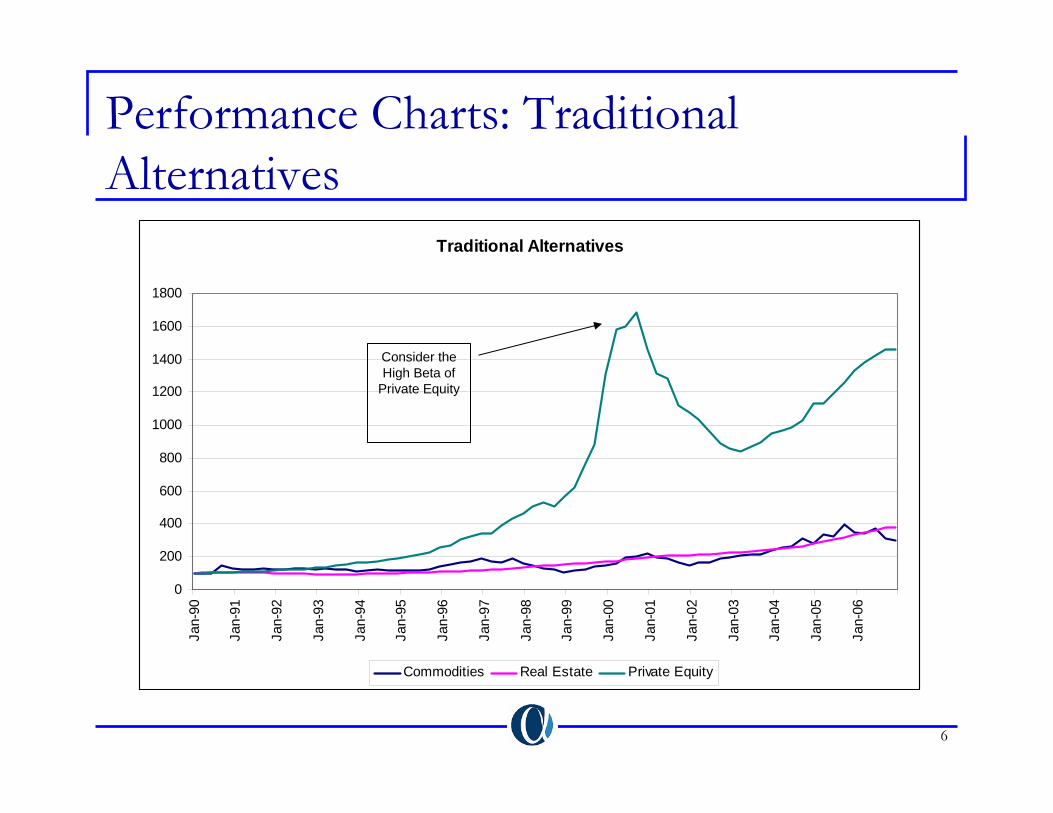
Performance Charts: Traditional Alternatives
Traditional Alternatives
0
200
400
600
800
1000
1200
1400
1600
1800
Jan-
90
Jan-
91
Jan-
92
Jan-
93
Jan-
94
Jan-
95
Jan-
96
Jan-
97
Jan-
98
Jan-
99
Jan-
00
Jan-
01
Jan-
02
Jan-
03
Jan-
04
Jan-
05
Jan-
06
Commodities Real Estate Private Equity
Consider the High Beta of
Private Equity
7
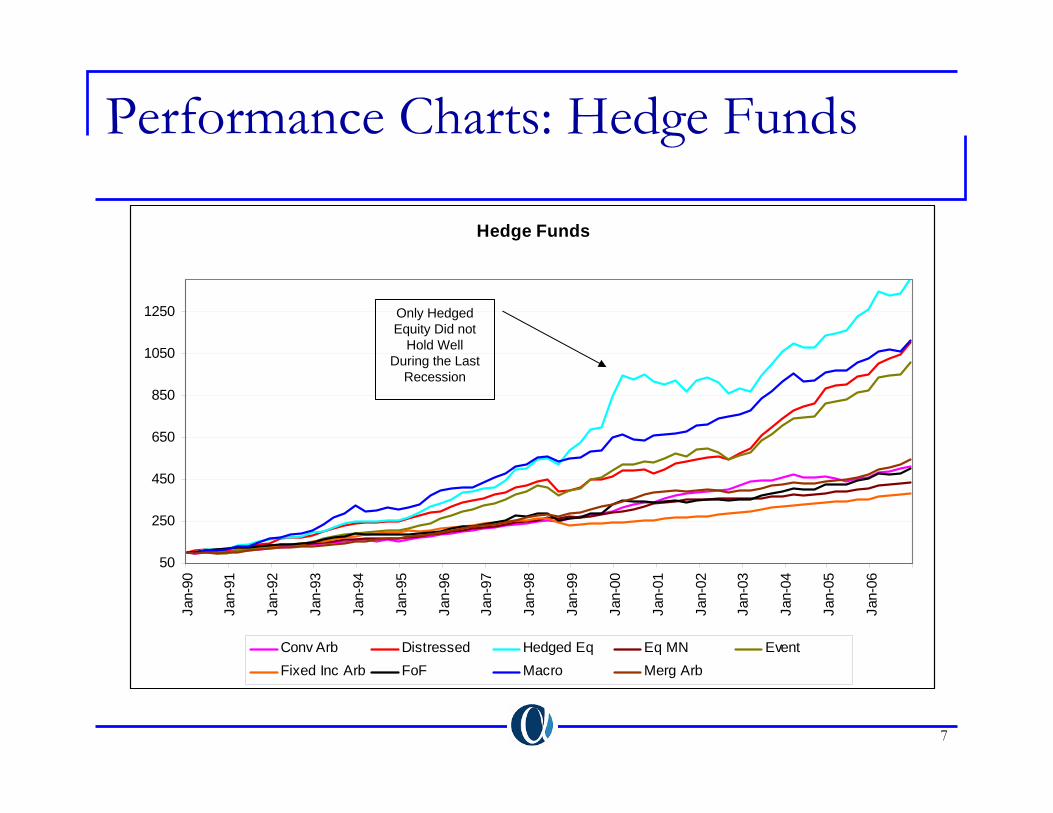
Performance Charts: Hedge Funds
Hedge Funds
50
250
450
650
850
1050
1250
Jan-
90
Jan-
91
Jan-
92
Jan-
93
Jan-
94
Jan-
95
Jan-
96
Jan-
97
Jan-
98
Jan-
99
Jan-
00
Jan-
01
Jan-
02
Jan-
03
Jan-
04
Jan-
05
Jan-
06
Conv Arb Distressed Hedged Eq Eq MN EventFixed Inc Arb FoF Macro Merg Arb
Only Hedged Equity Did not
Hold Well During the Last
Recession
8
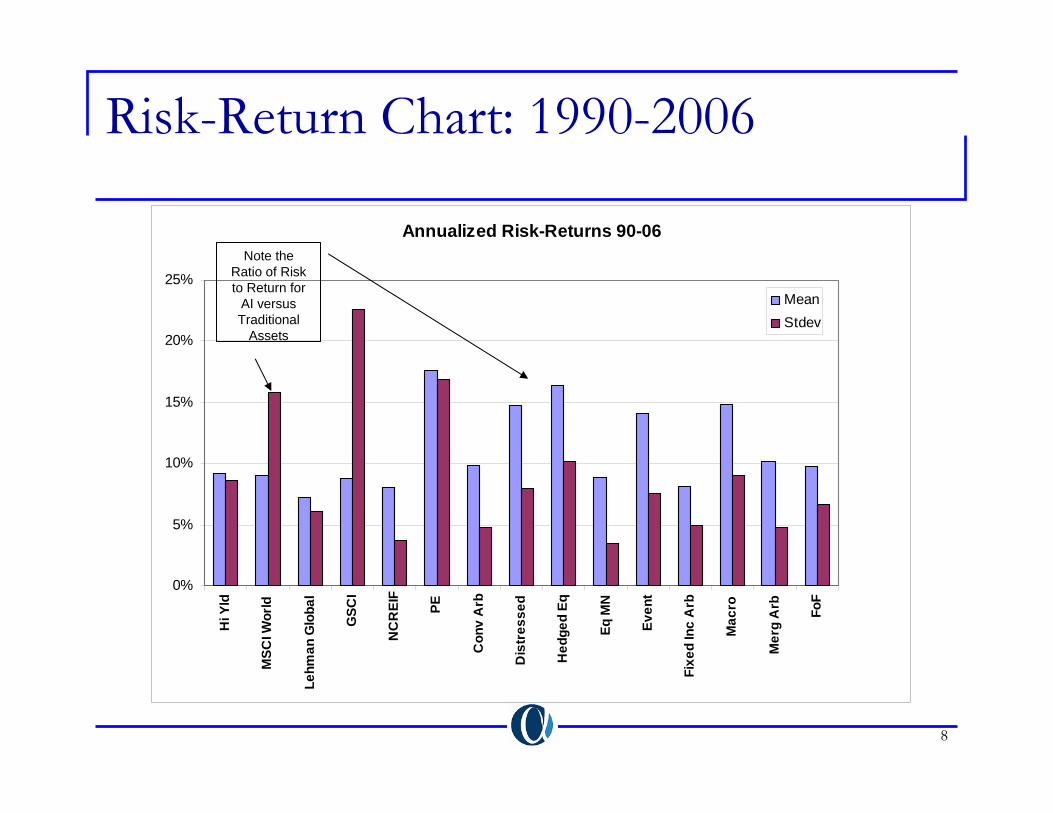
Risk-Return Chart: 1990-2006
Annualized Risk-Returns 90-06
0%
5%
10%
15%
20%
25%
Hi Y
ld
MSC
I Wor
ld
Lehm
an G
loba
l
GSC
I
NC
REI
F
PE
Con
v A
rb
Dis
tres
sed
Hed
ged
Eq
Eq M
N
Even
t
Fixe
d In
c A
rb
Mac
ro
Mer
g A
rb FoF
MeanStdev
Note the Ratio of Risk to Return for
AI versus Traditional
Assets
9
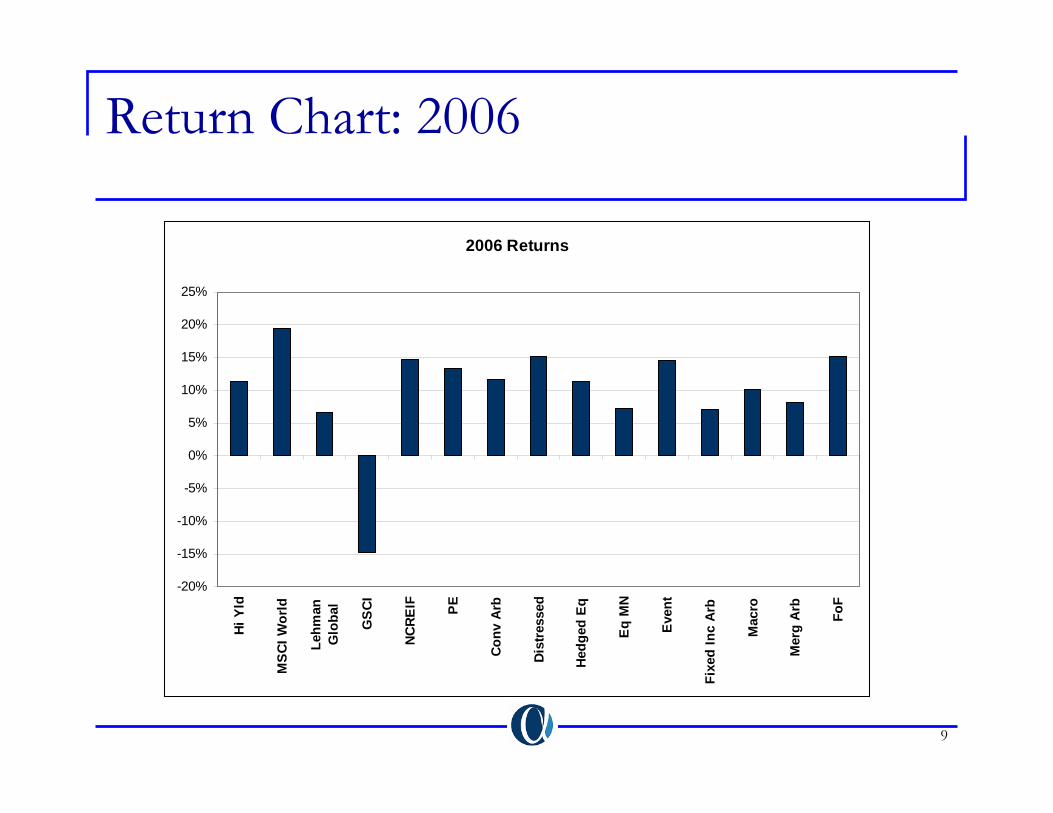
Return Chart: 2006
2006 Returns
-20%
-15%
-10%
-5%
0%
5%
10%
15%
20%
25%
Hi Y
ld
MSC
I Wor
ld
Lehm
anG
loba
l
GS
CI
NCRE
IF PE
Conv
Arb
Dist
ress
ed
Hed
ged
Eq
Eq
MN
Even
t
Fixe
d In
c Ar
b
Mac
ro
Mer
g A
rb
FoF
10
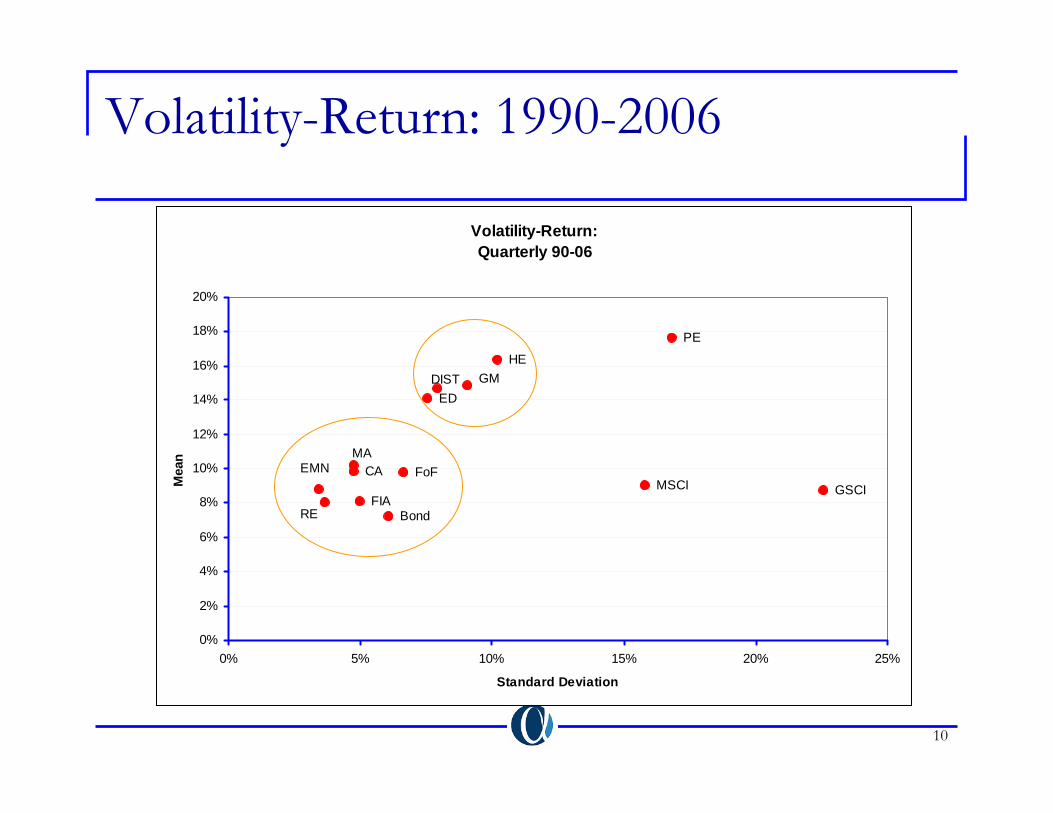
Volatility-Return: 1990-2006
Volatility-Return:Quarterly 90-06
GSCI
RE
PE
CA
DISTHE
EMN
ED
FIA
FoF
GM
MA
MSCI
Bond
0%
2%
4%
6%
8%
10%
12%
14%
16%
18%
20%
0% 5% 10% 15% 20% 25%
Standard Deviation
Mea
n
11
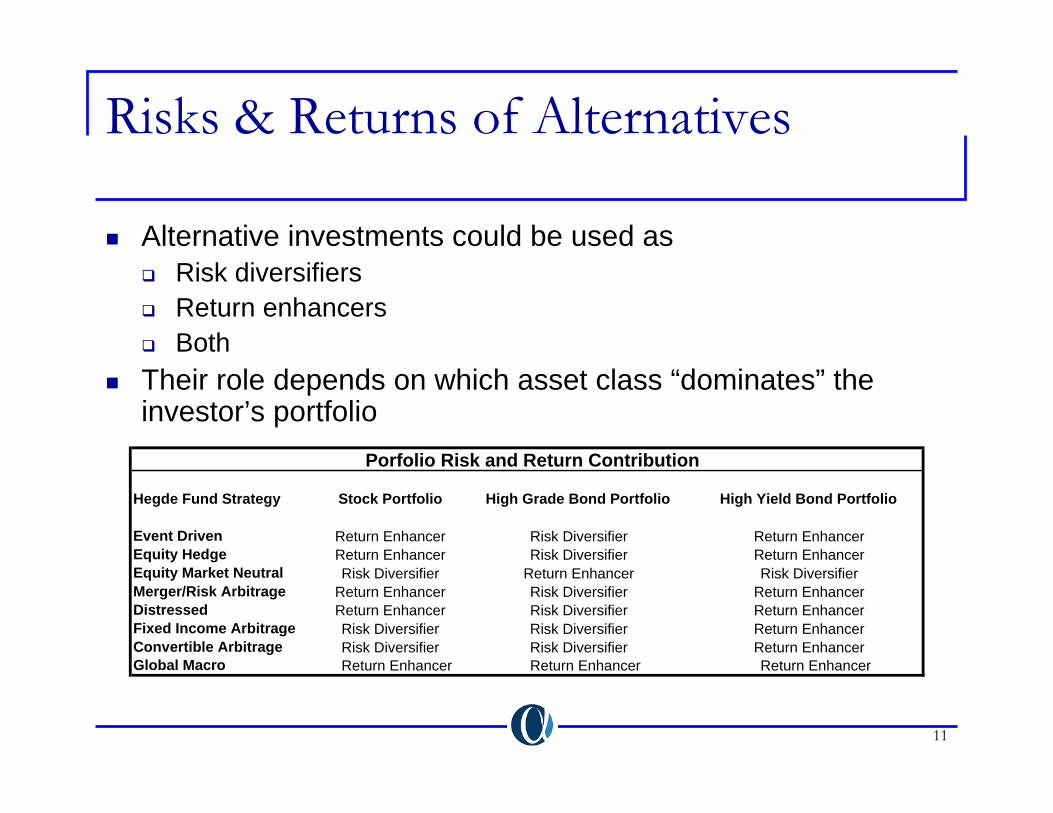
Risks & Returns of Alternatives
Alternative investments could be used asRisk diversifiersReturn enhancersBoth
Their role depends on which asset class “dominates” the investor’s portfolio
Hegde Fund Strategy Stock Portfolio High Grade Bond Portfolio High Yield Bond Portfolio
Event Driven Return Enhancer Risk Diversifier Return EnhancerEquity Hedge Return Enhancer Risk Diversifier Return EnhancerEquity Market Neutral Risk Diversifier Return Enhancer Risk DiversifierMerger/Risk Arbitrage Return Enhancer Risk Diversifier Return EnhancerDistressed Return Enhancer Risk Diversifier Return EnhancerFixed Income Arbitrage Risk Diversifier Risk Diversifier Return EnhancerConvertible Arbitrage Risk Diversifier Risk Diversifier Return EnhancerGlobal Macro Return Enhancer Return Enhancer Return Enhancer
Porfolio Risk and Return Contribution
12
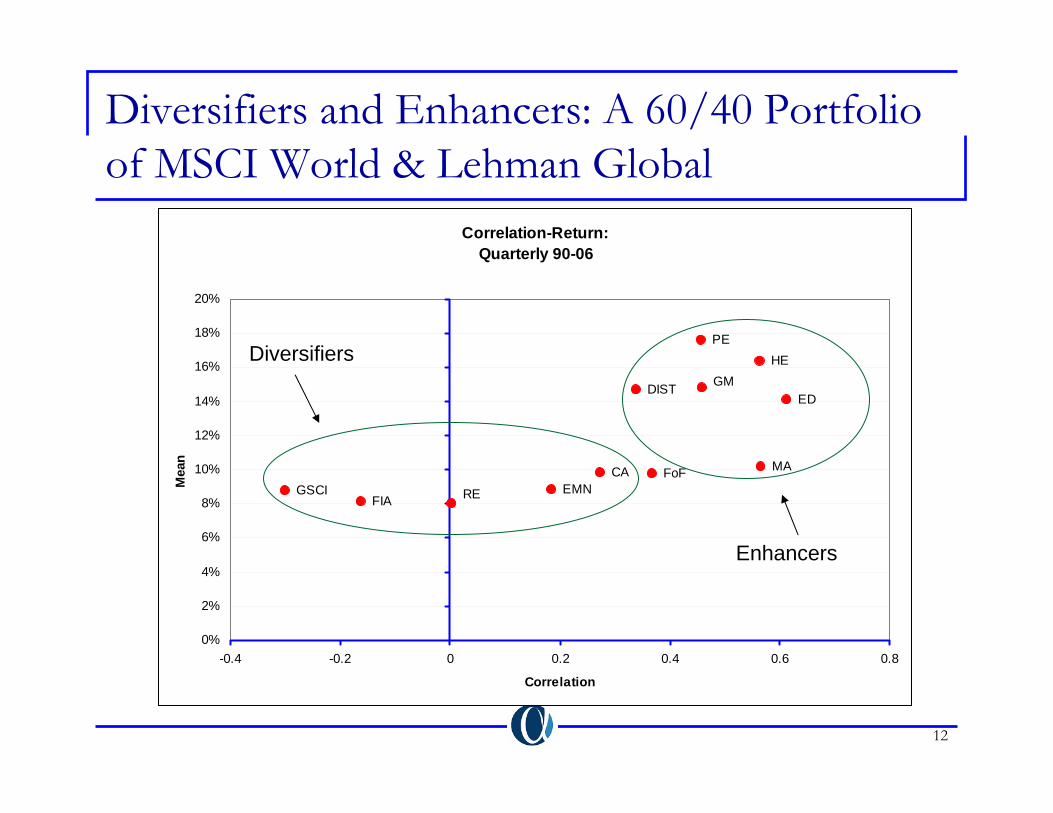
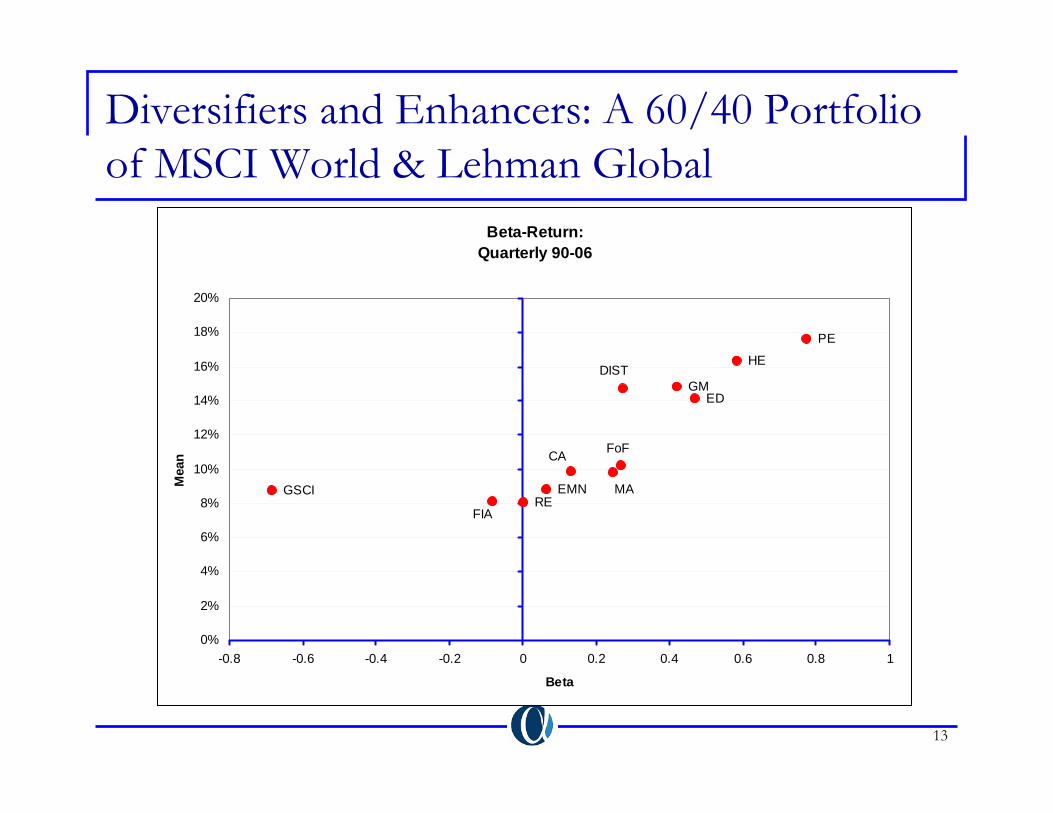
Diversifiers and Enhancers: A 60/40 Portfolio of MSCI World & Lehman Global
Correlation-Return:Quarterly 90-06
MA
GM
FoF
FIA
ED
EMN
HE
DIST
CA
PE
REGSCI
0%
2%
4%
6%
8%
10%
12%
14%
16%
18%
20%
-0.4 -0.2 0 0.2 0.4 0.6 0.8
Correlation
Mea
n
Enhancers
Diversifiers
13
Diversifiers and Enhancers: A 60/40 Portfolio of MSCI World & Lehman Global
Beta-Return:Quarterly 90-06
MA
GM
FoF
FIA
ED
EMN
HEDIST
CA
PE
REGSCI
0%
2%
4%
6%
8%
10%
12%
14%
16%
18%
20%
-0.8 -0.6 -0.4 -0.2 0 0.2 0.4 0.6 0.8 1
Beta
Mea
n
14
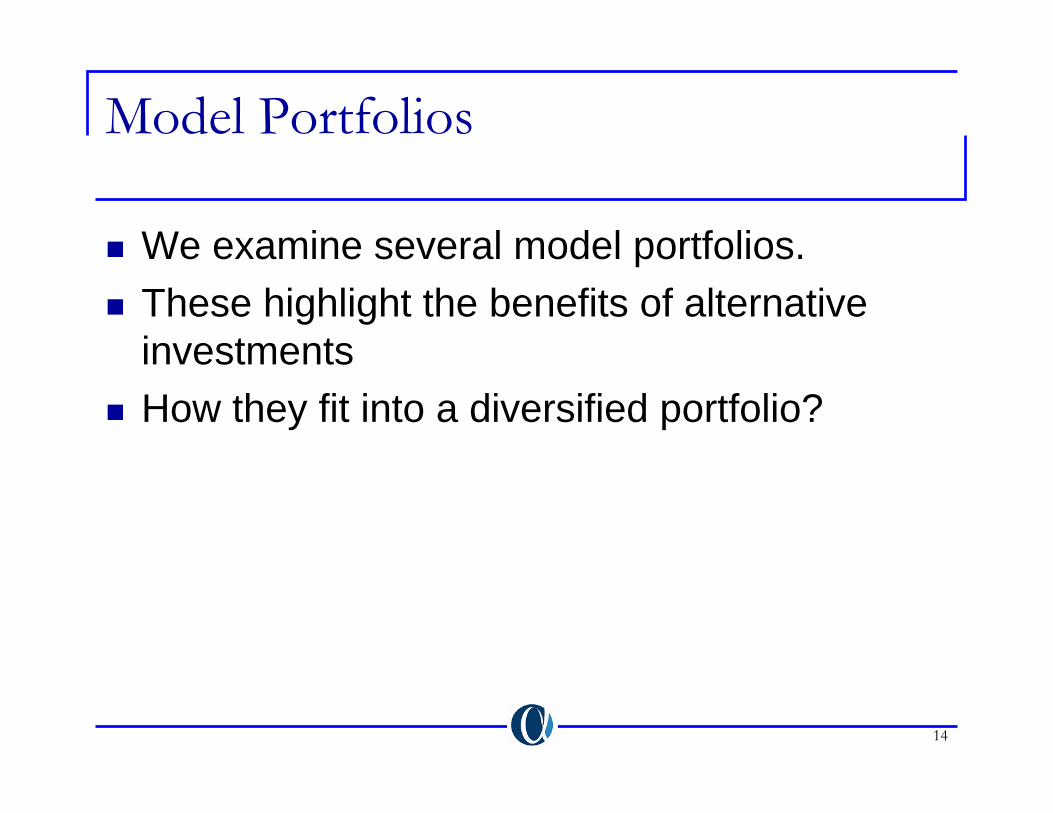
Model Portfolios
We examine several model portfolios.These highlight the benefits of alternative investmentsHow they fit into a diversified portfolio?
15
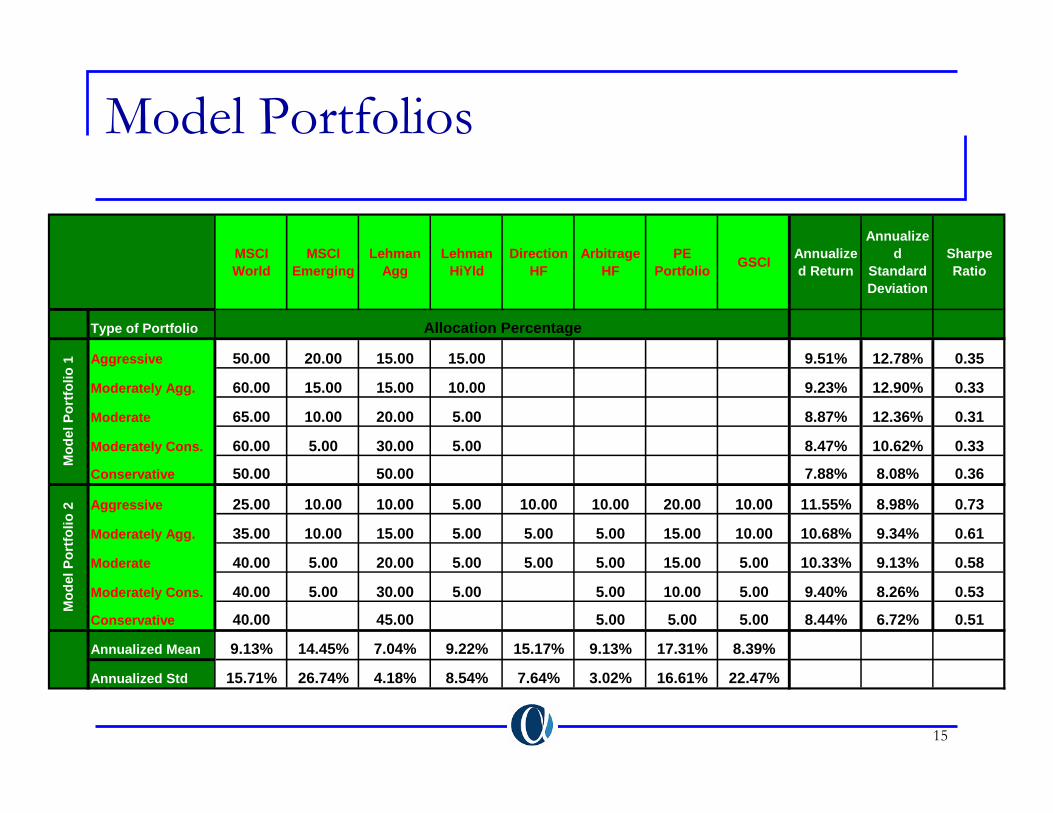
Model Portfolios
MSCI World
MSCI Emerging
Lehman Agg
Lehman HiYld
Direction HF
Arbitrage HF
PE Portfolio GSCI Annualize
d Return
Annualized
Standard Deviation
Sharpe Ratio
Type of Portfolio
Aggressive 50.00 20.00 15.00 15.00 0.00 0.00 0.00 0.00 9.51% 12.78% 0.35
Moderately Agg. 60.00 15.00 15.00 10.00 0.00 0.00 0.00 0.00 9.23% 12.90% 0.33
Moderate 65.00 10.00 20.00 5.00 0.00 0.00 0.00 0.00 8.87% 12.36% 0.31
Moderately Cons. 60.00 5.00 30.00 5.00 0.00 0.00 0.00 0.00 8.47% 10.62% 0.33
Conservative 50.00 0.00 50.00 0.00 0.00 0.00 0.00 0.00 7.88% 8.08% 0.36
Aggressive 25.00 10.00 10.00 5.00 10.00 10.00 20.00 10.00 11.55% 8.98% 0.73
Moderately Agg. 35.00 10.00 15.00 5.00 5.00 5.00 15.00 10.00 10.68% 9.34% 0.61
Moderate 40.00 5.00 20.00 5.00 5.00 5.00 15.00 5.00 10.33% 9.13% 0.58
Moderately Cons. 40.00 5.00 30.00 5.00 0.00 5.00 10.00 5.00 9.40% 8.26% 0.53
Conservative 40.00 0.00 45.00 0.00 0.00 5.00 5.00 5.00 8.44% 6.72% 0.51
Annualized Mean 9.13% 14.45% 7.04% 9.22% 15.17% 9.13% 17.31% 8.39%
Annualized Std 15.71% 26.74% 4.18% 8.54% 7.64% 3.02% 16.61% 22.47%
Allocation Percentage
Mod
el P
ortfo
lio 2
Mod
el P
ortfo
lio 1
16
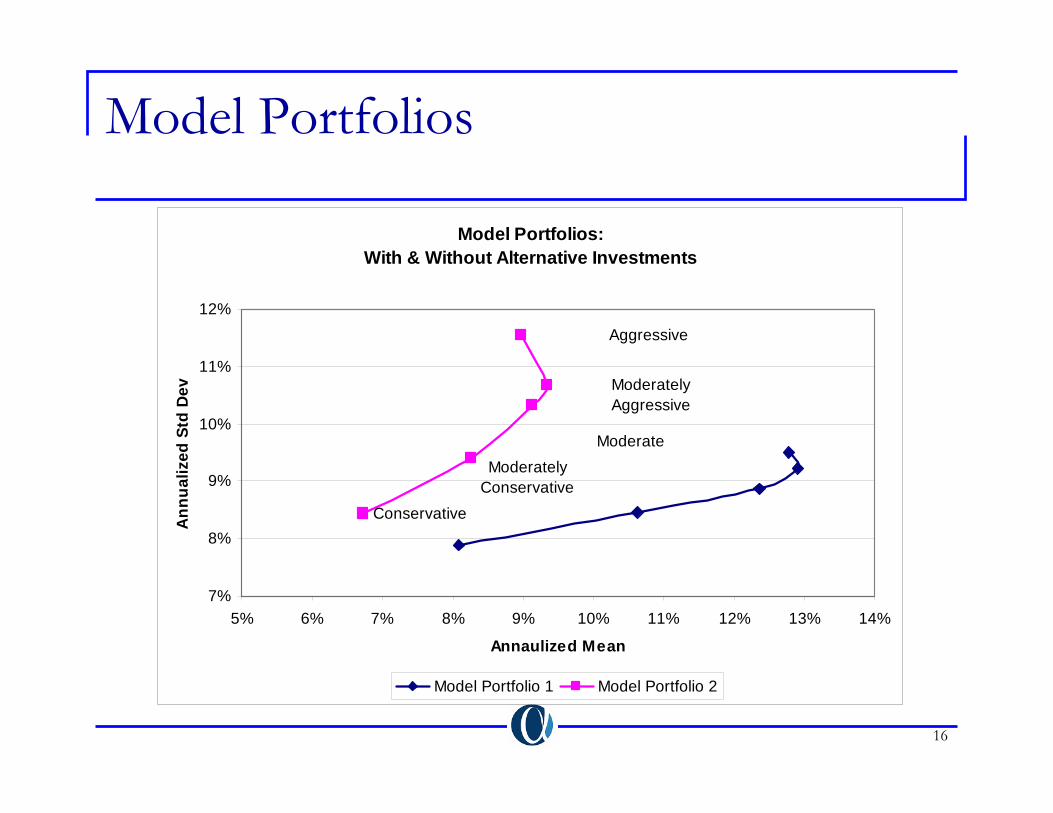
Model Portfolios
Model Portfolios: With & Without Alternative Investments
Conservative
Moderately Conservative
Moderate
Moderately Aggressive
Aggressive
7%
8%
9%
10%
11%
12%
5% 6% 7% 8% 9% 10% 11% 12% 13% 14%
Annaulized Mean
Ann
ualiz
ed S
td D
ev
Model Portfolio 1 Model Portfolio 2
17
AI and Economic Conditions
Here we look at performance of AI under various economic conditions. Economic conditions are “measured” by various indicators (yield curve, volatility, etc.)We look both at contemporaneous and leading indicators of AI performance.This leads us to have a selected review of 2006 and a preview of 2007.More charts are available upon request.
18
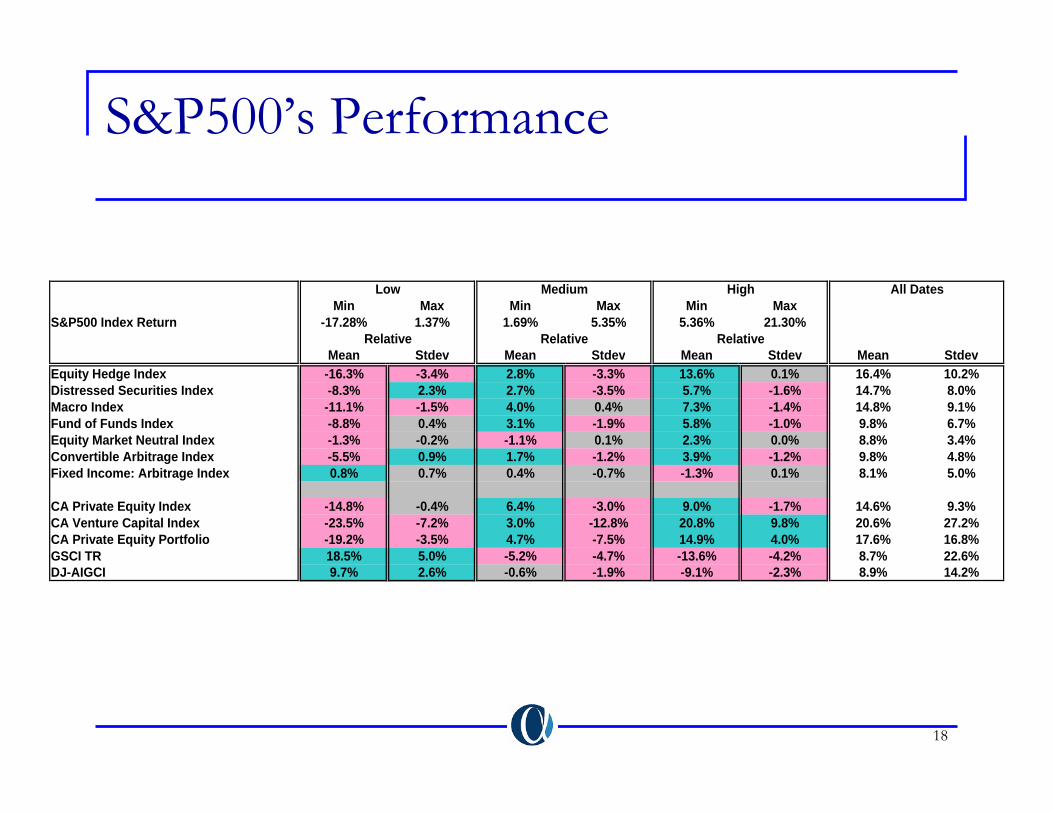
S&P500’s Performance
Min Max Min Max Min MaxS&P500 Index Return -17.28% 1.37% 1.69% 5.35% 5.36% 21.30%
Mean Stdev Mean Stdev Mean Stdev Mean StdevEquity Hedge Index -16.3% -3.4% 2.8% -3.3% 13.6% 0.1% 16.4% 10.2%Distressed Securities Index -8.3% 2.3% 2.7% -3.5% 5.7% -1.6% 14.7% 8.0%Macro Index -11.1% -1.5% 4.0% 0.4% 7.3% -1.4% 14.8% 9.1%Fund of Funds Index -8.8% 0.4% 3.1% -1.9% 5.8% -1.0% 9.8% 6.7%Equity Market Neutral Index -1.3% -0.2% -1.1% 0.1% 2.3% 0.0% 8.8% 3.4%Convertible Arbitrage Index -5.5% 0.9% 1.7% -1.2% 3.9% -1.2% 9.8% 4.8%Fixed Income: Arbitrage Index 0.8% 0.7% 0.4% -0.7% -1.3% 0.1% 8.1% 5.0%
CA Private Equity Index -14.8% -0.4% 6.4% -3.0% 9.0% -1.7% 14.6% 9.3%CA Venture Capital Index -23.5% -7.2% 3.0% -12.8% 20.8% 9.8% 20.6% 27.2%CA Private Equity Portfolio -19.2% -3.5% 4.7% -7.5% 14.9% 4.0% 17.6% 16.8%GSCI TR 18.5% 5.0% -5.2% -4.7% -13.6% -4.2% 8.7% 22.6%DJ-AIGCI 9.7% 2.6% -0.6% -1.9% -9.1% -2.3% 8.9% 14.2%
All Dates
Relative Relative Relative
Low Medium High
19
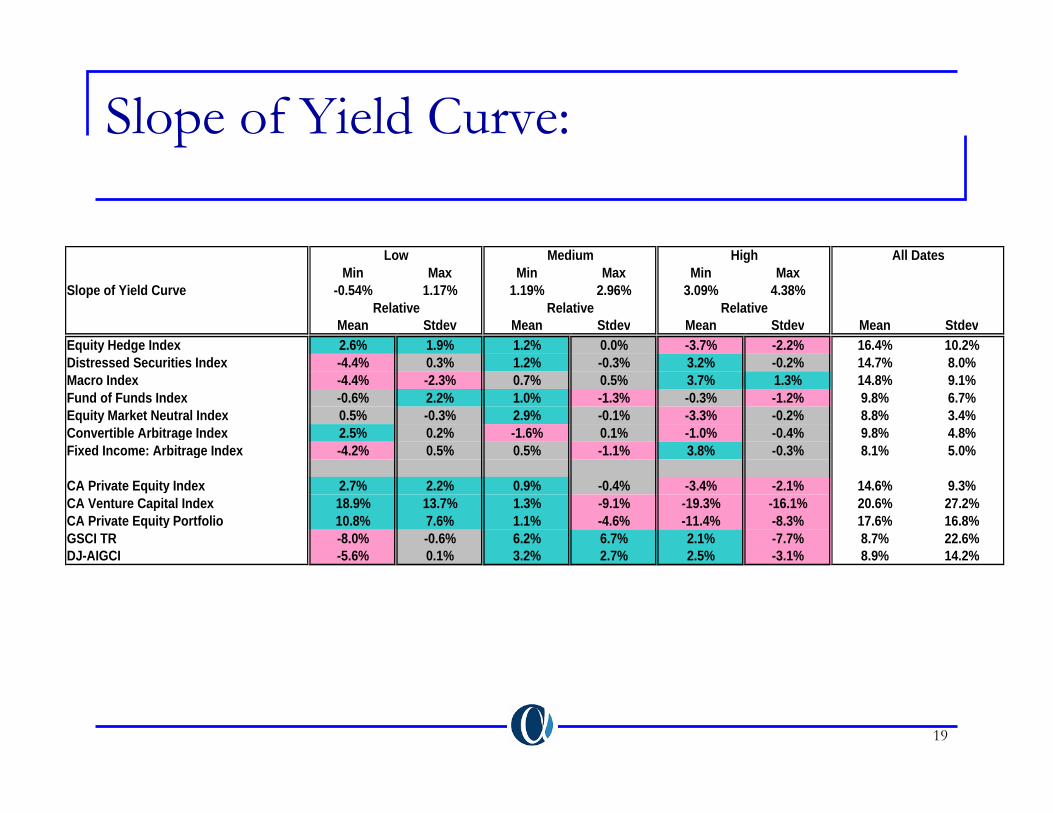
Slope of Yield Curve:
Min Max Min Max Min MaxSlope of Yield Curve -0.54% 1.17% 1.19% 2.96% 3.09% 4.38%
Mean Stdev Mean Stdev Mean Stdev Mean StdevEquity Hedge Index 2.6% 1.9% 1.2% 0.0% -3.7% -2.2% 16.4% 10.2%Distressed Securities Index -4.4% 0.3% 1.2% -0.3% 3.2% -0.2% 14.7% 8.0%Macro Index -4.4% -2.3% 0.7% 0.5% 3.7% 1.3% 14.8% 9.1%Fund of Funds Index -0.6% 2.2% 1.0% -1.3% -0.3% -1.2% 9.8% 6.7%Equity Market Neutral Index 0.5% -0.3% 2.9% -0.1% -3.3% -0.2% 8.8% 3.4%Convertible Arbitrage Index 2.5% 0.2% -1.6% 0.1% -1.0% -0.4% 9.8% 4.8%Fixed Income: Arbitrage Index -4.2% 0.5% 0.5% -1.1% 3.8% -0.3% 8.1% 5.0%
CA Private Equity Index 2.7% 2.2% 0.9% -0.4% -3.4% -2.1% 14.6% 9.3%CA Venture Capital Index 18.9% 13.7% 1.3% -9.1% -19.3% -16.1% 20.6% 27.2%CA Private Equity Portfolio 10.8% 7.6% 1.1% -4.6% -11.4% -8.3% 17.6% 16.8%GSCI TR -8.0% -0.6% 6.2% 6.7% 2.1% -7.7% 8.7% 22.6%DJ-AIGCI -5.6% 0.1% 3.2% 2.7% 2.5% -3.1% 8.9% 14.2%
All Dates
Relative Relative Relative
Low Medium High
20
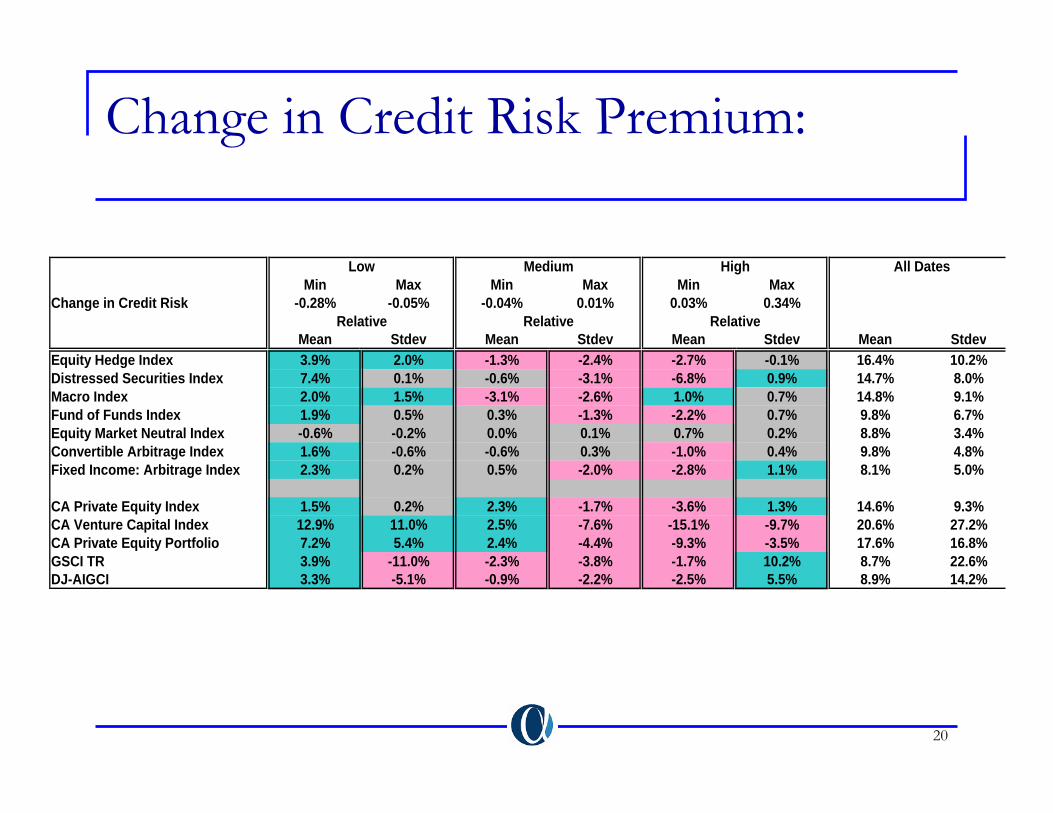
Change in Credit Risk Premium:
Min Max Min Max Min MaxChange in Credit Risk -0.28% -0.05% -0.04% 0.01% 0.03% 0.34%
Mean Stdev Mean Stdev Mean Stdev Mean StdevEquity Hedge Index 3.9% 2.0% -1.3% -2.4% -2.7% -0.1% 16.4% 10.2%Distressed Securities Index 7.4% 0.1% -0.6% -3.1% -6.8% 0.9% 14.7% 8.0%Macro Index 2.0% 1.5% -3.1% -2.6% 1.0% 0.7% 14.8% 9.1%Fund of Funds Index 1.9% 0.5% 0.3% -1.3% -2.2% 0.7% 9.8% 6.7%Equity Market Neutral Index -0.6% -0.2% 0.0% 0.1% 0.7% 0.2% 8.8% 3.4%Convertible Arbitrage Index 1.6% -0.6% -0.6% 0.3% -1.0% 0.4% 9.8% 4.8%Fixed Income: Arbitrage Index 2.3% 0.2% 0.5% -2.0% -2.8% 1.1% 8.1% 5.0%
CA Private Equity Index 1.5% 0.2% 2.3% -1.7% -3.6% 1.3% 14.6% 9.3%CA Venture Capital Index 12.9% 11.0% 2.5% -7.6% -15.1% -9.7% 20.6% 27.2%CA Private Equity Portfolio 7.2% 5.4% 2.4% -4.4% -9.3% -3.5% 17.6% 16.8%GSCI TR 3.9% -11.0% -2.3% -3.8% -1.7% 10.2% 8.7% 22.6%DJ-AIGCI 3.3% -5.1% -0.9% -2.2% -2.5% 5.5% 8.9% 14.2%
All Dates
Relative Relative Relative
Low Medium High
21
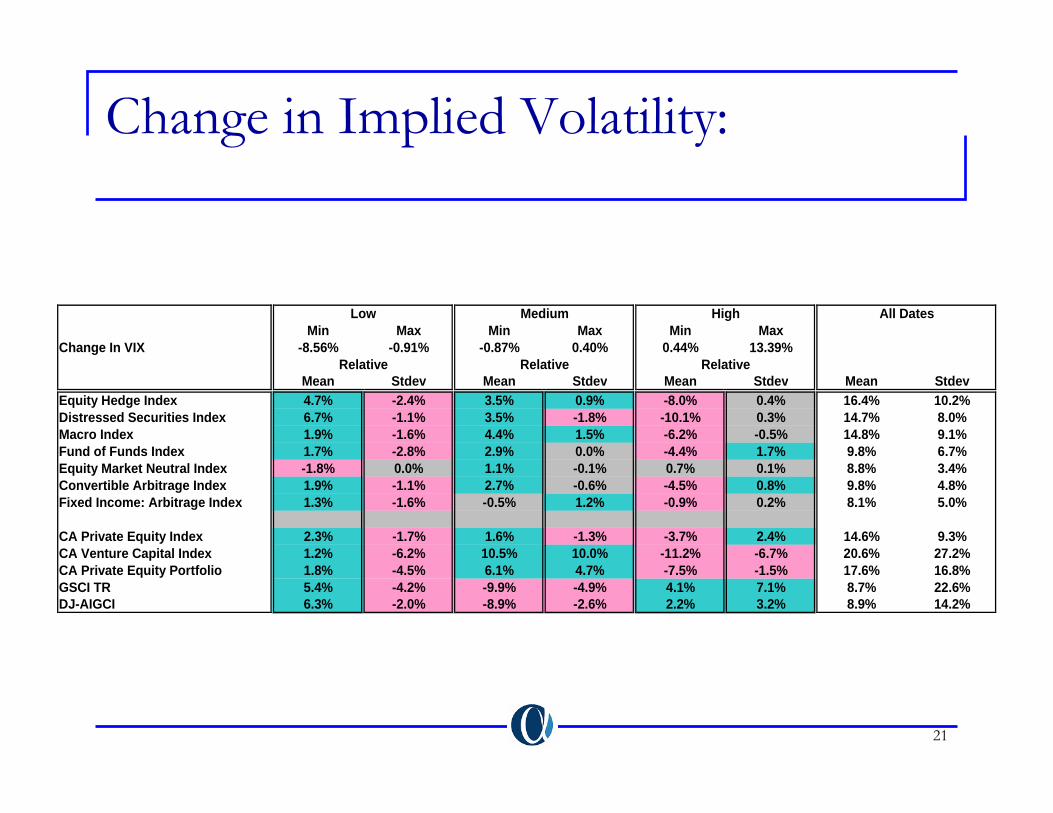
Change in Implied Volatility:
Min Max Min Max Min MaxChange In VIX -8.56% -0.91% -0.87% 0.40% 0.44% 13.39%
Mean Stdev Mean Stdev Mean Stdev Mean StdevEquity Hedge Index 4.7% -2.4% 3.5% 0.9% -8.0% 0.4% 16.4% 10.2%Distressed Securities Index 6.7% -1.1% 3.5% -1.8% -10.1% 0.3% 14.7% 8.0%Macro Index 1.9% -1.6% 4.4% 1.5% -6.2% -0.5% 14.8% 9.1%Fund of Funds Index 1.7% -2.8% 2.9% 0.0% -4.4% 1.7% 9.8% 6.7%Equity Market Neutral Index -1.8% 0.0% 1.1% -0.1% 0.7% 0.1% 8.8% 3.4%Convertible Arbitrage Index 1.9% -1.1% 2.7% -0.6% -4.5% 0.8% 9.8% 4.8%Fixed Income: Arbitrage Index 1.3% -1.6% -0.5% 1.2% -0.9% 0.2% 8.1% 5.0%
CA Private Equity Index 2.3% -1.7% 1.6% -1.3% -3.7% 2.4% 14.6% 9.3%CA Venture Capital Index 1.2% -6.2% 10.5% 10.0% -11.2% -6.7% 20.6% 27.2%CA Private Equity Portfolio 1.8% -4.5% 6.1% 4.7% -7.5% -1.5% 17.6% 16.8%GSCI TR 5.4% -4.2% -9.9% -4.9% 4.1% 7.1% 8.7% 22.6%DJ-AIGCI 6.3% -2.0% -8.9% -2.6% 2.2% 3.2% 8.9% 14.2%
All Dates
Relative Relative Relative
Low Medium High

22
Short-Term Rates
Min Max Min Max Min MaxT-Bill 0.93% 3.34% 3.48% 5.15% 5.16% 8.03%
Mean Stdev Mean Stdev Mean Stdev Mean StdevEquity Hedge Index -5.2% -1.5% -2.4% -2.0% 7.5% 2.2% 16.4% 10.2%Distressed Securities Index 1.7% -1.6% -2.1% 1.7% 0.3% -0.1% 14.7% 8.0%Macro Index 0.5% 1.0% -3.9% -2.6% 3.2% 1.1% 14.8% 9.1%Fund of Funds Index -1.3% -1.0% -1.7% 0.3% 2.9% 0.7% 9.8% 6.7%Equity Market Neutral Index -3.2% -0.4% -1.3% -0.1% 4.5% -0.7% 8.8% 3.4%Convertible Arbitrage Index -3.0% -0.2% 1.3% -0.2% 1.7% 0.2% 9.8% 4.8%Fixed Income: Arbitrage Index 1.6% -1.2% -2.5% 1.5% 0.8% -0.7% 8.1% 5.0%
CA Private Equity Index -2.2% 1.0% 1.1% -1.3% 1.2% 0.4% 14.6% 9.3%CA Venture Capital Index -23.0% -14.0% 5.8% -4.9% 17.7% 9.8% 20.6% 27.2%CA Private Equity Portfolio -12.6% -5.6% 3.5% -2.9% 9.4% 5.1% 17.6% 16.8%GSCI TR 0.4% -4.3% -9.0% -1.6% 8.3% 5.0% 8.7% 22.6%DJ-AIGCI -0.2% -2.1% -4.6% 1.1% 4.5% 1.1% 8.9% 14.2%
All Dates
Relative Relative Relative
Low Medium High
23
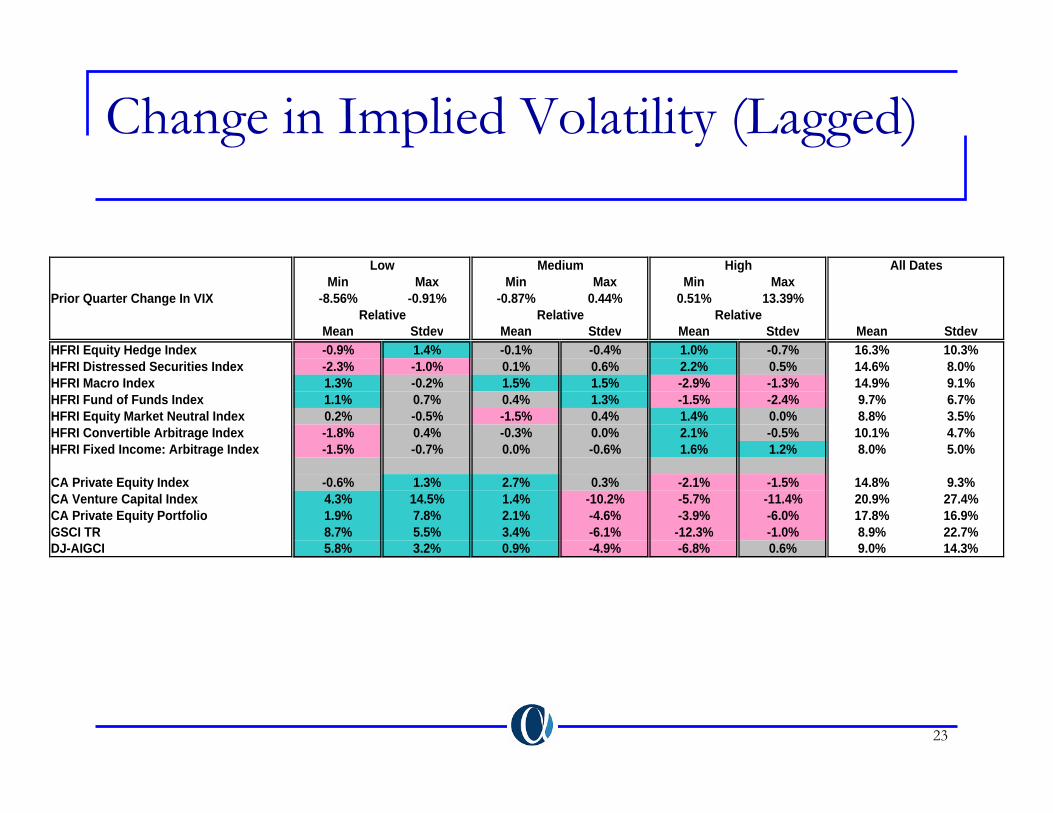
Change in Implied Volatility (Lagged)
Min Max Min Max Min MaxPrior Quarter Change In VIX -8.56% -0.91% -0.87% 0.44% 0.51% 13.39%
Mean Stdev Mean Stdev Mean Stdev Mean StdevHFRI Equity Hedge Index -0.9% 1.4% -0.1% -0.4% 1.0% -0.7% 16.3% 10.3%HFRI Distressed Securities Index -2.3% -1.0% 0.1% 0.6% 2.2% 0.5% 14.6% 8.0%HFRI Macro Index 1.3% -0.2% 1.5% 1.5% -2.9% -1.3% 14.9% 9.1%HFRI Fund of Funds Index 1.1% 0.7% 0.4% 1.3% -1.5% -2.4% 9.7% 6.7%HFRI Equity Market Neutral Index 0.2% -0.5% -1.5% 0.4% 1.4% 0.0% 8.8% 3.5%HFRI Convertible Arbitrage Index -1.8% 0.4% -0.3% 0.0% 2.1% -0.5% 10.1% 4.7%HFRI Fixed Income: Arbitrage Index -1.5% -0.7% 0.0% -0.6% 1.6% 1.2% 8.0% 5.0%
CA Private Equity Index -0.6% 1.3% 2.7% 0.3% -2.1% -1.5% 14.8% 9.3%CA Venture Capital Index 4.3% 14.5% 1.4% -10.2% -5.7% -11.4% 20.9% 27.4%CA Private Equity Portfolio 1.9% 7.8% 2.1% -4.6% -3.9% -6.0% 17.8% 16.9%GSCI TR 8.7% 5.5% 3.4% -6.1% -12.3% -1.0% 8.9% 22.7%DJ-AIGCI 5.8% 3.2% 0.9% -4.9% -6.8% 0.6% 9.0% 14.3%
All Dates
Relative Relative Relative
Low Medium High
24
Review of 2006: Three Short-Term Trends
Year started well:Equity oriented funds performed well. Yield curve play hurt global macro and fixed income arbitrage.Shake up in convertible arbitrage was over and the strategy started to recover.Event driven and global macro managers started to perform well in March & April
Not so merry May:Negative and volatile equity and bond marketsWorst month in two years for many mangersMany shifted into defensive positions
Tipping pointInvestors stopped worrying about inflation, interest rates, and oilMarkets quickly turned around, but many managers were slow to react.Performance did not pick up until the end of 4th quarter
Amaranth: a vanishing act. Impact on multi-strategy fundsFurther push by pension funds
25
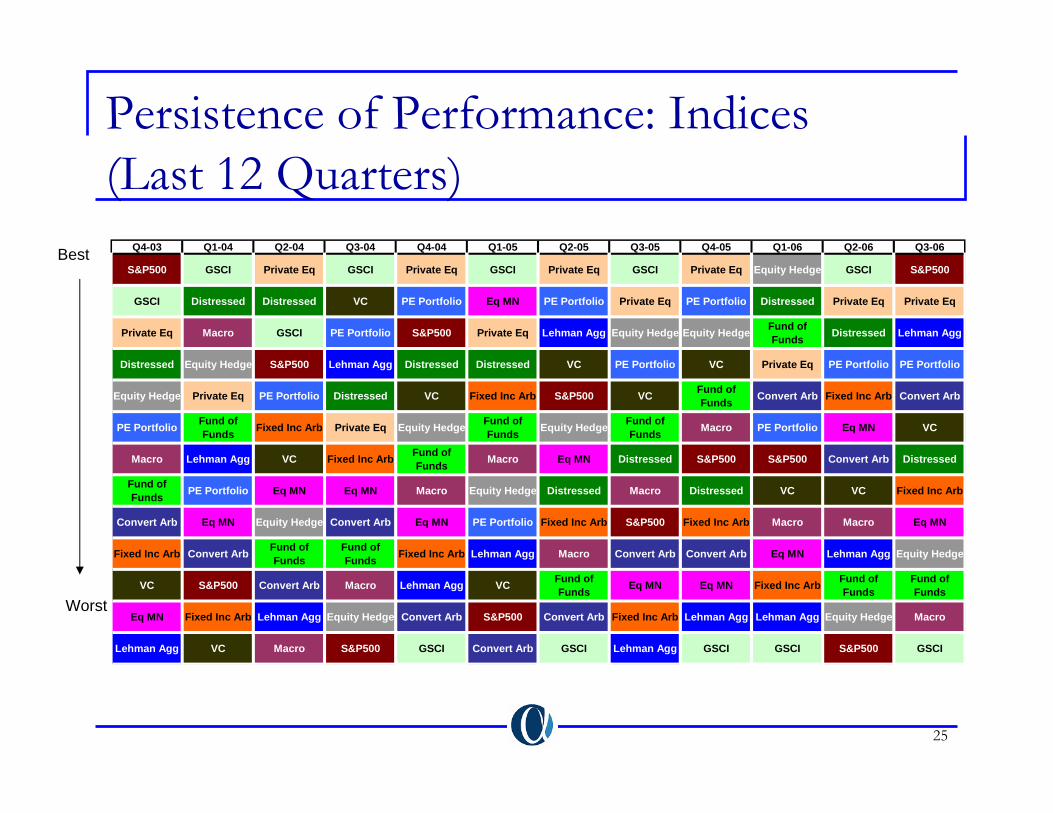
Persistence of Performance: Indices (Last 12 Quarters)
Best
Worst
Q4-03 Q1-04 Q2-04 Q3-04 Q4-04 Q1-05 Q2-05 Q3-05 Q4-05 Q1-06 Q2-06 Q3-06
S&P500 GSCI Private Eq GSCI Private Eq GSCI Private Eq GSCI Private Eq Equity Hedge GSCI S&P500
GSCI Distressed Distressed VC PE Portfolio Eq MN PE Portfolio Private Eq PE Portfolio Distressed Private Eq Private Eq
Private Eq Macro GSCI PE Portfolio S&P500 Private Eq Lehman Agg Equity Hedge Equity Hedge Fund of Funds Distressed Lehman Agg
Distressed Equity Hedge S&P500 Lehman Agg Distressed Distressed VC PE Portfolio VC Private Eq PE Portfolio PE Portfolio
Equity Hedge Private Eq PE Portfolio Distressed VC Fixed Inc Arb S&P500 VC Fund of Funds Convert Arb Fixed Inc Arb Convert Arb
PE Portfolio Fund of Funds Fixed Inc Arb Private Eq Equity Hedge Fund of
Funds Equity Hedge Fund of Funds Macro PE Portfolio Eq MN VC
Macro Lehman Agg VC Fixed Inc Arb Fund of Funds Macro Eq MN Distressed S&P500 S&P500 Convert Arb Distressed
Fund of Funds PE Portfolio Eq MN Eq MN Macro Equity Hedge Distressed Macro Distressed VC VC Fixed Inc Arb
Convert Arb Eq MN Equity Hedge Convert Arb Eq MN PE Portfolio Fixed Inc Arb S&P500 Fixed Inc Arb Macro Macro Eq MN
Fixed Inc Arb Convert Arb Fund of Funds
Fund of Funds Fixed Inc Arb Lehman Agg Macro Convert Arb Convert Arb Eq MN Lehman Agg Equity Hedge
VC S&P500 Convert Arb Macro Lehman Agg VC Fund of Funds Eq MN Eq MN Fixed Inc Arb Fund of
FundsFund of Funds
Eq MN Fixed Inc Arb Lehman Agg Equity Hedge Convert Arb S&P500 Convert Arb Fixed Inc Arb Lehman Agg Lehman Agg Equity Hedge Macro
Lehman Agg VC Macro S&P500 GSCI Convert Arb GSCI Lehman Agg GSCI GSCI S&P500 GSCI

26
Outlook 2007: What May Lie Ahead
Continued institutionalizations“Alternative Beta” products.
Further move toward permanent capital base.Can distressed securities strategy finally find the supply?Divergence of global monetary policies could benefit global macroM&A and other corporate events should continue to benefit event driven strategies.No sign of pick up in volatility means no relief for arbitrage strategies.
27
Alternative Betas & Alphas
Using a single-factor benchmark (e.g., MSCI World), most hedge funds appear to have positive alpha.Using a multi-factor model, most hedge fund managers (about 75%) fail to deliver alpha on a consistent basis.Sources of returns for most hedge fund managers are from “alternative betas” (e.g., various types of credit, volatility, currency, commodity, illiquidity risks), rather than skill.A priori it is difficult to identify which managers will have positive alpha on a consistent basis.On average, hedge funds represent an expensive vehicle for accessing alternative sources of risk-return (betas).Using a multi-factor model we can see that average alpha of managers has been declining.Most top performing managers are closed or lack capacity
28
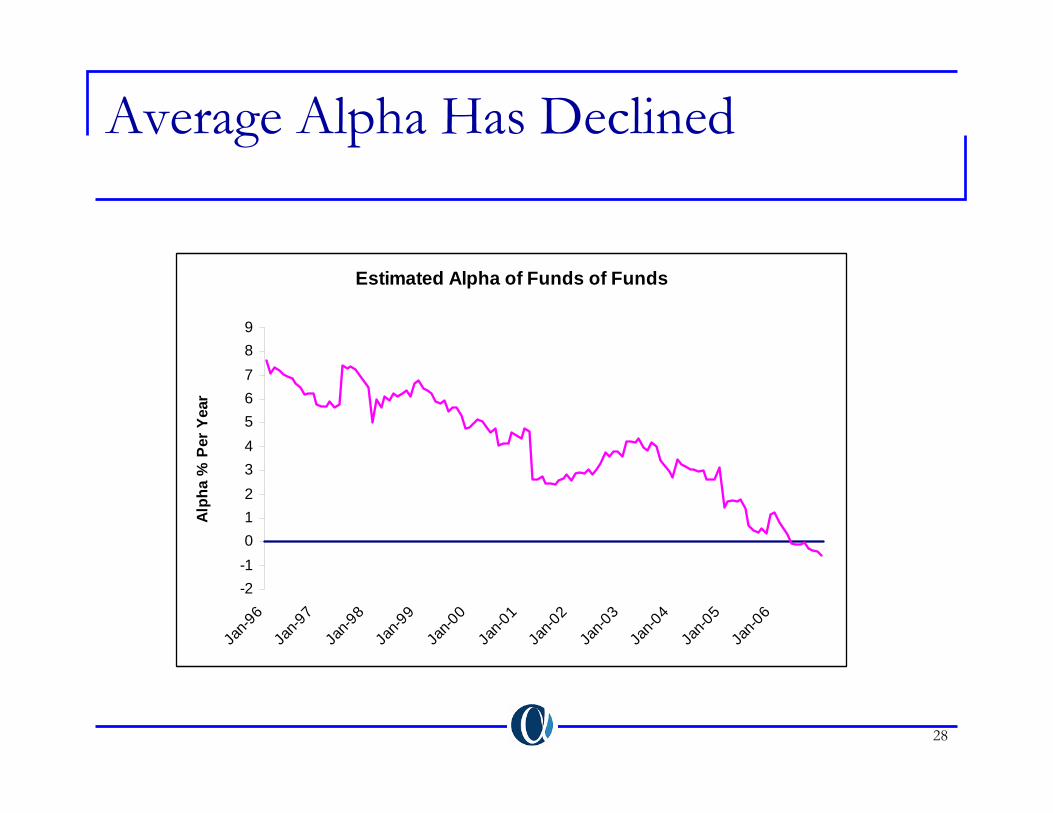
Average Alpha Has Declined
Estimated Alpha of Funds of Funds
-2-10123456789
Jan-9
6Ja
n-97
Jan-9
8Ja
n-99
Jan-0
0Ja
n-01
Jan-0
2Ja
n-03
Jan-0
4Ja
n-05
Jan-0
6
Alp
ha %
Per
Yea
r
29
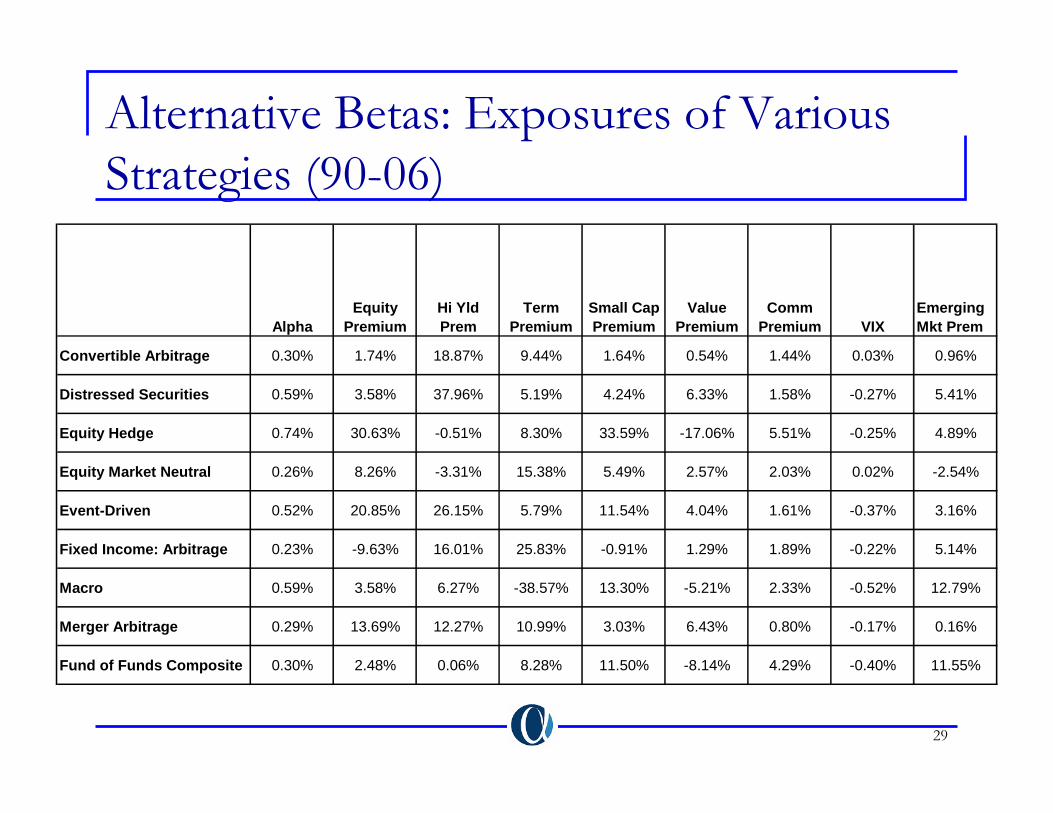
Alternative Betas: Exposures of Various Strategies (90-06)
AlphaEquity
PremiumHi Yld Prem
Term Premium
Small Cap Premium
Value Premium
Comm Premium VIX
Emerging Mkt Prem
Convertible Arbitrage 0.30% 1.74% 18.87% 9.44% 1.64% 0.54% 1.44% 0.03% 0.96%
Distressed Securities 0.59% 3.58% 37.96% 5.19% 4.24% 6.33% 1.58% -0.27% 5.41%
Equity Hedge 0.74% 30.63% -0.51% 8.30% 33.59% -17.06% 5.51% -0.25% 4.89%
Equity Market Neutral 0.26% 8.26% -3.31% 15.38% 5.49% 2.57% 2.03% 0.02% -2.54%
Event-Driven 0.52% 20.85% 26.15% 5.79% 11.54% 4.04% 1.61% -0.37% 3.16%
Fixed Income: Arbitrage 0.23% -9.63% 16.01% 25.83% -0.91% 1.29% 1.89% -0.22% 5.14%
Macro 0.59% 3.58% 6.27% -38.57% 13.30% -5.21% 2.33% -0.52% 12.79%
Merger Arbitrage 0.29% 13.69% 12.27% 10.99% 3.03% 6.43% 0.80% -0.17% 0.16%
Fund of Funds Composite 0.30% 2.48% 0.06% 8.28% 11.50% -8.14% 4.29% -0.40% 11.55%
30
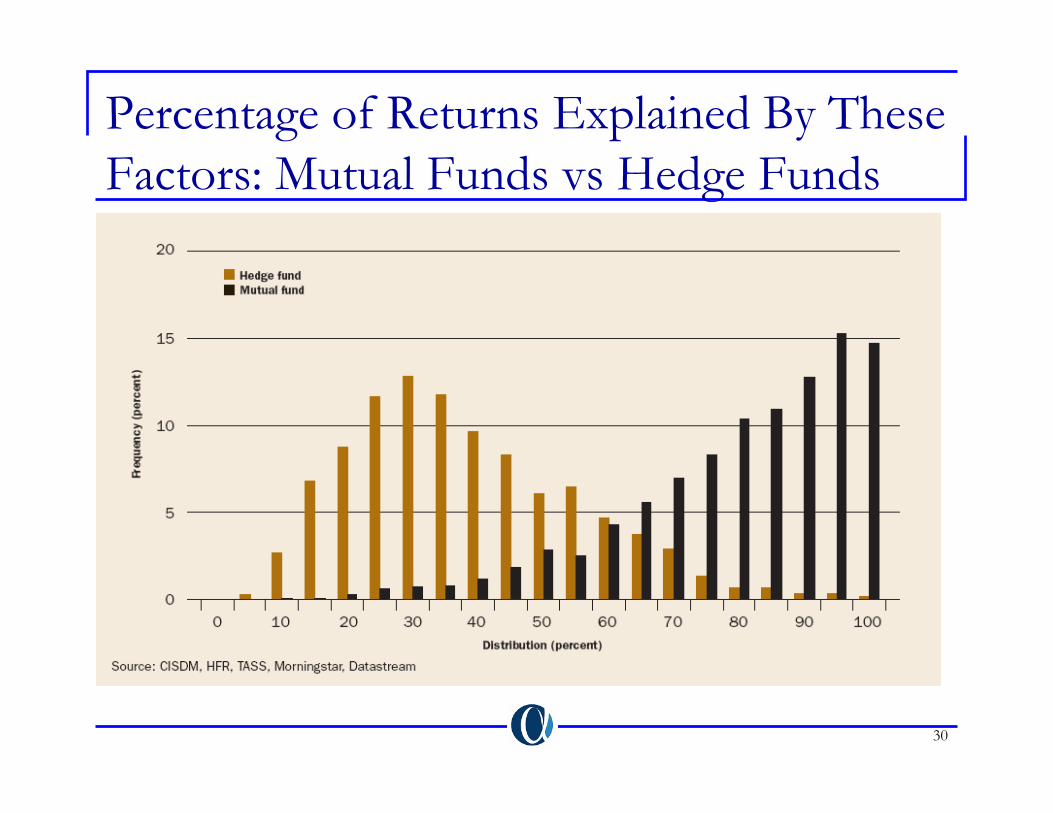
Percentage of Returns Explained By These Factors: Mutual Funds vs Hedge Funds
31
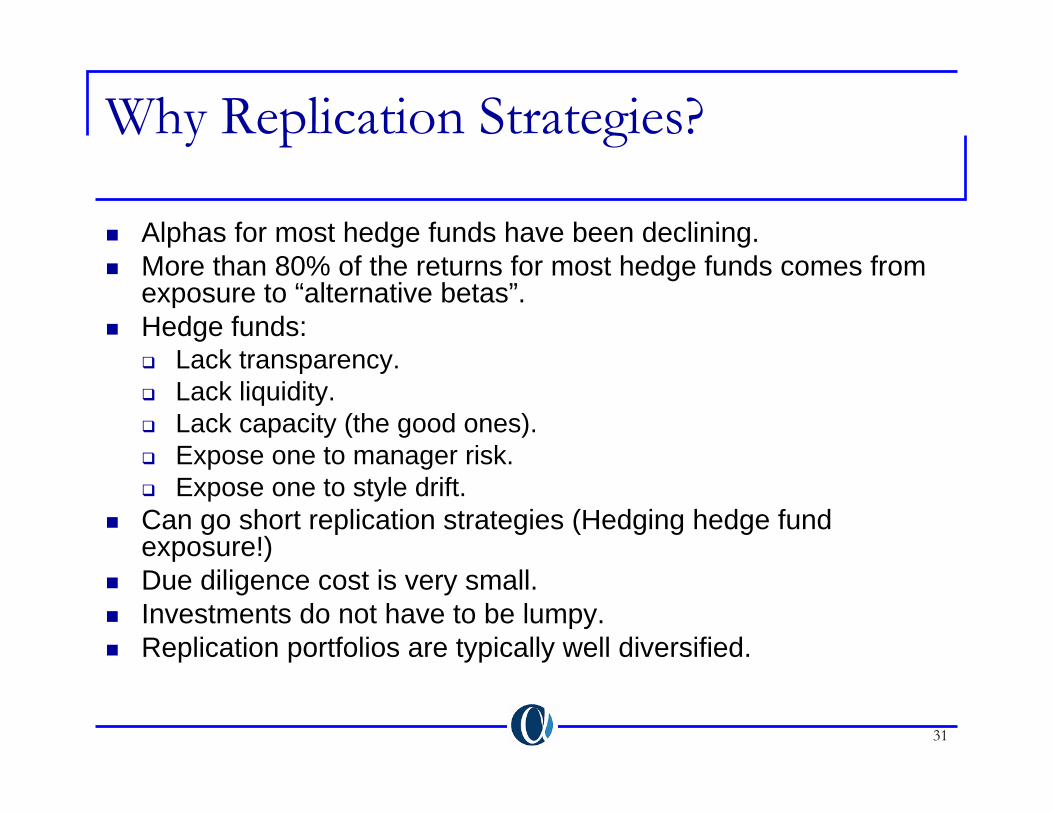
Why Replication Strategies?
Alphas for most hedge funds have been declining.More than 80% of the returns for most hedge funds comes from exposure to “alternative betas”.Hedge funds:
Lack transparency.Lack liquidity.Lack capacity (the good ones).Expose one to manager risk.Expose one to style drift.
Can go short replication strategies (Hedging hedge fund exposure!)Due diligence cost is very small.Investments do not have to be lumpy.Replication portfolios are typically well diversified.
32
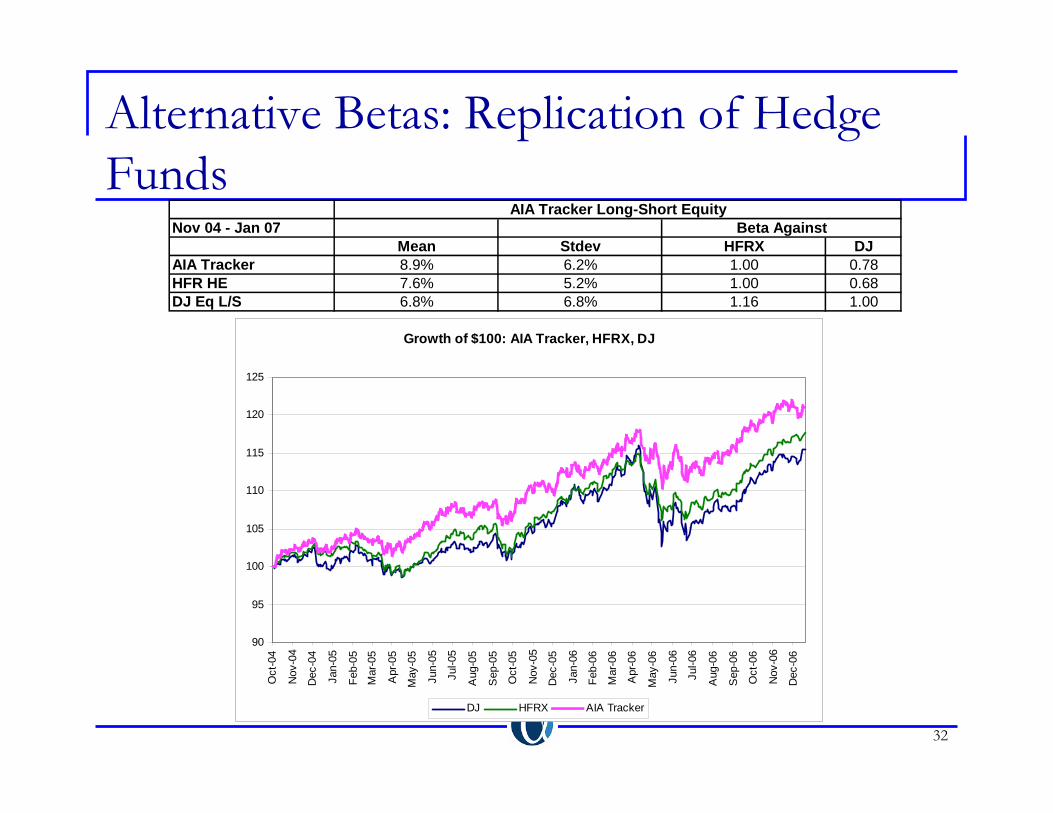
Alternative Betas: Replication of Hedge Funds
Nov 04 - Jan 07Mean Stdev HFRX DJ
AIA Tracker 8.9% 6.2% 1.00 0.78HFR HE 7.6% 5.2% 1.00 0.68DJ Eq L/S 6.8% 6.8% 1.16 1.00
Beta AgainstAIA Tracker Long-Short Equity
Growth of $100: AIA Tracker, HFRX, DJ
90
95
100
105
110
115
120
125
Oct
-04
Nov
-04
Dec
-04
Jan-
05
Feb-
05
Mar
-05
Apr
-05
May
-05
Jun-
05
Jul-0
5
Aug
-05
Sep
-05
Oct
-05
Nov
-05
Dec
-05
Jan-
06
Feb-
06
Mar
-06
Apr
-06
May
-06
Jun-
06
Jul-0
6
Aug
-06
Sep
-06
Oct
-06
Nov
-06
Dec
-06
DJ HFRX AIA Tracker

33
Replication Strategies: Multi-Factor Approach
The performance of a benchmark is tracked on monthly/daily basis through investment in a basket of liquid investments (small/large cap, value/growth, high/low quality bonds, vanillaoptions, etc). The objective to have a small tracking error on a monthly/daily basis.What happens if certain risk premiums disappear (value vsgrowth or small vs large)?What happens if a major source of return is not available through liquid traditional assets (e.g., illiquidity, certain credit risks)?Replication strategies buy what managers bought last period. Could lead to a situation where replication strategy is buying what managers are selling.Multi-factor approach is used by: Merrill Lynch, JP Morgan, Partners Group.Example: AIA Tracker
34
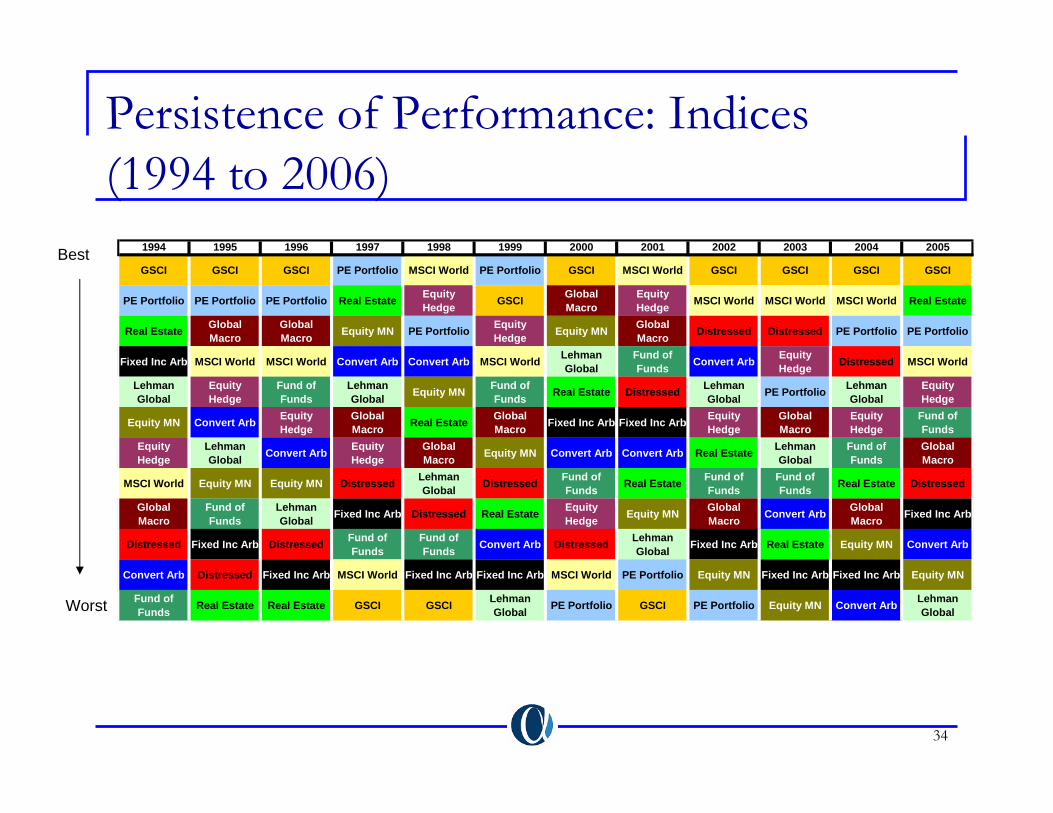
Persistence of Performance: Indices (1994 to 2006)
Best
Worst
1994 1995 1996 1997 1998 1999 2000 2001 2002 2003 2004 2005
GSCI GSCI GSCI PE Portfolio MSCI World PE Portfolio GSCI MSCI World GSCI GSCI GSCI GSCI
PE Portfolio PE Portfolio PE Portfolio Real Estate Equity Hedge GSCI Global
MacroEquity Hedge MSCI World MSCI World MSCI World Real Estate
Real Estate Global Macro
Global Macro Equity MN PE Portfolio Equity
Hedge Equity MN Global Macro Distressed Distressed PE Portfolio PE Portfolio
Fixed Inc Arb MSCI World MSCI World Convert Arb Convert Arb MSCI World Lehman Global
Fund of Funds Convert Arb Equity
Hedge Distressed MSCI World
Lehman Global
Equity Hedge
Fund of Funds
Lehman Global Equity MN Fund of
Funds Real Estate Distressed Lehman Global PE Portfolio Lehman
GlobalEquity Hedge
Equity MN Convert Arb Equity Hedge
Global Macro Real Estate Global
Macro Fixed Inc Arb Fixed Inc Arb Equity Hedge
Global Macro
Equity Hedge
Fund of Funds
Equity Hedge
Lehman Global Convert Arb Equity
HedgeGlobal Macro Equity MN Convert Arb Convert Arb Real Estate Lehman
GlobalFund of Funds
Global Macro
MSCI World Equity MN Equity MN Distressed Lehman Global Distressed Fund of
Funds Real Estate Fund of Funds
Fund of Funds Real Estate Distressed
Global Macro
Fund of Funds
Lehman Global Fixed Inc Arb Distressed Real Estate Equity
Hedge Equity MN Global Macro Convert Arb Global
Macro Fixed Inc Arb
Distressed Fixed Inc Arb Distressed Fund of Funds
Fund of Funds Convert Arb Distressed Lehman
Global Fixed Inc Arb Real Estate Equity MN Convert Arb
Convert Arb Distressed Fixed Inc Arb MSCI World Fixed Inc Arb Fixed Inc Arb MSCI World PE Portfolio Equity MN Fixed Inc Arb Fixed Inc Arb Equity MN
Fund of Funds Real Estate Real Estate GSCI GSCI Lehman
Global PE Portfolio GSCI PE Portfolio Equity MN Convert Arb Lehman Global
35
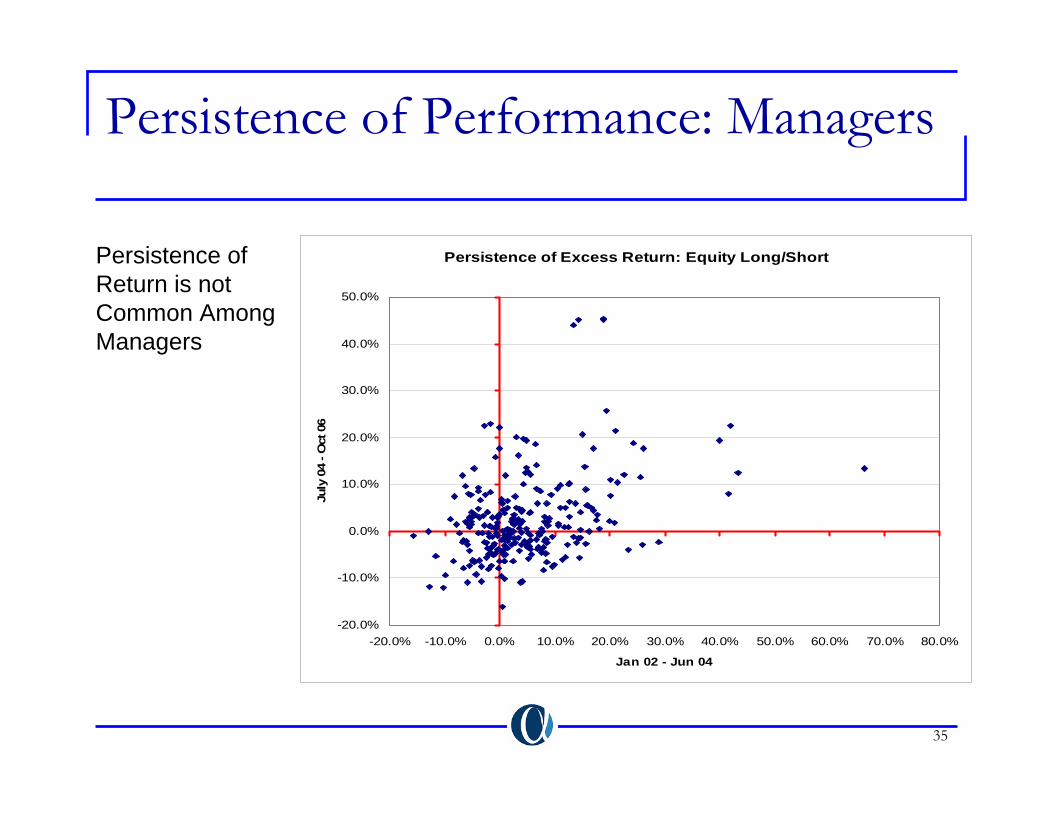
Persistence of Performance: Managers
Persistence of Excess Return: Equity Long/Short
-20.0%
-10.0%
0.0%
10.0%
20.0%
30.0%
40.0%
50.0%
-20.0% -10.0% 0.0% 10.0% 20.0% 30.0% 40.0% 50.0% 60.0% 70.0% 80.0%
Jan 02 - Jun 04
July
04
- Oct
06
Persistence of Return is not Common Among Managers

36
Persistence of Performance: Managers
Persistence of Excess Volatility: Equity Long/Short
0.0%
5.0%
10.0%
15.0%
20.0%
25.0%
30.0%
35.0%
40.0%
0.0% 10.0% 20.0% 30.0% 40.0% 50.0% 60.0% 70.0% 80.0% 90.0% 100.0%
Jan 02 - Jun 04
July
04
- Oct
06
Persistence of Risk or Exposure is more common
37
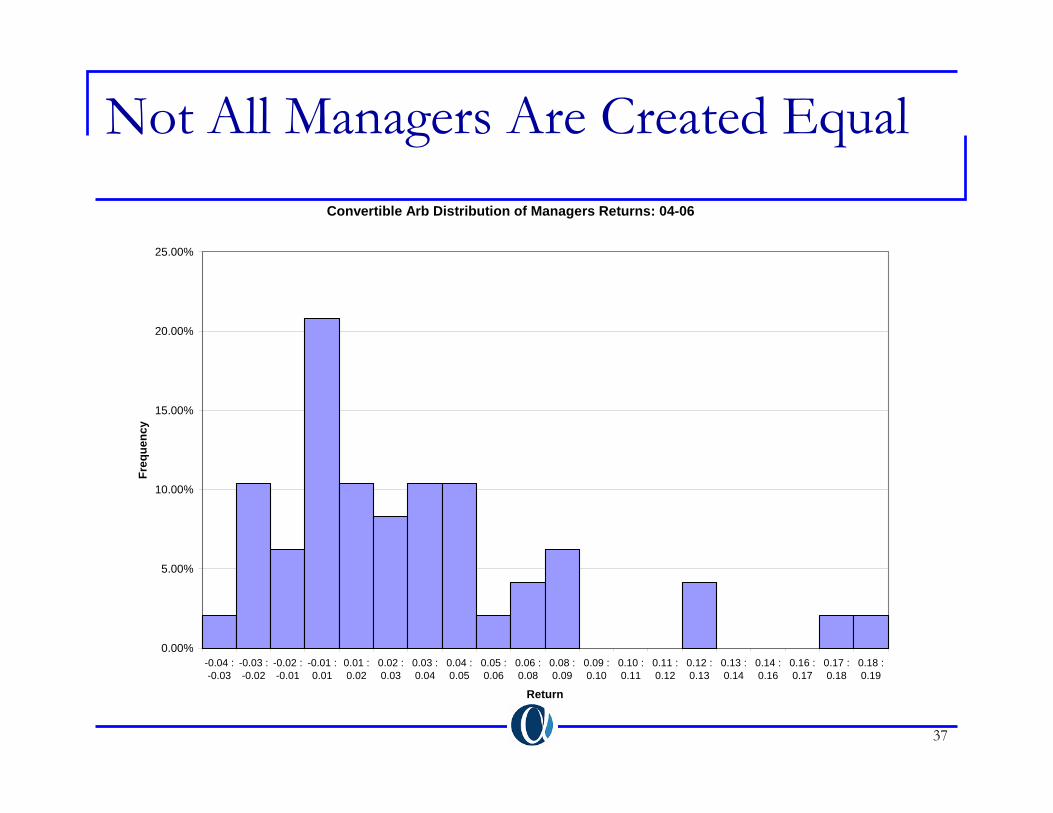
Not All Managers Are Created EqualConvertible Arb Distribution of Managers Returns: 04-06
0.00%
5.00%
10.00%
15.00%
20.00%
25.00%
-0.04 :-0.03
-0.03 :-0.02
-0.02 :-0.01
-0.01 :0.01
0.01 :0.02
0.02 :0.03
0.03 :0.04
0.04 :0.05
0.05 :0.06
0.06 :0.08
0.08 :0.09
0.09 :0.10
0.10 :0.11
0.11 :0.12
0.12 :0.13
0.13 :0.14
0.14 :0.16
0.16 :0.17
0.17 :0.18
0.18 :0.19
Return
Freq
uenc
y
38
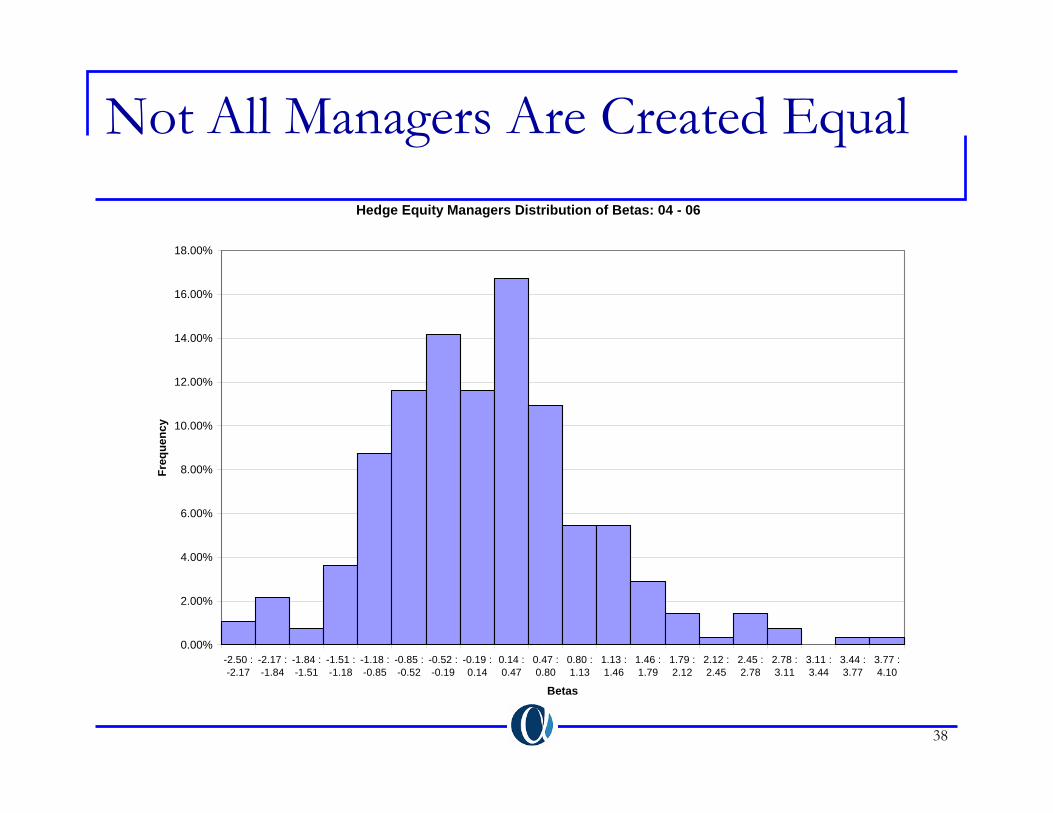
Not All Managers Are Created EqualHedge Equity Managers Distribution of Betas: 04 - 06
0.00%
2.00%
4.00%
6.00%
8.00%
10.00%
12.00%
14.00%
16.00%
18.00%
-2.50 :-2.17
-2.17 :-1.84
-1.84 :-1.51
-1.51 :-1.18
-1.18 :-0.85
-0.85 :-0.52
-0.52 :-0.19
-0.19 :0.14
0.14 :0.47
0.47 :0.80
0.80 :1.13
1.13 :1.46
1.46 :1.79
1.79 :2.12
2.12 :2.45
2.45 :2.78
2.78 :3.11
3.11 :3.44
3.44 :3.77
3.77 :4.10
Betas
Freq
uenc
y
39
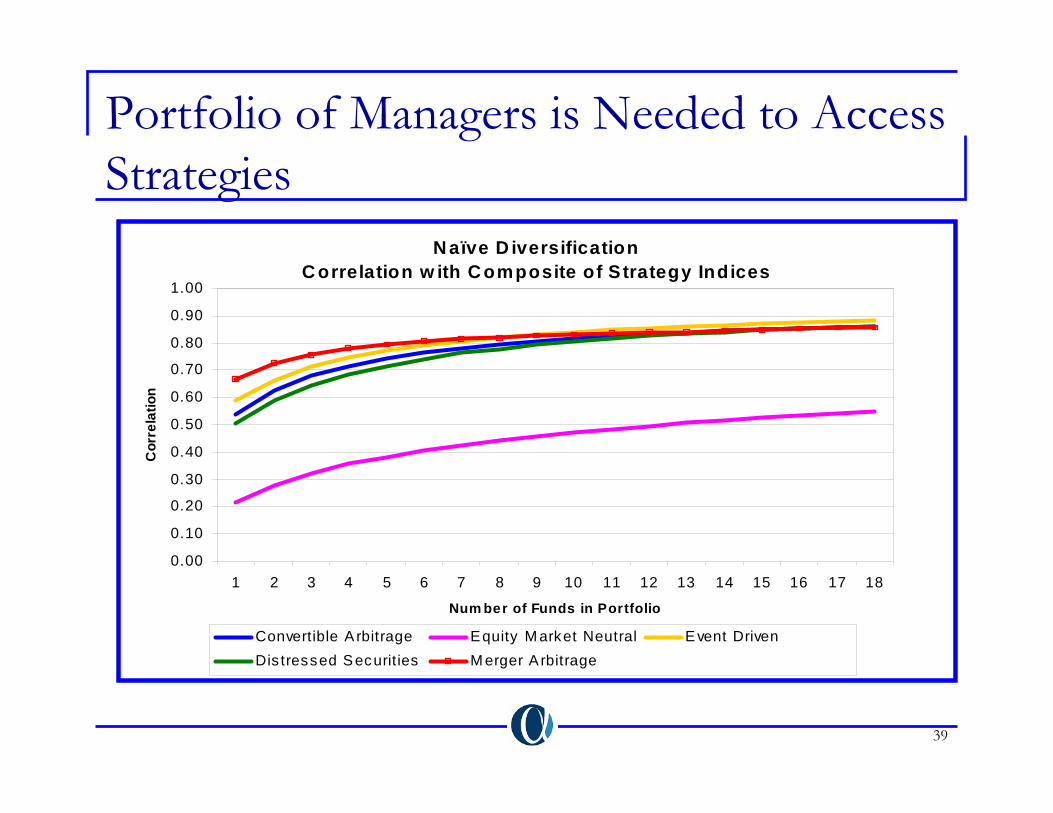
Portfolio of Managers is Needed to Access Strategies N aïve D iversification
C orrelation w ith C omposite of S trategy Indices
0.00
0.10
0.20
0.30
0.40
0.50
0.60
0.70
0.80
0.90
1.00
1 2 3 4 5 6 7 8 9 10 11 12 13 14 15 16 17 18
Num ber of Funds in Portfolio
Cor
rela
tion
Convertible A rbitrage Equity M arket Neutral Event DrivenDis tressed Securit ies M erger A rbitrage
40
Benefits of Funds of Funds
Reduced due diligence costs.Diversification by style: diversification across hedge fund strategies.Access to managers that are closed.May offer increased liquidity.Asset allocation: there is some evidence that hedge fund returns are predictable.Diversification by fund family and managers: reduced business risk and diversification of judgment.Investible Hedge Fund indices my serve as alternative.
41
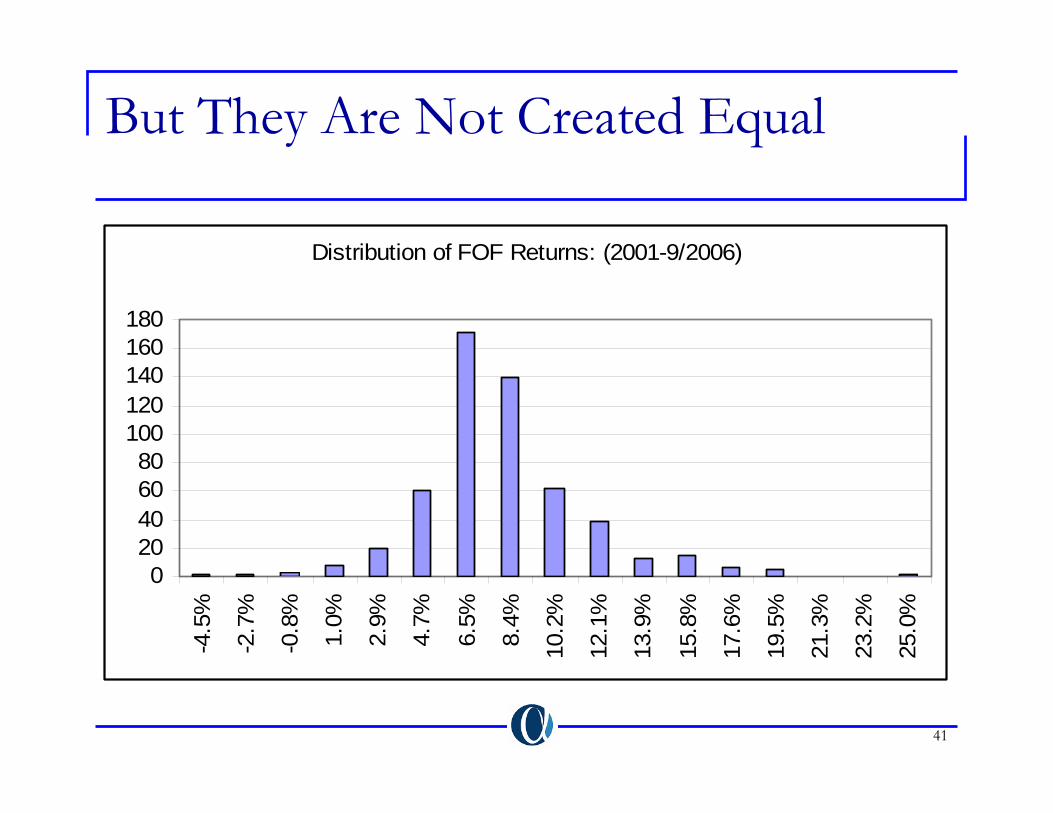
But They Are Not Created Equal
Distribution of FOF Returns: (2001-9/2006)
020406080
100120140160180
-4.5
%
-2.7
%
-0.8
%
1.0%
2.9%
4.7%
6.5%
8.4%
10.2
%
12.1
%
13.9
%
15.8
%
17.6
%
19.5
%
21.3
%
23.2
%
25.0
%
42
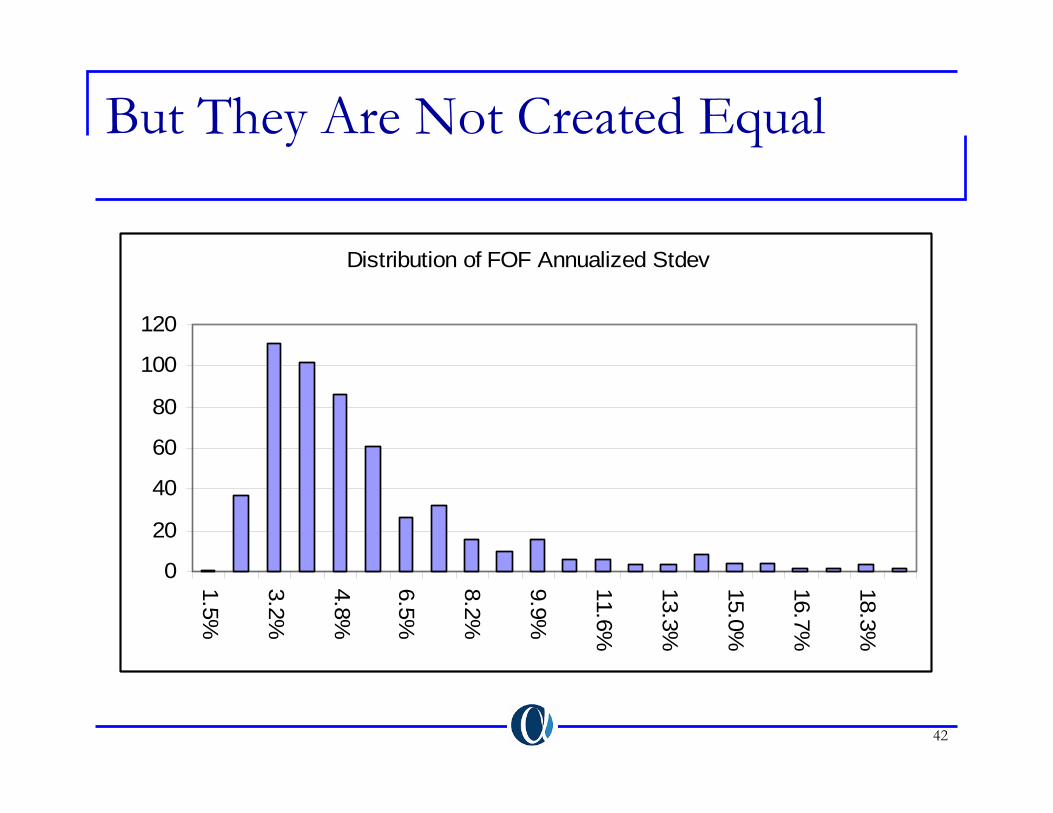
But They Are Not Created Equal
Distribution of FOF Annualized Stdev
0
20
40
60
80
100
120
1.5%
3.2%
4.8%
6.5%
8.2%
9.9%
11.6%
13.3%
15.0%
16.7%
18.3%
43
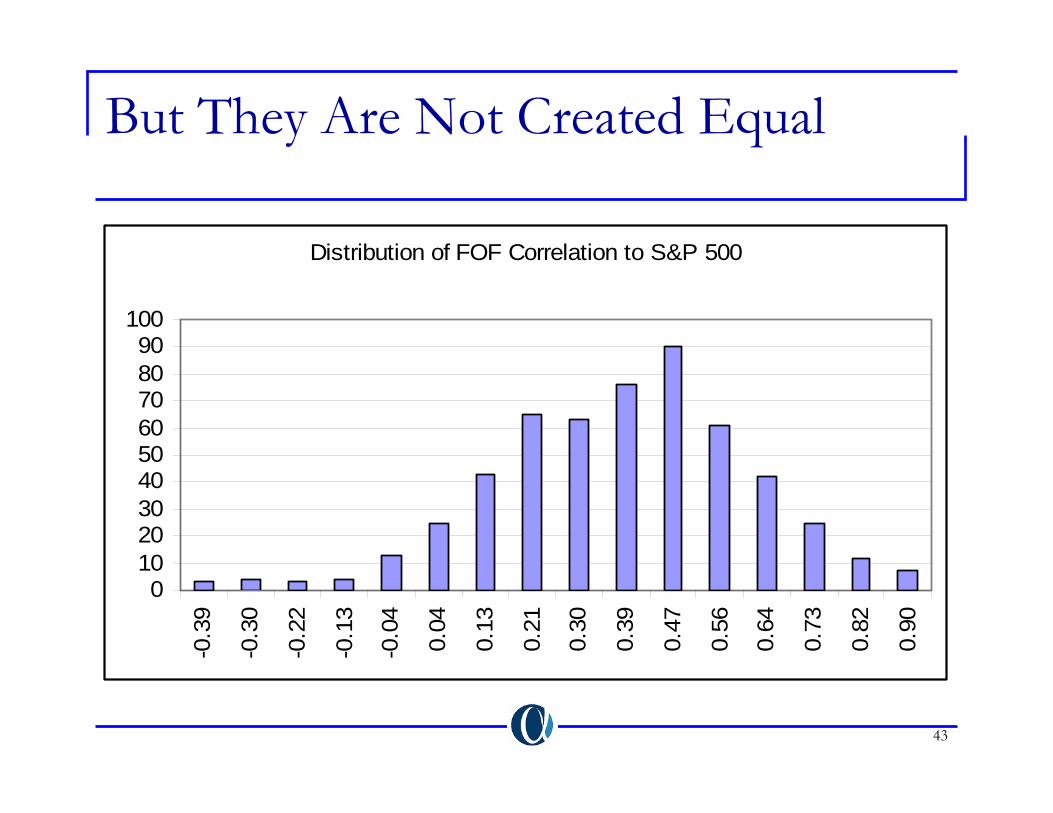
But They Are Not Created Equal
Distribution of FOF Correlation to S&P 500
0102030405060708090
100
-0.3
9
-0.3
0
-0.2
2
-0.1
3
-0.0
4
0.04
0.13
0.21
0.30
0.39
0.47
0.56
0.64
0.73
0.82
0.90
44
Conclusion: Alternatives, The Next Bubble?
Commodities (futures based): Investment has grown by 50% last year. Exceeding $100 billion. GSCI and DJ-AIG are major indices. Recent addition: Bach Commodity Index. Physical investment exceeds $2 trillion.Commercial Real Estate: Liquid investments (REITS) have doubled to $800 billion. Represents 5% of total global commercial real estate.Private Equity: Represented by limited partnerships. Total investment exceeds $1 trillion. Dominated by pension and endowments. Individuals hold about 15%.Hedge Funds: Steady growth reaching $1 trillion. Becoming increasingly institutionalized.Alternatives cover about 8% of the total investment universe (about $70 trillion)
45
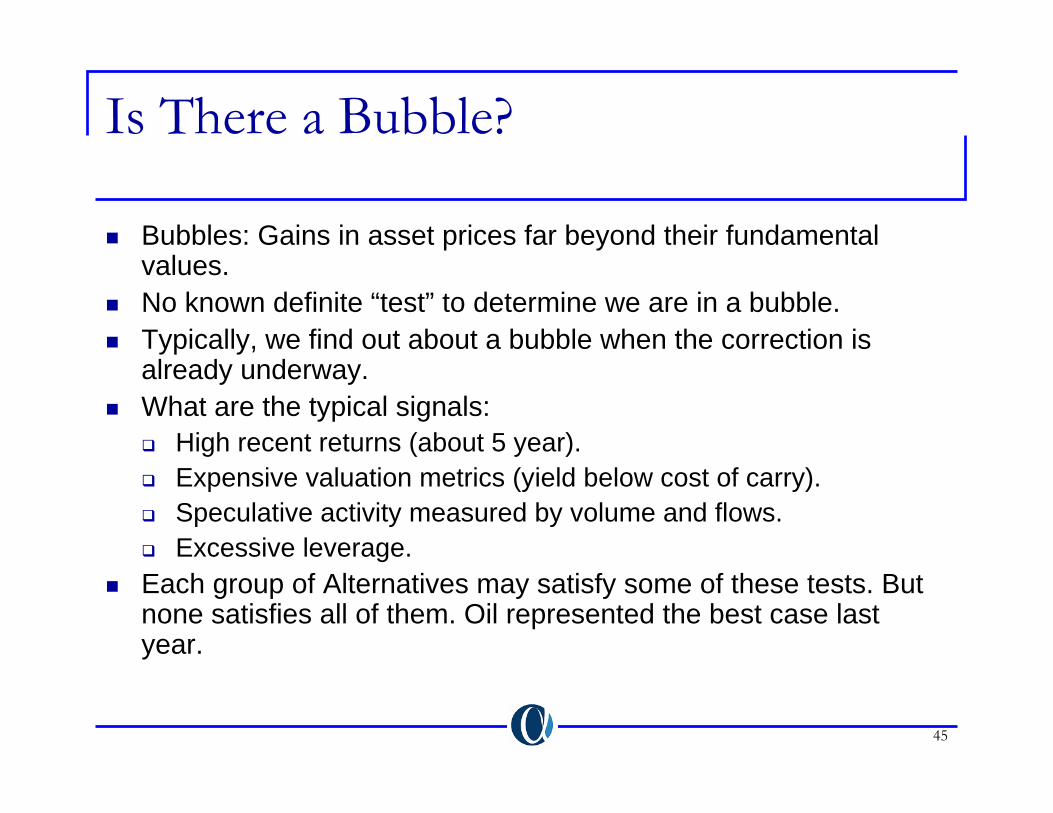
Is There a Bubble?
Bubbles: Gains in asset prices far beyond their fundamental values.No known definite “test” to determine we are in a bubble.Typically, we find out about a bubble when the correction is already underway.What are the typical signals:
High recent returns (about 5 year).Expensive valuation metrics (yield below cost of carry).Speculative activity measured by volume and flows.Excessive leverage.
Each group of Alternatives may satisfy some of these tests. But none satisfies all of them. Oil represented the best case last year.
46
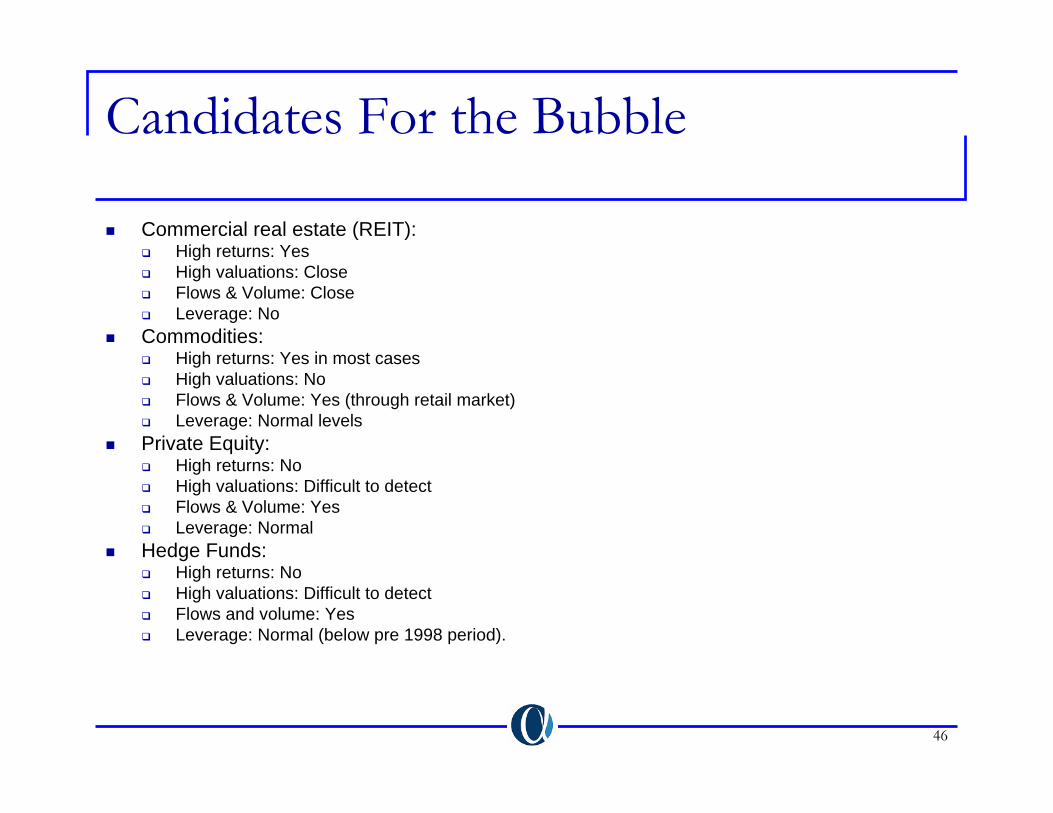
Candidates For the Bubble
Commercial real estate (REIT):High returns: YesHigh valuations: CloseFlows & Volume: CloseLeverage: No
Commodities:High returns: Yes in most casesHigh valuations: NoFlows & Volume: Yes (through retail market)Leverage: Normal levels
Private Equity:High returns: NoHigh valuations: Difficult to detectFlows & Volume: YesLeverage: Normal
Hedge Funds:High returns: NoHigh valuations: Difficult to detectFlows and volume: YesLeverage: Normal (below pre 1998 period).