alternative fuels - clean energy...
TRANSCRIPT

This material is based upon work supported by the Department of Energy under Award Number DE-EE0006005
ALTERNATIVE FUELS: A STATE POLICY ANALYSIS
Allison Skinner & Joshua RegoJuly 2014

2bridging needs. advancing change.
EXECUTIVE SUMMARYState policy directed towards alternative fuels and alternative fuel vehicles (AFVs) varies greatly between states. Clean Energy Coalition conducted this research with the goal of gaining a better understanding of this policy patchwork, and the relationship between different types of policy and the number of AFVs per capita in each state. Disseminating this information to policymakers is a key step in the promotion of alternative fuels and AFVs because it can guide decision makers toward more effective policy.
This research examines correlations between current policy and AFVs. In addition, this research provides a valuable look at which states have certain types of policies, and how these policies might relate to the number of AFVs and alternative fueling infrastructure in each state. By comparing the strength of relationship between certain policies and AFVs per capita, we can determine which types of policies might be more effective at promoting the proliferation of AFVs and the use of alternative fuels.
There are three important distinctions that impact AFV policy: the origination of the policy (whether it is a state, local, or utility policy), the target of the policy (who is affected by the policy), and the type of policy mechanism (e.g., financial incentive, or a fee/tax policy). For example, this research suggests that states with more laws and incentives that originate at the local or utility level are more likely to have a higher number of AFVs per capita. This indicates that decision makers should encourage the use of local policy to promote AFVs, and work with utilities or the state’s public service commission to promote the use of alternative fuels and AFVs. Although most current policy is targeted toward the commercial sector (especially so for grants and rebates), states that have more laws and incentives targeted to the residential sector are more likely to have a higher number of AFVs per capita. Finally, the type of policy mechanisms with the strongest relationship to AFVs per capita are:
GRANT OR REBATE POLICIES: Grant or rebate policies for the purchase of AFVs, regardless of targeted market segment, had some of the strongest correlations with the number of AFVs per state. One example would be a policy that provides grants to purchase alternative fuels.
DISCOUNT POLICIES: Discount policies geared toward fuel use had a relatively strong correlation to the number of AFVs per state. One example would be an electric utility rate discount for electric vehicle (EV) charging.
EXCEPTION POLICIES: Policies allowing an exception, such as a tax exemption, had some of the strongest correlation observed. One example would be a policy that exempt alternative fuels from certain kinds of taxation.
This research is the first step to a more comprehensive understanding of the relationship between policy and AFV adoption. Armed with the tools to understand which policies best support and promote the use AFVs and alternative fuels, states will have the opportunity to realize the important economic, environmental, and efficiency benefits related to increased AFV adoption.

3bridging needs. advancing change.
The alternative fuels and AFV industry is growing at a rapid rate. A 2014 report by Navigant Research predicts that worldwide sales of electric and alternative fuel vehicles will nearly double from 6.6 million in 2014 to almost 12.4 million in 2022.1 This growth is often attributed to a number of factors, including policy and incentives put in place by federal and local governments, increasing interest from consumers, and fleet managers demanding more fuel-efficient vehicles that are cheaper to operate. There’s no doubt that the AFV industry is becoming an increasingly important contributor to the U.S. economy. Across the nation, more than 150,000 autoworkers currently specialize in clean, efficient technologies, with many more jobs indirectly involved.2
Every U.S. state has passed some form of alternative fuel policy. However, the landscape of the state
policies that target AFV and alternative fuel use and adoption can be difficult to navigate, especially when it comes to state laws and incentives, where significant differences exist from state to state. Some states, for example, have numerous incentives that encourage alternative fuel production, yet few geared toward AFV adoption. This piecemeal approach to policy has undoubtedly been one of the contributing factors to significant differences in AFV adoption rates across the nation, and a cause for hesitation in investment by the commercial and residential sectors. The purpose of this paper is to categorically examine policies across all 50 states, and create a framework to better understanding state-level alternative fuel policy. Ultimately, a deeper knowledge of state AFV policy will help decision makers see what may or may not be working to advance the adoption and use of alternative fuels and AFVs.
INTRODUCTION
FIGURE 1 | U.S. greenhouse gas emissions by sector, 201210+10+20+28+32+L
electricitygeneration32%
agriculturalproduction10%
commercial +industrial10%
transportationsector 28%
industrial +manufacturing 20%

4bridging needs. advancing change.
METHODOLOGYClean Energy Coalition analyzed and categorized policies from all 50 states and the District of Columbia related to alternative fuels and AFVs to examine the relationship between policy and the number of alternative fuel vehicles per capita in each state. The goal of this research was to determine whether there is a meaningful correlation between policy and adoption of AFVs, alternative fuels, and alternative fueling infrastructure.
Clean Energy Coalition relied on the U.S. DOE’s Alternative Fuels Data Center (AFDC) for a comprehensive listing of policies related to alternative fuels and vehicles, air quality, fuel efficiency, and other transportation-related topics. The AFDC was also the source for the number of alternative fueling stations in each state for each type of alternative fuel. Clean Energy Coalition then compared this to data aggregated from three primary sources: Polk Research, Navigant Research, and the Energy Information Administration.
Clean Energy Coalition surveyed each state’s policies and categorized them based on the type of policy (see Figure 3). Policies that overlapped between categories were tagged in each applicable category. For example, a policy exempting local agencies from paying user taxes on compressed natural gas (CNG) and electricity used to operate motor vehicles would have CNG, Electric, and Plug-In Hybrid tagged in the “Technology” category,
Exception tagged in the “Mechanism Used” category, Public tagged in the “Market Segment” category, and Fuel Use tagged in the “Target Activity” category. A detailed description and definition for each category can be found beginning on page 7.
After breaking policies out into these categories, Clean Energy Coalition explored the correlations between types of policies and the number of AFVs and AFV infrastructure per capita in each state. Clean Energy Coalition then compared the total number of AFVs in each state to the number of policies in each category to determine if any correlations existed. A scale was used to determine the strength of correlations between vehicle counts and policies, as laid out in Figure 2.
Clean Energy Coalition focused on policies geared toward compressed natural gas, propane, and electric vehicles. This is because both biodiesel and E85 fuels can be used in vehicles that can also run on conventional fuel with little to no modification, making it difficult to determine how use of these fuels may be impacted by policy. Studies have shown that most people who own Flexible Fuel vehicles (FFVs), which have the capability of operating on either conventional gasoline or E85, are rarely aware that they can use fuels blended with up to 85 percent ethanol.4 Similarly, most diesel vehicles on the road today can already operate on low biodiesel blends, and most policy is targeted toward fuel usage and infrastructure, rather than vehicle adoption.
FIGURE 2 | Correlation Scale
Strong Negative Correlation
Weak Positive Correlation
No CorrelationWeak Negative
Correlation
Strong Positive Correlation-1.0
-0.8-0.6
-0.4-0.2
0.20.4
0.60.8
1.0

5bridging needs. advancing change.
StateLocalUtilityIndustry
BiodieselEthanol (E85)Fuel Cell (FC)CNGLNGPropane (LPG)ElectricPlug-In HybridHybridIdle ReductionRight Sizing
Grant/RebateLoanTax CreditDiscountFee/TaxExceptionProceduralMandate
OFFEREDBY
TECHNOLOGYTARGETED
MECHANISMUSED
ResidentialCommercialPublic
MARKETSEGMENT
STATE: CaliforniaPOLICY: Compressed Natural Gas (CNG) and Electricity Tax Exemption for Transit UseDESCRIPTION: CNG and electricity that local agencies or public transit operators use as motor vehicle fuel to operate public transit services is exempt from applicable user taxes a county imposes. (Reference California Revenue and Taxation Code 7284.3)
Vehicles Research Manufacturing Use Purchase Retrofit
Fuel Research Production Infrastructure Use
Education Training Study Outreach
TARGETACTIVITY
FIGURE 3 | Sample Policy Categorization

6bridging needs. advancing change.
While the AFDC’s list of laws and incentives is comprehensive, it offers only a “snapshot in time” look at each state’s policies. This research was conducted in May of 2014, so the policies analyzed for the purpose of this report are only as current as the AFDC’s website at the time. The AFDC updates its list of laws and incentives for each state annually, so it is possible that some of the policies included in this research have already expired, been modified, or repealed.
Furthermore, this examination does not include policies no longer in effect that have likely had an impact on the adoption of AFVs and usage of alternative fuels. Other research that examines past AFV laws and incentives show a number of states that had financial incentives in place for AFVs, but the policies have since expired.11 The ability to track how these financial incentive policies correlate over time with the number of AFVs on the road would be an extremely valuable addition to this analysis, and would provide a more holistic picture of how policy impacts AFV adoption.
Additionally, this research does not include the monetary value of any incentives offered by states, and cannot accurately weigh the value (monetary or otherwise) or effectiveness of each policy. As mentioned above, policies are only as effective as their support, and without financial support, a policy cannot be expected to be effective. Despite these limitations, this research offers valuable insight into the state of alternative fuel policy in the U.S., and a common starting ground for future research on the topic.
LIMITATIONS

7bridging needs. advancing change.
CATEGORY 1 | Offered By
State Policy is offered or enforced by a state government agency
Local Policy is offered or enforced by a local jurisdiction
Utility Policy is offered or enforced by a local or regional utility
Industry Policy is offered by a private organization or industry
CATEGORY 2 | Technology
Biofuel (BIO) Policy refers specifically to non-ethanol vehicle biofuels such as biodiesel
Ethanol (E85) Policy refers specifically to ethanol vehicle fuels
Fuel Cell (FC) Policy refers specifically to fuel cell technology for vehicles
CNG Policy refers specifically to compressed natural gas vehicle fuel
LNG Policy refers specifically to liquefied natural gas vehicle fuel
LPG Policy refers specifically to liquefied petroleum gas (propane) vehicle fuel
Electric Vehicles (EV) Policy refers specifically to electric vehicles and electricity used as vehicle fuel
Plug-In Hybrid (PHEV)Policy refers specifically to plug-in hybrid electric vehicles and electricity used as vehicle fuel
Hybrid (HEV) Policy refers specifically to hybrid electric vehicles
Idle Reduction Policy refers specifically to idle reduction in vehicles
Right-SizingPolicy refers specifically to down-sizing, replacement, or right-sizing vehicle fleets
POLICY CATEGORIZATION DEFINITIONS
8bridging needs. advancing change.
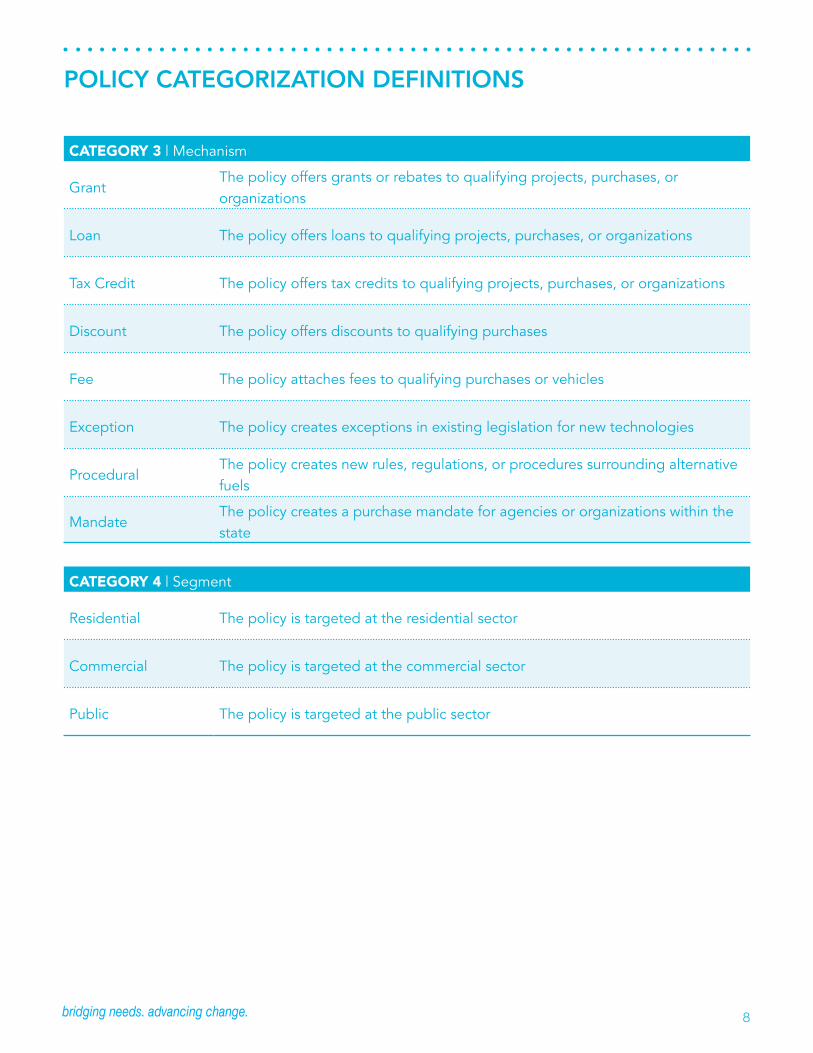
CATEGORY 4 | Segment
Residential The policy is targeted at the residential sector
Commercial The policy is targeted at the commercial sector
Public The policy is targeted at the public sector
POLICY CATEGORIZATION DEFINITIONS
CATEGORY 3 | Mechanism
GrantThe policy offers grants or rebates to qualifying projects, purchases, or organizations
Loan The policy offers loans to qualifying projects, purchases, or organizations
Tax Credit The policy offers tax credits to qualifying projects, purchases, or organizations
Discount The policy offers discounts to qualifying purchases
Fee The policy attaches fees to qualifying purchases or vehicles
Exception The policy creates exceptions in existing legislation for new technologies
ProceduralThe policy creates new rules, regulations, or procedures surrounding alternative fuels
MandateThe policy creates a purchase mandate for agencies or organizations within the state

9bridging needs. advancing change.
CATEGORY 5 | Target
Vehicles
ResearchThe objective of the policy is to support alternative fuel vehicle research
ManufacturingThe objective of the policy is to support the manufacturing of alternative fuel vehicles and systems
UseThe objective of the policy is to support alternative fuel vehicle use
PurchaseThe objective of the policy is to support the purchase of alternative fuel vehicles
RetrofitThe objective of the policy is to support the conversion of conventional vehicles to run on alternative fuels
Fuel
ResearchThe objective of the policy is to support research on alternative fuels
ProductionThe objective of the policy is to support research on alternative fuels
InfrastructureThe objective of the policy is to support alternative fuel infrastructure
UseThe objective of the policy is to support alternative fuel adoption and use
Education
TrainingThe objective of the policy is to support alternative fuels through mechanic and first responder training
StudyThe objective of the policy is to support alternative fuels through research and studies
OutreachThe objective of the policy is to support alternative fuels through research and studies
POLICY CATEGORIZATION DEFINITIONS

10bridging needs. advancing change.
The states that have the most AFVs are mainly concentrated in the western U.S. Of these states, California tops the list with almost 22 AFVs per 10,000 residents. States with the fewest AFVs per capita are also likely to have a relatively higher vehicle ownership rate—Alaska, Delaware, Nebraska, North Dakota, and South Dakota all have nearly one or more vehicles per resident.5
FINDINGS
RANKING THE STATESCounting and categorizing AFV and alternative fuel policies by state, as depicted in Figure 3, does not give the full picture on the true effectiveness of those particular policies. A state with numerous policies and little capital or enforcement behind them will likely have fewer alternative fuel vehicles than a state with one well-funded, well-supported, and well-planned policy.
This is most likely the reason that the number of AFV laws and incentives in each state shows a weak positive correlation with the number of AFVs per capita. It is clear that it is not necessarily the number
of policies that would have a positive impact on state AFV adoption, but the value and political support of those policies.
MOST COMMON POLICIESThe most common legislative mechanism used by states falls into the general “procedural” category, which creates new rules, regulations, or procedures for alternative fuels and AFVs. These pieces of legislation create the regulatory and legal framework surrounding the purchase and use of alternative fuels and AFVs. In general, procedural policies are targeted toward the use of alternative fuel or AFVs, and tend to focus on biofuels and EVs.
FIGURE 4 | Alternative fuel vehicles per capita
1 - 4 17+13 - 169 - 125 - 8

11bridging needs. advancing change.
A procedural policy does not necessarily help or hinder the use of alternative fuels or AFVs. For example, most states have some form of “low speed vehicle access to roadways” law that sets guidelines for where low speed vehicles (LSVs), are allowed and other rules surrounding their usage. Many LSVs are also classified as Neighborhood Electric Vehicles (NEVs), and therefore fall into the category of AFVs. LSV laws do not have a noticeable effect on the adoption rates of AFVs in general, as these vehicles are relatively uncommon and their use is situation-specific.
The next most common type of state policy is a grant or rebate mechanism, which is most frequently related to the purchase of alternative fuels and their associated infrastructure. Currently, more than half of the grant or rebate policies offered by states are
targeted toward the commercial sector, with only 16 percent being applicable to the residential market. However, when comparing the total number of AFVs in each state to the total number of grant/rebate programs aimed at the residential sector, it is clear that states with a greater number of these programs also have a higher number of AFVs per capita.
In general, the majority of existing policies are targeted toward the commercial and/or public sectors, with only 23 percent being applicable to the residential sector. In fact, there are no states that have more policies targeting the residential sector than policies targeting other sectors, and most states tend to have around half the number of policies targeting the residential sector when compared to the number of policies geared toward
FIGURE 5 | States with highest number of alternative fuel and AFV policies
Califo
rnia
Florid
a
Oklaho
ma
Texa
s
Minn
esota
Oregon
Virgini
a
Indian
a
Illino
is
Was
hingto
n
70
41
35 34 3328 27 27 26
23

12bridging needs. advancing change.
the commercial or public sectors. This could explain why there are no “very strong” positive correlations between certain types of policies and the number of AFVs per capita in each state, since as mentioned above, states that have a higher number of policies applicable to the residential sector are more likely to have more AFVs per capita. This insight has significant implications for how policies can be targeted in the future.
When looking at the total number of policies that each state has by alternative fuel type, there isn’t a large difference between fuels. Many state policies are targeted toward alternative fuel in general, meaning that the policy applies to multiple fuels, and policies such as an anti-idling policy often apply to all vehicles, regardless of fuel type. This could explain why there are no standout fuels in terms of number of policies.
GAUGING EFFECTIVENESSBy looking at correlations between certain types of policies and the number of AFVs per capita in each
state, it starts to become more clear which policies may encourage adoption of AFVs better than others. Financial incentives (grant/rebate policies, tax credits, discounts, and exceptions) likely have the most measurable impact on the adoption and use of AFVs and alternative fuels. Specifically, there are three types of policies that tend to correlate with more AFVs per capita: a grant or rebate program for the purchase of AFVs; a policy discounting the use of fuel; and policies tagged as “exception”, such as a tax or fee exemption.
It is often difficult for residential or small commercial consumers to see a financial payback from AFVs, which makes grant or rebate mechanisms particularly appealing to consumers because they reduce the upfront cost of vehicles and fueling infrastructure. Although simply having state grant
TABLE 1 | Total state policies by fuel type
Bio E85 FC CNG LNG LPG EV PHEV
413 364 251 372 305 306 401 330
TABLE 2 | States with most financial incentives
California 33
Indiana 19
Virginia 17
Illinois 16
Texas 13
Georgia 11
Oklahoma 11
Washington 11
TABLE 3 | Total state policies by mechanism
Grant + Rebate Loan Tax
Credit Discount Tax + Fee Exception Procedural Mandate
127 25 88 34 56 118 461 74

13bridging needs. advancing change.
or rebate incentives only shows a weak positive correlation to the number of AFVs per capita, the relationship gets stronger when grant or rebate policies specifically target the purchase and/or use of AFVs, as opposed to, for example, fuel production.
One interesting exception to the benefit of financial incentives identified is the tax credit mechanism. Tax credit policies show a very weak, or in some cases negative, correlation with AFVs or AFV fueling infrastructure per capita, which suggests that they are minimally effective. This could be due to the many state tax credit policies for fuel production, but relatively few for the purchase of AFVs or AFV infrastructure. Despite this lack of a clear relationship, there is plenty of evidence that shows that tax credits are an effective way of promoting the adoption of AFVs. In fact, the Congressional Budget Office (CBO) notes that tax credits have the most significant impact on vehicle ownership.9 The federal government’s own Qualified Plug-In Electric Drive Motor Vehicle Tax Credit offers up to a $7,500
tax credit for the purchase of an EV. The credit applies to all qualified EVs acquired since 2010 and varies based on the size of the vehicles’ battery. Once each manufacturer sells more than 200,000 EVs in the U.S., the credit will begin to be phased out for that particular manufacturer. The CBO estimates that the tax credit is currently responsible for 30 percent of the EVs sold.10
States that have laws and incentives offered by local government or utilities are more likely to have a higher number of AFVs per capita. Specifically, local laws and incentives tagged as “grant / rebate” and “purchase” have a higher correlation to AFV per capita. This is likely because local and utility policies have a tendency to be more targeted and purposeful than state policies, and are more likely to be beneficial in promoting the use of AFVs and alternative fuels. The vast majority of utility policy is related to discounts and incentives for EV charging and infrastructure (EVSE), and to a lesser extent, the purchase of natural gas for AFVs. Unsurprisingly, states with policies tagged as “Discount” have
TABLE 4 | States with tax credit purchase policies and the alternative fuels eligible
Colorado CNG, EV, HEV, LPG, PHEV
Georgia EV, FC, LPG, NGV coal derived liquid fuel, fuel other than alcohol derived from biological materials
Indiana NGV
Kansas Vehicles that operate on a combustible liquid derived from grain starch, oil seed, animal fat, or other biomass, or produced from a biogas source
Louisiana EV, LPG, NGV, non-ethanol based advanced biofuel (excludes flexible fuel vehicles)
Maryland EV
Oklahoma CNG, LNG, LPG
South Carolina HEV
Utah CNG
West Virginia CNG, LNG, LPG

14bridging needs. advancing change.
more AFVs per capita, because the most common discount policy is a utility incentive for reduced EV charging rates. Other (less common) types of discounts include reduced registration fees, and reduced toll rates.
When comparing the total number of policies in each state for each type of alternative fuel, EV
policies have the highest correlation with the number of AFVs per capita. This suggests that states with more EV policies are more likely to have relatively more AFVs per capita. This is likely because the vast majority of states have more EVs by percentage than any other type of AFV. There could be a number of possible explanations for this. First, EVs are more accessible to the average consumer.
FIGURE 6 | States with the highest number of EVs per 10,000 individuals
California
Hawaii
Washington
Vermont
Oregon
Massachusetts
Maine
West Virginia
New Hampshire
Maryland
14.5
13.9
8.3
8.2
7.9
7.5
6.2
6.0
5.9
5.9
FIGURE 7 | Most EVSE per 10,000 individuals FIGURE 8 | Most EVSE per 10 EVs
Hawaii
Oregon
Connecticut
D.C.
Washington
Rhode Island
Tennessee
California
Vermont
Arizona
D.C.
South Carolina
Rhode Island
Wisconsin
Texas
Mississippi
Arizona
Kansas
Oregon
Tennessee
1.33
1.05
0.94
0.75
0.59
0.58
0.55
0.53
0.45
0.45
2.06
1.68
1.53
1.45
1.41
1.39
1.39
1.34
1.33
1.32

15bridging needs. advancing change.
Fueling infrastructure is relatively cheap for EVs compared to the cost for other alternative fuels. For example, a level II EV charging system can be purchased for around $2,500, whereas a residential natural gas compressor costs roughly $15,000 (with commercial-scale systems running into the millions of dollars). This creates a “chicken or the egg” scenario for other liquid and gaseous alternative fuels—there is little infrastructure due to the lack of demand, but there can be no demand for these AFVs without the infrastructure in place to support them. This problem does not exist at the same level for EVs, since infrastructure can be installed fairly cheaply and almost anywhere. Another possible explanation for why EVs are significantly more popular than other types of AFVs is that there are far
more light-duty original equipment manufacturer (OEM) EV models available compared to vehicles that run on CNG or LPG. According to data from Navigant research, 99 percent of EVs on the road today are light-duty vehicles, compared to 69 percent of NGVs and 54 percent propane vehicles.
There is a weak negative correlation between states that have instituted “counter-incentives”, such as additional fees or taxes that could potentially inhibit the adoption of alternative fuels and AFVs, and the number of AFVs per capita. This indicates that counter-incentives may have a slight negative impact on AFV adoption. Most of the states with numerous tax or fee policies are ranked at the bottom in terms of AFV per capita.
TABLE 5 | States with multiple tax/fee policies related to alternative fuels
State # Policies AFV per capita ranking
South Dakota 6 45
Florida 4 35
Indiana 3 34
Washington 3 8
Arizona 2 15
Arkansas 2 37
Georgia 2 16
Idaho 2 39
Nebraska 2 42

16bridging needs. advancing change.
This research provides a valuable starting point for states thinking about supporting alternative fuel and AFVs. The ability to see which states have implemented various types of policies and gain a better understanding of how certain policies have worked for other states is a beneficial tool for policymakers. Legislators curious about policy options for supporting alternative fuels will now have a better understanding of what is being done in other states. We urge these individuals to use this research as a launch point, and to help determine the shape their specific policy might take. For legislators that have a specific mechanism, market segment, or policy in mind, the information presented here will shed light on which states have already adopted similar policies, and hopefully facilitate the exchange of knowledge and best practices.
Going forward, information related to funding level and political support is needed on each policy to better understand the effectiveness of specific policies. A recent report released by the North Carolina Solar Center (NCSC) is a first step in this direction. The report takes an in-depth look at laws and incentives offered in six states (Georgia, Kentucky, North Carolina, South Carolina, Tennessee, and Virginia) to determine the progress, result, and success of policies since implementation. Their research shows, among other things, how popular certain incentives were, or how much funding was used for a particular program. This level of detailed policy analysis is a critical next step for AFV policy research. Rating specific policies based on their effectiveness would be extremely valuable in guiding both how policy is chosen and crafted. This is a challenging next step, however, as some states do not have mechanisms in place to track or evaluate their policies. For example, South Carolina has numerous defunct AFV policies
because there are no reporting mechanisms built into them. There are economic and environmental benefits associated with the adoption of AFVs and alternative fuels, and the means to track those benefits should be included in new policies. While making sure the necessary reporting mechanisms are in place moving forward will make this research easier in the future, any decision on whether or not to pursue this level of detailed analysis in the interim should be aware of the potential challenges before beginning.
As NCSC points out, some of the most effective AFV state policies were “threatened, reversed, or allowed to lapse”, which demonstrates the need to actively track these policies and have data on the benefits of certain state AFV policies and the detriment of their instability. A complete analysis of AFV policy must also include a look at past policy to gauge its impact on the state of AFVs and alternative fuels today. The ability to track the effectiveness (or ineffectiveness) of different types of policy over time would give an accurate view of the ever-changing landscape of AFV incentives.
VIRGINIA’S BIODIESEL PRODUCTION TAX CREDIT POLICY
“The language of this credit specifically excludes many existing state biodiesel producers and small producers from applying. At this time no producer is eligible for the credit, rendering it ineffective as an incentive to produce biodiesel.”
- A Review of Alternative Fuel and Advanced Vehicle Technology Incentives, Policies, & Programs, North
Carolina Solar Center
CONCLUSIONS

17bridging needs. advancing change.
This report was prepared as an account of work sponsored by an agency of the United States Government. Neither the United States Government nor any agency thereof, nor any of their employees, makes any warranty, express or implied, or assumes any legal liability or responsibility for the accuracy, completeness, or usefulness of any information, apparatus, product, or process disclosed, or represents that its use would not infringe privately owned rights. Reference herein to any specific commercial product, process, or service by trade name, trademark, manufacturer, or otherwise does not necessarily constitute or imply its endorsement, recommendation, or favoring by the United States Government or any agency thereof. The views and opinions of authors expressed herein do not necessarily state or reflect those of the United States Government or any agency thereof.
Document prepared by:
Project funded by:
FOR MORE INFORMATIONFor additional information on this report, the research contained herein, or on alternative fuel policy in the U.S., please contact the report’s principal authors:
ALLISON [email protected](734) 585-5720 x16
JOSHUA [email protected]
(734) 585-5720 x25

18bridging needs. advancing change.
SOURCES
1 Navigant Research. Sales of Electric and Alternative Fuel Vehicles Will Reach Nearly 12.4 Million Annually by 2022. http://www.navigantresearch.com/newsroom/sales-of-electric-and-alternative-fuel-vehicles-will-reach-nearly-12-4-million-annually-by-2022
2 NRDC, NWF, UAW. Supplying Ingenuity: U.S. Suppliers of Clean, Fuel-Efficient Vehicle Technologies. http://www.nrdc.org/transportation/autosuppliers/files/SupplierMappingReport.pdf
3 U.S. Environmental Protection Agency. Sources of Greenhouse Gas Emissions. http://www.epa.gov/climatechange/ghgemissions/sources/transportation.html
4 Alternative Fuels Data Center. Flexible Fuel Vehicles. http://www.afdc.energy.gov/vehicles/flexible_fuel.html
5 U.S. Department of Transportation - Federal Highway Administration - Office of Highway Policy Information. Highway Finance Data Collection: Our Nation’s Highways 2011. https://www.fhwa.dot.gov/policyinformation/pubs/hf/pl11028/chapter3.cfm
6 Gallup. Alabama, North Dakota, Wyoming Most Conservative States. http://www.gallup.com/poll/160196/alabama-north-dakota-wyoming-conservative-states.aspx
7 Gallup. Not as Many U.S. States Lean Democratic in 2013. http://www.gallup.com/poll/167030/not-states-lean-democratic-2013.aspx
8 Statescape Policy Tracking and Analysis. Legislative Control 2014. https://www.statescape.com/resources/partysplits/partysplits.aspx
9 + 10 U.S. Congressional Budget Office. Effects of Federal Tax Credits for the Purchase of Electric Vehicles. http://www.cbo.gov/sites/default/files/cbofiles/attachments/09-20-12-ElectricVehicles_0.pdf
11 Kwan, Ling, Dorcas. How Good are the Carrots? The Impact of Incentives for Alternative Fuel Vehicles on Households’ Vehicle Ownership Choice and Usage in the United States. http://hub.hku.hk/bitstream/10722/195104/1/FullText.pdf?accept=1
12 + 13 North Carolina Solar Center. A Review of Alternative Fuel and Advanced Vehicle Technology Incentives, Policies, & Programs in Georgia, Kentucky, North Carolina, South Carolina, Tennessee, and Virginia. http://ncsc.ncsu.edu/wp-content/uploads/AFV-Incentives-Review-GA-KY-NC-SC-TN-VA.pdf